
Development and Internal Validation of Fatty Liver Prediction Models in Obese Children and Adolescents

 , , ,
, , , 
Abstract
1. Introduction
2. Subjects and Methods
2.1. Source of Data
2.2. Participants
2.3. Outcome
2.4. Predictors
2.5. Sample Size
2.6. Missing Data
2.7. Statistical Analysis
3. Results
3.1. Study Population
3.2. Selection of Predictors for Multivariable Modeling
3.3. Multivariable Modeling Strategy
3.4. Multivariable Models
4. Discussion
5. Conclusions
Author Contributions
Funding
Institutional Review Board Statement
Informed Consent Statement
Data Availability Statement
Conflicts of Interest
Appendix A. Transparent Reporting of a Multivariable Prediction Model for Individual Prognosis or Diagnosis (TRIPOD) Guidelines

| Title | 1 | Identify the study as developing and/or validating a multivariable prediction model, the target population, and the outcome to be predicted. | P2 |
| Abstract | 2 | Provide a summary of objectives, study design, setting, participants, sample size, predictors, outcome, statistical analysis, results, and conclusions. | P2 |
| Background and objectives | 3a | Explain the medical context (including whether diagnostic or prognostic) and rationale for developing or validating the multivariable prediction model, including references to existing models. | P2 |
| 3b | Specify the objectives, including whether the study describes the development or validation of the model or both. | P3 | |
| Source of data | 4a | Describe the study design or source of data (e.g., randomized trial, cohort, or registry data), separately for the development and validation data sets, if applicable. | P3 |
| 4b | Specify the key study dates, including start of accrual; end of accrual; and, if applicable, end of follow-up. | P3 | |
| Participants | 5a | Specify key elements of the study setting (e.g., primary care, secondary care, general population) including number and location of centers. | P3 |
| 5b | Describe eligibility criteria for participants. | P2 | |
| 5c | Give details of treatments received, if relevant (No treatment was administered) | NA | |
| Outcome | 6a | Clearly define the outcome that is predicted by the prediction model, including how and when assessed | P3 |
| 6b | Report any actions to blind assessment of the outcome to be predicted. (The prediction models were developed retrospectively). | NA | |
| Predictors | 7a | Clearly define all predictors used in developing or validating the multivariable prediction model, including how and when they were measured. | P3 |
| 7b | Report any actions to blind assessment of predictors for the outcome and other predictors. (The prediction models were developed retrospectively). | NA | |
| Sample size | 8 | Explain how the study size was arrived at. | P3 |
| Missing data | 9 | Describe how missing data were handled (e.g., complete-case analysis, single imputation, multiple imputation) with details of any imputation method. (No missing data). | P4 |
| Statistical analysis methods | 10a | Describe how predictors were handled in the analyses. | P4 |
| 10b | Specify type of model, all model-building procedures (including any predictor selection), and method for internal validation. | P4 | |
| 10c | For validation, describe how the predictions were calculated. (Validation was internal). | P4 | |
| 10d | Specify all measures used to assess model performance and, if relevant, to compare multiple models. | P4 | |
| 10e | Describe any model updating (e.g., recalibration) arising from the validation, if done. (Internal calibration only). | P4 | |
| Risk groups | 11 | Provide details on how risk groups were created, if done. (Internal calibration only). | P4 |
| Development vs. validation | 12 | For validation, identify any differences from the development data in setting, eligibility criteria, outcome, and predictors. (No external validation). | NA |
| Participants | 13a | Describe the flow of participants through the study, including the number of participants with and without the outcome and, if applicable, a summary of the follow-up time. A diagram may be helpful. | P4 |
| 13b | Describe the characteristics of the participants (basic demographics, clinical features, available predictors), including the number of participants with missing data for predictors and outcome. | P4 | |
| 13c | For validation, show a comparison with the development data of the distribution of important variables (demographics, predictors and outcome). (No external validation) | NA | |
| Model development | 14a | Specify the number of participants and outcome events in each analysis. | P4 |
| 14b | If done, report the unadjusted association between each candidate predictor and outcome. (We directly developed a multivariable model using bootstrap selection of predictors). | NA | |
| Model specification | 15a | Present the full prediction model to allow predictions for individuals (i.e., all regression coefficients, and model intercept or baseline survival at a given time point). | P8 |
| 15b | Explain how to use the prediction model. | App. A | |
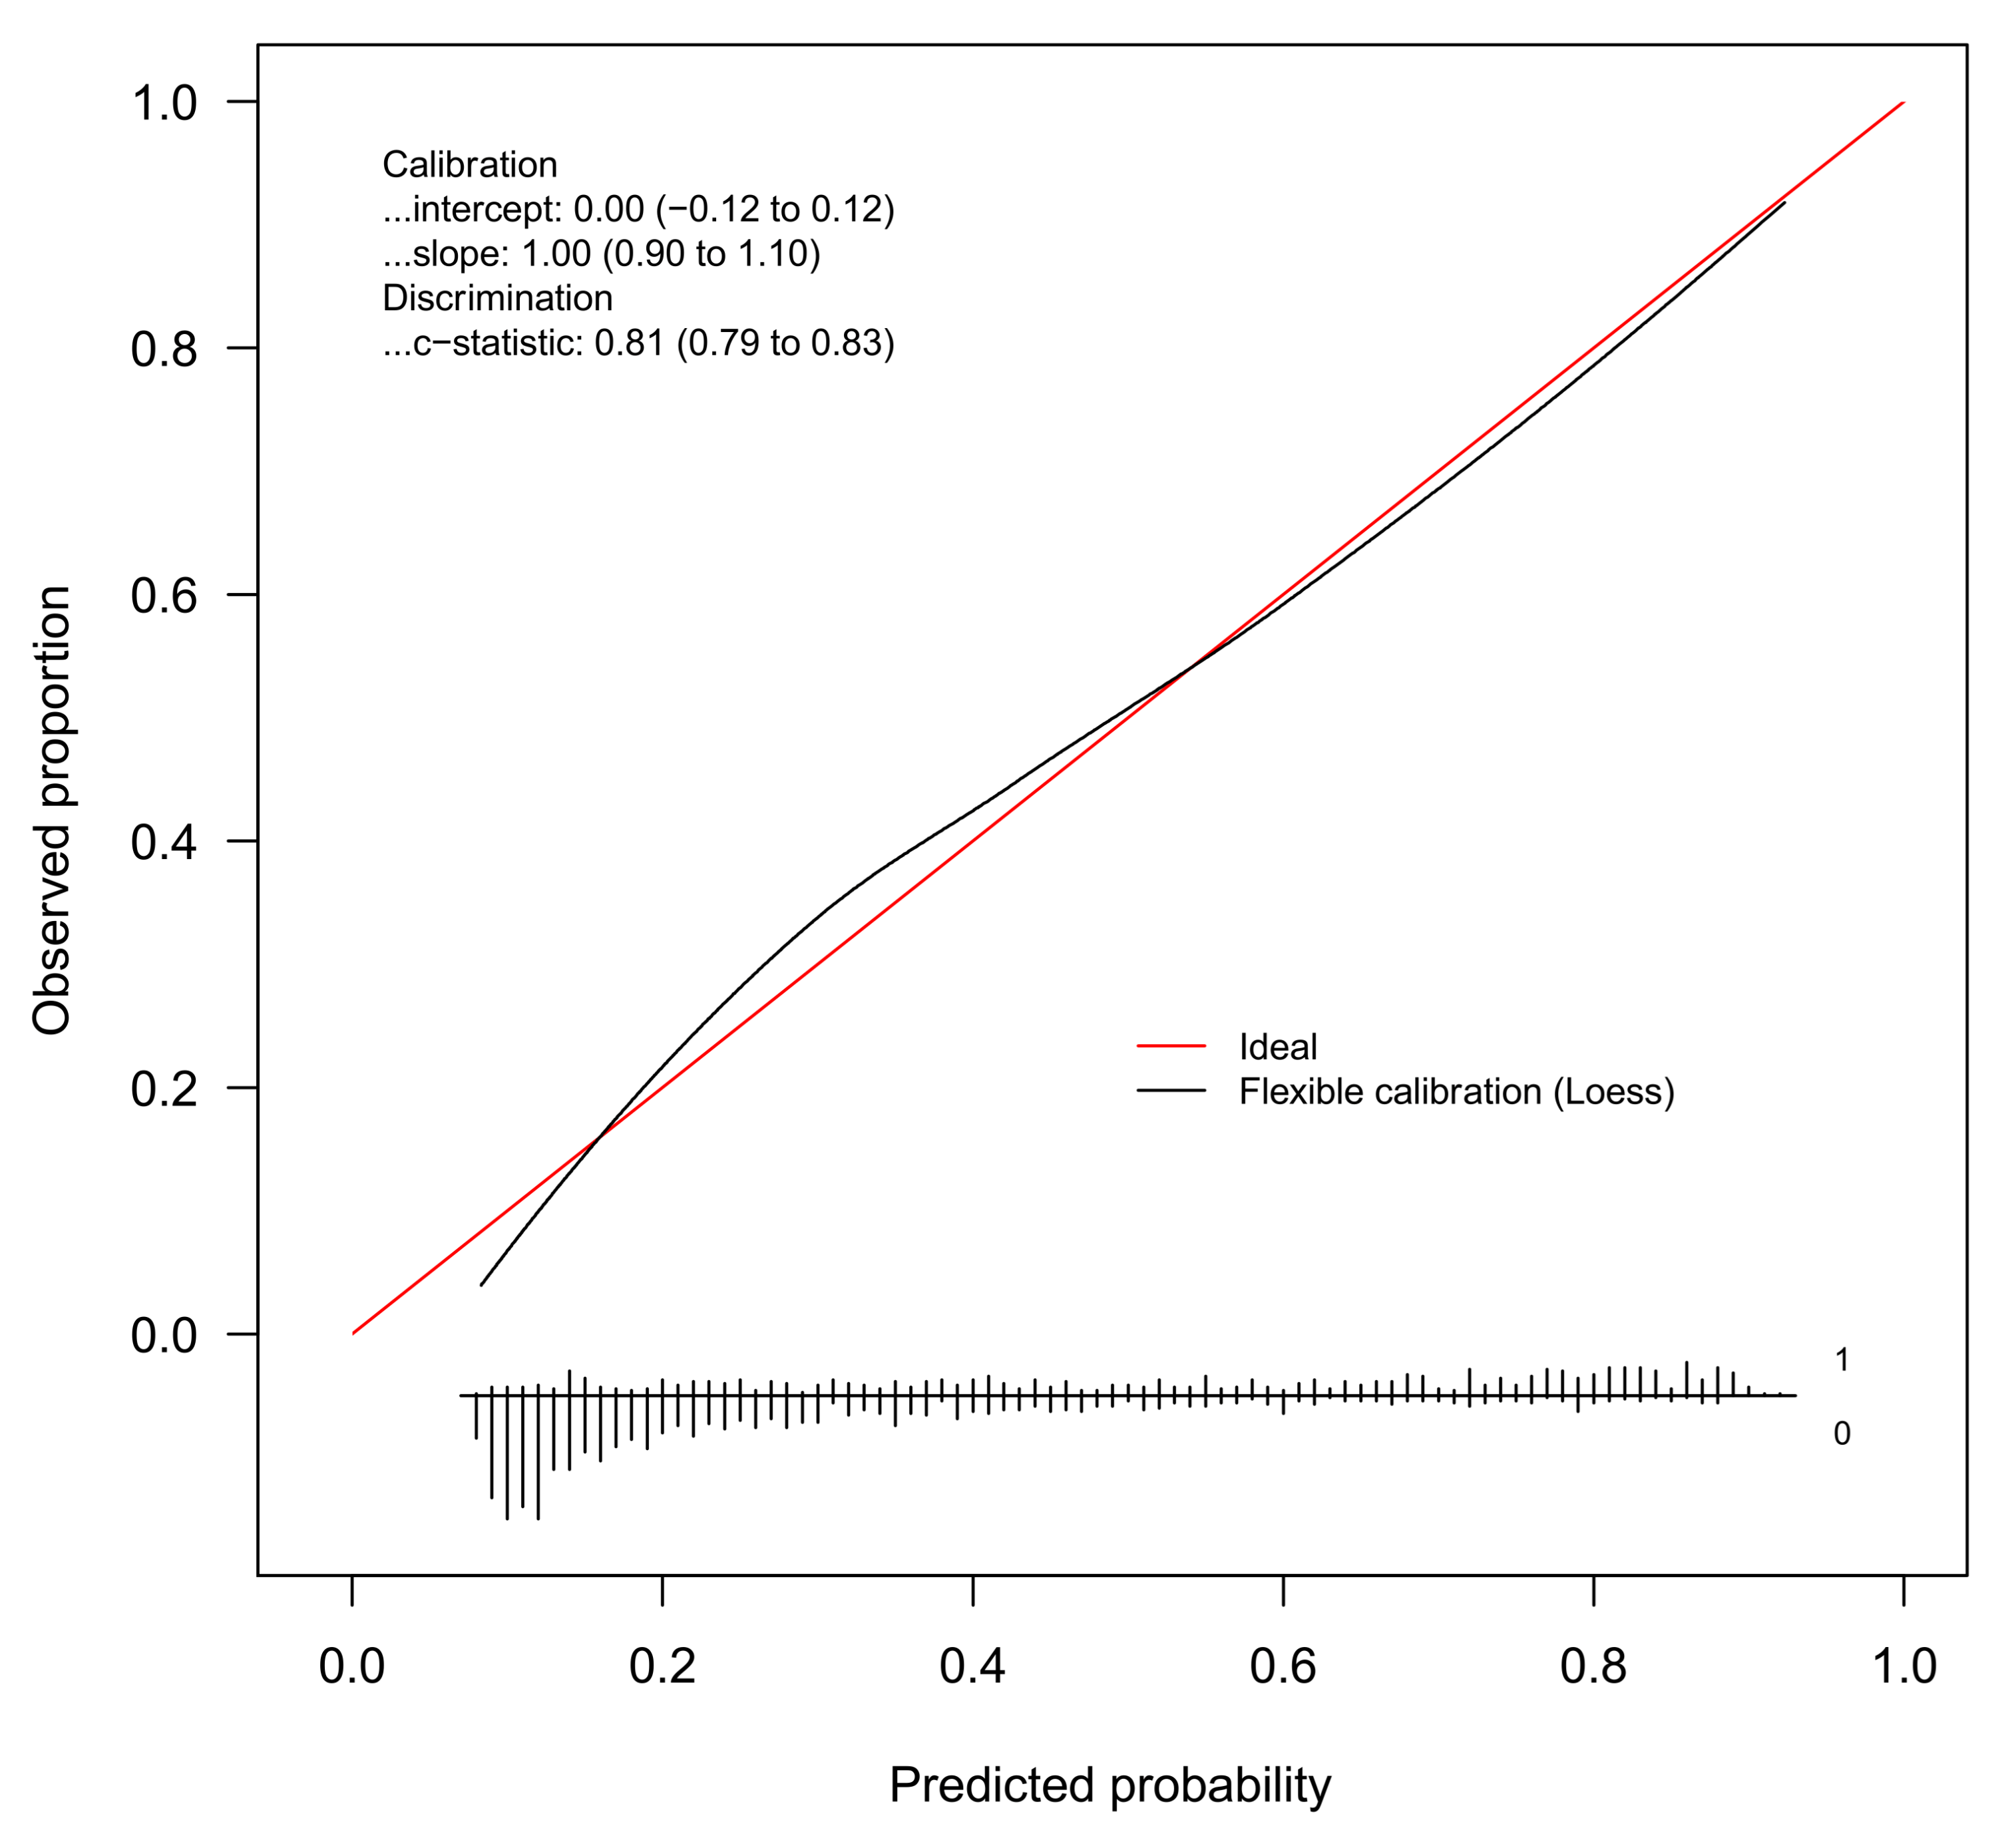
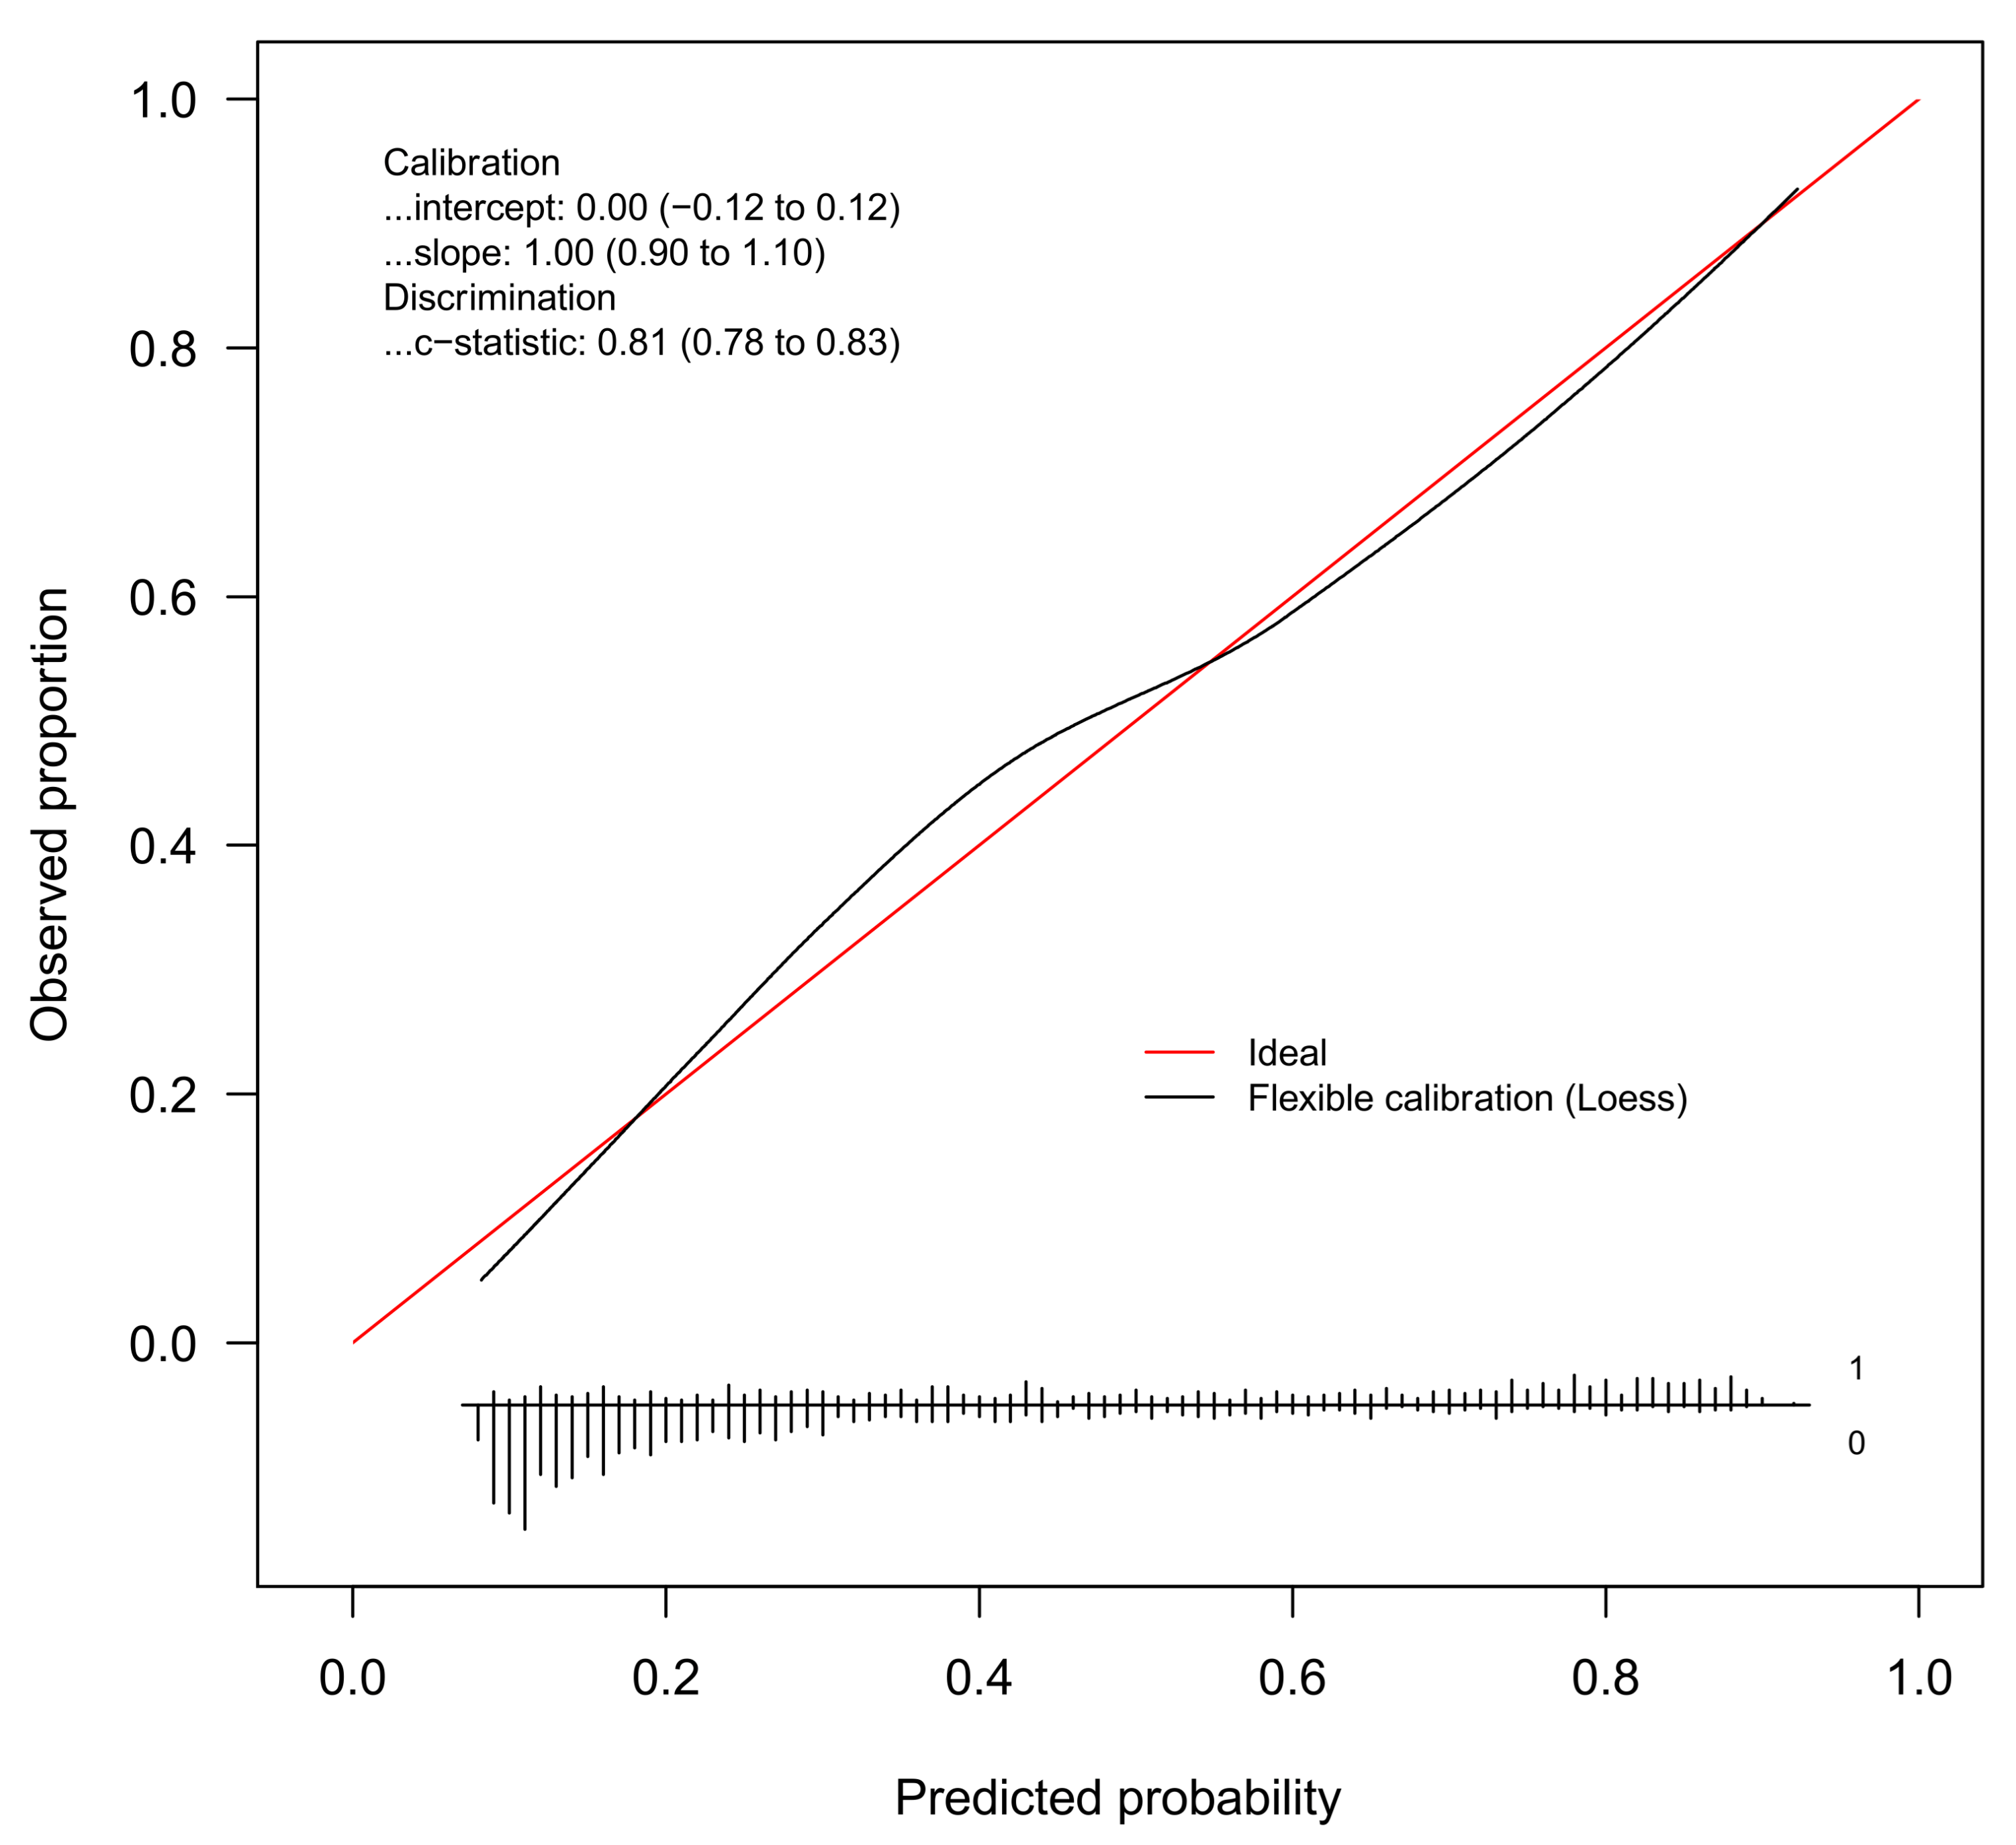
| Model performance | 16 | Report performance measures (with CIs) for the prediction model. | P8,9,10 |
| Model-updating | 17 | If done, report the results from any model updating (i.e., model specification, model performance). (No updating was performed) | NA |
| Limitations | 18 | Discuss any limitations of the study (such as nonrepresentative sample, few events per predictor, missing data). | P10 |
| Interpretation | 19a | For validation, discuss the results with reference to performance in the development data, and any other validation data. (External validation not performed) | NA |
| 19b | Give an overall interpretation of the results, considering objectives, limitations, results from similar studies, and other relevant evidence. | P10 | |
| Implications | 20 | Discuss the potential clinical use of the model and implications for future research. | P10 |
| Supplementary information | 21 | Provide information about the availability of supplementary resources, such as study protocol, Web calculator, and data sets. | App. B |
| Funding | 22 | Give the source of funding and the role of the funders for the present study. | P12 |
Appendix B
| B1. Calculation of the linear predictor for the BMI model | LP = −0.137*age + 0.063*bmi + 0.036*alt_1 − 0.767*alt_2 + 3.583*homa_1 − 2.634*homa_2 + 0.004*tg + 0.172*ur − 0.533 |
| B2. Calculation of the linear predictor for the WC model | LP = −0.132*age + 0.022*wc + 0.034*alt_1 − 0.728*alt_2 + 3.848*homa_1 − 2.662*homa_2 + 0.004*tg + 0.171*ur − 0.925 |
| B3. Calculation of the probability of fatty liver from the linear predictor | Probability = eLP/1 + eLP |
| where: | age = Age (years) bmi = Body mass index (kg/m2) alt_1 = [ALT (U/l)/100]−2 alt_2 = [ALT (U/l)/100]−1 homa_1 = [HOMA-IR (dimensionless)/10] homa_2 = [HOMA-IR (dimensionless)/10]2 tg = Triglycerides (mg/dL) ur = Uric acid (mg/dL) wc = Waist circumference (cm) |
References
- Younossi, Z.M.; Koenig, A.B.; Abdelatif, D.; Fazel, Y.; Henry, L.; Wymer, M. Global epidemiology of nonalcoholic fatty liver disease—Meta-analytic assessment of prevalence, incidence, and outcomes. Hepatology 2016, 64, 73–84. [Google Scholar] [CrossRef] [PubMed]
- Anderson, E.L.; Howe, L.D.; Jones, H.E.; Higgins, J.P.; Lawlor, D.A.; Fraser, A. The Prevalence of Non-Alcoholic Fatty Liver Disease in Children and Adolescents: A Systematic Review and Meta-Analysis. PLoS ONE 2015, 10, e0140908. [Google Scholar] [CrossRef]
- Bedogni, G.; Gastaldelli, A.; Foschi, F.G. Fatty liver, cardiometabolic disease and mortality. Curr. Opin. Lipidol. 2019, 31, 27–31. [Google Scholar] [CrossRef]
- Shaunak, M.; Byrne, C.D.; Davis, N.; Afolabi, P.; Faust, S.N.; Davies, J.H. Non-alcoholic fatty liver disease and childhood obesity. Arch. Dis. Child 2021, 106, 3–8. [Google Scholar] [CrossRef]
- Pacifico, L.; Perla, F.M.; Roggini, M.; Andreoli, G.; D’Avanzo, M.; Chiesa, C. A Systematic Review of NAFLD-Associated Extrahepatic Disorders in Youths. J. Clin. Med. 2019, 8. [Google Scholar] [CrossRef] [PubMed]
- Nobili, V.; Alisi, A.; Valenti, L.; Miele, L.; Feldstein, A.E.; Alkhouri, N. NAFLD in children: New genes, new diagnostic modalities and new drugs. Nat. Rev. Gastroenterol. Hepatol. 2019, 16, 517–530. [Google Scholar] [CrossRef] [PubMed]
- Castillo-Leon, E.; Cioffi, C.E.; Vos, M.B. Perspectives on youth-onset nonalcoholic fatty liver disease. Endocrinol. Diabetes Metab. 2020, 3, e00184. [Google Scholar] [CrossRef]
- European Association for the Study of the Liver (EASL); European Association for the Study of Diabetes (EASD); European Association for the Study of Obesity (EASO). EASL–EASD–EASO Clinical Practice Guidelines for the management of non-alcoholic fatty liver disease. J. Hepatol. 2016, 64, 1388–1402. [Google Scholar] [CrossRef]
- Vajro, P.; Lenta, S.; Socha, P.; Dhawan, A.; McKiernan, P.; Baumann, U.; Durmaz, O.; Lacaille, F.; McLin, V.; Nobili, V. Diagnosis of nonalcoholic fatty liver disease in children and adolescents: Position paper of the ESPGHAN Hepatology Committee. J. Pediatr. Gastroenterol. Nutr. 2012, 54, 700–713. [Google Scholar] [CrossRef] [PubMed]
- Foschi, F.G.; Conti, F.; Domenicali, M.; Giacomoni, P.; Borghi, A.; Bevilacqua, V.; Napoli, L.; Berardinelli, D.; Altini, M.; Cucchetti, A.; et al. External Validation of Surrogate Indices of Fatty Liver in the General Population: The Bagnacavallo Study. J. Clin. Med. 2021, 10, 520. [Google Scholar] [CrossRef]
- Sartorio, A.; Del Col, A.; Agosti, F.; Mazzilli, G.; Bellentani, S.; Tiribelli, C.; Bedogni, G. Predictors of non-alcoholic fatty liver disease in obese children. Eur. J. Clin. Nutr. 2007, 61, 877–883. [Google Scholar] [CrossRef] [PubMed]
- Hosseini, S.M.; Mousavi, S.; Poursafa, P.; Kelishadi, R. Risk Score Model for Predicting Sonographic Non-alcoholic Fatty Liver Disease in Children and Adolescents. Iran J. Pediatr. 2011, 21, 181–187. [Google Scholar] [PubMed]
- Eslam, M.; Newsome, P.N.; Anstee, Q.M.; Targher, G.; Gomez, M.R.; Zelber-Sagi, S.; Wong, V.W.-S.; Dufour, J.-F.; Schattenberg, J.; Arrese, M. A new definition for metabolic associated fatty liver disease: An international expert consensus statement. J. Hepatol. 2020. [Google Scholar] [CrossRef]
- Zhou, Y.; Wei, F.; Fan, Y. High serum uric acid and risk of nonalcoholic fatty liver disease: A systematic review and meta-analysis. Clin. Biochem. 2016, 49, 636–642. [Google Scholar] [CrossRef] [PubMed]
- Bedogni, G.; Miglioli, L.; Masutti, F.; Tiribelli, C.; Marchesini, G.; Bellentani, S. Prevalence of and risk factors for nonalcoholic fatty liver disease: The Dionysos nutrition and liver study. Hepatology 2005, 42, 44–52. [Google Scholar] [CrossRef] [PubMed]
- Bedogni, G.; Bellentani, S.; Miglioli, L.; Masutti, F.; Passalacqua, M.; Castiglione, A.; Tiribelli, C. The Fatty Liver Index: A simple and accurate predictor of hepatic steatosis in the general population. BMC Gastroenterol. 2006, 6, 33. [Google Scholar] [CrossRef]
- Wallace, T.M.; Levy, J.C.; Matthews, D.R. Use and abuse of HOMA modeling. Diabetes Care 2004, 27, 1487–1495. [Google Scholar] [CrossRef] [PubMed]
- Bedogni, G.; Mari, A.; De Col, A.; Marazzi, N.; Tiribelli, C.; Manco, M.; Sartorio, A. Nonalcoholic Fatty Liver Is Not Associated with the Relationship between Insulin Secretion and Insulin Sensitivity in Obese Children: Matched Case-Control Study. Child Obes. 2016, 12, 426–431. [Google Scholar] [CrossRef] [PubMed]
- Cacciari, E.; Milani, S.; Balsamo, A.; Spada, E.; Bona, G.; Cavallo, L.; Cerutti, F.; Gargantini, L.; Greggio, N.; Tonini, G.; et al. Italian cross-sectional growth charts for height, weight and BMI (2 to 20 year). J. Endocrinol. Invest. 2006, 29, 581–593. [Google Scholar] [CrossRef]
- Tanner, J. Foetus into Man: Physical Growth from Conception to Maturity; Harvard University Press: Cambridge, UK, 1990. [Google Scholar]
- Lohman, T.G.; Roche, A.F.; Martorell, R. Anthropometric Standardization Reference Manual; Human Kinetics Books: Champaign, IL, USA, 1991. [Google Scholar]
- Zimmet, P.; Alberti, K.G.M.M.; Kaufman, F.; Tajima, N.; Silink, M.; Arslanian, S.; Wong, G.; Bennett, P.; Shaw, J.; Caprio, S. The metabolic syndrome in children and adolescents—An IDF consensus report. Pediatric Diabetes 2007, 8, 299–306. [Google Scholar] [CrossRef] [PubMed]
- Foschi, F.G.; Bedogni, G.; Domenicali, M.; Giacomoni, P.; Dall’Aglio, A.C.; Dazzani, F.; Lanzi, A.; Conti, F.; Savini, S.; Saini, G.; et al. Prevalence of and risk factors for fatty liver in the general population of Northern Italy: The Bagnacavallo Study. BMC Gastroenterol. 2018, 18, 177. [Google Scholar] [CrossRef] [PubMed]
- Vatcheva, K.P.; Lee, M.; McCormick, J.B.; Rahbar, M.H. Multicollinearity in Regression Analyses Conducted in Epidemiologic Studies. Epidemiology 2016, 6. [Google Scholar] [CrossRef]
- Riley, R.D.; Snell, K.I.; Ensor, J.; Burke, D.L.; Harrell, F.E.; Moons, K.G.; Collins, G.S. Minimum sample size for developing a multivariable prediction model: Part II—Binary and time-to-event outcomes. Stat. Med. 2018. [Google Scholar] [CrossRef] [PubMed]
- Riley, R.D.; Ensor, J.; Snell, K.I.E.; Harrell, F.E.; Martin, G.P.; Reitsma, J.B.; Moons, K.G.M.; Collins, G.; van Smeden, M. Calculating the sample size required for developing a clinical prediction model. BMJ 2020, 368, m441. [Google Scholar] [CrossRef]
- Royston, P.; Sauerbrei, W. Multivariable Model-Building: A Pragmatic Approach to Regression Analysis Based on Fractional Polynomials for Modelling Continuous Variables; John Wiley: Chichester, UK, 2008. [Google Scholar]
- Royston, P.; Sauerbrei, W. Bootstrap assessment of the stability of multivariable models. Stata J. 2009, 9, 547–570. [Google Scholar] [CrossRef]
- Sauerbrei, W.; Royston, P.; Binder, H. Selection of important variables and determination of functional form for continuous predictors in multivariable model building. Stat. Med. 2007, 26, 5512–5528. [Google Scholar] [CrossRef]
- Harrell, F. Regression Modeling Strategies; Springer: Cham, Switzerland, 2016. [Google Scholar]
- Van Calster, B.; Nieboer, D.; Vergouwe, Y.; De Cock, B.; Pencina, M.J.; Steyerberg, E.W. A calibration hierarchy for risk models was defined: From utopia to empirical data. J. Clin. Epidemiol. 2016, 74, 167–176. [Google Scholar] [CrossRef] [PubMed]
- Stevens, R.J.; Poppe, K.K. Validation of clinical prediction models: What does the “calibration slope” really measure. J. Clin. Epidemiol. 2019. [Google Scholar] [CrossRef]
- Moons, K.G.; Altman, D.G.; Reitsma, J.B.; Ioannidis, J.P.; Macaskill, P.; Steyerberg, E.W.; Vickers, A.J.; Ransohoff, D.F.; Collins, G.S. Transparent Reporting of a multivariable prediction model for Individual Prognosis or Diagnosis (TRIPOD): Explanation and elaboration. Ann. Intern. Med. 2015, 162, W1–W73. [Google Scholar] [CrossRef]
- Ensor, J. PMSAMPSIZE: Stata Module to Calculate the Minimum Sample Size Required for Developing a Multivariable Prediction Model. Available online: https://ideasrepecorg/c/boc/bocode/s458569html (accessed on 30 March 2021).
- Haghish, E.F. Seamless interactive language interfacing between R and Stata. Stata J. 2019, 19, 61–82. [Google Scholar] [CrossRef]
- Bedogni, G.; Kahn, H.S.; Bellentani, S.; Tiribelli, C. A simple index of lipid overaccumulation is a good marker of liver steatosis. BMC Gastroenterol. 2010, 10, 98. [Google Scholar] [CrossRef] [PubMed]
- Steyerberg, E.W. Clinical Prediction Models; Springer International: Cham, Switzerland, 2019. [Google Scholar]
- Bedogni, G.; Bertoli, S.; De Amicis, R.; Foppiani, A.; De Col, A.; Tringali, G.; Marazzi, N.; De Cosmi, V.; Agostoni, C.; Battezzati, A.; et al. External Validation of Equations to Estimate Resting Energy Expenditure in 2037 Children and Adolescents with and 389 without Obesity: A Cross-Sectional Study. Nutrients 2020, 12, 1421. [Google Scholar] [CrossRef]
- Hernaez, R.; Lazo, M.; Bonekamp, S.; Kamel, I.; Brancati, F.L.; Guallar, E.; Clark, J.M. Diagnostic accuracy and reliability of ultrasonography for the detection of fatty liver: A meta-analysis. Hepatology 2011, 54, 1082–1090. [Google Scholar] [CrossRef]
- Rimini, M.; Casadei-Gardini, A.; Ravaioli, A.; Rovesti, G.; Conti, F.; Borghi, A.; Dall’Aglio, A.C.; Bedogni, G.; Domenicali, M.; Giacomoni, P.; et al. Could Inflammatory Indices and Metabolic Syndrome Predict the Risk of Cancer Development? Analysis from the Bagnacavallo Population Study. J. Clin. Med. 2020, 9, 1177. [Google Scholar] [CrossRef] [PubMed]
- Lin, Y.C.; Chang, P.F.; Liu, K.; Chang, M.H.; Ni, Y.H. Predictors for incidence and remission of nonalcoholic fatty liver disease in obese children and adolescents. J. Formos Med. Assoc. 2021. [Google Scholar] [CrossRef] [PubMed]
- Ma, Z.; Zhang, J.; Kang, X.; Xu, C.; Sun, C.; Tao, L.; Zheng, D.; Han, Y.; Li, Q.; Guo, X.; et al. Hyperuricemia precedes non-alcoholic fatty liver disease with abdominal obesity moderating this unidirectional relationship: Three longitudinal analyses. Atherosclerosis 2020, 311, 44–51. [Google Scholar] [CrossRef]


| Total | Girls | Boys | |
|---|---|---|---|
| n = 1672 | n = 980 | n = 692 | |
| Age (years) | 15 (13–16) | 15 (13–17) | 15 (12–16) |
| Pubertal stage | |||
| Tanner stage 1 (prepubertal) | 194 (11.6%) | 85 (8.7%) | 109 (15.8%) |
| Tanner stage 2 (pubertal) | 144 (8.6%) | 48 (4.9%) | 96 (13.9%) |
| Tanner stage 3 (pubertal) | 213 (12.7%) | 75 (7.7%) | 138 (19.9%) |
| Tanner stage 4 (pubertal) | 373 (22.3%) | 225 (23.0%) | 148 (21.4%) |
| Tanner stage 5 (postpubertal) | 748 (44.7%) | 547 (55.8%) | 201 (29.0%) |
| Weight (kg) | 96 (83–112) | 93 (83–106) | 103 (86–120) |
| Weight (SDS) | 3.01 (2.47–3.57) | 3.07 (2.52–3.64) | 2.91 (2.37–3.43) |
| Height (m) | 1.63 (1.56–1.69) | 1.60 (1.56–1.65) | 1.68 (1.58–1.75) |
| Height (SDS) | 0.33 (−0.30–1.04) | 0.29 (−0.36–1.00) | 0.37 (−0.24–1.09) |
| BMI (kg/m2) | 36 (32–40) | 36 (32–40) | 36 (32–41) |
| BMI (SDS) | 2.92 (2.50–3.32) | 2.91 (2.51–3.28) | 2.92 (2.47–3.39) |
| Waist circumference (cm) | 111 (101–122) | 108 (99–118) | 115 (106–126) |
| Large waist circumference (IDF) | 1646 (98.4%) | 955 (97.4%) | 691 (99.9%) |
| ALT (U/L) | 23 (16–35) | 19 (15–27) | 30 (21–47) |
| AST (U/L) | 21 (17–26) | 19 (16–23) | 24 (20–30) |
| GGT (U/L) | 16 (12–22) | 14 (11–19) | 19 (15–28) |
| Glucose (mg/dl) | 79 (74–83) | 78 (73–82) | 79 (75–84) |
| High glucose (IDF) | 10 (0.6%) | 6 (0.6%) | 4 (0.6%) |
| Insulin (μU/mL) | 13 (9–18) | 12 (8–18) | 13 (9–19) |
| HOMA-IR (dimensionless) | 2.4 (1.6–3.5) | 2.3 (1.6–3.4) | 2.6 (1.7–3.7) |
| Cholesterol (mg/dl) | 162 (142–182) | 162 (142–182) | 163 (142–183) |
| HDL-cholesterol (mg/dL) | 43 (37–51) | 45 (39–53) | 42 (35–48) |
| Low HDL (IDF) | 681 (40.7%) | 397 (40.5%) | 284 (41.0%) |
| LDL-cholesterol (mg/dL) | 102 (85–122) | 101 (83–121) | 104 (87–124) |
| Triglycerides (mg/dL) | 87 (66–114) | 83 (64–110) | 90 (69–122) |
| High triglycerides (IDF) | 163 (9.7%) | 85 (8.7%) | 78 (11.3%) |
| Uric acid (mg/dL) | 6.0 (5.2–6.9) | 5.7 (5.0–6.4) | 6.7 (5.7–7.6) |
| CRP (mg/L) | 0.4 (0.2–0.7) | 0.4 (0.2–0.7) | 0.4 (0.2–0.7) |
| Systolic blood pressure (mm Hg) | 120 (120–130) | 120 (120–130) | 125 (120–130) |
| Diastolic blood pressure (mm Hg) | 80 (70–80) | 80 (70–80) | 80 (70–80) |
| High blood pressure (IDF) | 687 (41.1%) | 334 (34.1%) | 353 (51.0%) |
| Mean arterial pressure | 93 (87–97) | 93 (87–97) | 93 (90–97) |
| Fatty liver | 642 (38.4%) | 278 (28.4%) | 364 (52.6%) |
| Fatty liver degree | |||
| None | 1030 (61.6%) | 702 (71.6%) | 328 (47.4%) |
| Mild | 250 (15.0%) | 133 (13.6%) | 117 (16.9%) |
| Moderate | 300 (17.9%) | 119 (12.1%) | 181 (26.2%) |
| Severe | 92 (5.5%) | 26 (2.7%) | 66 (9.5%) |
| Metabolic syndrome (IDF) | 395 (23.6%) | 193 (19.7%) | 202 (29.2%) |
| FL | MALE | AGE | PUB | BMI | WC | ALT | AST | GGT | GLU | INS | HOMA | HDLC | LDLC | TG | MAP | UR | CRP | |
|---|---|---|---|---|---|---|---|---|---|---|---|---|---|---|---|---|---|---|
| fl | 1.00 | |||||||||||||||||
| male | 0.25 | 1.00 | ||||||||||||||||
| age | −0.02 | −0.09 | 1.00 | |||||||||||||||
| pub | −0.10 | −0.30 | 0.82 | 1.00 | ||||||||||||||
| bmi | 0.23 | 0.01 | 0.36 | 0.31 | 1.00 | |||||||||||||
| wc | 0.25 | 0.23 | 0.38 | 0.28 | 0.77 | 1.00 | ||||||||||||
| alt | 0.45 | 0.39 | 0.05 | −0.09 | 0.21 | 0.29 | 1.00 | |||||||||||
| ast | 0.37 | 0.41 | −0.12 | −0.24 | 0.03 | 0.12 | 0.81 | 1.00 | ||||||||||
| ggt | 0.35 | 0.35 | 0.13 | 0.01 | 0.30 | 0.34 | 0.61 | 0.46 | 1.00 | |||||||||
| glu | 0.12 | 0.13 | −0.13 | −0.16 | 0.09 | 0.13 | 0.07 | 0.03 | 0.05 | 1.00 | ||||||||
| ins | 0.29 | 0.05 | 0.03 | 0.03 | 0.40 | 0.37 | 0.27 | 0.13 | 0.34 | 0.14 | 1.00 | |||||||
| homa | 0.30 | 0.07 | 0.01 | 0.01 | 0.41 | 0.38 | 0.27 | 0.13 | 0.34 | 0.29 | 0.98 | 1.00 | ||||||
| hdlc | −0.16 | −0.17 | −0.06 | −0.02 | −0.22 | −0.27 | −0.17 | −0.09 | −0.20 | −0.07 | −0.25 | −0.26 | 1.00 | |||||
| ldlc | 0.11 | 0.06 | −0.03 | −0.05 | 0.07 | 0.08 | 0.16 | 0.15 | 0.27 | 0.04 | 0.10 | 0.10 | −0.05 | 1.00 | ||||
| tg | 0.21 | 0.10 | 0.07 | 0.02 | 0.19 | 0.21 | 0.25 | 0.17 | 0.31 | 0.00 | 0.34 | 0.32 | −0.38 | 0.43 | 1.00 | |||
| map | 0.11 | 0.14 | 0.30 | 0.22 | 0.41 | 0.42 | 0.19 | 0.06 | 0.23 | 0.06 | 0.25 | 0.25 | −0.10 | 0.04 | 0.13 | 1.00 | ||
| ur | 0.29 | 0.36 | 0.13 | 0.05 | 0.37 | 0.42 | 0.37 | 0.28 | 0.38 | 0.09 | 0.28 | 0.29 | −0.26 | 0.09 | 0.25 | 0.26 | 1.00 | |
| crp | 0.10 | −0.02 | 0.04 | 0.00 | 0.34 | 0.22 | 0.02 | −0.04 | 0.16 | 0.04 | 0.14 | 0.14 | −0.10 | 0.04 | 0.00 | 0.09 | 0.09 | 1.00 |
| BMI Model | WC Model | ||||||||
|---|---|---|---|---|---|---|---|---|---|
| BIF-1 | EXP-1 | BIF-2 | EXP-2 | BIF-1 | EXP-1 | BIF-2 | EXP-2 | ||
| male | 41.3 | 1 | 0.0 | — | male | 8.5 | 1 | 0 | — |
| age | 95.4 | 1 | 16.5 | — | age | 91.2 | 1 | 16.4 | — |
| bmi | 98.1 | 1 | 1.4 | — | wc | 89.7 | 1 | 19.0 | — |
| alt | 100.0 | −2 | 89.9 | −1 | alt | 100.0 | −2 | 89.1 | 1 |
| homa | 95.1 | 1 | 51.4 | 2 | homa | 98.6 | 1 | 52.4 | 2 |
| hdlc | 63.0 | 1 | 2.9 | — | hdlc | 76.0 | 1 | 35.0 | — |
| ldlc | 31.1 | 1 | 20.1 | — | ldlc | 26.7 | 1 | 16.1 | — |
| tg | 73.9 | 1 | 19.1 | — | tg | 69.6 | 1 | 18.7 | — |
| map | 36.0 | 1 | 15.4 | — | map | 48.9 | 1 | 36.4 | — |
| ur | 79.0 | 1 | 15.4 | — | ur | 87.4 | 1 | 18.3 | — |
| crp | 40.0 | 1 | 21.0 | — | crp | 62.8 | 1 | 31.4 | — |
| BMI Model | WC Model | |
|---|---|---|
| Age (years) | −0.137 *** [−0.193 to −0.080] | −0.132 *** [−0.189 to 0.075] |
| BMI (kg/m2) | 0.063 *** [0.039 to 0.086] | — |
| [ALT (U/l)/100]−2 | 0.036 *** [0.020 to 0.052] | 0.034 *** [0.018 to 0.049] |
| [ALT (U/l)/100]−1 | −0.767 *** [−0.943 to −0.591] | −0.728 *** [−0.898 to 0.557] |
| [HOMA-IR (dimensionless)/10] | 3.583 *** [1.775 to 5.392] | 3.848 *** [2.015 to 5.681] |
| [HOMA-IR (dimensionless)/10]2 | −2.634 ** [−4.395 to −0.873] | −2.662 ** [−4.490 to 0.834] |
| Triglycerides (mg/dL) | 0.004 * [0.001 to 0.007] | 0.004 * [0.001 to 0.007] |
| Uric acid (mg/dL) | 0.172 *** [0.072 to 0.272] | 0.171 *** [0.070 to 0.271] |
| Waist circumference (cm) | — | 0.022 *** [0.012 to 0.032] |
| Intercept | −0.533 | −0.925 |
| n | 1672 | 1672 |
| AIC | 1746 | 1755 |
| BIC | 1794 | 1804 |
| C-statistic | 0.81 | 0.81 |
| Cox-Snell R2 | 0.26 | 0.25 |
| Nagelkerke R2 | 0.35 | 0.34 |
Publisher’s Note: MDPI stays neutral with regard to jurisdictional claims in published maps and institutional affiliations. |
© 2021 by the authors. Licensee MDPI, Basel, Switzerland. This article is an open access article distributed under the terms and conditions of the Creative Commons Attribution (CC BY) license (https://creativecommons.org/licenses/by/4.0/).
Share and Cite
Bedogni, G.; Tamini, S.; Caroli, D.; Cicolini, S.; Domenicali, M.; Sartorio, A. Development and Internal Validation of Fatty Liver Prediction Models in Obese Children and Adolescents. J. Clin. Med. 2021, 10, 1470. https://doi.org/10.3390/jcm10071470
Bedogni G, Tamini S, Caroli D, Cicolini S, Domenicali M, Sartorio A. Development and Internal Validation of Fatty Liver Prediction Models in Obese Children and Adolescents. Journal of Clinical Medicine. 2021; 10(7):1470. https://doi.org/10.3390/jcm10071470
Chicago/Turabian StyleBedogni, Giorgio, Sofia Tamini, Diana Caroli, Sabrina Cicolini, Marco Domenicali, and Alessandro Sartorio. 2021. "Development and Internal Validation of Fatty Liver Prediction Models in Obese Children and Adolescents" Journal of Clinical Medicine 10, no. 7: 1470. https://doi.org/10.3390/jcm10071470
APA StyleBedogni, G., Tamini, S., Caroli, D., Cicolini, S., Domenicali, M., & Sartorio, A. (2021). Development and Internal Validation of Fatty Liver Prediction Models in Obese Children and Adolescents. Journal of Clinical Medicine, 10(7), 1470. https://doi.org/10.3390/jcm10071470