
Application of Vibrational Spectroscopies in the Qualitative Analysis of Gingival Crevicular Fluid and Periodontal Ligament during Orthodontic Tooth Movement

 ,
, 

 ,
,  ,
,  ,
, 

Abstract
1. Introduction
2. Materials and Methods
2.1. Study Selection
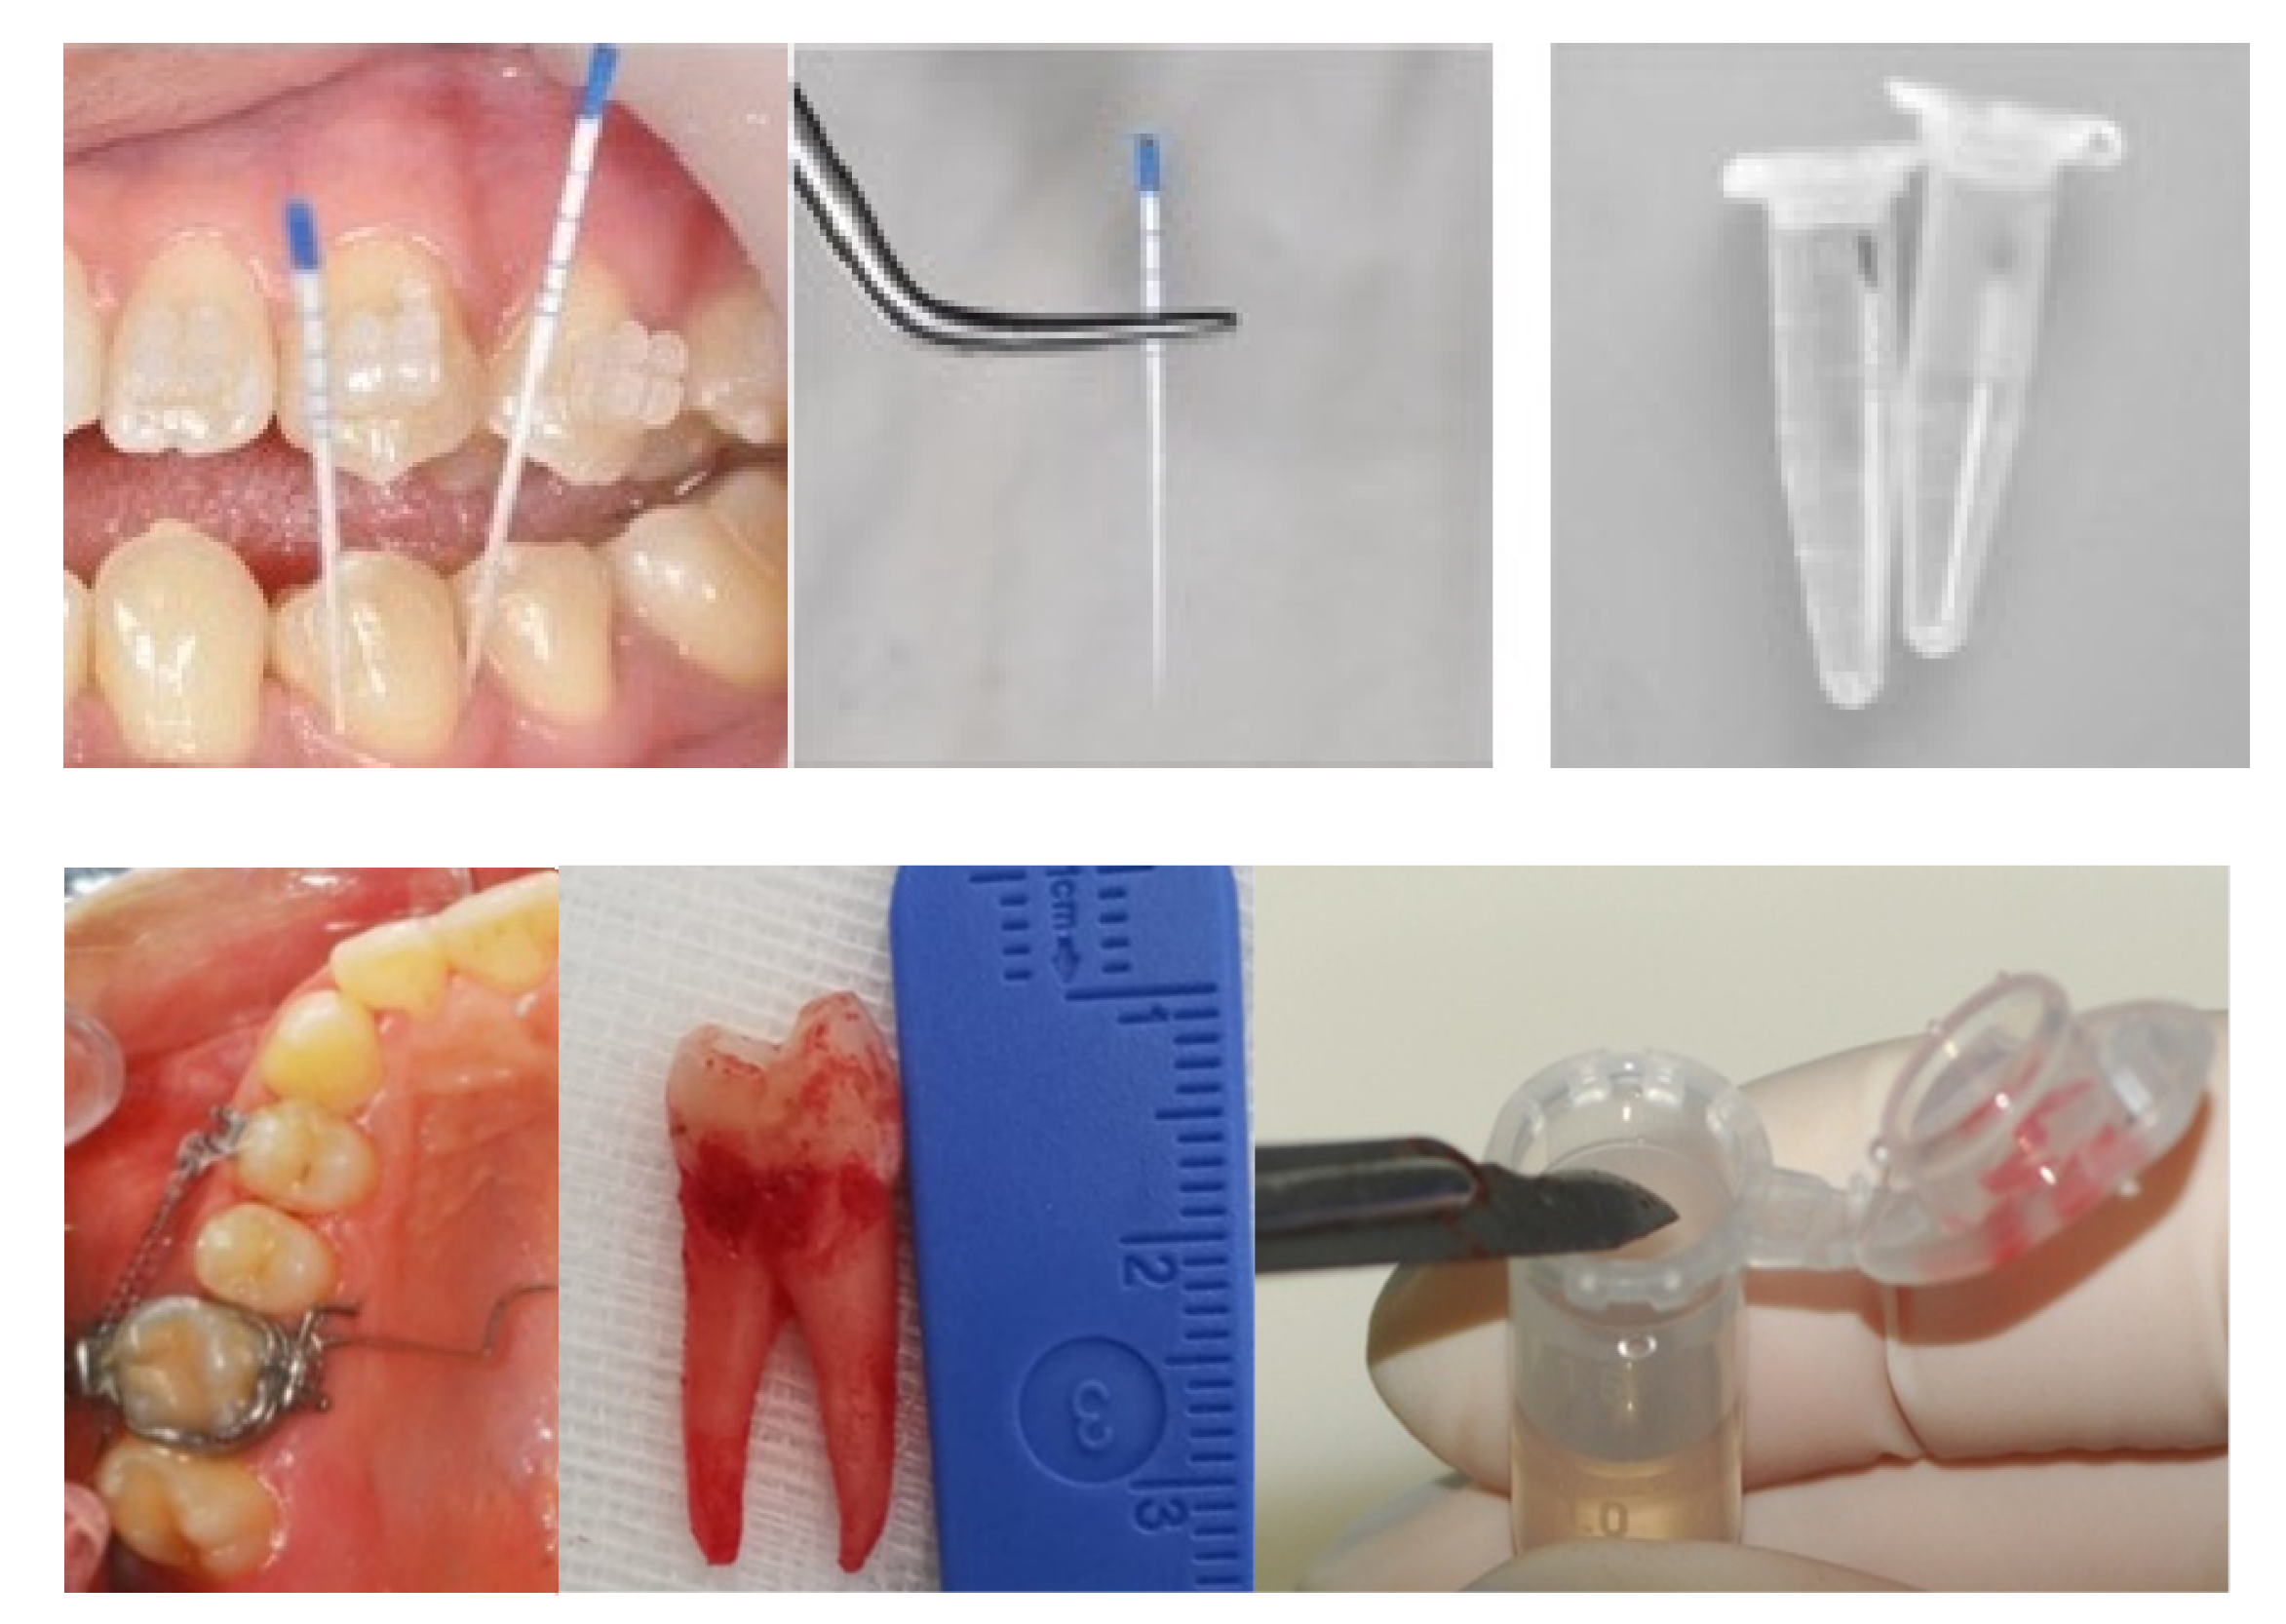
2.2. Sample Selection
2.3. Experimental Techniques
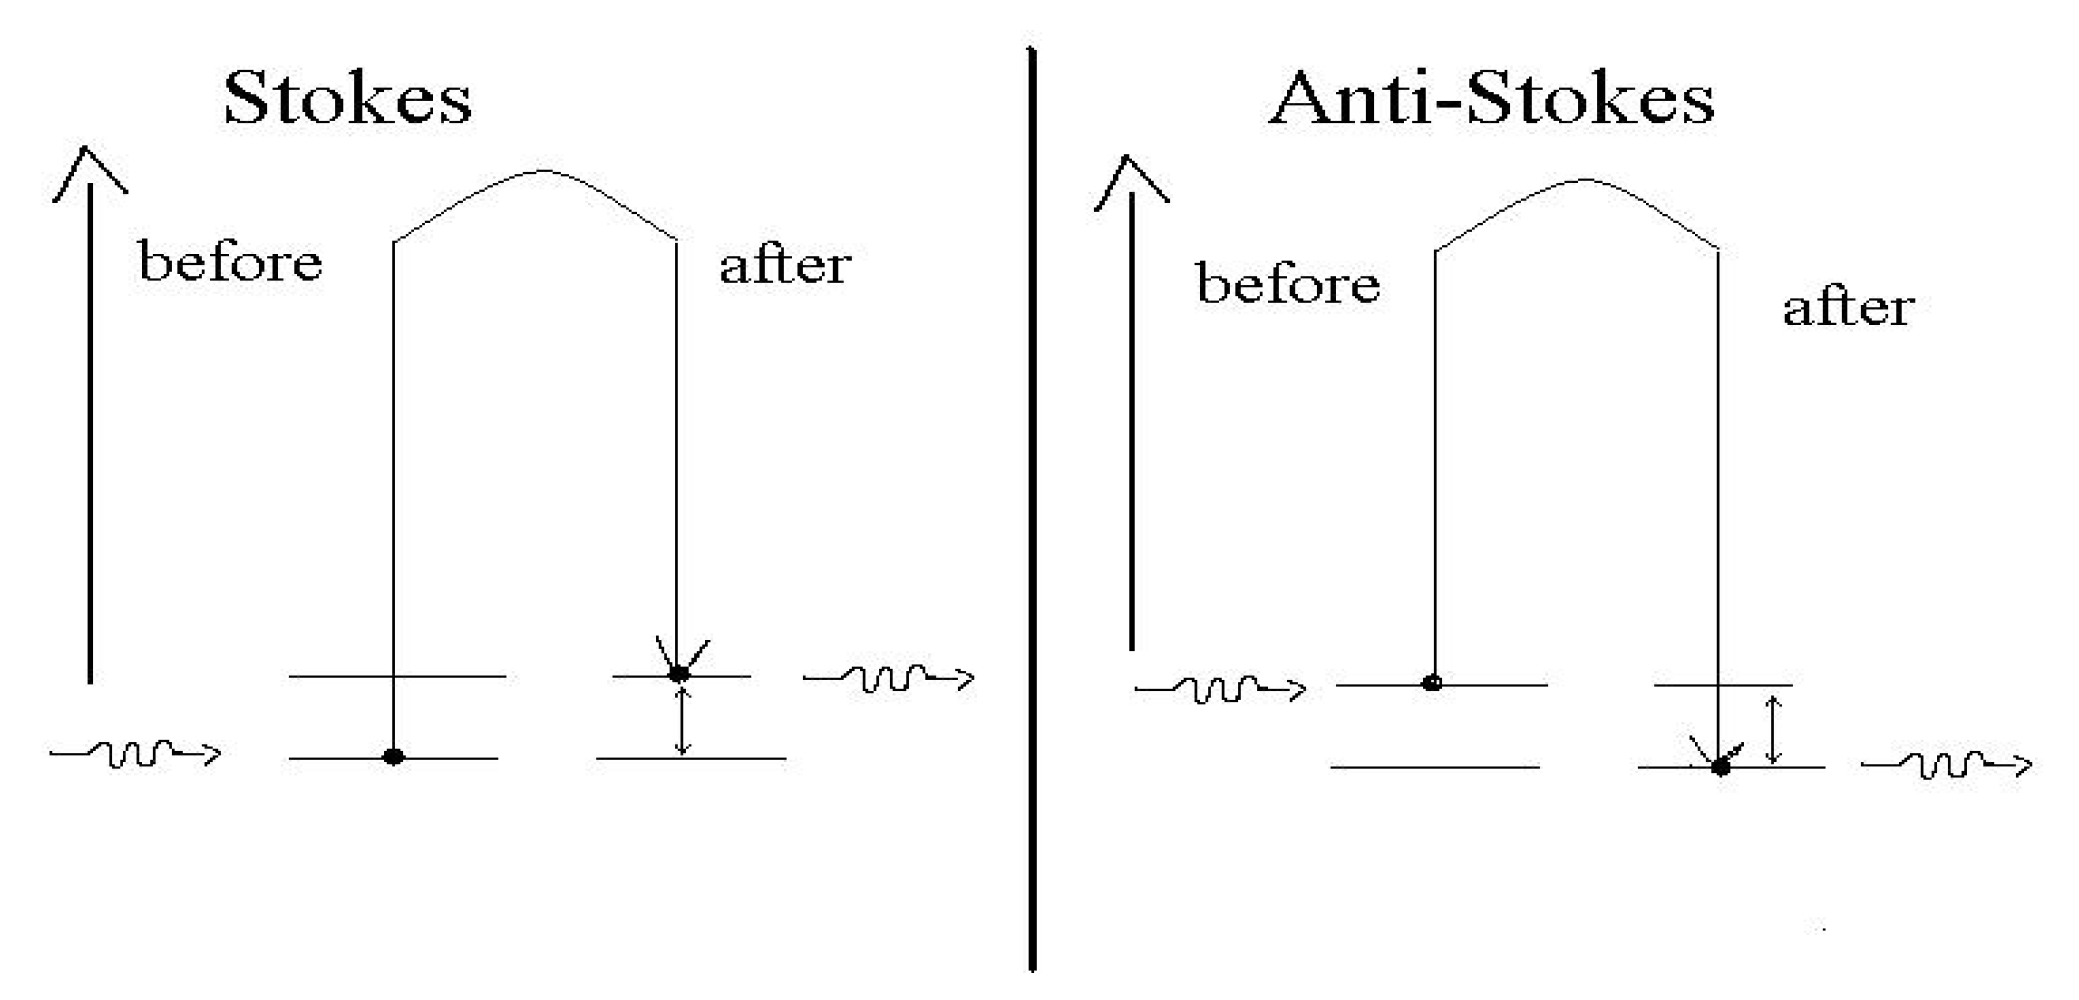
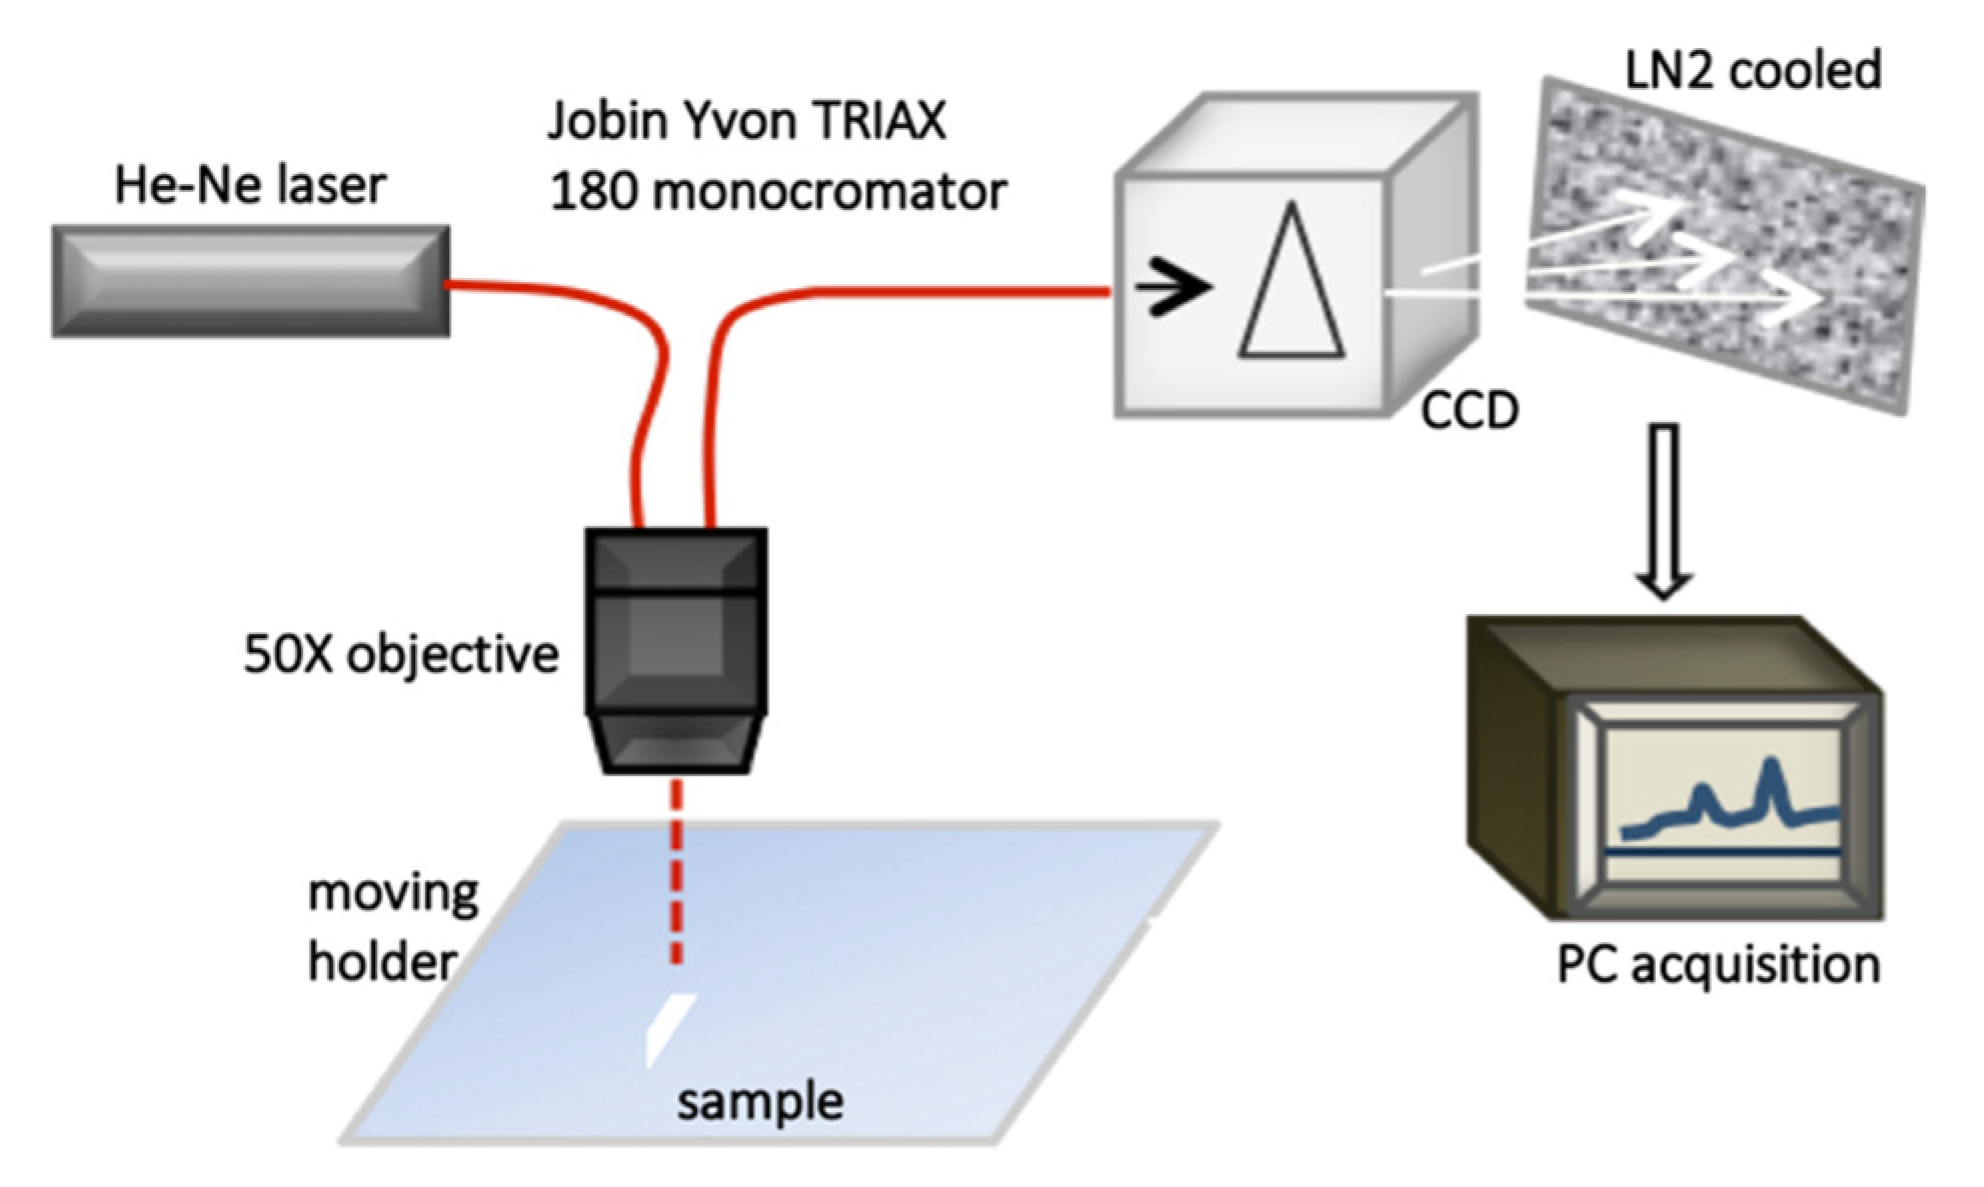
2.3.1. Raman Spectroscopy
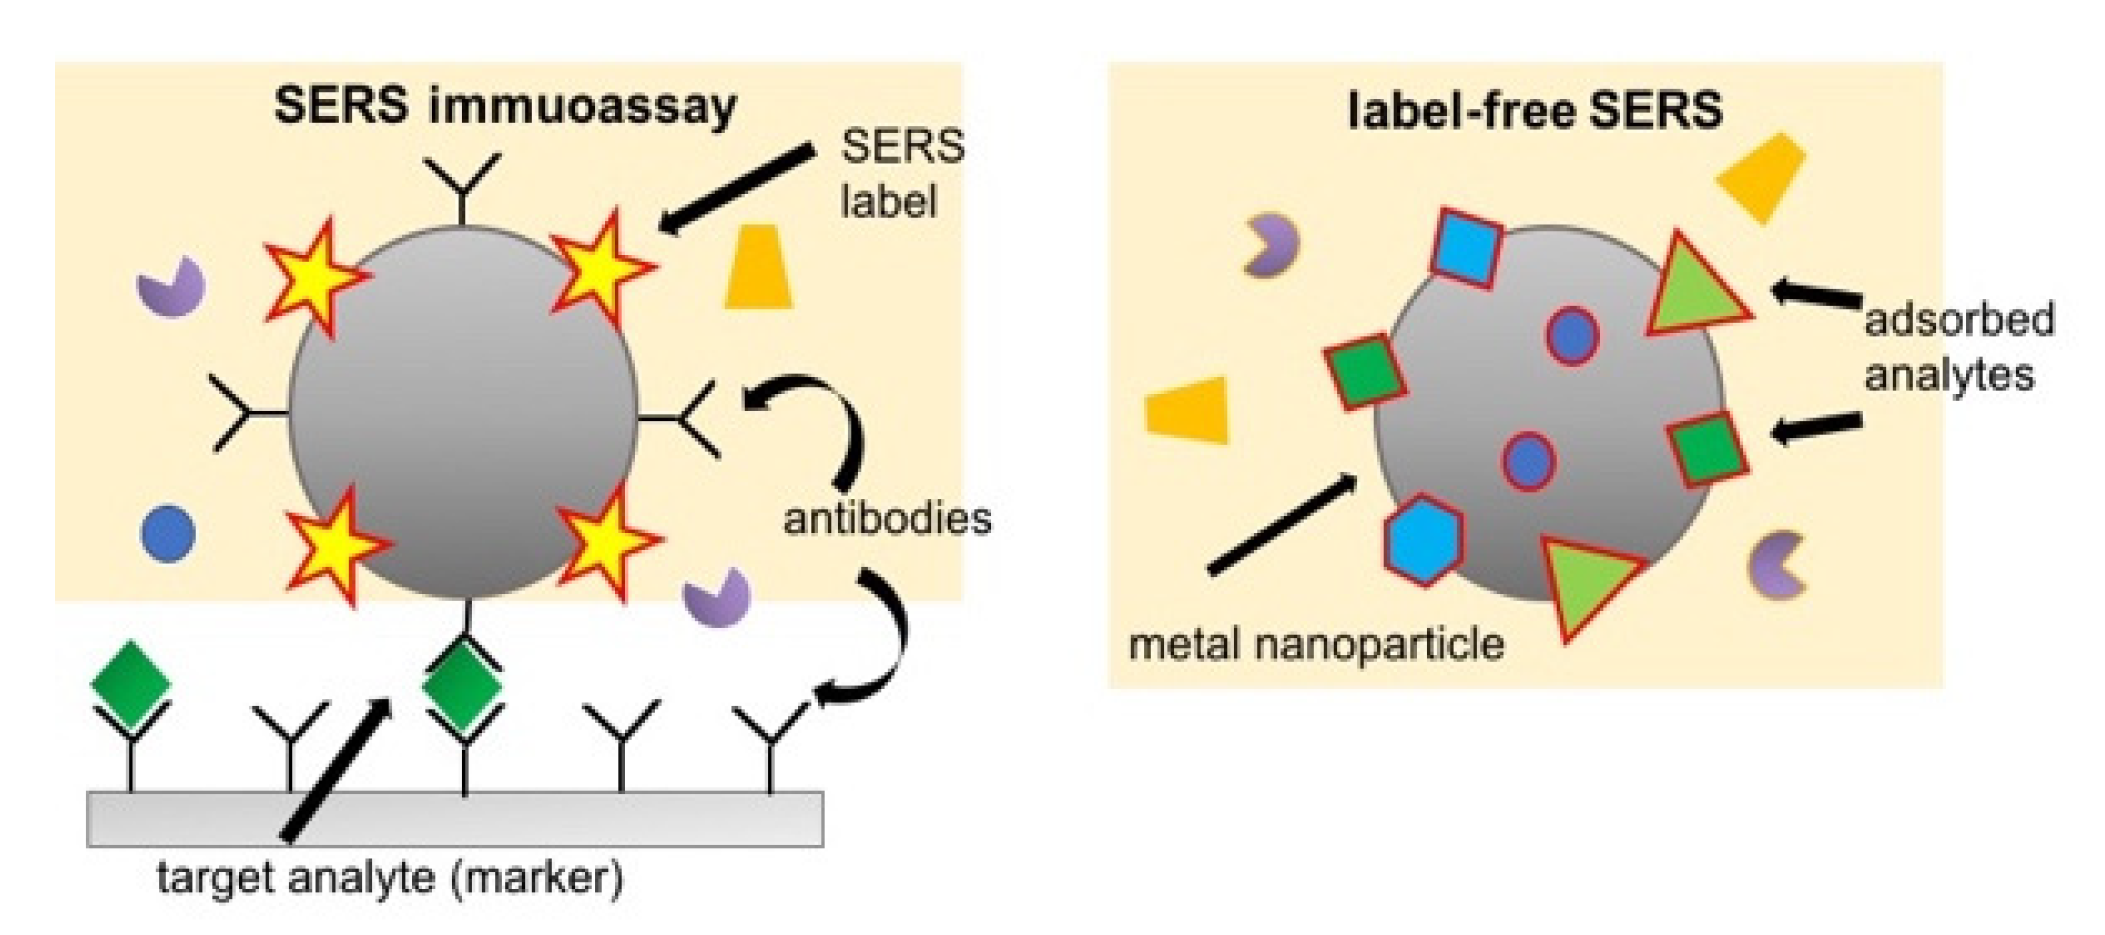
2.3.2. Surface-Enhanced Raman Scattering (SERS)
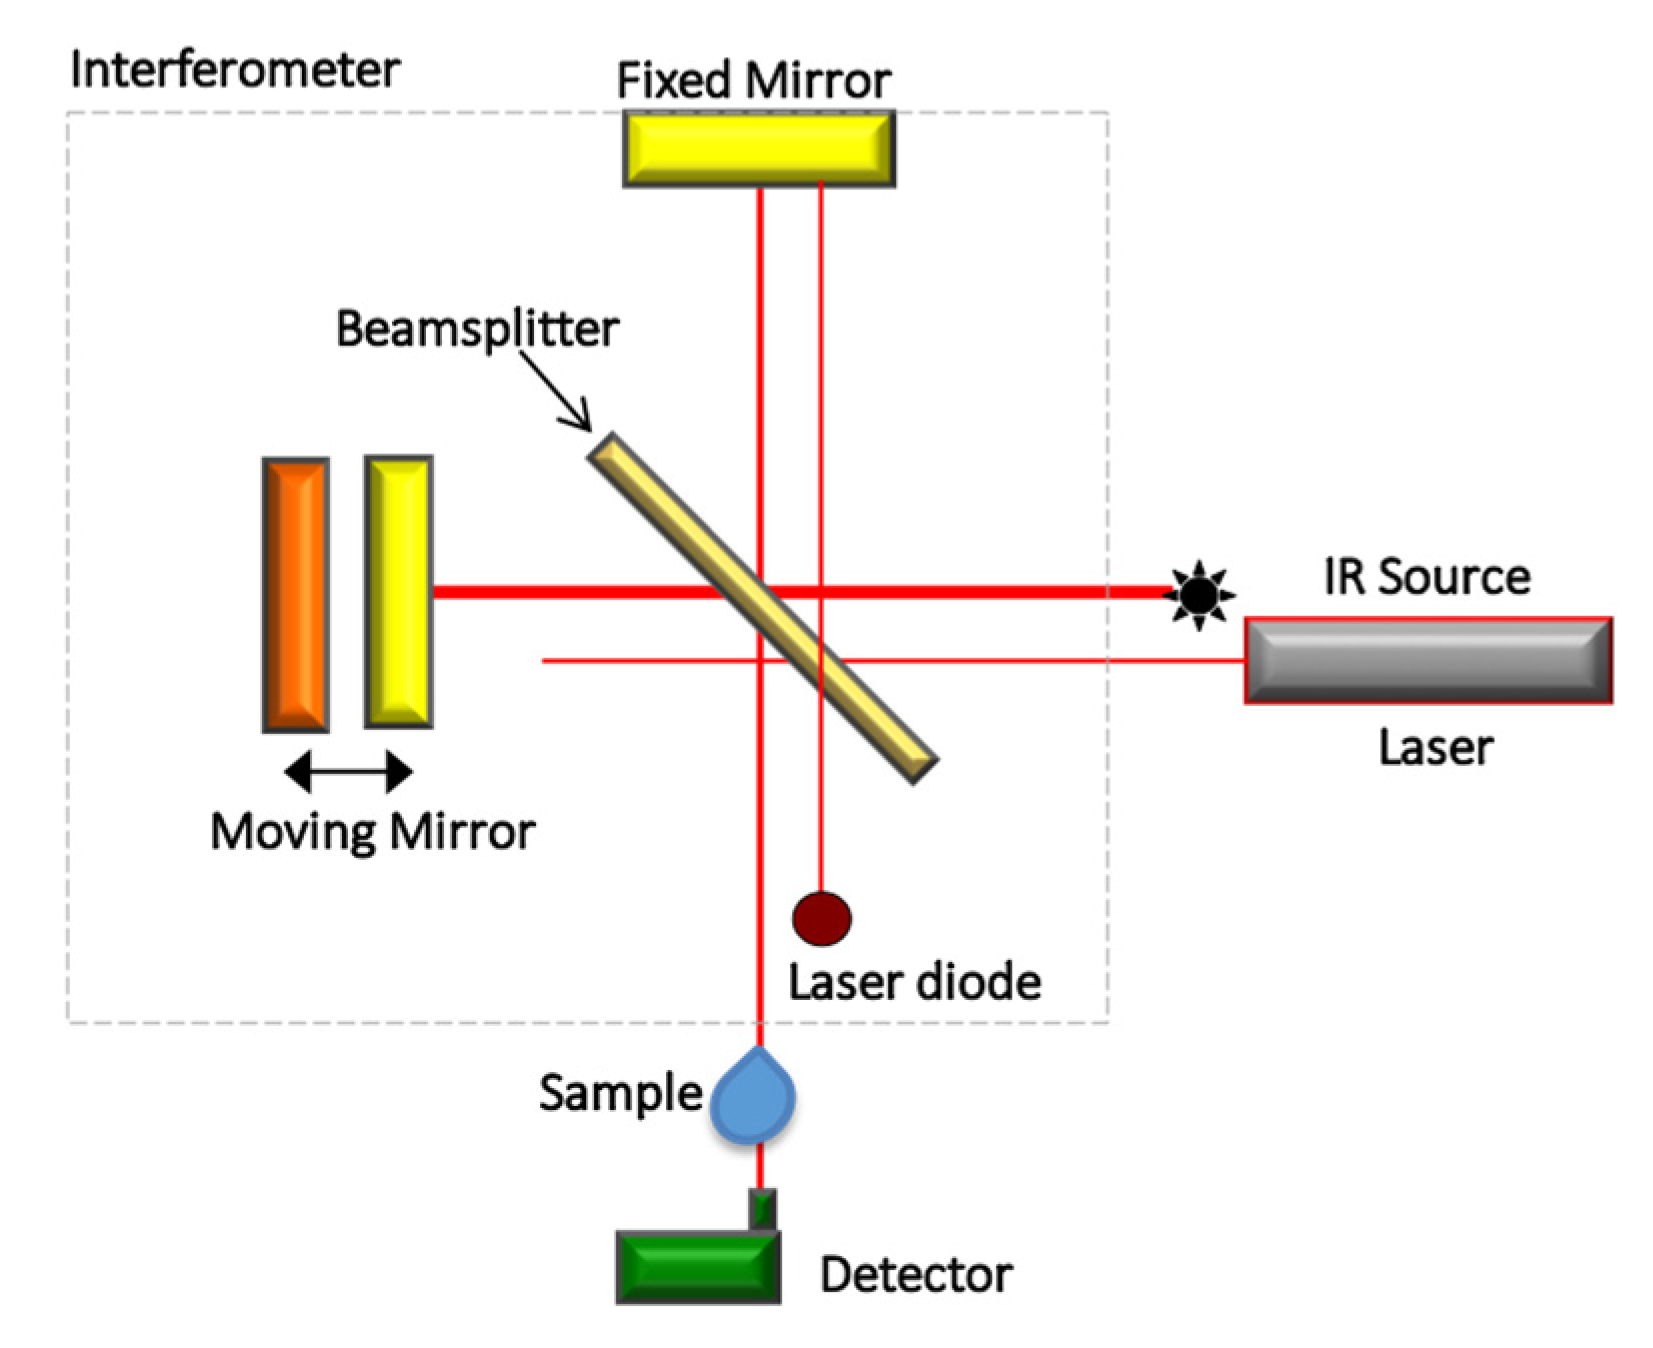
2.3.3. Infrared Spectroscopy
2.3.4. Complementarity of Raman and Infrared Spectroscopies
2.4. Data Analysis
3. Results and Discussion
3.1. Periodontal Ligament Analysis
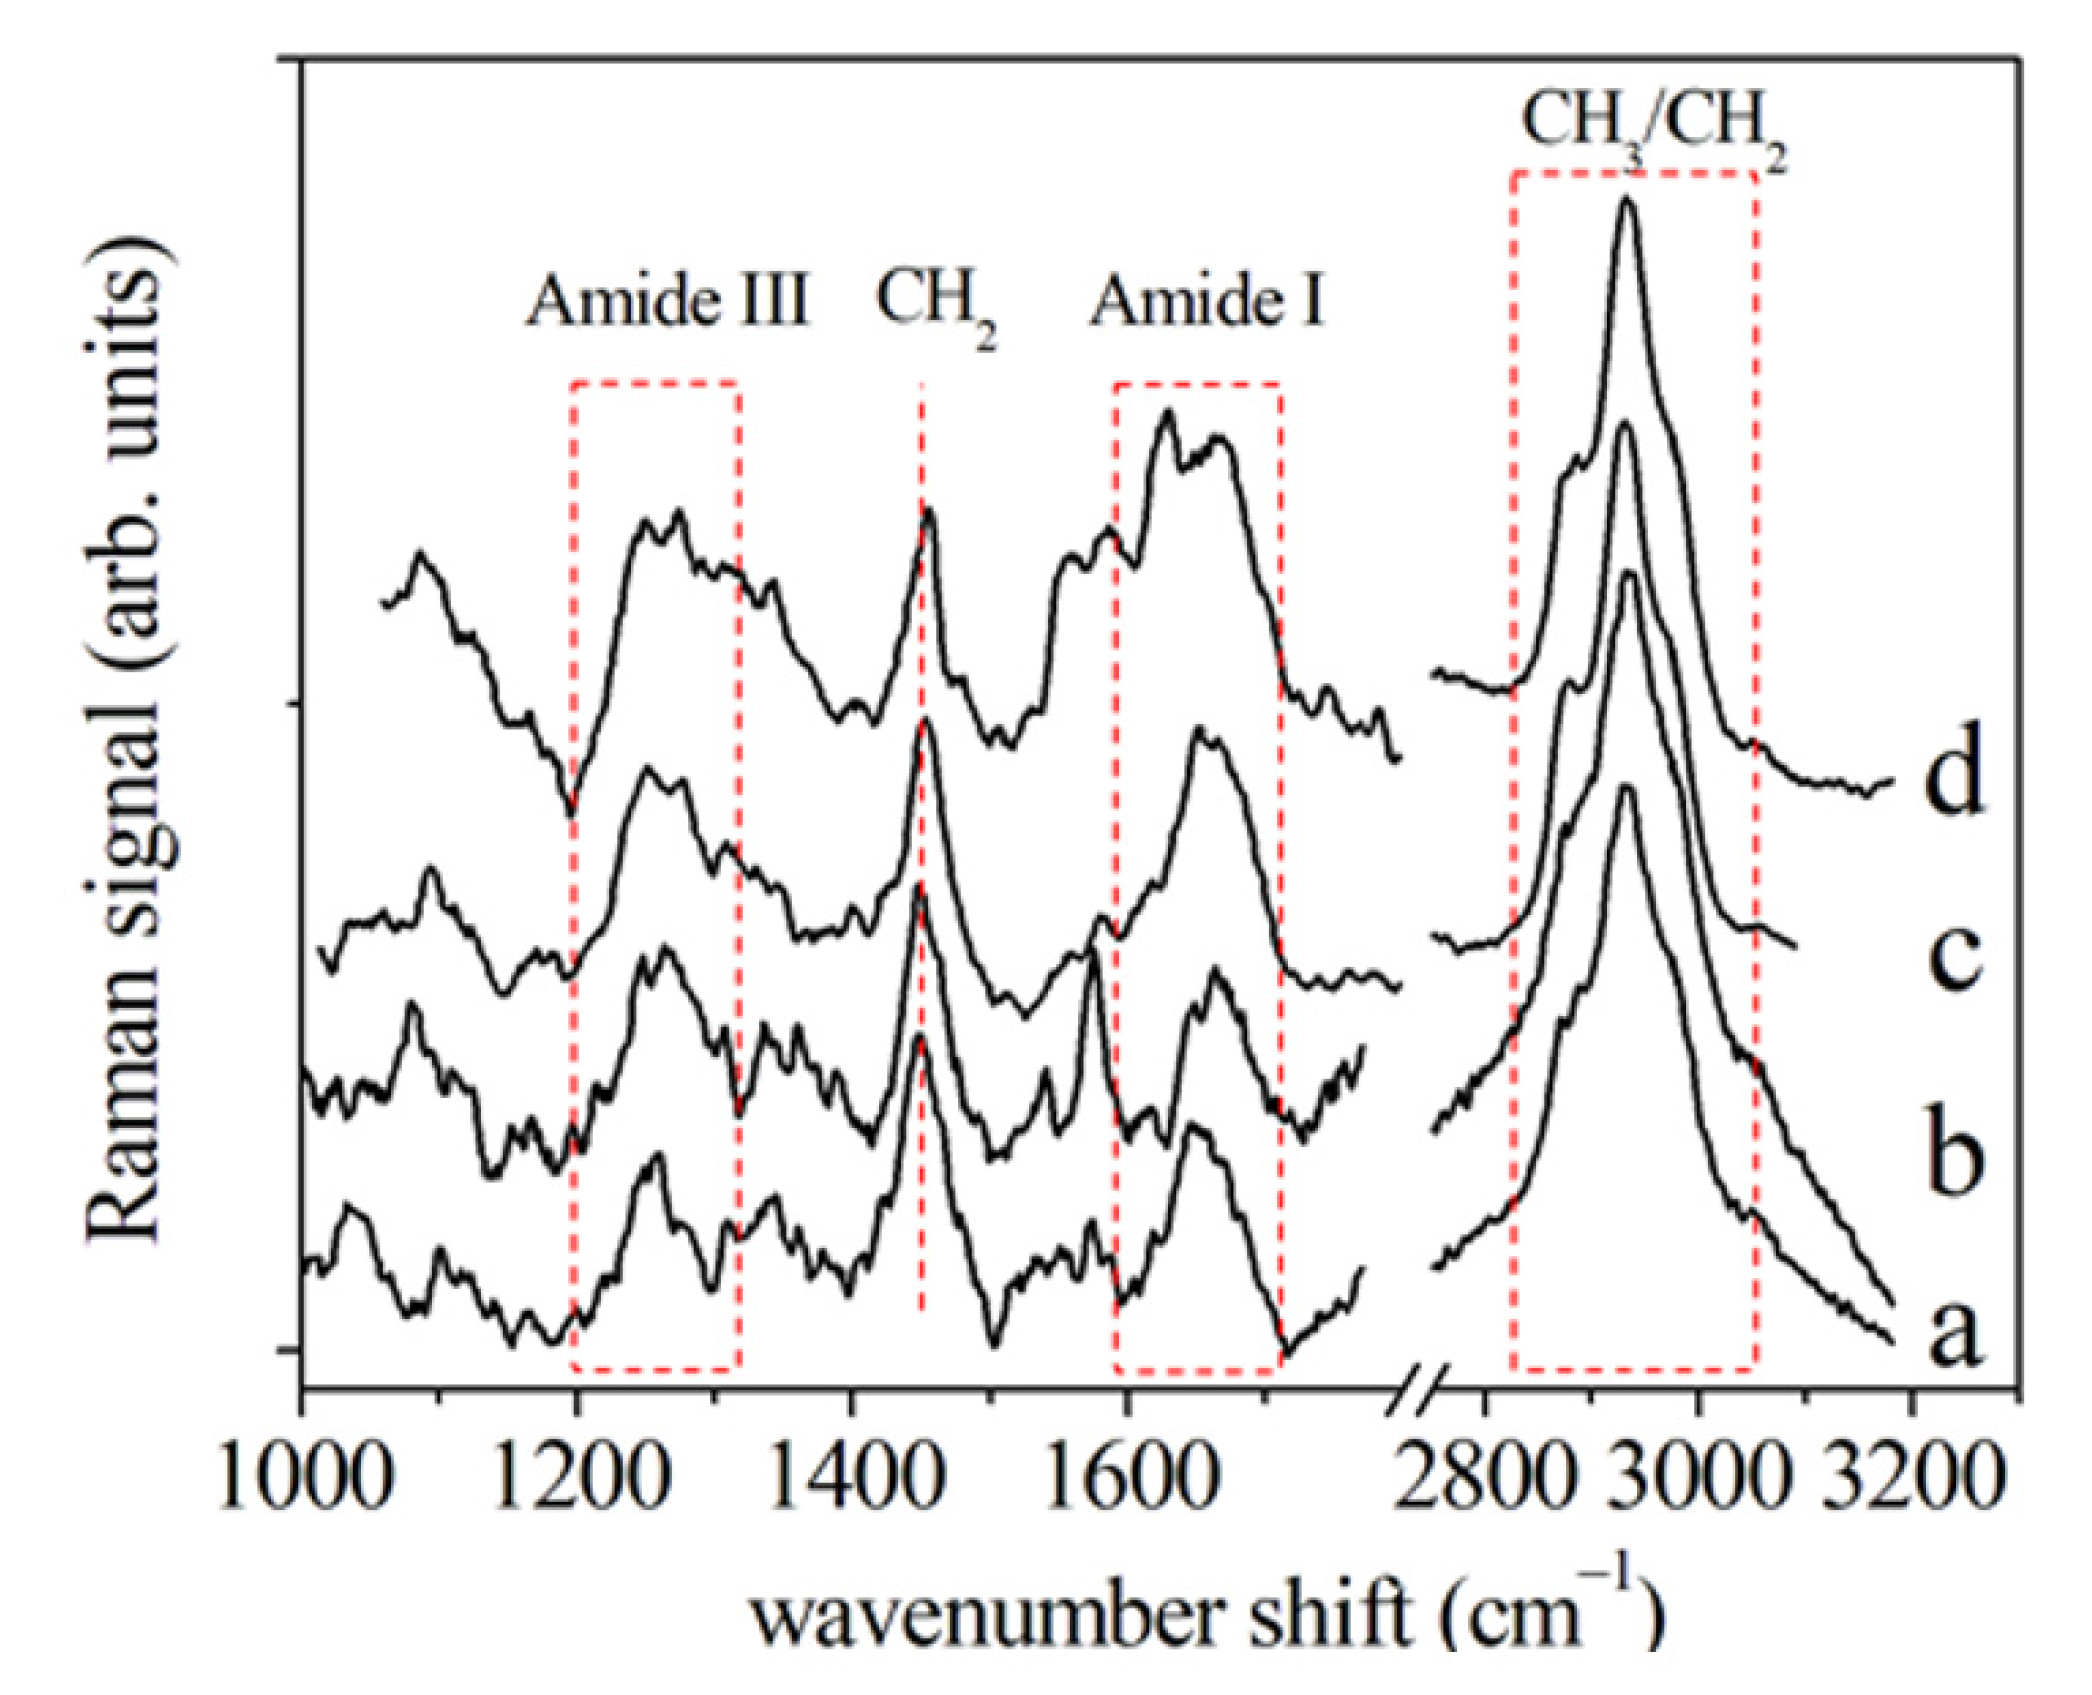
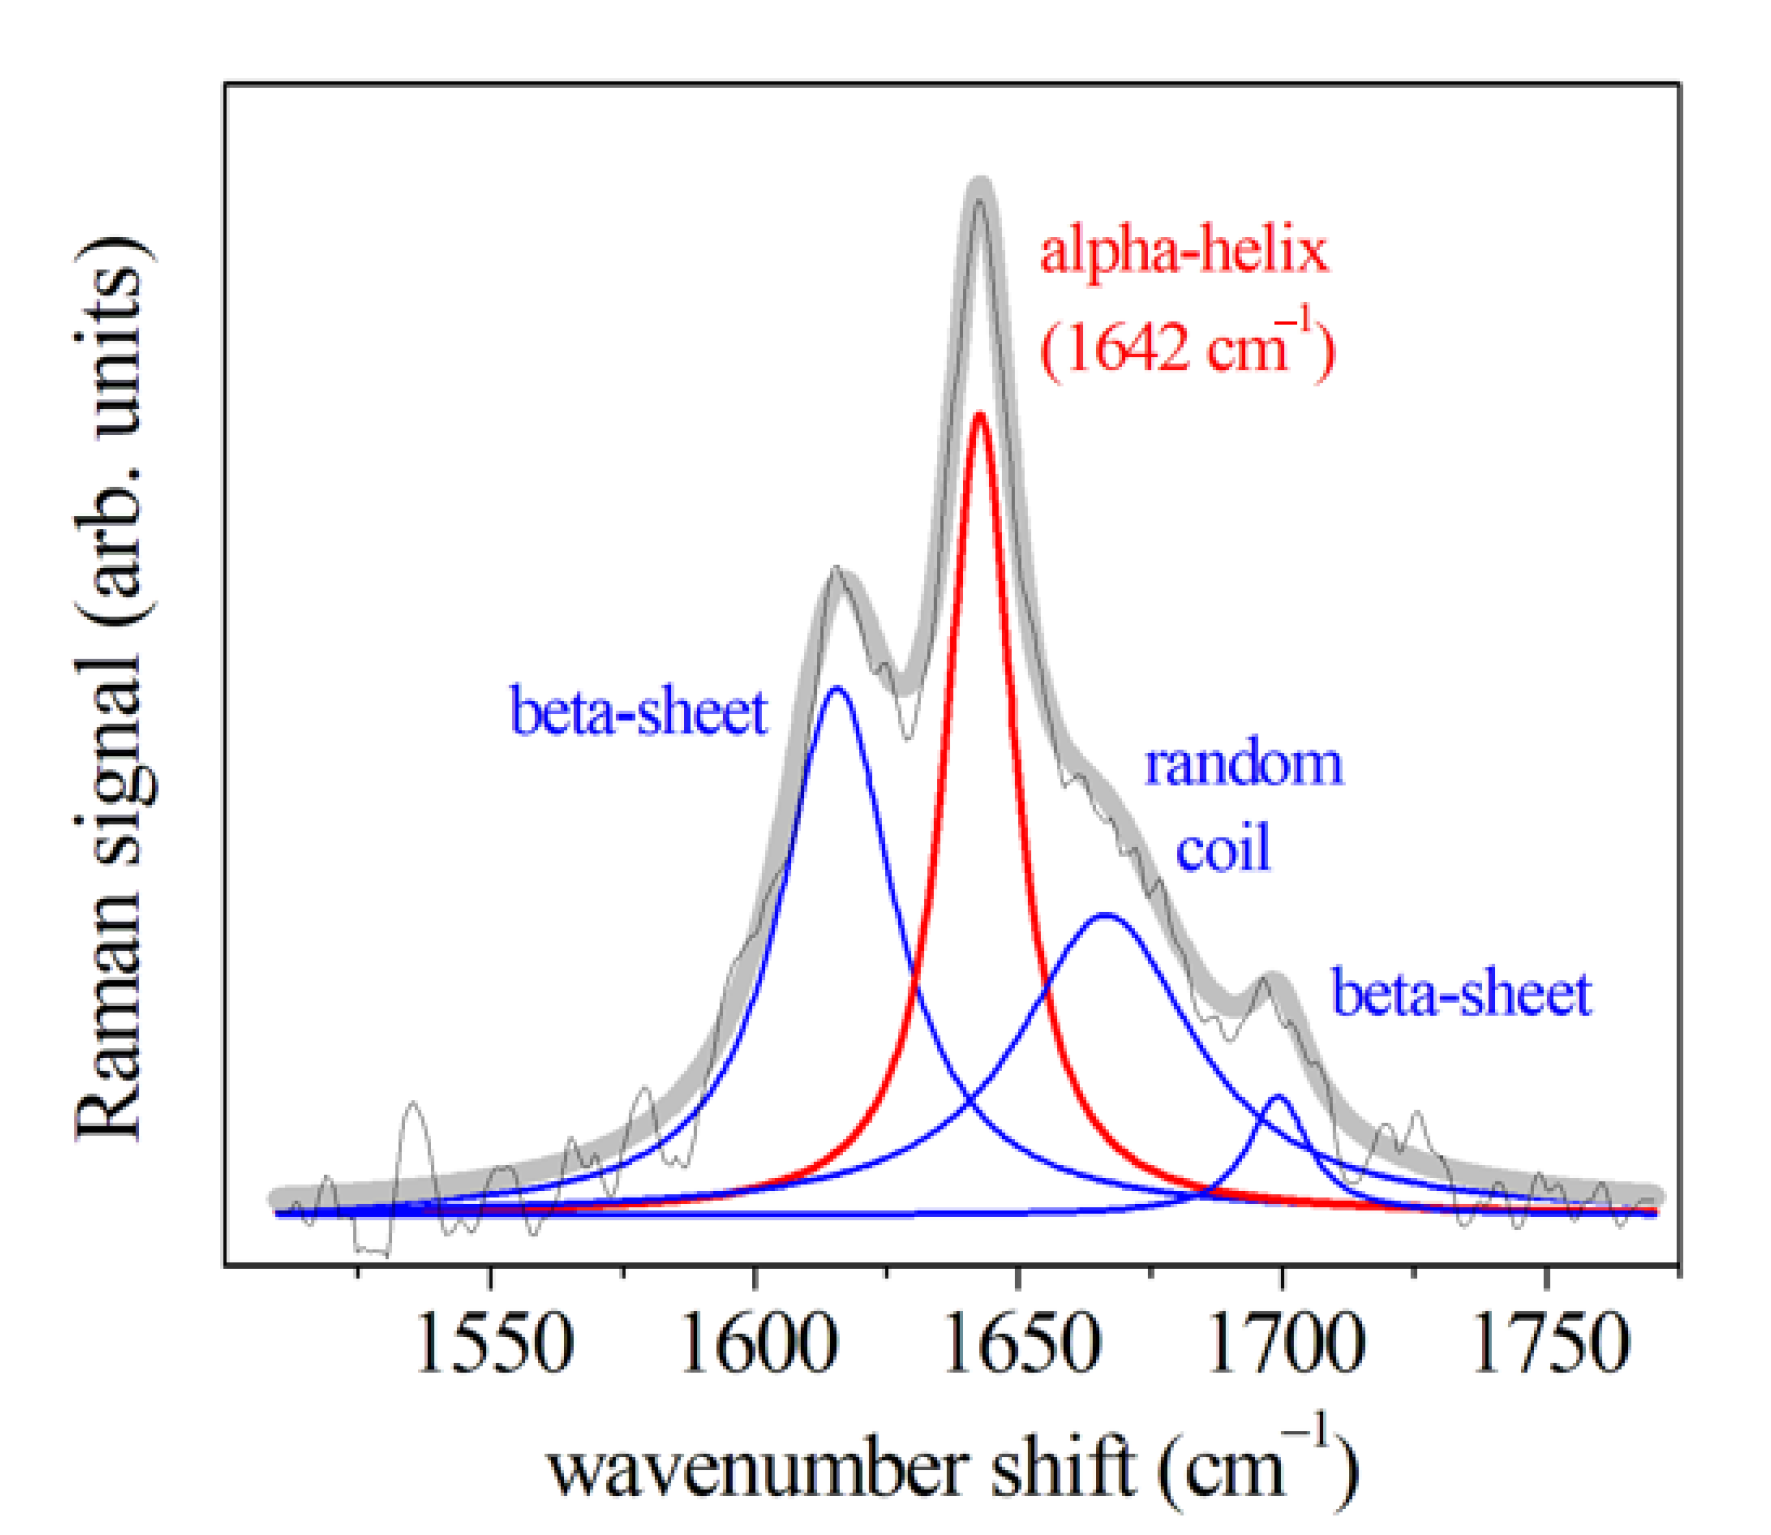
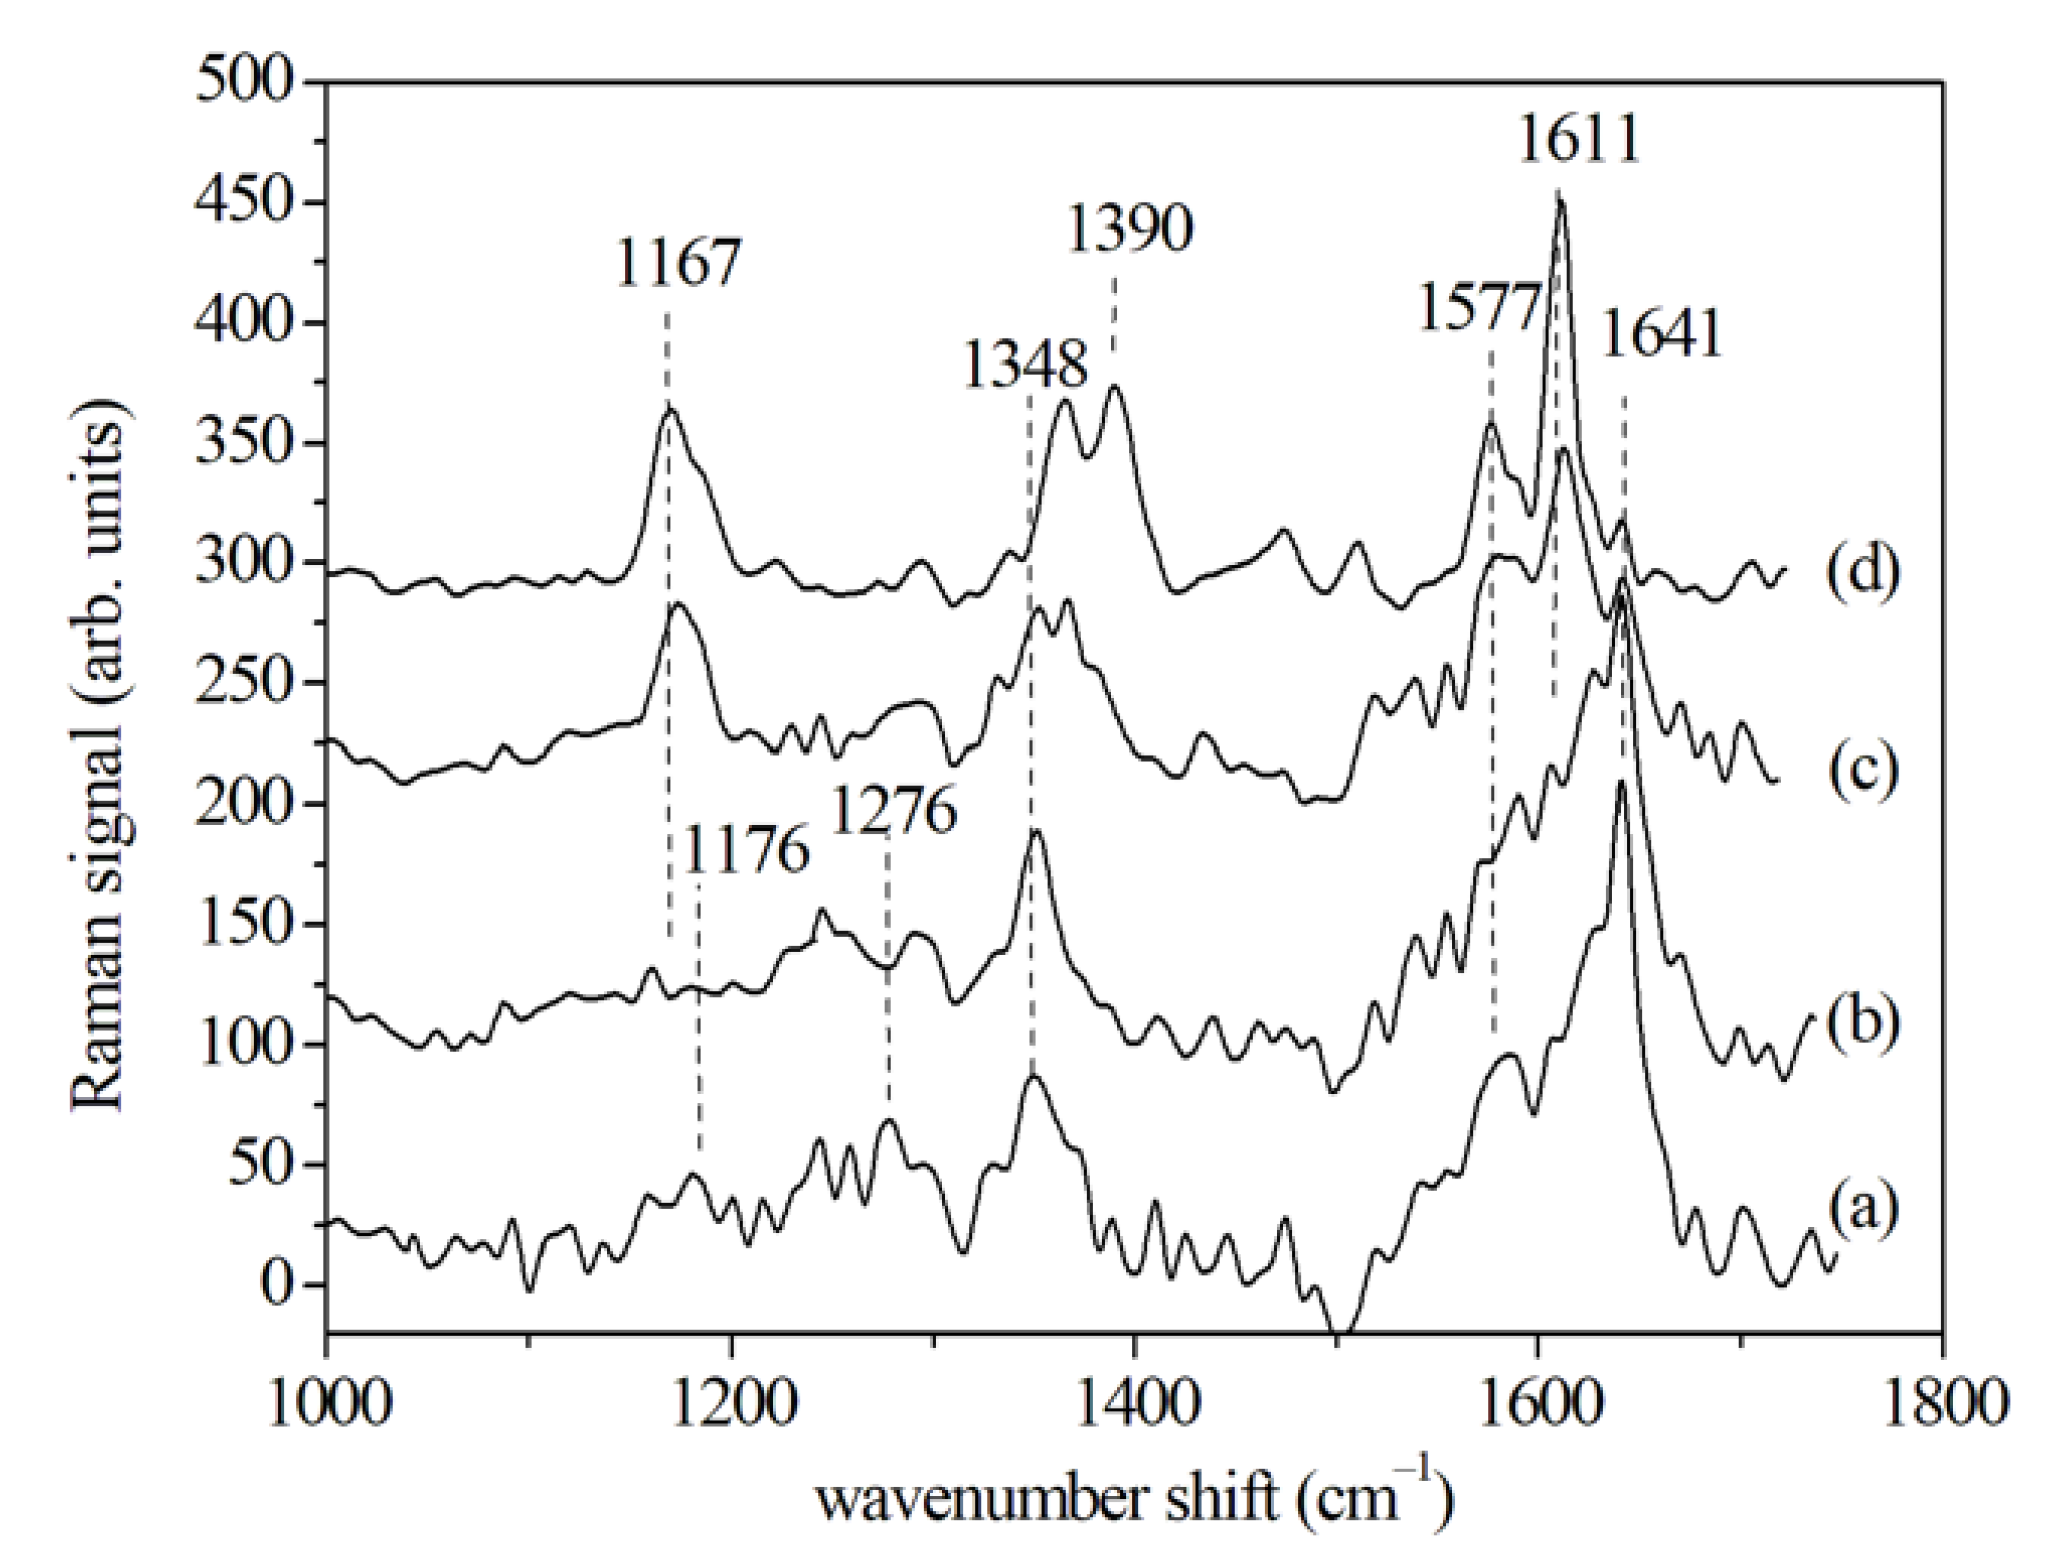
3.1.1. μ-RS Results
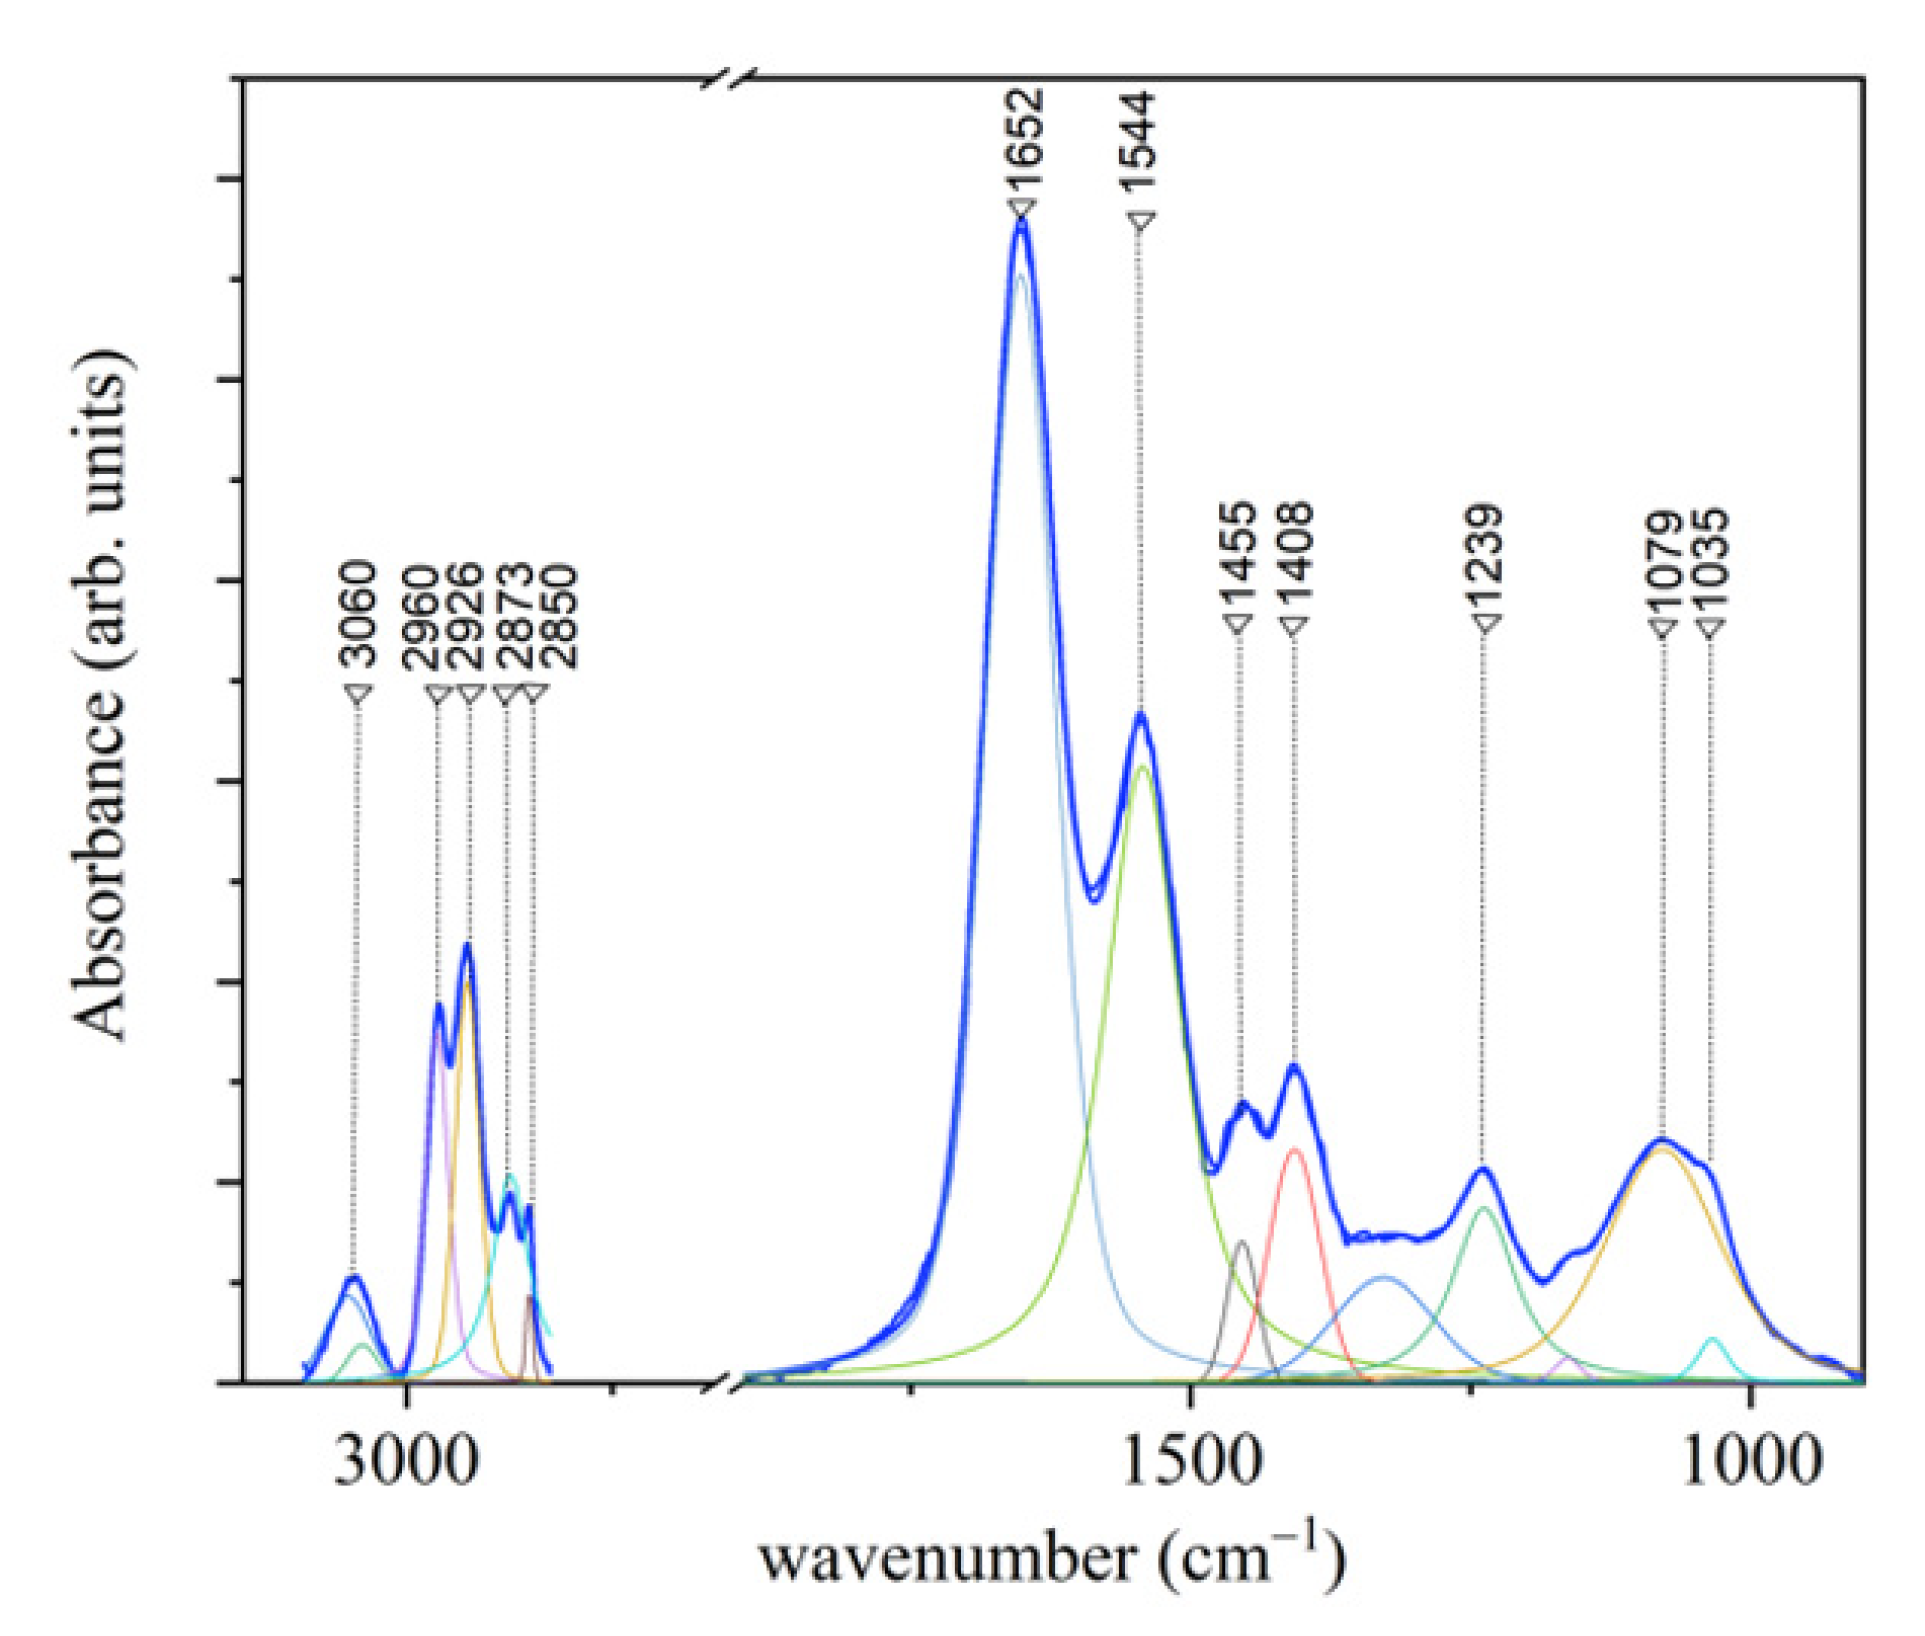
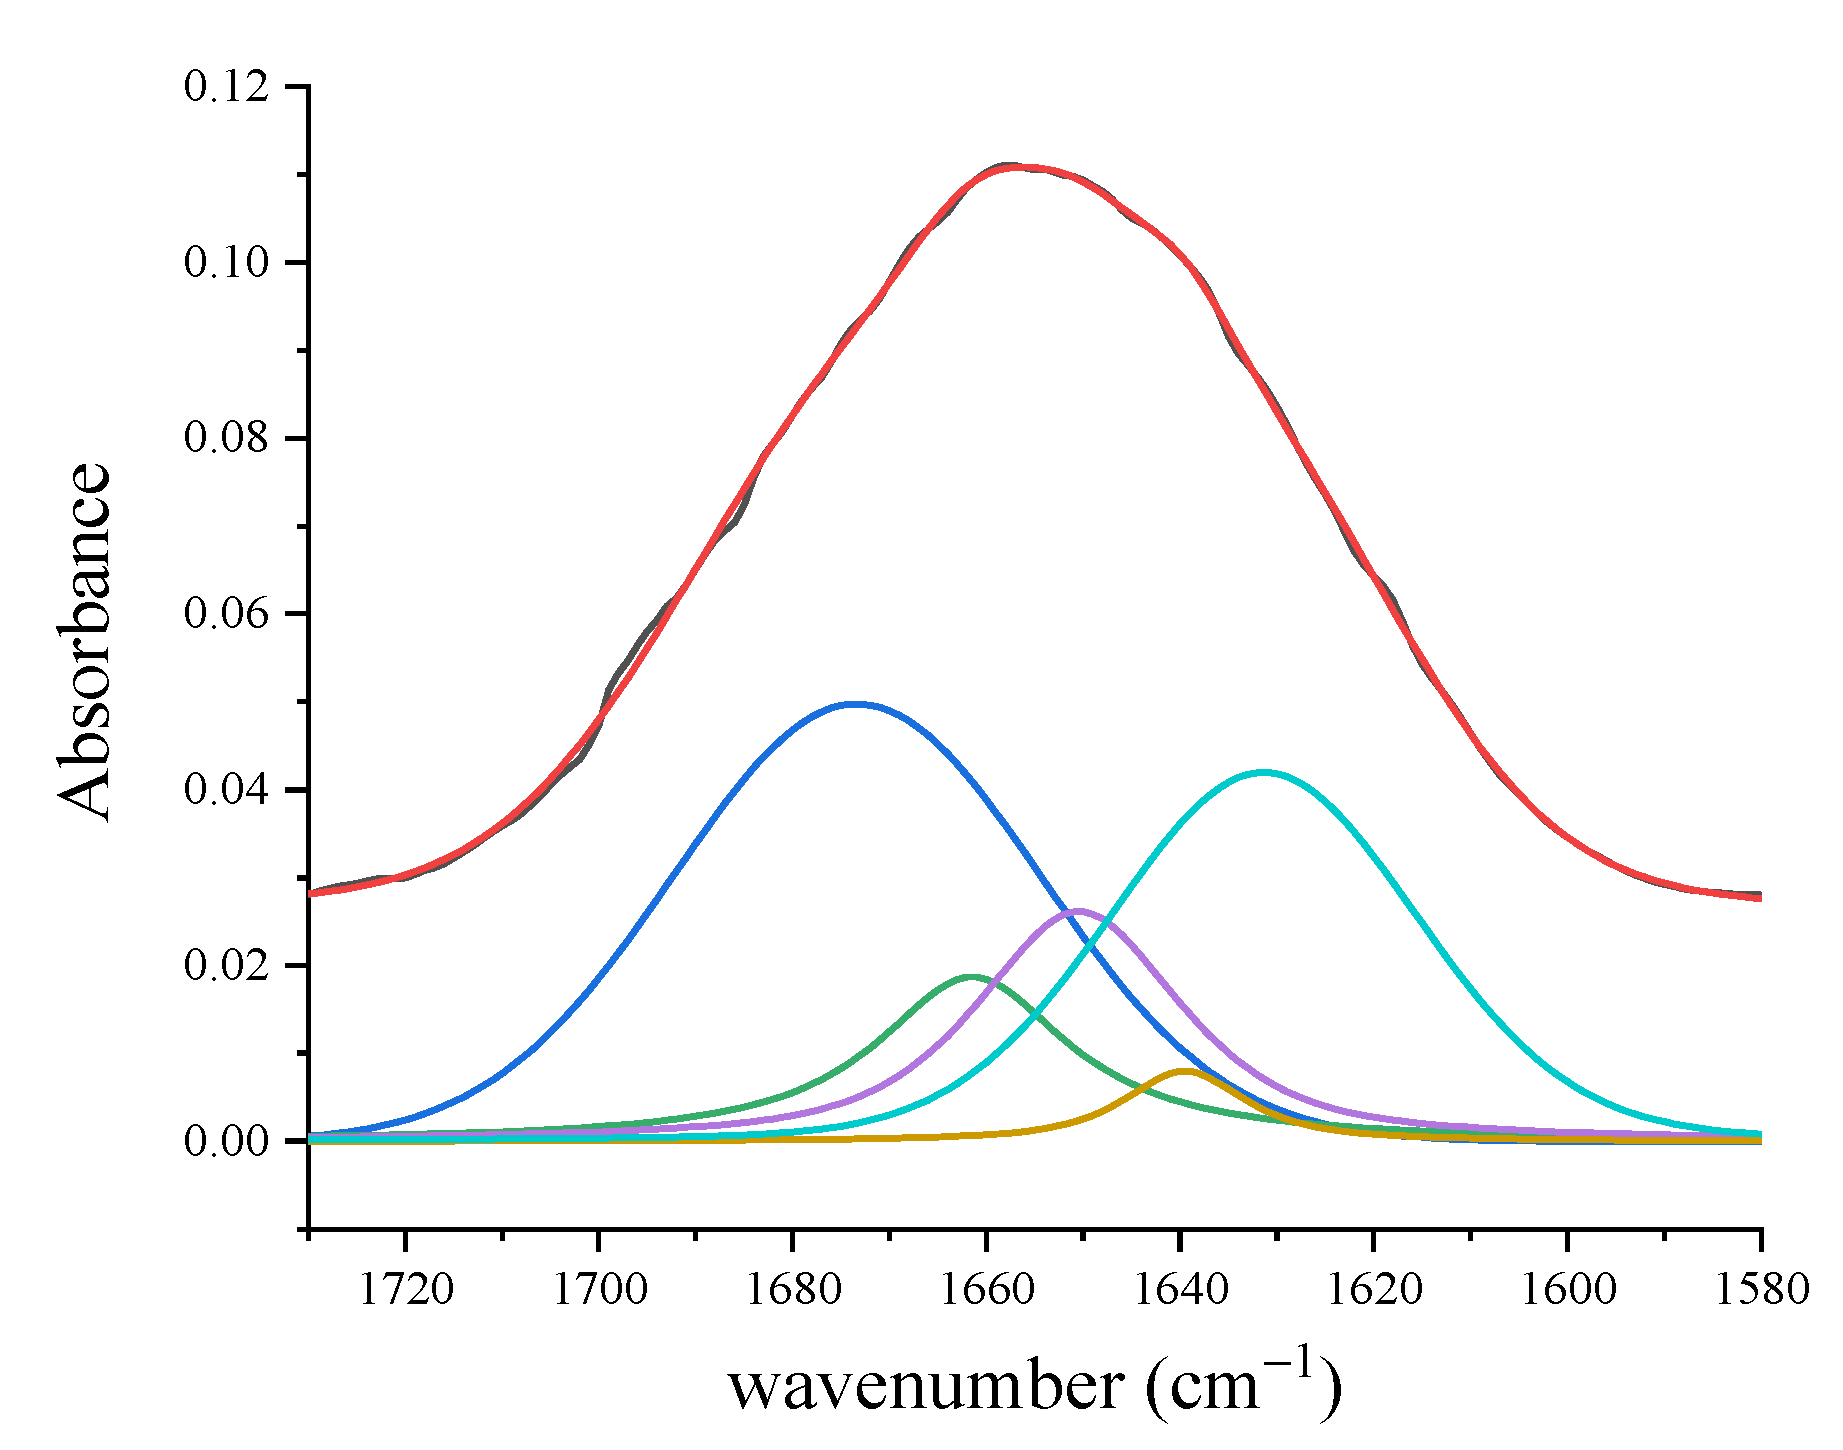
3.1.2. FT-IR Results
3.2. Gingival Crevicular Fluid Analysis
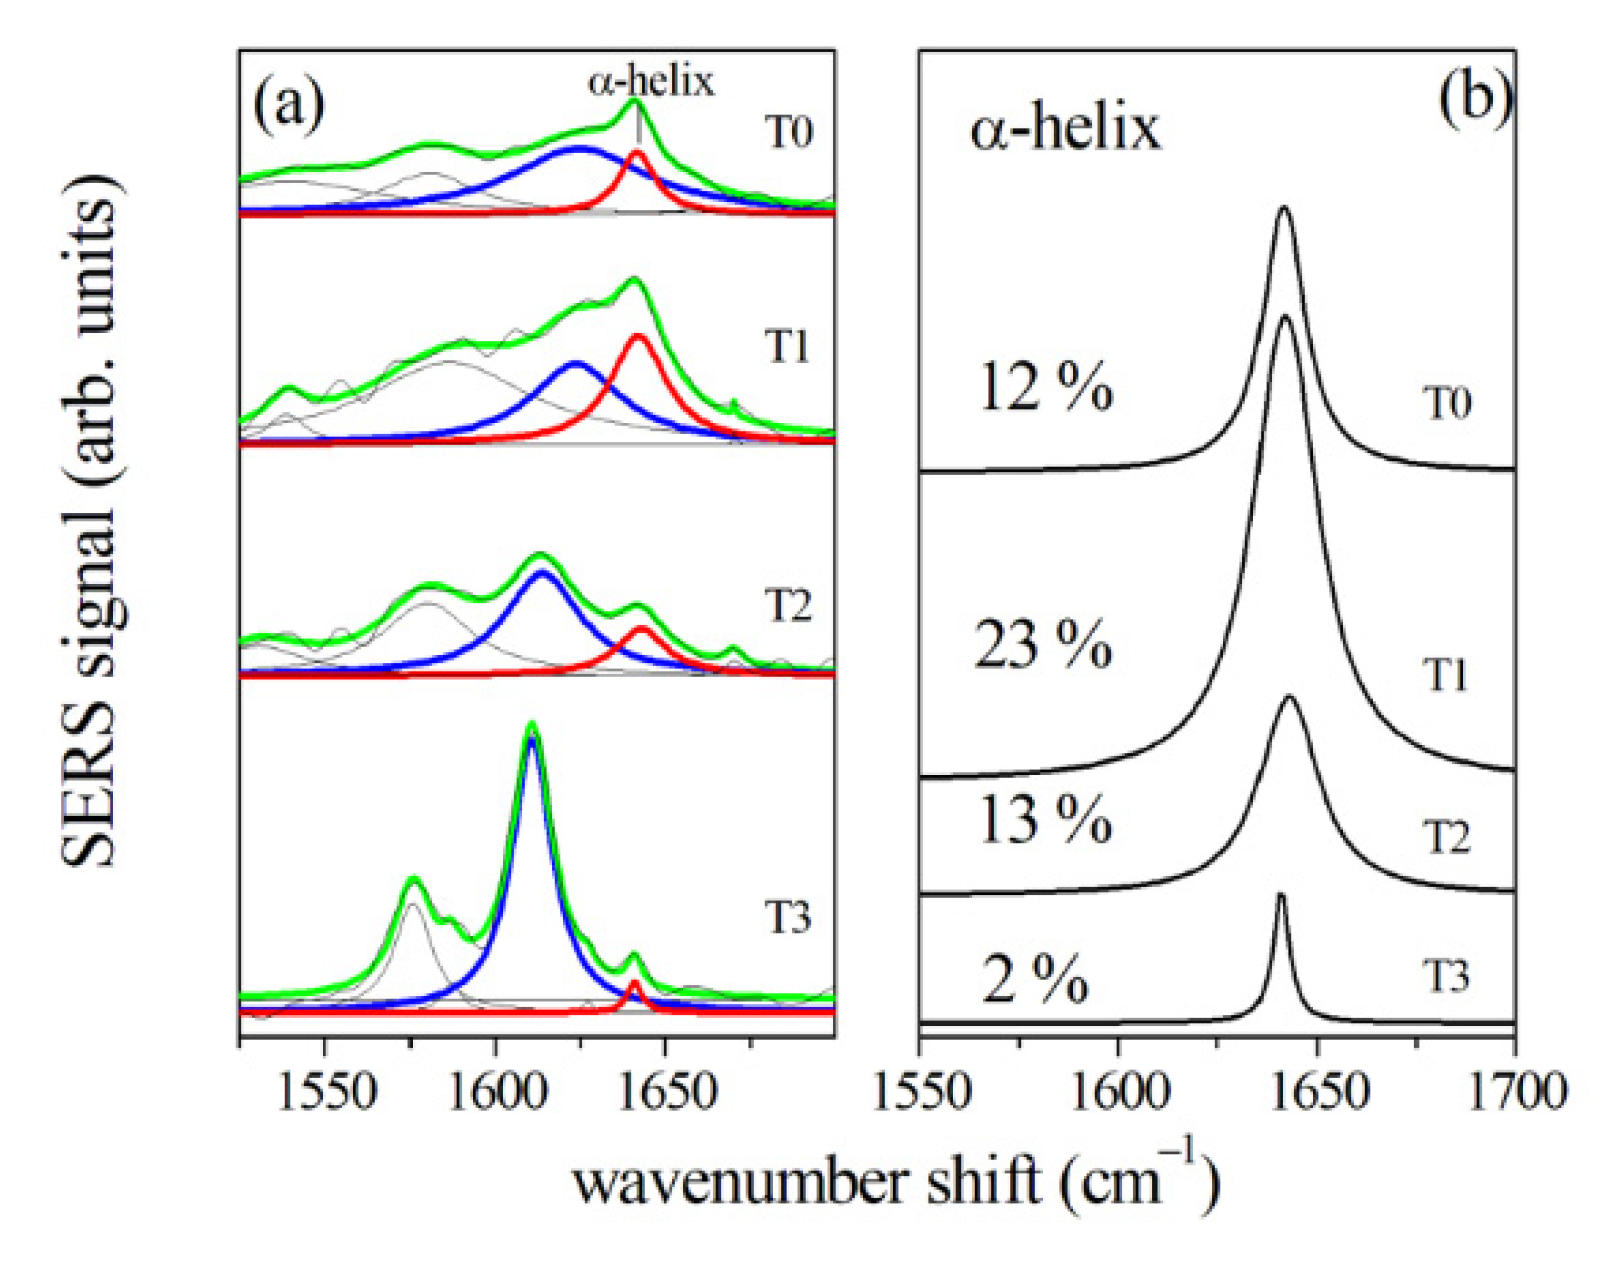
3.2.1. SERS Results
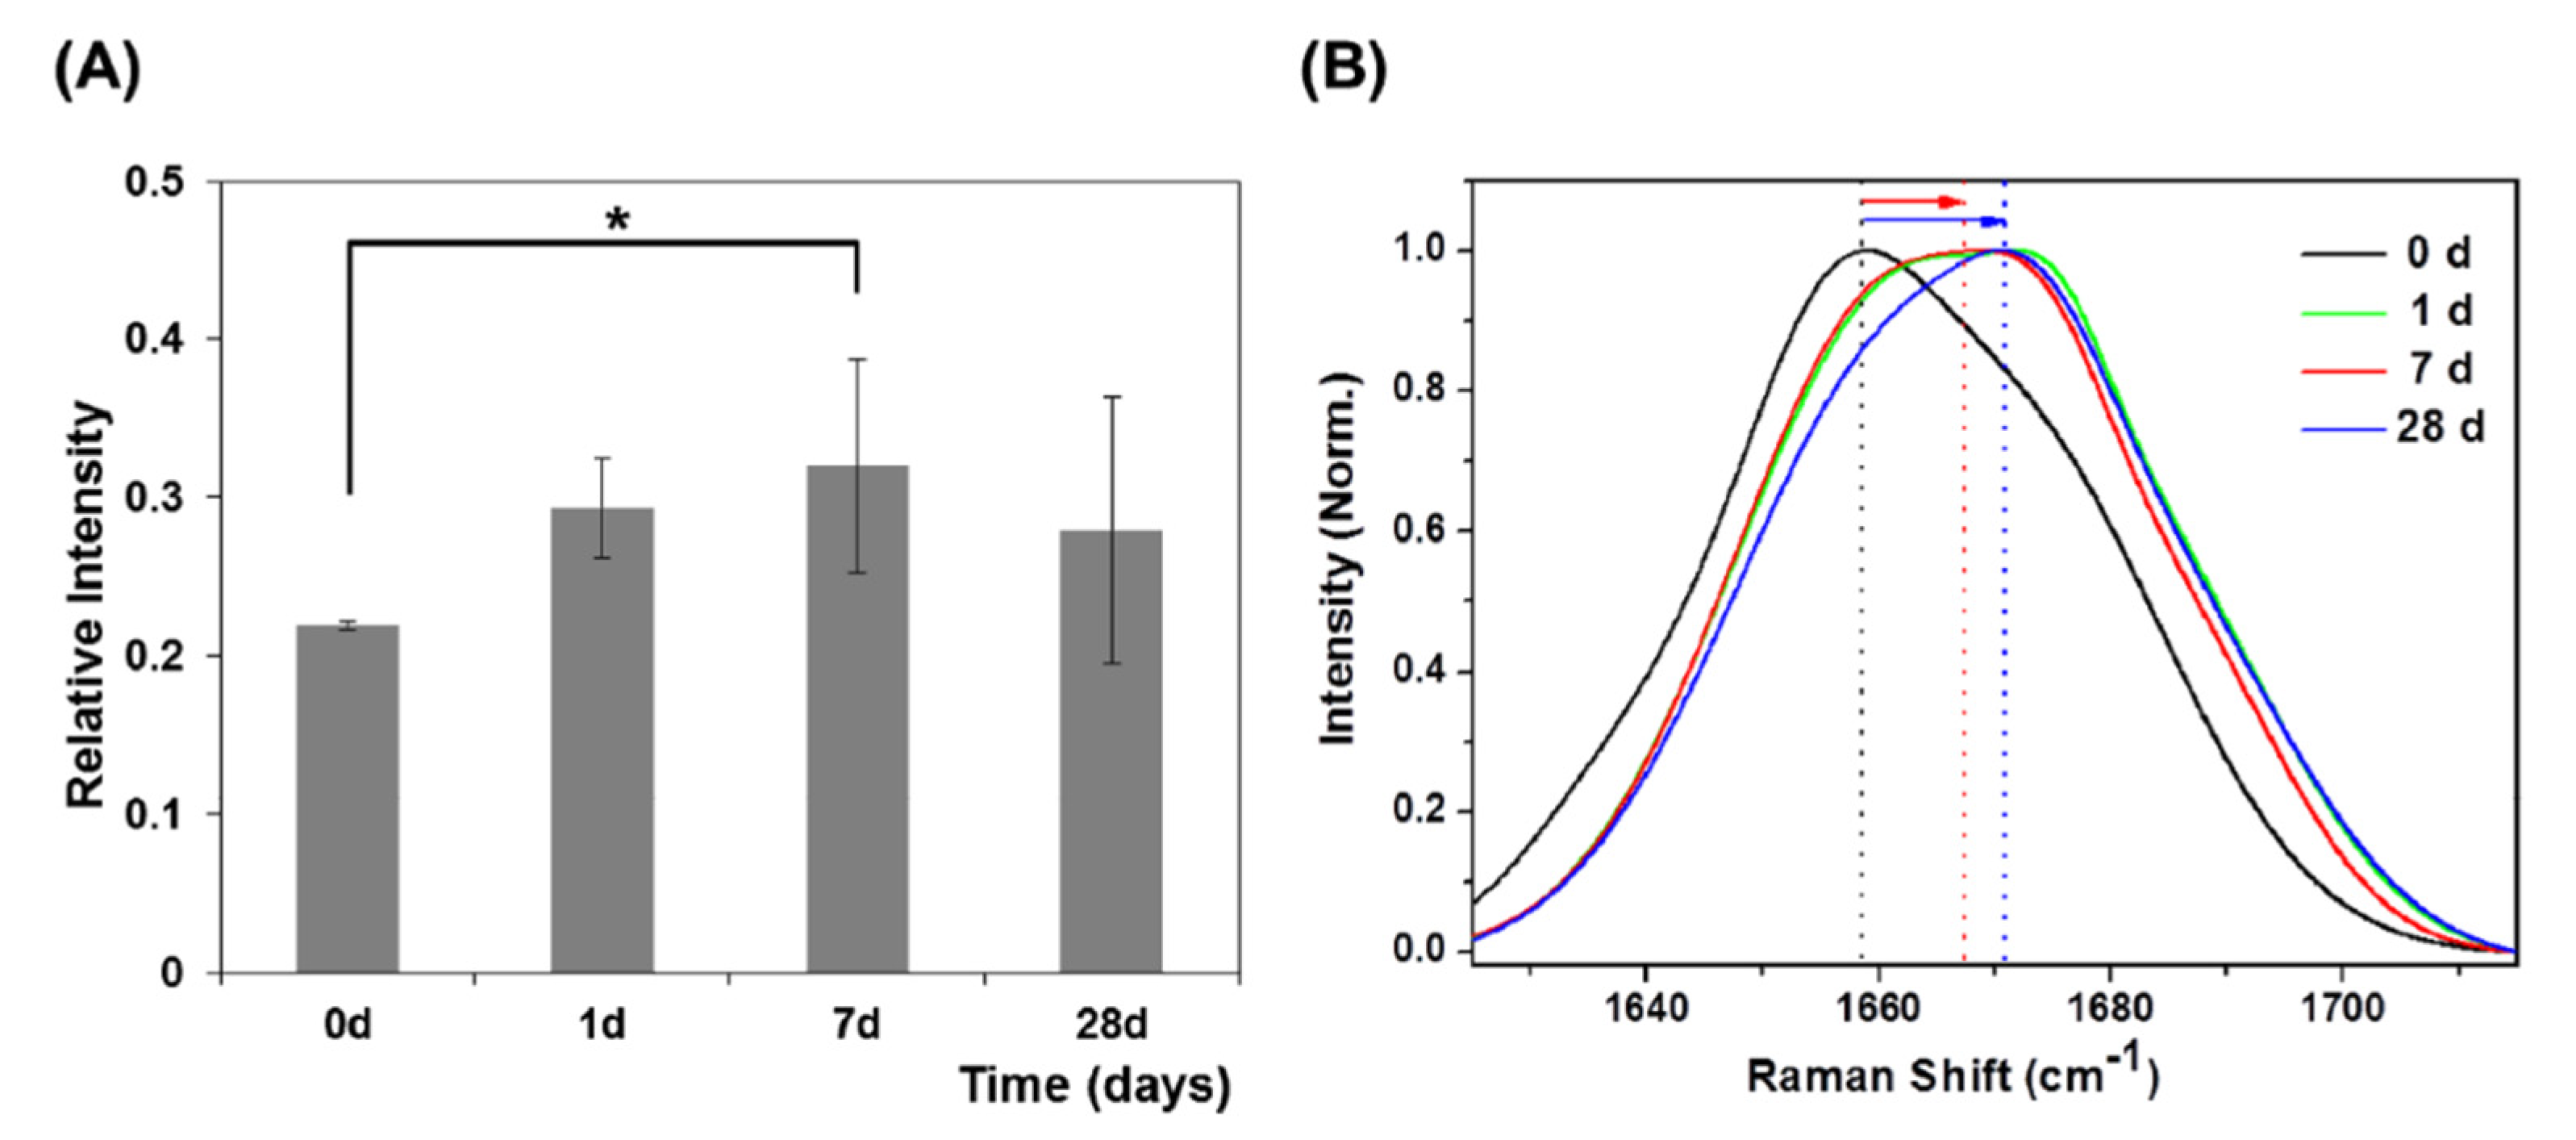
3.2.2. μ-RS Results
3.2.3. FT-IR Results
4. Conclusions and Implications for Research and Practice
Author Contributions
Funding
Data Availability Statement
Conflicts of Interest
References
- Dolce, C.; Malone, J.S.; Wheeler, T.T. Current concepts in the biology of orthodontic tooth movement. Semin. Orthod. 2002, 8, 6–12. [Google Scholar] [CrossRef]
- Krishnan, V.; Davidovitch, Z. Cellular, molecular, and tissue-level reactions to orthodontic force. Am. J. Orthod. Dentofac. Orthop. 2006, 129, 469.e1–469.e32. [Google Scholar] [CrossRef]
- Proffit, W.R.; Fields, H.W., Jr.; Larso, B.; Sarver, D.M. Contemporary Orthodontics, 6th ed.; Elsevier Inc.: Philadelphia, PA, USA, 2018. [Google Scholar]
- Anastasi, G.; Cordasco, G.; Matarese, G.; Rizzo, G.; Nucera, R.; Mazza, M.; Militi, A.; Portelli, M.; Cutroneo, G.; Favaloro, A. An immunohistochemical, histological, and electron-microscopic study of the human periodontal ligament during orthodontic treatment. Int. J. Mol. Med. 2008, 21, 545–554. [Google Scholar] [CrossRef] [PubMed]
- Fleissig, O.; Reichenberg, E.; Tal, M.; Redlich, M.; Barkana, I.; Palmon, A. Morphologic and gene expression analysis of periodontal ligament fibroblasts subjected to pressure. Am. J. Orthod. Dentofac. Orthop. 2018, 154, 664–676. [Google Scholar] [CrossRef] [PubMed]
- Li, Y.; Jacox, L.A.; Little, S.H.; Ko, C.C. Orthodontic tooth movement: The biology and clinical implications. Kaohsiung J. Med. Sci. 2018, 34, 207–214. [Google Scholar] [CrossRef] [PubMed]
- Park, J.C.; Kim, J.M.; Jung, I.H.; Kim, J.C.; Choi, S.H.; Cho, K.S.; Kim, C.S. Isolation and characterization of human periodontal ligament (PDL) stem cells (PDLSCs) from the inflamed PDL tissue: In vitro and in vivo evaluations. J. Clin. Periodontol. 2011, 38, 721–731. [Google Scholar] [CrossRef]
- Sugimori, T.; Yamaguchi, M.; Shimizu, M.; Kikuta, J.; Hikida, T.; Hikida, M.; Murakami, Y.; Suemitsu, M.; Kuyama, K.; Kasai, K. Micro-osteo perforations accelerate orthodontic tooth movement by stimulating periodontal ligament cell cycles. Am. J. Orthod. Dentofac. Orthop. 2018, 154, 788–796. [Google Scholar] [CrossRef] [PubMed]
- Uhlir, R.; Mayo, V.; Lin, P.H.; Chen, S.; Lee, Y.T.; Hershey, G.; Lin, F.C.; Ko, C.C. Biomechanical characterization of the periodontal ligament: Orthodontic tooth movement. Angle Orthod. 2017, 87, 183–192. [Google Scholar] [CrossRef] [PubMed]
- Moccia, S.; Nucci, L.; Spagnuolo, C.; d’Apuzzo, F.; Piancino, M.G.; Minervini, G. Polyphenols as potential agents in the management of temporomandibular disorders. Appl. Sci. 2020, 10, 5305. [Google Scholar] [CrossRef]
- Gunzler, H.; Gremlich, H.U. IR Spectroscopy: An Introduction; Wiley-VCH: Weinheim, Germany, 2002. [Google Scholar]
- Kong, K.; Kendall, C.; Stone, N.; Notingher, I. Raman spectroscopy for medical diagnostics. From in-vitro biofluid assays to in-vivo cancer detection. Adv. Drug Deliv. 2015, 89, 121–134. [Google Scholar] [CrossRef] [PubMed]
- Pence, I.; Mahadevan-Jansen, A. Clinical instrumentation and applications of Raman spectroscopy. Chem. Soc. Rev. 2016, 45, 1958–1979. [Google Scholar] [CrossRef]
- Sakudo, A. Near-infrared spectroscopy for medical applications: Current status and future perspectives. Clin. Chim. Acta 2016, 455, 181–188. [Google Scholar] [CrossRef]
- Tsuda, H.; Arends, J. Raman spectroscopy in dental research: A short review of recent studies. Adv. Dent. Res. 1997, 11, 539–547. [Google Scholar] [CrossRef] [PubMed]
- Baker, M.J.; Trevisan, J.; Bassan, P.; Bhargava, R.; Butler, H.J.; Dorling, K.M.; Fielden, P.R.; Fogarty, S.W.; Fullwood, N.J.; Heys, K.A.; et al. Using Fourier transform IR spectroscopy to analyze biological materials. Nat. Protoc. 2014, 9, 1771–1791. [Google Scholar] [CrossRef]
- Lacombe, C.; Untereiner, V.; Gobinet, C.; Zater, M.; Sockalingum, G.D.; Garnotel, R. Rapid screening of classic galactosemia patients: A proof-of-concept study using high-throughput FTIR analysis of plasma. Analyst 2015, 140, 2280. [Google Scholar] [CrossRef]
- Lovergne, L.; Clemens Lovergne, L.; Untereiner, V.; Lukaszweski, R.A.; Sockalingum, G.D.; Baker, M.J. Investigating optimum sample preparation for infrared spectroscopic serum diagnostics. Anal. Methods 2015, 7, 7140. [Google Scholar] [CrossRef][Green Version]
- Lovergne, L.; Bouzy, P.; Untereine, V.; Garnotel, R.; Baker, M.J.; Thiefin, G.; Sockalingum, G.D. Biofluid infrared spectrodiagnostics: Pre-analytical considerations for clinical applications. Faraday Discuss. 2016, 187, 521–537. [Google Scholar] [CrossRef] [PubMed]
- Xiang, X.M.; Liu, K.Z.; Man, A.; Ghiabi, E.; Cholakis, A.; Scott, D.A. Periodontitis-specific molecular signatures in gingival crevicular fluid. J. Period. Res. 2010, 45, 345–352. [Google Scholar] [CrossRef]
- Xiang, K.Z.; Duarte, P.M.; Lima, J.A.; Santos, V.R.; Goncxalves, T.D.; Miranda, T.S.; Liu, K.Z. Diabetes-Associated Periodontitis Molecular Features in Infrared Spectra of Gingival Crevicular Fluid. J. Periodontol. 2013, 84, 1792–1800. [Google Scholar] [CrossRef]
- Pàscoa, R.N.M.J.; Ferreira, J.; Gomes, P.S. The diagnosis of eating disorders through mid-infrared spectroscopy of the gingival crevicular fluid: A pilot trial. Eat. Weight Disord. 2020, 25, 1111–1115. [Google Scholar] [CrossRef]
- Camerlingo, C.; d’Apuzzo, F.; Grassia, V.; Perillo, L.; Lepore, M. Micro-Raman spectroscopy for monitoring changes in periodontal ligaments and gingival crevicular fluid. Sensors 2014, 14, 22552–22563. [Google Scholar] [CrossRef]
- Jung, G.B.; Kim, K.A.; Han, I.; Park, Y.G.; Park, H.K. Biochemical characterization of human gingival crevicular fluid during orthodontic tooth movement using Raman spectroscopy. Biomed. Express 2014, 5, 3510–3520. [Google Scholar] [CrossRef]
- Camerlingo, C.; d’Apuzzo, F.; Grassia, V.; Parente, G.; Perillo, L.; Lepore, M. Micro-Raman spectroscopy during orthodontic tooth movement: Follow-up of gingival status. In Proceedings of the 2015 International Conference on BioPhotonics, Florence, Italy, 20–22 May 2015. [Google Scholar]
- d’Apuzzo, F.; Perillo, L.; Delfino, I.; Portaccio, M.; Lepore, M.; Camerlingo, C. Monitoring early phases of orthodontic treatment by means of Raman spectroscopies. J. Biomed. Opt. 2017, 22, 115001. [Google Scholar] [CrossRef] [PubMed]
- Portaccio, M.; d’Apuzzo, F.; Perillo, L.; Grassia, V.; Errico, S.; Lepore, M. Infrared microspectroscopy characterization of gingival crevicular fluid during orthodontic treatment. J. Mol. Struct. 2019, 1176, 847–854. [Google Scholar] [CrossRef]
- Perillo, L.; d’Apuzzo, F.; Illario, M.; Laino, L.; Di Spigna, G.; Lepore, M.; Camerlingo, C. Evaluation of biochemical and structural changes in periodontal ligament after orthodontic movement by means of micro-Raman spectroscopy. Sensors 2020, 20, 497. [Google Scholar] [CrossRef] [PubMed]
- Camerlingo, C.; d’Apuzzo, F.; Cammarota, M.; Errico, S.; Portaccio, M.; Perillo, L.; Lepore, M. Human periodontal ligament characterization by means of vibrational spectroscopy and electron microscopy. Eng. Proc. 2020, 2, 35. [Google Scholar] [CrossRef]
- Butler, H.J.; Ashton, L.; Bird, B.; Cinque, G.; Curtis, K.; Dorney, J.; Esmonde-White, K.; Fullwood, N.J.; Gardner, B.; Martin-Hirsch, P.L.; et al. Using Raman spectroscopy to characterize biological materials. Nat. Protoc. 2016, 11, 664–687. [Google Scholar] [CrossRef] [PubMed]
- Le Ru, E.C.; Blackie, E.J.; Meyer, M.; Etchegoin, P.G. Surface Enhanced Raman Scattering Enhancement Factors: A Comprehensive Study. J. Phys. Chem. C 2007, 111, 13794–13803. [Google Scholar] [CrossRef]
- Lewis, I.R.; Edwards, H.G.M. Handbook of Raman Spectroscopy; Marcel Dekker Inc.: New York, NY, USA, 2001. [Google Scholar]
- Craggs, C.; Galloway, K.P.; Gardiner, D.J. Maximum entropy methods applied to simulated and observed Raman spectra. Appl. Spectrosc. 1996, 50, 43. [Google Scholar] [CrossRef]
- Gallo, C.; Capozzi, V.; Lasalvia, M.; Perna, G. An algorithm for estimation of background signal of Raman spectra from biological cell samples using polynomial functions of different degrees. Vibr. Spectrosc. 2013, 83, 132–137. [Google Scholar] [CrossRef]
- Greek, L.; Shane, L.; Schulze, H.G.; Blades, M.W.; Bree, A.V.; Gorzalka, B.B.; Turner, R.F.B. SNR enhancement and deconvolution of Raman spectra using a two-point entropy regularization. Appl. Spectrosc. 1995, 49, 425. [Google Scholar] [CrossRef]
- Schulze, G.; Jirasek, A.; Yu, M.M.L.; Lim, A.; Turner, R.F.B.; Blades, M.W. Investigation of selected baseline removal techniques as candidates for automated implementation. Appl. Spectrosc. 2005, 56, 545. [Google Scholar] [CrossRef]
- Camerlingo, C.; Zenone, F.; Gaeta, G.M.; Riccio, R.; Lepore, M. Wavelet data processing of micro-Raman spectra of biological samples. Measur. Sci. Tech. 2006, 17, 298–303. [Google Scholar] [CrossRef]
- Thomas, G.J., Jr.; Agard, D.A. Quantitative analysis of nucleid acids, proteins, and viruses by Raman band deconvolution. Biophys. J. 1984, 46, 763–768. [Google Scholar] [CrossRef]
- Delfino, I.; Perna, G.; Lasalvia, M.; Capozzi, V.; Manti, L.; Camerlingo, C.; Lepore, M. Visible micro-Raman spectroscopy of single human mammary epithelial cells exposed to X-ray radiation. J. Biomed. Opt. 2015, 20, 035003. [Google Scholar] [CrossRef] [PubMed]
- Spitz, A.; Christovam, I.O.; Marañón-Vásquez, G.A.; Masterson, D.F.; Adesse, D.; Maia, L.C.; Bolognese, A.M. Global gene expression profile of periodontal ligament cells submitted to mechanical loading: A systematic review. Arch. Oral Biol. 2020, 118, 104884. [Google Scholar] [CrossRef] [PubMed]


| Author, Year [Ref. n°] | Vibrational Spectroscopy | Sample Type | OTM Time (Days) | Subject Number | Age (yrs) |
|---|---|---|---|---|---|
| Camerlingo et al., 2014 [23] | μ-RS | PDL | 0, 2, 7, 14 | 3 | range 13–21 |
| Jung et al., 2014 [24] | μ-RS | GCF | 0, 1, 7, 28 | 10 | range 18–23 mean 20.8 ± 2.5 |
| Camerlingo et al., 2015 [25] | μ-RS | GCF | 0/28 | 3 | range 13–26 |
| D’Apuzzo et al., 2017 [26] | μ-RS/SERS | GCF | 0, 2, 7, 14 | 18 | range 13–22 |
| Portaccio et al., 2019 [27] | FT-IR | GCF | 0, 2, 7, 14 | 18 | range 12–22 |
| Perillo et al., 2020 [28] | μ-RS | PDL | 0, 2, 7, 14 | 11 | range 11–24 mean 19.9 ± 4.7 |
| Camerlingo et al., 2020 [29] | μ-RS/FT-IR | PDL | 0 | 3 | range 13–22 |
| Assignment Mode | Peak Position Raman (cm−1) | Peak Position FT-IR (cm−1) | ||||||
|---|---|---|---|---|---|---|---|---|
| 0 | 2 | 7 | 14 | 0 | 2 | 7 | 14 | |
| PO2− asymmetric stretching C-O-P stretching | 1239 | |||||||
| Amide III (β-sheet) | 1243 | 1245 | 1247 | 1252 | ||||
| Amide III (random coil) | 1258 | 1265 | 1266 | 1273 | ||||
| Amide III (α-helix) | 1309 | 1307 | 1310 | 1307 | ||||
| CH2 | 1450 | 1455 | ||||||
| Amide II | 1544 | |||||||
| Amide I (310-helix; β-sheet) | 1617 | 1619 | 1618 | 1621 | 1631 | |||
| Amide I (α-helix) | 1642 | 1643 | 1641 | 1642 | 1650 | |||
| Amide I (β-turn) | 1668 | 1662 | 1661 | 1666 | 1661 | |||
| Amide I (β-sheet) | 1695 | 1687 | 1690 | 1695 | 1673 | |||
| CH2 asymmetric stretching | 2875 | 2926 | ||||||
| CH3 symmetric stretching | 2930 | 2873 | ||||||
| CH3 asymmetric stretching | 2970 | 2960 | ||||||
| Assignment Mode | Peak Position SERS (cm−1) | Peak Position Raman (cm−1) | Peak Position FT-IR (cm−1) | |||||||||
|---|---|---|---|---|---|---|---|---|---|---|---|---|
| 0 | 2 | 7 | 14 | 0 | 2 | 7 | 14 | 0 | 2 | 7 | 14 | |
| S–S bond stretching | 465 | |||||||||||
| Phenylalanine | 621 | |||||||||||
| Tyrosine | 825 | |||||||||||
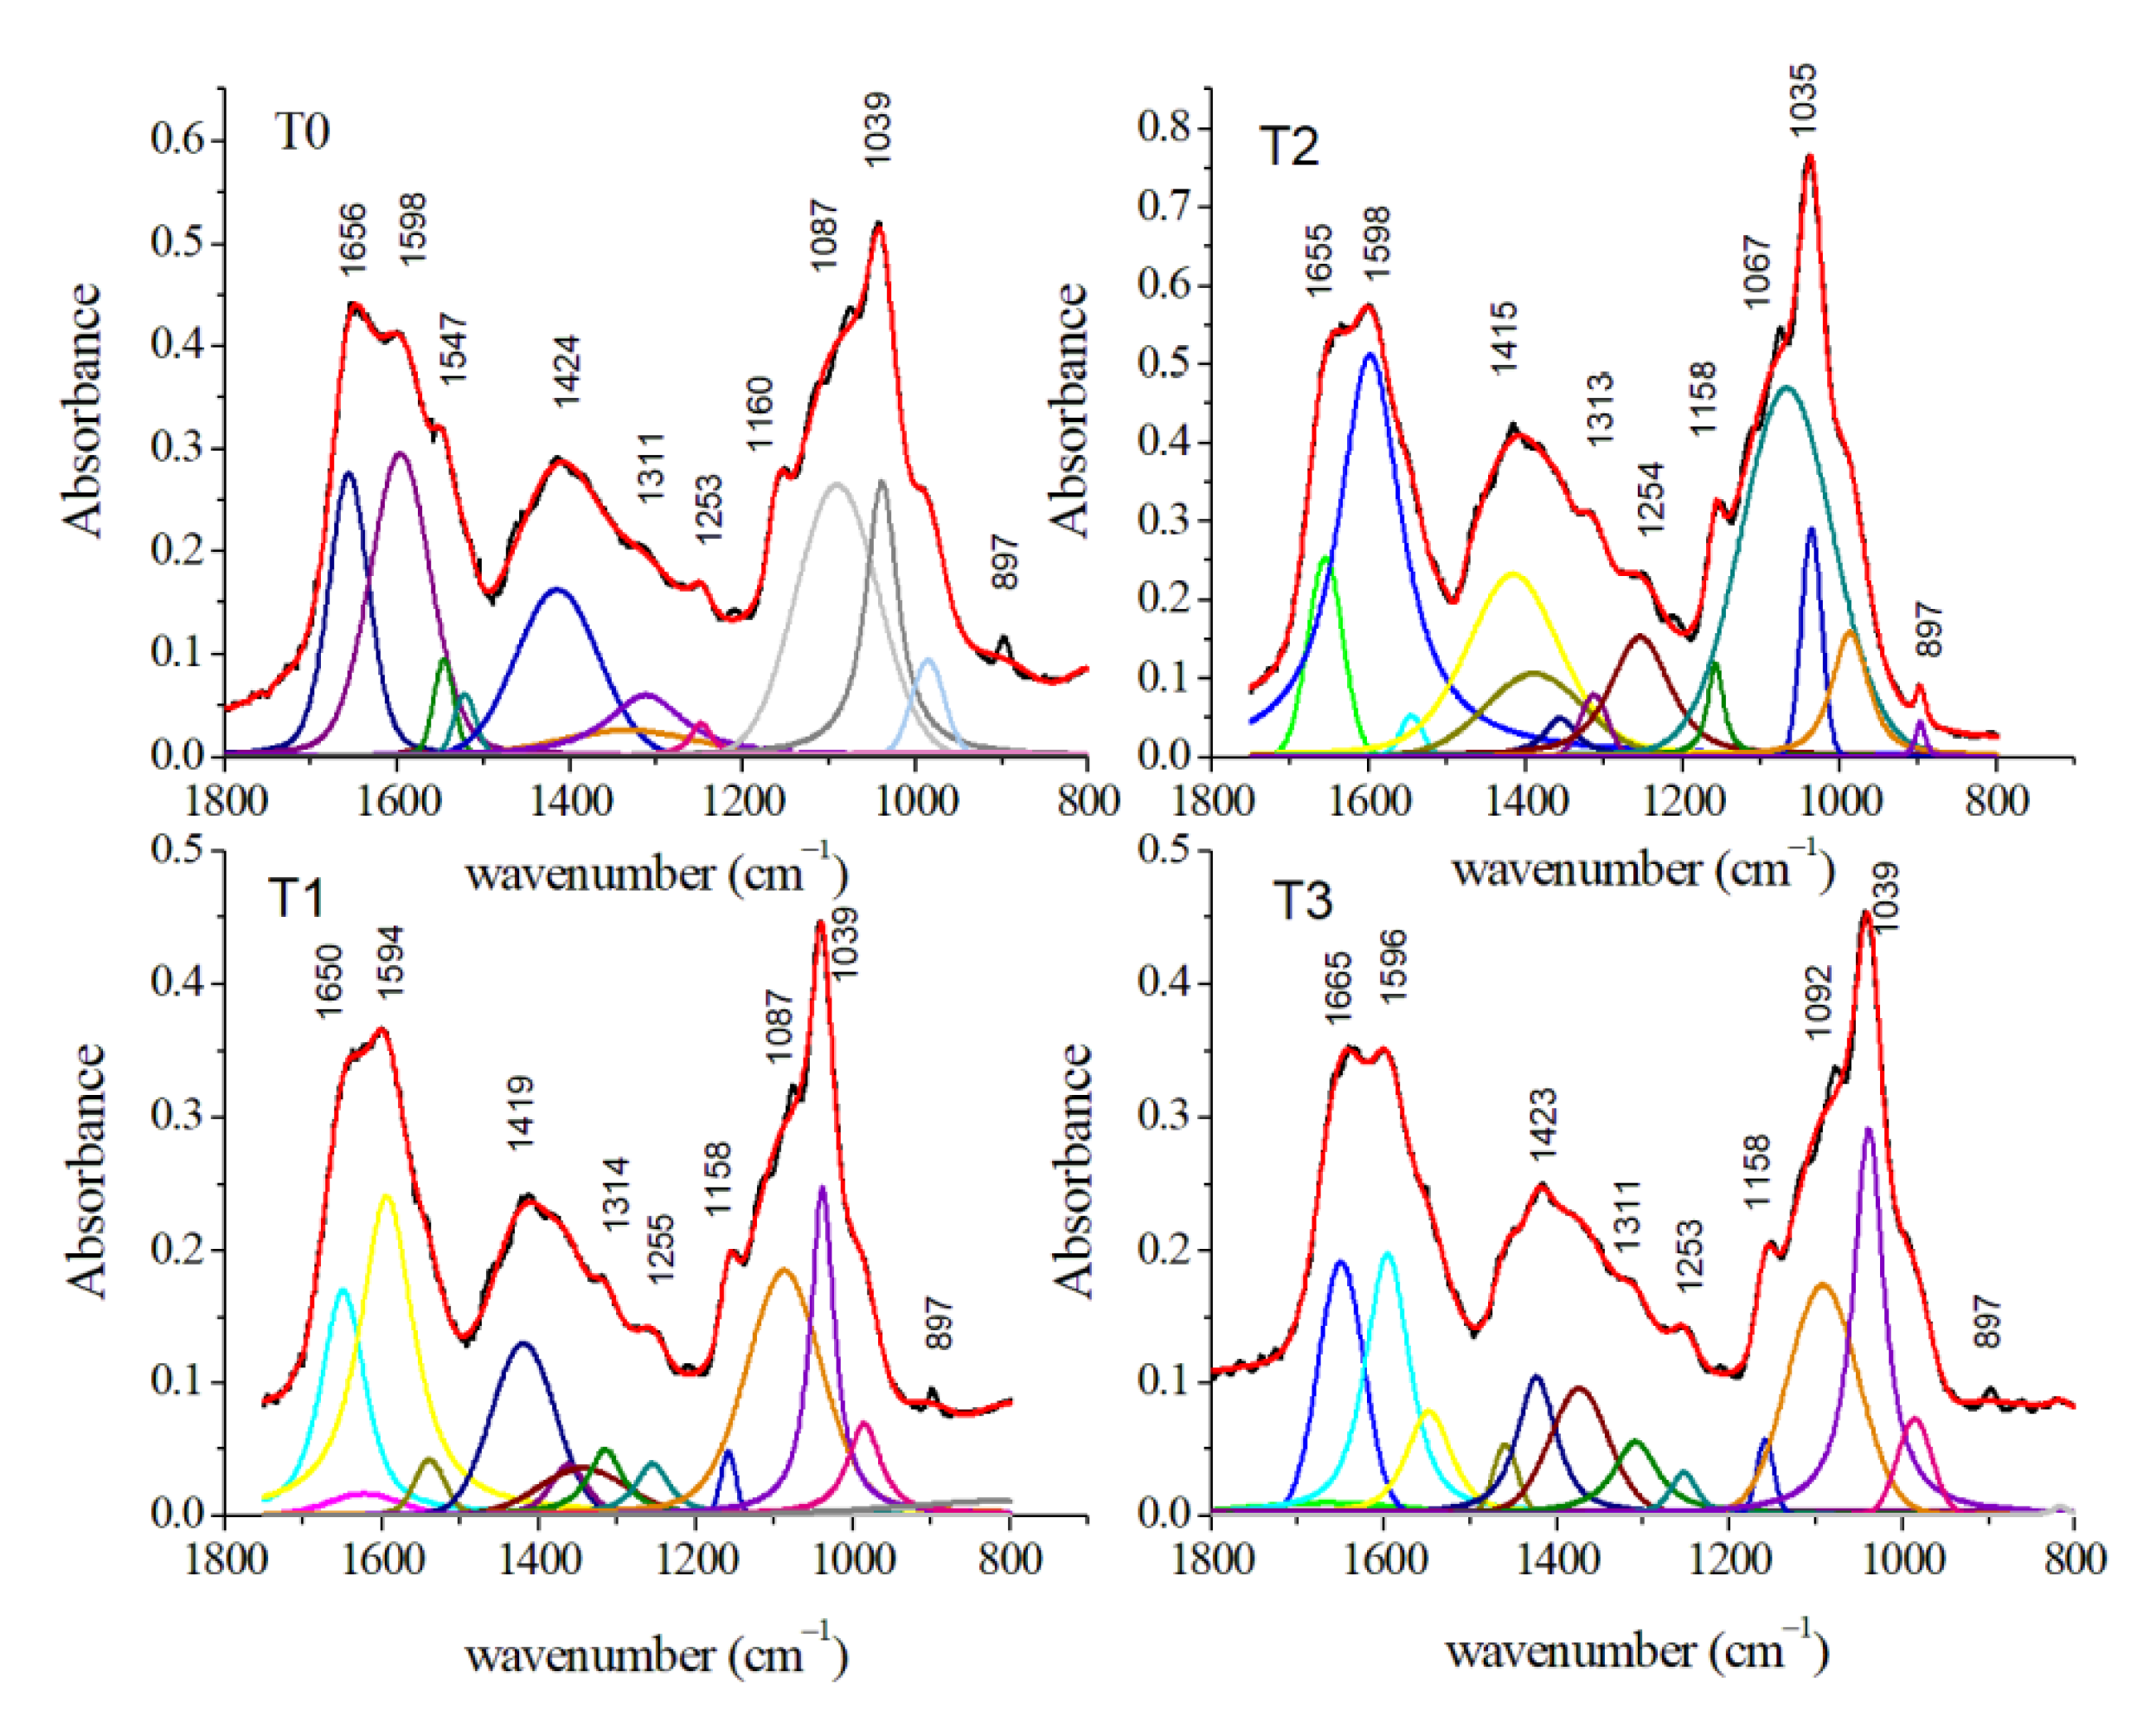
| Deoxyribose bending CO2H of tyrosine | 895 | 897 | ||||||||||
| PO43− | 946 | |||||||||||
| PO43− ν1 symmetric stretching, apatite | 984 | 985 | 986 | 986 | ||||||||
| C–H bending phenylalanine | 1007 | 1002 | ||||||||||
| C–O stretching of carbohydrates | 1039 | 1038 | 1035 | 1039 | ||||||||
| symmetric PO2− stretching of nucleic acids | 1087 | 1087 | 1067 | 1092 | ||||||||
| Nucleic acid base PO2− | 1100 | 1100 | ||||||||||
| C–O asymmetric stretching and COH bending of lipids | 1160 | 1158 | 1158 | 1158 | ||||||||
| Cytochrome | 1167 | 1167 | 1167 | |||||||||
| Nucleic acid C–N | 1176 | 1176 | ||||||||||
| Amide III | 1242 | 1242 | 1242 | |||||||||
| PO2− asymmetric stretching of nucleic acids | 1253 | 1255 | 1254 | 1253 | ||||||||
| Amide III, CH2 deformation | 1276 | 1280 | ||||||||||
| CH2/CH3 twisted | 1311 | 1314 | 1313 | 1308 | ||||||||
| Adenine/guanine of nucleic acids | 1348 | 1348 | 1348 | 1345 | 1345 | 1345 | ||||||
| symmetric bending of CH3 of nucleic acids | 1376 | 1361 | 1388 | 1384 | ||||||||
| Cytochrome | 1390 | |||||||||||
| COO– stretching of aminoacids | 1424 | 1419 | 1415 | 1423 | ||||||||
| CH3 symmetric stretching CH2 lipids/proteins scissoring | 1462 | 1459 | ||||||||||
| CH2 | 1470 | |||||||||||
| Carotene | 1540 | 1540 | ||||||||||
| Amide II (N–H bending of proteins) | 1547 | 1539 | 1545 | 1548 | ||||||||
| Amide II/cytochrome | 1577 | 1575 | 1577 | 1577 | 1577 | |||||||
| C=C stretching of amino acids | 1598 | 1594 | 1598 | 1596 | ||||||||
| Amide I (β-sheet) | 1625 | 1625 | 1611 | |||||||||
| Amide I (α-helix) | 1641 | 1640 | 1640 | |||||||||
| C=O stretching of proteins (Amide I band) | 1656 | 1650 | 1655 | 1655 | ||||||||
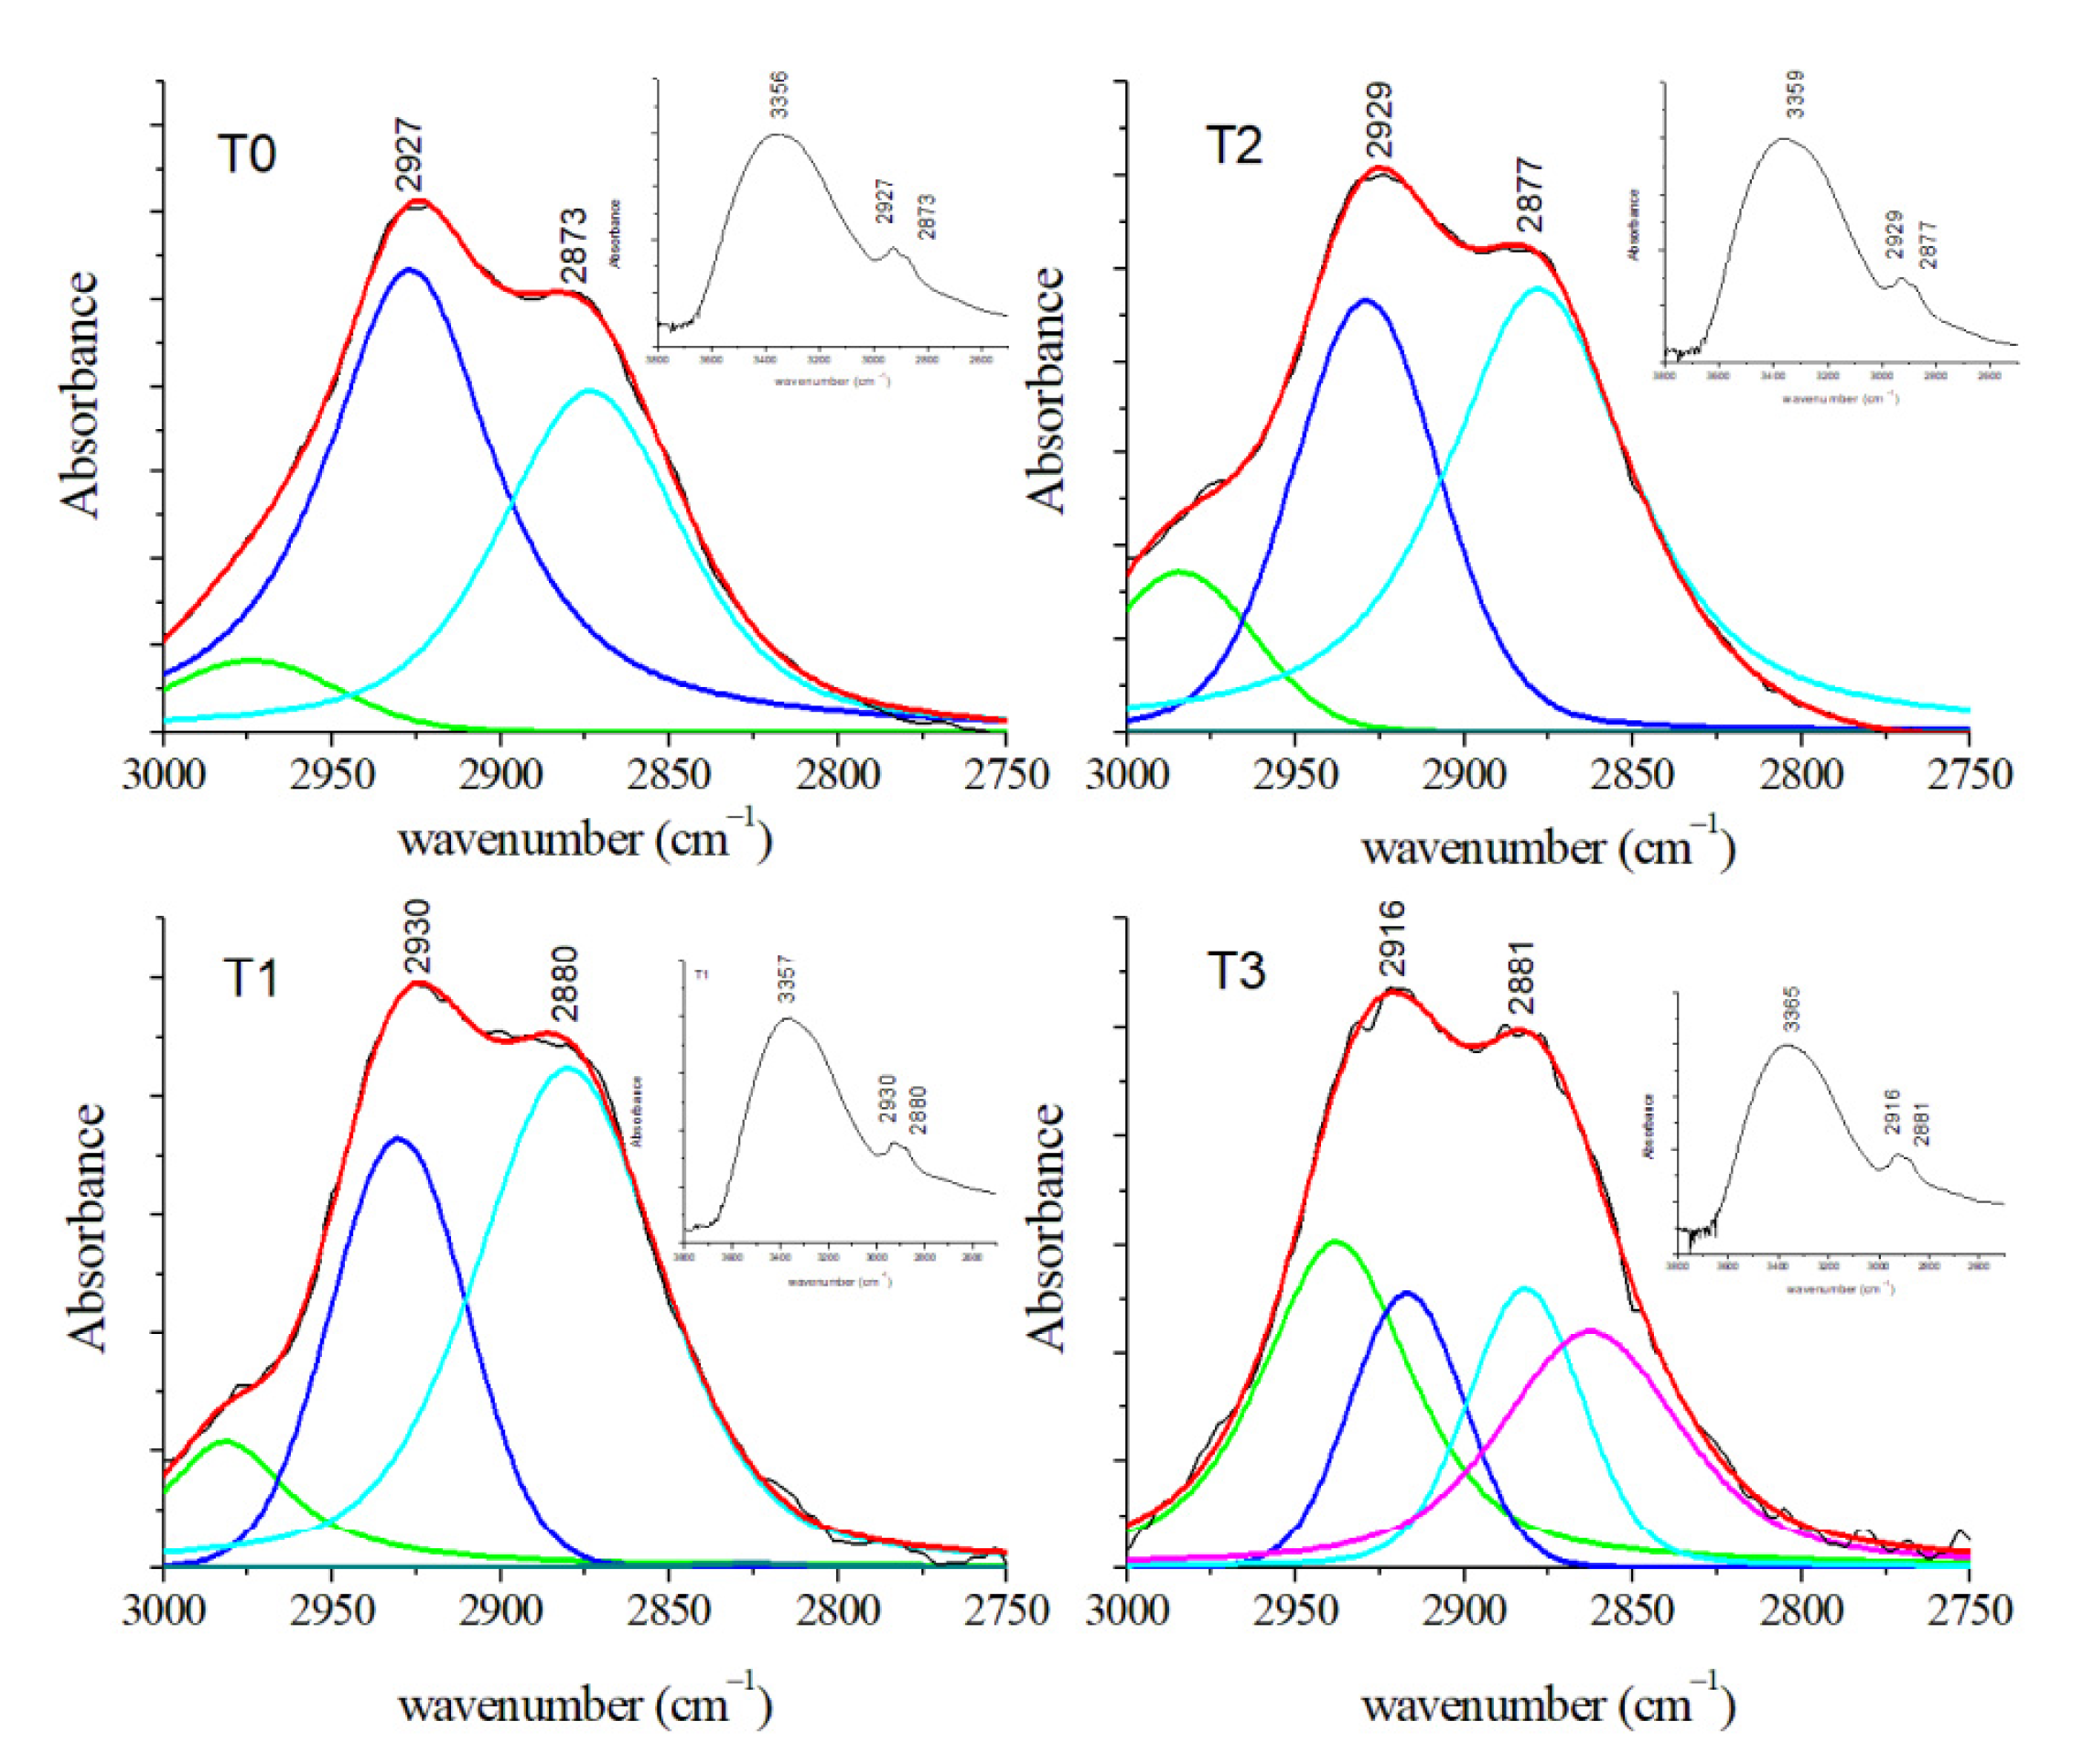
| CH3 symmetric stretching of lipids | 2873 | 2880 | 2877 | 2881 | ||||||||
| CH2 asymmetric stretching of lipids | 2927 | 2930 | 2929 | 2916 | ||||||||
| CH3 asymmetric stretching of lipids | 2974 | 2981 | 2984 | 2937 | ||||||||
| NH stretching of Amide A OH stretching | 3356 | 3357 | 3359 | 3365 | ||||||||
Publisher’s Note: MDPI stays neutral with regard to jurisdictional claims in published maps and institutional affiliations. |
© 2021 by the authors. Licensee MDPI, Basel, Switzerland. This article is an open access article distributed under the terms and conditions of the Creative Commons Attribution (CC BY) license (https://creativecommons.org/licenses/by/4.0/).
Share and Cite
d’Apuzzo, F.; Nucci, L.; Delfino, I.; Portaccio, M.; Minervini, G.; Isola, G.; Serino, I.; Camerlingo, C.; Lepore, M. Application of Vibrational Spectroscopies in the Qualitative Analysis of Gingival Crevicular Fluid and Periodontal Ligament during Orthodontic Tooth Movement. J. Clin. Med. 2021, 10, 1405. https://doi.org/10.3390/jcm10071405
d’Apuzzo F, Nucci L, Delfino I, Portaccio M, Minervini G, Isola G, Serino I, Camerlingo C, Lepore M. Application of Vibrational Spectroscopies in the Qualitative Analysis of Gingival Crevicular Fluid and Periodontal Ligament during Orthodontic Tooth Movement. Journal of Clinical Medicine. 2021; 10(7):1405. https://doi.org/10.3390/jcm10071405
Chicago/Turabian Styled’Apuzzo, Fabrizia, Ludovica Nucci, Ines Delfino, Marianna Portaccio, Giuseppe Minervini, Gaetano Isola, Ismene Serino, Carlo Camerlingo, and Maria Lepore. 2021. "Application of Vibrational Spectroscopies in the Qualitative Analysis of Gingival Crevicular Fluid and Periodontal Ligament during Orthodontic Tooth Movement" Journal of Clinical Medicine 10, no. 7: 1405. https://doi.org/10.3390/jcm10071405
APA Styled’Apuzzo, F., Nucci, L., Delfino, I., Portaccio, M., Minervini, G., Isola, G., Serino, I., Camerlingo, C., & Lepore, M. (2021). Application of Vibrational Spectroscopies in the Qualitative Analysis of Gingival Crevicular Fluid and Periodontal Ligament during Orthodontic Tooth Movement. Journal of Clinical Medicine, 10(7), 1405. https://doi.org/10.3390/jcm10071405