1. Introduction
The objective of this paper is to investigate opportunities for producing compressed hydrogen using proton-conducting membranes via electrochemical hydrogen compression (EHC). Two classes of proton-conducting electrolytes are compared. One, based on a polymer electrolyte (e.g., Nafion), operates at low temperature (e.g., <100
C), usually needs precious-metal charge-transfer catalysts, and requires a pure, moist, H
feed stream [
1]. The other class, based on protonic-ceramic electrolyte membranes (e.g., yttrium-doped barium zirconates, BZY), operates at high temperature (e.g., 600
C), can use Ni-based catalysts, and can operate on a moist hydrocarbon feed stream [
2,
3,
4,
5,
6,
7,
8,
9]. In addition to electrochemical compression, both membrane technologies are being developed into fuel cells and electrolyzers [
10].
The present paper develops a thermodynamic analysis that predicts comparative process performance. As in all compression technology, compression should be accomplished at temperatures as low as possible and under conditions as close to isothermal as possible. Because the polymer-based systems operate at significantly lower temperatures than the protonic-ceramic systems do, the polymer systems offer inherently higher compression efficiencies. However, the polymer-membrane systems require precious-metal catalysts and pure hydrogen feed streams. Operating at high temperature, protonic-ceramic systems can operate with hydrocarbon fuels and enable internal reforming using Ni-based electrodes. However, because of the relatively low compression efficiencies, protonic-ceramic compressors are likely more viable for relatively low compression ratios.
1.1. Current Hydrogen Production
Currently, hydrogen is produced on industrial scales using steam methane reforming (SMR) [
11]. Hydrogen is primarily used for ammonia production and petroleum processing [
12]. Steam electrolysis and other approaches contribute only a small fraction of the greater than 60 tons of hydrogen that are produced annually. It is reasonable to expect that even greater hydrogen production will be needed as the world trends to hydrogen-based energy economies [
13,
14,
15,
16,
17]. For current fuel-cell automobiles to achieve ranges comparable to internal combustion engines, fuel-cell vehicles carry hydrogen tanks at 700 bar [
18]. To fuel cars at 700 bar, the filling-station storage tanks must be at even higher pressures.
Figure 1 illustrates the three major steps (fuel reforming, separation, and compression) involved in producing compressed hydrogen at the industrial scale. The hydrogen is produced by catalytic steam methane reforming (CH
+ H
O ⇌ 3H
+ CO), which is endothermic and requires temperatures near 600
C. To further increase H
yield, the reformer is typically followed by water-gas shift (WGS) reactors (CO + H
O ⇌ H
+ CO
) where the carbon monoxide is further oxidized to produce H
and CO
in the presence of excess steam [
19]. Even with the shift reactors, the hydrogen may not be sufficiently pure. Hydrogen separation can be accomplished using pressure-swing-adsorber (PSA) technology. Palladium membranes may also be used for hydrogen separation, although they can be susceptible to CO poisoning [
20,
21,
22,
23]. Compression is usually accomplished with reciprocating or rotating mechanical compression [
13].
The overall H
-production process suffers some inherent inefficiencies due to the large number of process steps [
19]. Hydrogen production by SMR generally requires approximately 46 kWh kg
at 72% efficiency [
17]. The efficiency can easily vary from 60 to 80% based on specific circumstances such as operating conditions, efficiency definition, and heat recovery options, however the majority of the efficiency losses occur in the reforming [
24,
25,
26,
27]. A fraction of the fuel must be burned to heat the catalytic reformer to support the endothermic reforming. The PSA process requires multiple vessels to alternate between adsorbing and desorbing contaminants. Pressurizing and purging the vessels demands additional overhead. Nordio et al. [
28] compared a low temperature electrochemical hydrogen compressor to PSA technology and showed that electrochemical hydrogen compression was more worthwhile at small scales and elevated outlet hydrogen pressure. Mechanical compressors have significant maintenance costs, and can be noisy. The maintenance to avoid leaks has been estimated to be 90% of the overall maintenance costs [
1,
29]. While mechanical compressors may have problems, they are mature and commercially available [
17].
1.2. Proton-Conducting Membranes
Electrochemical hydrogen compression offers a potentially viable and cost-competitive alternative to mechanical compression. Operation requires low-voltage, direct-current, electrical energy to polarize the proton-conducting membrane. As such, integration with renewable sources such as photovoltaics may be attractive. Current electrochemical compression devices are based on polymer electrolyte membranes (PEM) that operate around 100
C. PEM membranes are relatively mature, especially for fuel cells [
1]. PEM-based electrochemical compressors operate at efficiencies that are comparable to the best mechanical compressors [
17]. In principle, they can be more reliable and do not suffer problems such as oil contamination [
17,
28]. Nevertheless, there are practical considerations, including hydrogen back-diffusion, Ohmic (resistive) losses, inlet purity, water management, catalyst performance, and material costs [
17].
Compared to polymer membranes, protonic ceramics are far less mature. The proton-ceramic membranes are doped perovskites, such as yttrium-doped barium zirconates and cerates [
10,
30,
31,
32,
33,
34]. While they are called proton conductors, these materials in fact are mixed ionic-electronic conductors (MIEC). The most studied protonic ceramics are yttrium-doped solid solutions of barium cerate/zirconate, which combine stability and satisfactory protonic conductivity [
35,
36]. These materials typically have three mobile charged defects—protons OH
, oxygen vacancies
, and small polarons
[
31]. In operation for electrochemical compression, the proton transport is dominant. Nevertheless, there can be some electronic leakage via small polarons [
33].
Protonic defects OH
may be incorporated into the perovskite lattice via steam dissociation or directly from H
as
Once incorporated in the lattice, proton transport proceeds via the Grotthuss mechanism [
37,
38].
Most applications using protonic ceramics require operation within a furnace to maintain the membrane at operating temperature (500–800
C). During polarization, Ohmic and Faradaic heating represent energy sources that help to heat the membrane [
39].
2. Compression Thermodynamics
The present thermodynamics study is based on some significant idealizations and assumptions. Thus, the results should be understood as providing quantitative insights, but subject to limiting-case approximations. The study considers isothermal (constant temperature) and isentropic (constant entropy) compression. By definition, isothermal compression operates at constant temperature, but must reject a large amount of heat. Isentropic compression produces no entropy, but the temperature increases greatly. Any real process is bounded by these limiting cases.
At sufficiently high pressures, the ideal-gas law becomes inaccurate. The present analysis compares performance using ideal-gas and real-gas Helmholtz equations of state. Todd et al. [
40] investigated the thermodynamics of high-temperature and high-pressure water electrolysis using high-fidelity non-ideal equations of state.
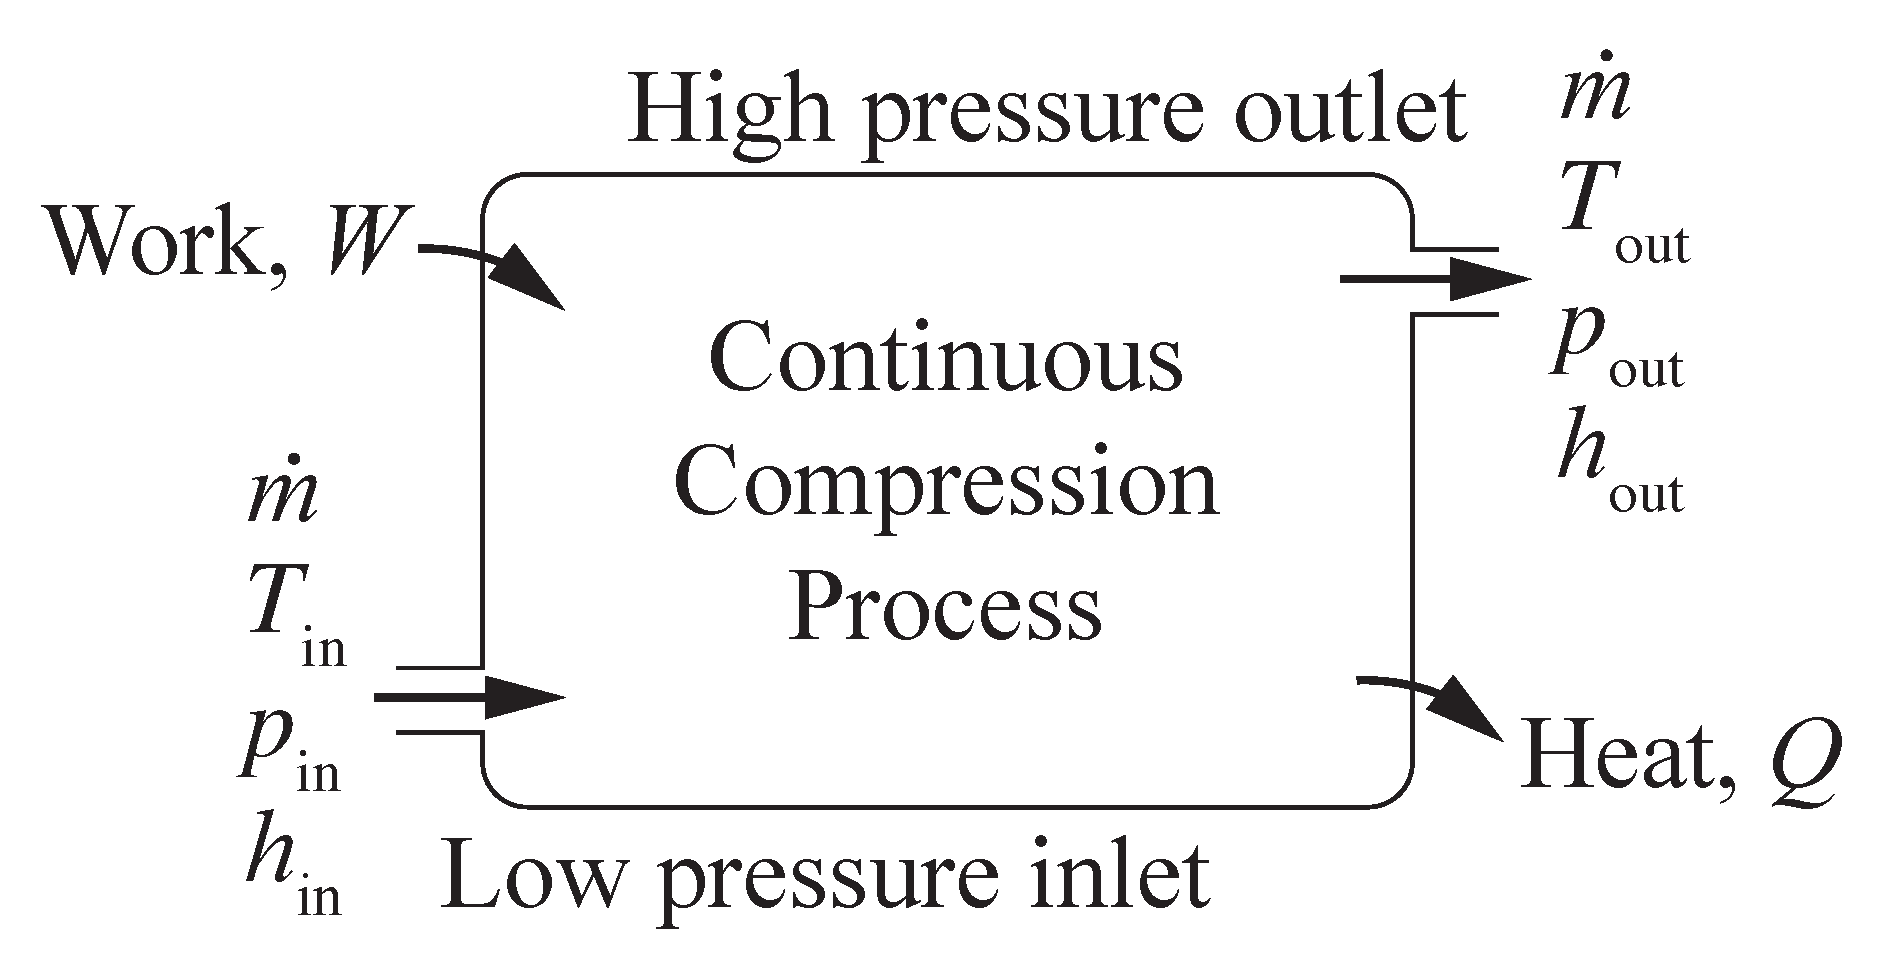
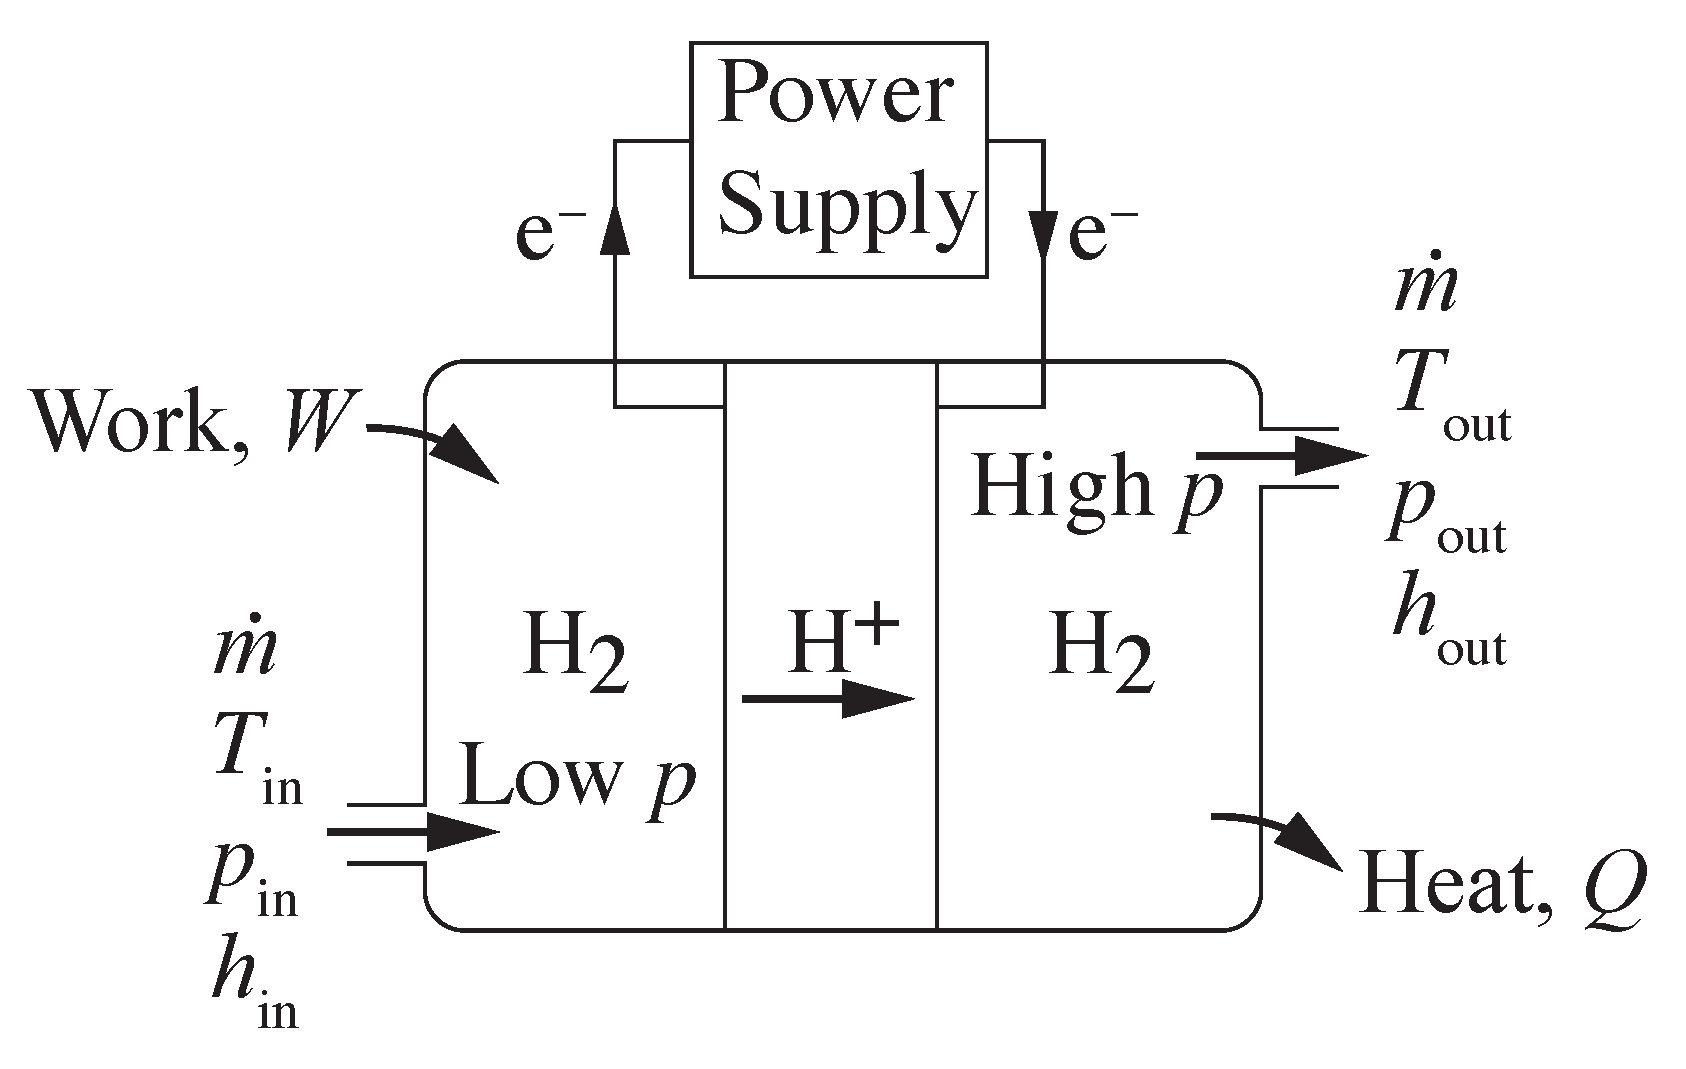
Figure 2 illustrates a generic, steady-state, compression process, with hydrogen entering at low pressure and exiting at high pressure. Flow enters the compressor at temperature
, pressure
, and mass flow rate
. The outlet stream of hydrogen exits at temperature
, pressure
, and the same mass flow rate
(kg s
). The energy associated with the hydrogen compression is represented through enthalpy
h (kJ kg
). Work
(kW) is done on the system to increase the pressure. Heat
(kW) is transferred from the process to the environment. The steady-state energy balance for the open flowing system may be represented as
The energy balance can be normalized by the mass flow rate, where
w (kJ kg
) is the intensive work done on the system and
q (kJ kg
) is the intensive heat transfer out of the system. Assuming the idealization of reversible heat transfer, the second law of thermodynamics provides that
The specific work
w may be evaluated as
, where
is the specific volume,
J mol
K
, and
is the molecular weight. For equations of state other than ideal gas, analytically integrating
may be difficult. Thus, evaluating the work as a function of end states, as in Equation (
4), can be advantageous.
2.1. Isothermal Compression
Assuming isothermal operation, because
h is a function of temperature alone for an ideal gas, Equation (
4) reveals that the work is only a function entropy alone. For an ideal gas, the
integral can be evaluated in terms of pressure end states as
Real gas properties are evaluated with Engineering Equation Solver (
http://www.fchart.com/ees/) using the Helmholtz equation of state as described by Leachman et al. [
41]. The compression work is evaluated in terms of the enthalpy and entropy end states. In practical applications, hydrogen may be compressed to pressures as high as 1000 bar. At these pressures, the ideal-gas equation of state is inaccurate.
Figure 3 compares the specific work needed to compress H
isothermally from atmospheric pressure to pressures up to 1000 bar. The specific work needed at 100
C is much lower than that needed to compress at 600
C. Real-gas effects at high pressure increase the needed work compared to ideal-gas behavior. However, although perhaps not negligible, the real-gas effects are not great. At 1000 bar, the difference between ideal-gas and real-gas equations of state (EOS) reaches about 0.2 kWh kg
.
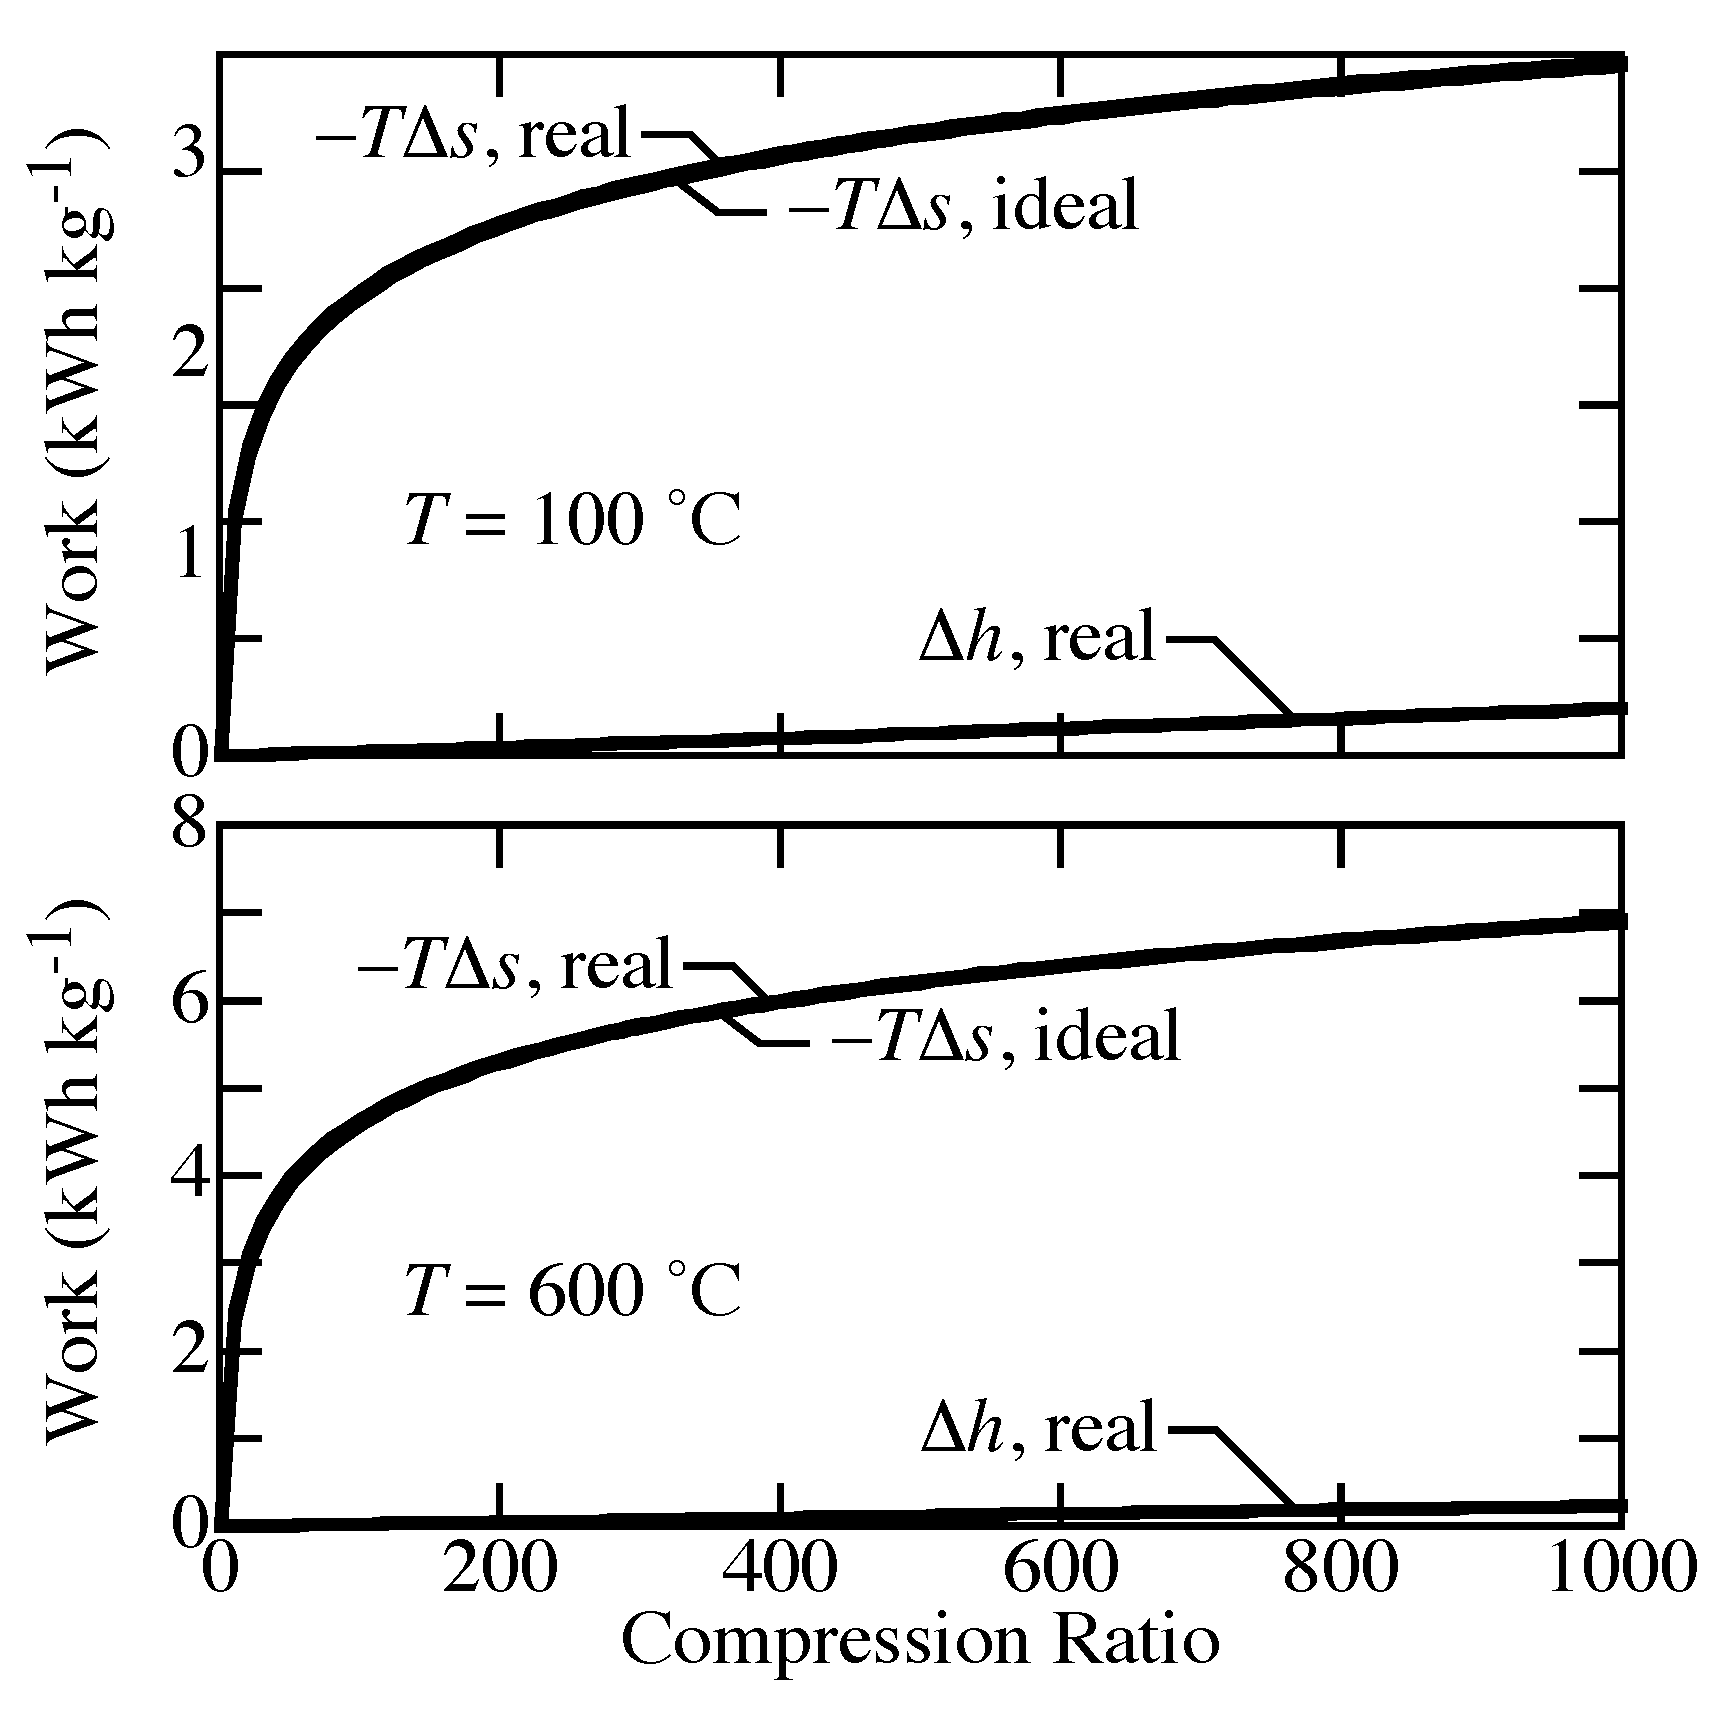
The differences between ideal-gas and real-gas effects on compression work can be described by the relative differences in entropy
and enthalpy
.
Figure 4 shows that
is nearly the same for both equations of state. The differences in work are caused primarily by
. For an ideal gas, the enthalpy depends on temperature alone, so
for isothermal compression. However, real-gas behavior includes the effect of pressure on enthalpy, which directly affects the work.
To maintain isothermal compression, a great deal of heat must be removed. In fact, most of the work put into the system leaves as heat. As a practical matter, removing heat effectively can be technologically challenging. Interstage cooling is often used to approximate isothermal conditions.
2.2. Isentropic Compression
Isentropic compression is accomplished conceptually by assuming a perfectly reversible and insulated process. Under such conditions, the compression work may be represented as
where the specific volume
is evaluated at the inlet entropy and pressure.
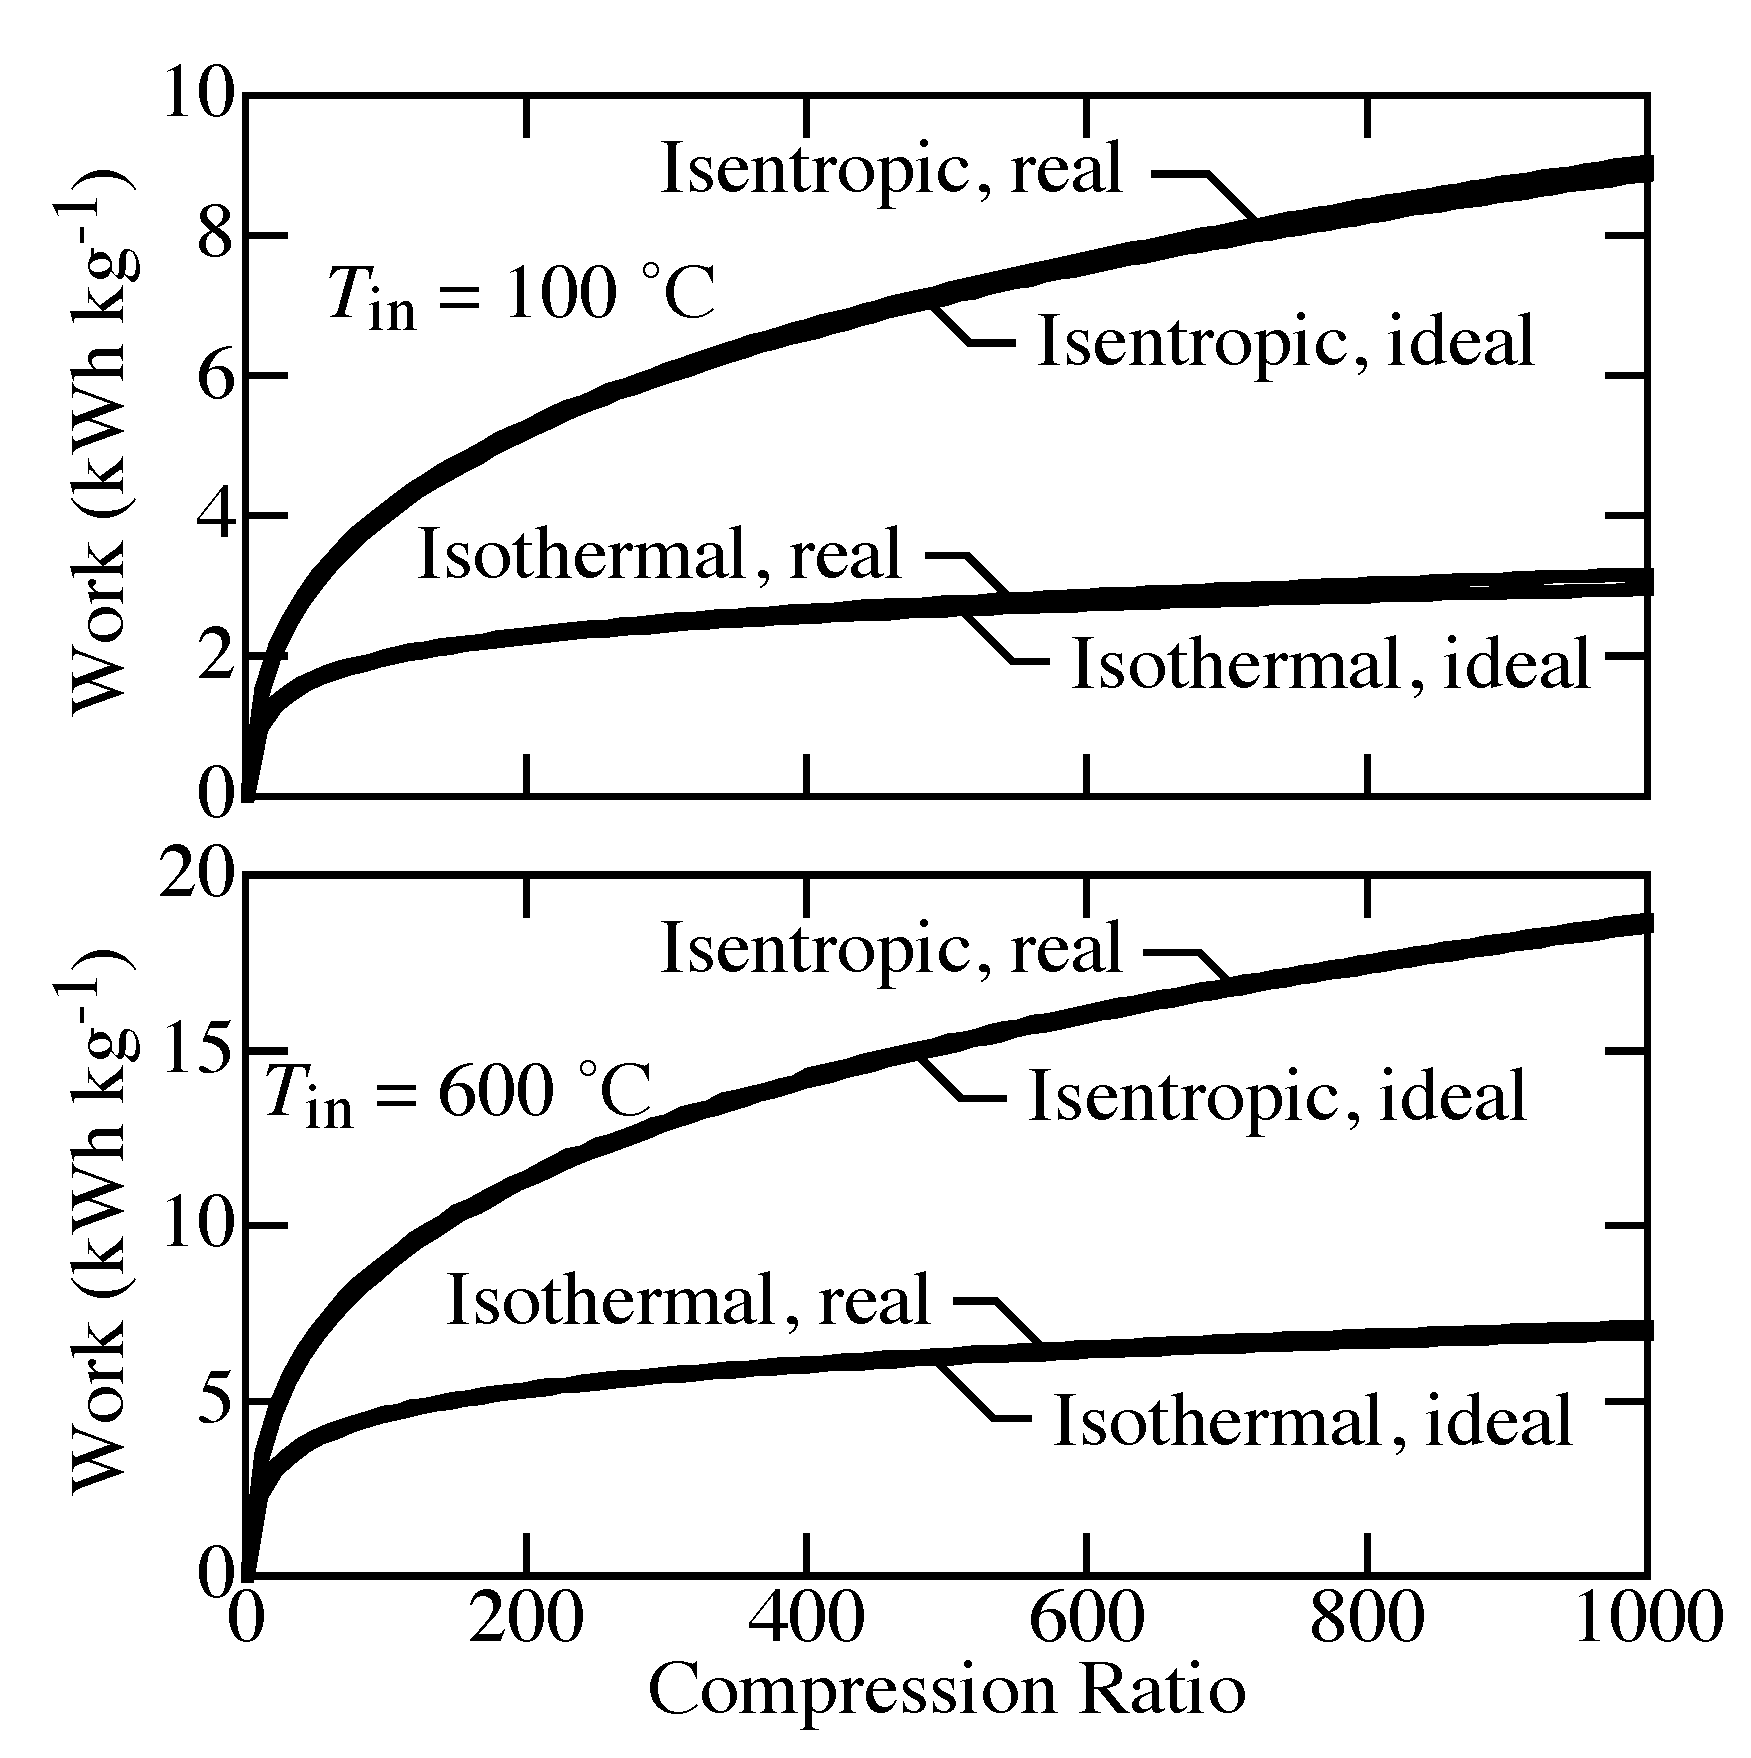
Figure 5 shows differences between the ideal isentropic and isothermal compression. The real-gas EOS plays only a small role. The compression work for isentropic compression is much larger than it is for isothermal compression. The work depends strongly on temperature. For isentropic compression, the temperature must increase to keep the process adiabatic.
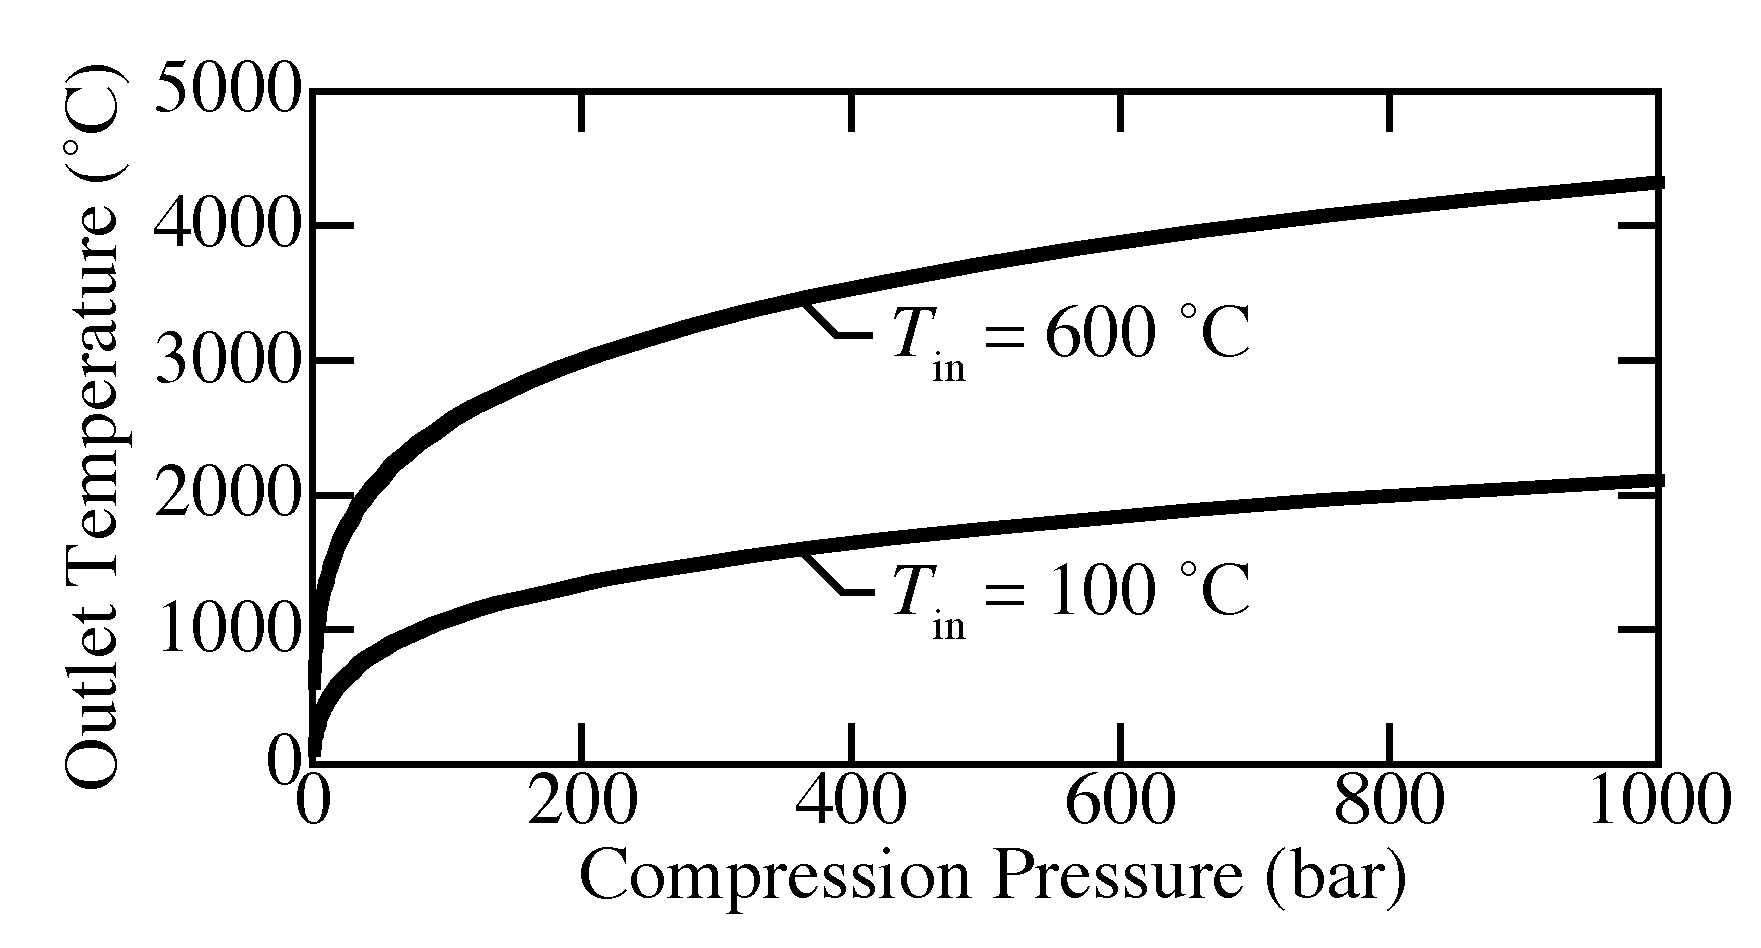
Figure 6 shows the outlet temperature as a function of compression pressure where the inlet is 100
C or 600
C and 1 bar. The ideal-gas equation of state and the Helmholtz equation of state predict nearly the same outlet temperature (overlapping in the figure). Isentropic compression causes unreasonable increases in temperature. For compression from 1 to 200 bar, the outlet temperature already exceeds 1000
C for inlet temperature of both 100
C and 600
C. In other words, the ideal isentropic compression is practically unachievable.
3. Electrochemical Compression
Figure 7 illustrates an electrochemical hydrogen compressor using a polarized proton conducting membrane. The protons crossing the membrane must be balanced by the electrical current supplied by an external circuit. The flow of hydrogen through a proton conducting compression system must be equal to the net transport of protons through the membrane. The required electrical current
I may be evaluated as
where
is the rate of hydrogen being compressed,
is the number of electrons per mole of hydrogen,
C kmol
is the Faraday constant, and
= 2.016 kg kmol
is the molecular weight of hydrogen. The cell voltage may be evaluated as
where, assuming a pure proton conducting membrane,
is the open-circuit voltage (OCV) that may be evaluated as
The open-circuit voltage depends on the compression ratio and the operating temperature.
Figure 8 shows that the open circuit voltage increases as the temperature or compression ratio increases. Membranes operating at high temperature require higher voltage to reach the same compression ratio as membranes operating at low temperature.
The proton resistance across the membrane can be represented empirically in terms of an area specific resistance (ASR),
where
is the membrane area. Proton-conducting membranes typically have ASR ranging between 0.1
cm
and 1.0
cm
[
28,
35,
36,
42].
The voltage efficiency of electrochemical compression may be defined as
where operating at open-circuit voltage yields 100% voltage efficiency. However, at open-circuit voltage no compression is being accomplished.
The compression power can be evaluated as
By substituting Equations (
7), (
8), and (
10) into Equation (
12) the gravimetric power density or specific energy (kWh kg
) can be evaluated as
The compression specific energy (kWh per kg of H compressed) is directly proportional to the membrane ASR, the hydrogen mass flow rate , and inversely proportional to the membrane area. The effects of temperature and pressure enter via . ASR also depends on temperature and pressure, but those underlying physical processes are not directly incorporated into the present analysis. Rather, ASR is used as a parameter.
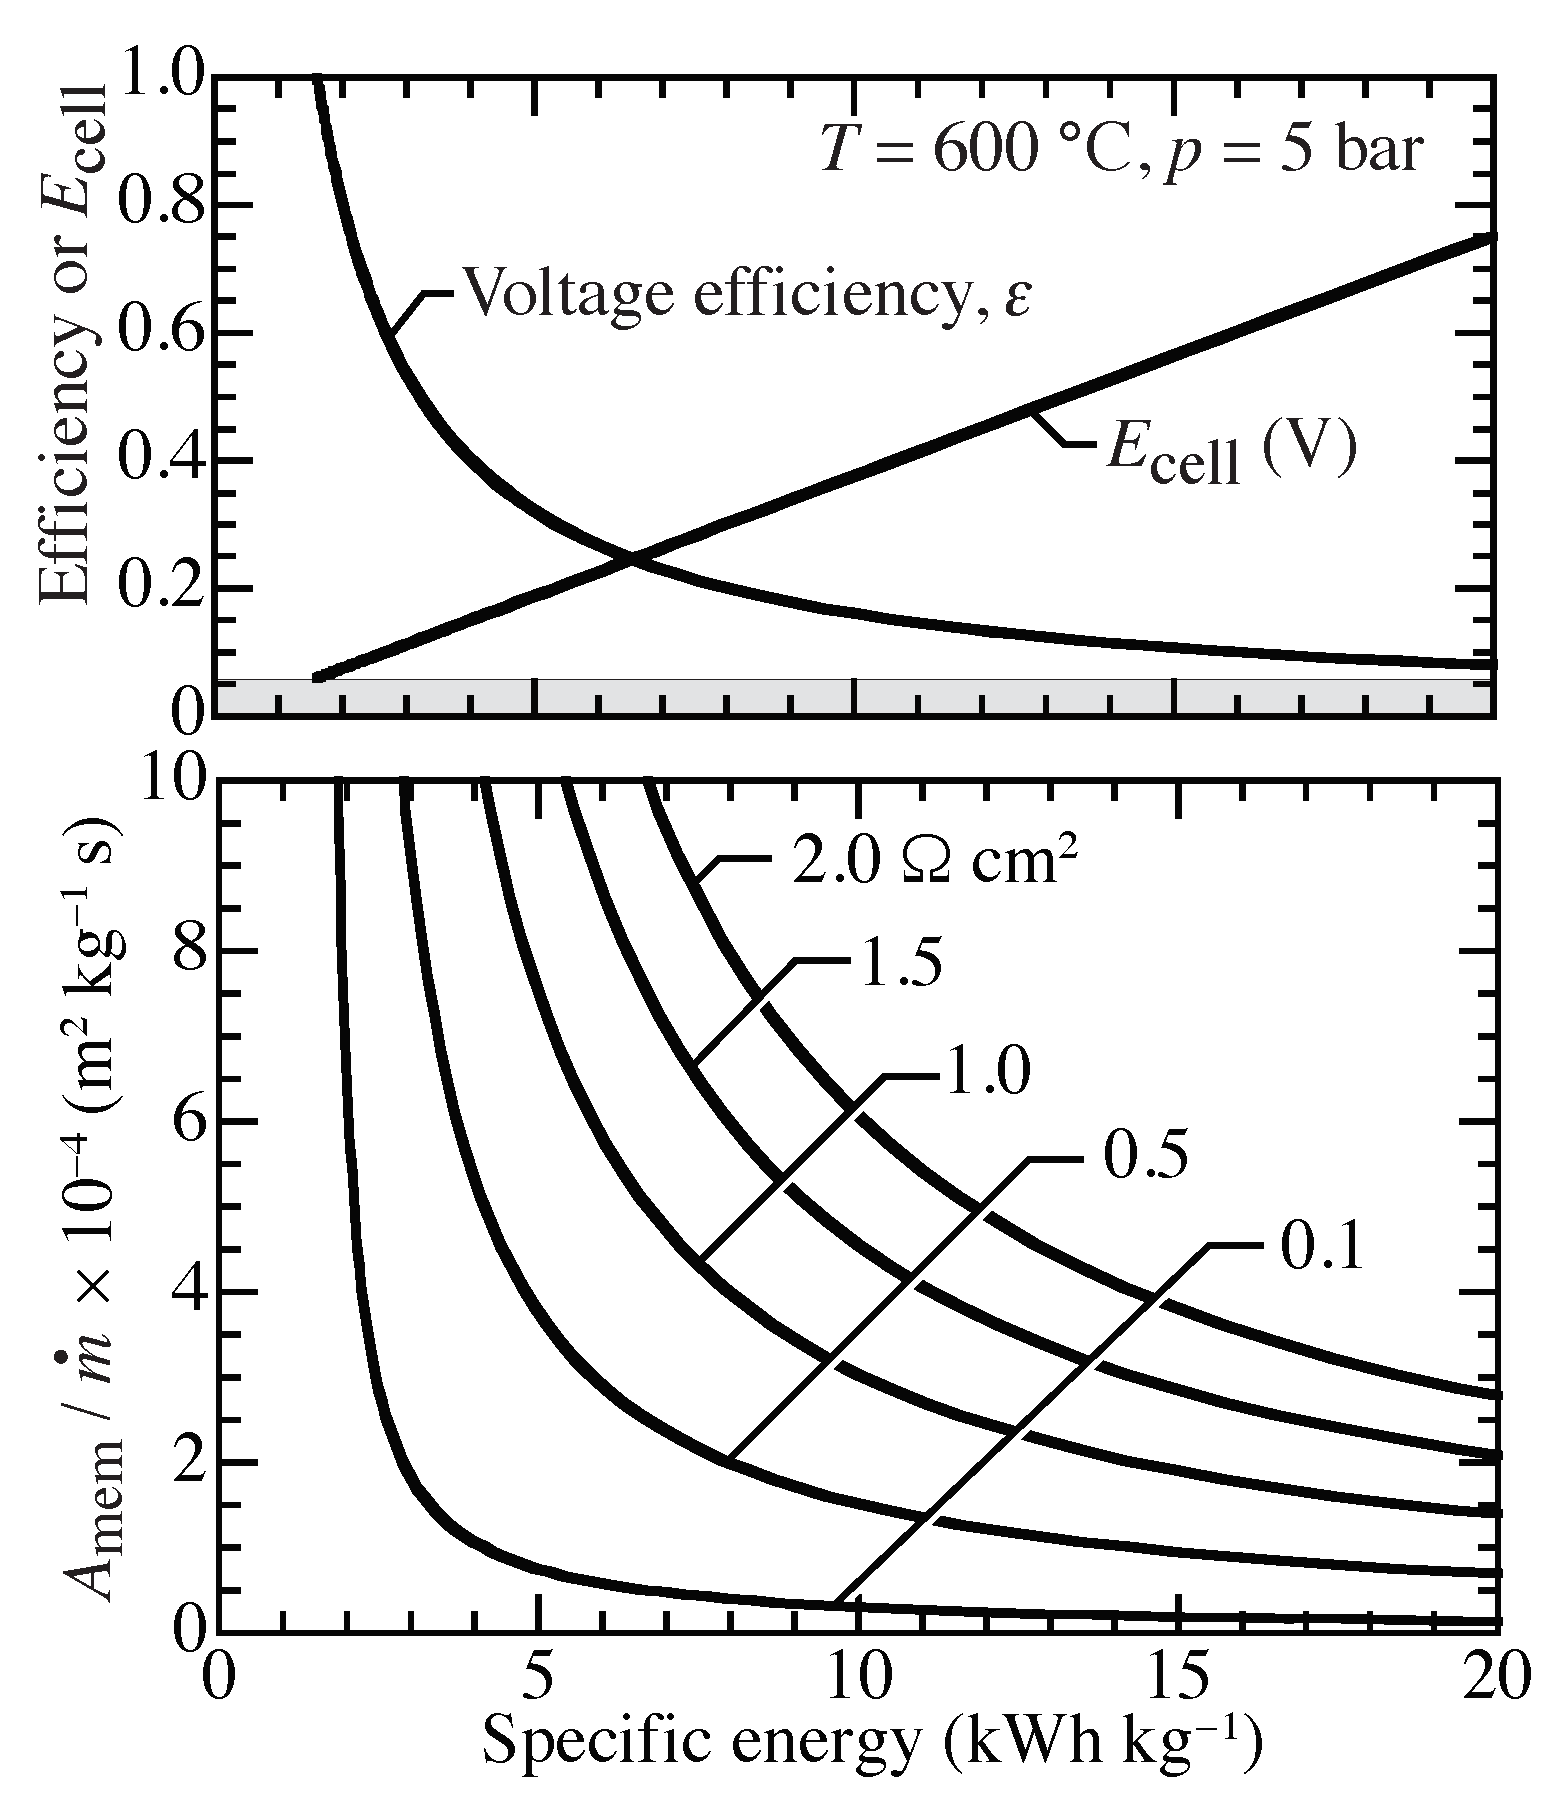
Assuming a compression ratio of 500,
Figure 9 graphically represents Equation (
13), showing relationships between cell voltage, voltage efficiency, and required membrane area as functions of specific energy. At 100
C, the conditions represent an isothermal PEM compressor. The 600
C case represents an isothermal protonic-ceramic compressor. The shaded region indicates the lower bound for operating voltage, or the OCV. Operating below the OCV allows hydrogen to be transported from the high pressure side to the low pressure side. The OCV is higher at higher temperature, causing the minimum specific energy to be higher at higher temperature.
The lower graphs of
Figure 9 can be used to evaluate the membrane area required to compress from 1 bar to 500 bar at two temperatures. Broadly speaking, practical compression energies are on the order of 10 kWh per kg of H
compressed. As is evident from
Figure 9, higher ASR membranes require significantly greater membrane areas, especially at lower compression energies. The operating cell voltage is a function of the specific energy, but is independent of membrane ASR. Voltage efficiency depends very weakly on ASR.
A typical polymer electrolyte membrane has an ASR on the order of 0.1
cm
[
28,
42]. For a 25
m thick membrane with conductivity of 4 mS cm
[
35,
36], a typical protonic-ceramic membrane has an ASR on the order of 1
cm
. The membrane area can vary by an order of magnitude for ranges of ASRs considered here. Lower ASR membranes consistently outperform higher ASR membranes in the sense that less energy and area are required for comparable compression. For an ASR of 0.1
cm
and a specific energy of 10 kWh kg
at 600
C, a specific membrane area of approximately
m
kg
s is required. In this example, increasing the ASR to 1.0
cm
requires approximately 7.5 times more membrane area.
High ASRs lead to large compression power requirements. High hydrogen mass flow rates demand high power for compression. The lowest possible power requirement occurs at OCV. However, near OCV the compression rates are small and the membrane areas are large. As membrane area decreases, more power is required to achieve comparable compression rates.
Case Study—Required Membrane Area for Low Compression Ratio
Assuming isothermal compression from 1 bar to 5 bar at 600
C,
Figure 10 shows the needed membrane area as a function of ASR and compression specific energy. For example, with a specific compression energy of approximately 10 kWh kg
and
cm
,
Figure 10 indicates a required specific membrane area of
m
kg
s. For a target of 10 kg per day (24 h) at 5 bar, the required membrane area would be approximately 1.74 m
. The membrane area could be implemented in planar, bipolar stacks. Assuming 100 cm
planar membranes, a 174 layer stack is needed. Assuming a nominal 3 mm per layer, such a stack would occupy a volume of approximately 10 × 10 × 52 cm
. Decreasing the ASR or reducing the compression temperature would greatly decrease the needed membrane area. Potential pathways for reducing ASR include decreasing membrane thickness and improving electrodes.
4. Steam Reforming
Steam reforming is a highly endothermic catalytic process (e.g., Ni catalyst) that is effective at temperatures around 600
C. Thus, the reforming temperatures are compatible with the temperatures used for protonic-ceramic membranes. Combining steam reforming with protonic-ceramic compression can synergistically and beneficially integrate three processes — fuel reforming, hydrogen separation, and hydrogen compression [
2]. The thermal energy needed to support the reforming endotherm can be supplied by the heating associated with proton transport through the membrane and heat of compression. The integrated process serves to assist maintaining process temperature and achieving isothermal compression.
The combination of steam-methane reforming (SMR) and water-gas shift (WGS) may be expressed globally as
The net energy required by SMR process includes heating the reactants (sensible and latent heat) and the enthalpy of reaction as
The heat of reaction may be evaluated by assuming full conversion according to the global reaction (Equation (
14)). Assume that the feed stream is heated from 25
C to 600
C. The heat of reaction for steam-methane reforming at 600
C is
Energy is required to heat the reactants from ambient conditions to reactor operating conditions. In the case of H
O, the energy requirement must consider the latent heat of vaporization as
The global SMR reaction (Equation (
14)) is written with the stoichiometric amount of H
O. However, as a practical matter, excess H
O is needed to avoid carbon deposits on the Ni catalysts [
43]. Typically, steam-carbon ratios of S/C = 2.5 or greater are needed to mitigate catalyst fouling.
For methane steam reforming, the coke-free chemistry may be represented globally as
In other words, the feed stream includes an additional mole of H
O, which must be elevated to the reactor process temperature. Considering S/C = 3.0,
Electrochemical compression through the protonic-ceramic membrane assembly produces heat, owing to Ohmic and Faradaic processes. Ohmic heat is associated with resistance to proton transport within the protonic-ceramic membrane. Faradaic heat is the result of polarization (overpotentials) associated with the charge-transfer process to incorporate protons into the membrane. The net area specific resistance (ASR), which empirically represents all these processes, depends on numerous design and fabrication details. The ASR for the yttrium-doped barium zirconates/cerates materials is on the order of ASR ≈ 1 cm.
Assuming
cm
and an electrical current density of
i = 1 A cm
, the heat flux (per membrane area) owing to membrane polarization and proton flux is
W cm
. Further assuming a Faradaic efficiency of approximately 100% (i.e., each electron supplied delivers one proton through the membrane), the net heat production can be evaluated as
If the membrane resistance were reduced to
cm
, then the net heat would be reduced to
Consider a methane feed stream with S/C = 3.0. The net heat required to support the SMR is
Thus, the system is approximately thermal-neutral when cm.
5. Process Integration and Staging
As the foregoing analysis shows, there are pros and cons associated with the low-temperature (polymer based) and the high-temperature (protonic-ceramic based) hydrogen compression. A combination of the two could perform better than either one alone. The thermodynamic analysis makes clear that low-temperature isothermal compression provides the highest compression efficiency. However, using polymer membranes at low temperature requires a pure H feed stream. At the commercial scale, such hydrogen is produced and purified in large-scale natural-gas reforming facilities. Delivering the pure H to distributed compression stations requires handling and transportation costs.
High-temperature compression is relatively inefficient, but offers other potential advantages. Assuming electricity and natural gas are readily available at distributed locations, the protonic-ceramic compressors could be used for integrated reforming, separation, and first-stage compression. The pure, lightly compressed H could then be delivered to a polymer-based compressor to achieve high-pressure compression. Assume, for example, that the protonic-ceramic compressor delivers 5-bar H. Assume further that the polymer-based compressor is to deliver 1000 bar H. With a 5-bar feed stream (compared to 1 bar), the compression ratio for the high-pressure compressor is reduced from 1000/1 to . Reducing the compression ratio by a factor of five can greatly increase the efficiency of the high-pressure compressor.
Integrating protonic-ceramic and polymer-based compression technology offers some potentially attractive benefits. In small-scale, distributed, facilities, such as filling stations, the feed streams can be pipeline natural gas and electricity. The protonic-ceramic unit delivers lightly compressed H to the polymer-based compressor, which compresses pure H to very high pressure. The integrated solid-state system would be efficient and quiet. The need to transport compressed hydrogen from central reforming plants would be eliminated.
Recently, Corgnale et al. [
1,
44] modeled an electrochemical hydrogen compressor upstream of a metal-hydride compressor, which proved to be a cost-effective compression process. The staged compressors enabled the metal hydride-compressor to operate with a lower compression ratio. The waste heat in the upstream compressor was diverted to the thermal metal-hydride compressor, which further improved efficiency.
6. Summary and Conclusions
This paper develops a thermodynamics analysis that serves as a basis for comparing low-temperature (polymer-based) electrochemical H compression with high-temperature (protonic-ceramic) electrochemical compression. While the ideal thermodynamics assumptions neglect many practical engineering issues, the limiting-case results provide great quantitative insight that can guide technology development. Combining the best features, polymer-based and protonic-ceramic compressors may offer pathways to cost-competitive, commercially viable, distributed, hydrogen-compression technology.
Author Contributions
Conceptualization, B.L.K. and R.J.K.; methodology, B.L.K., H.Z., R.J.B., and S.C.D.; software, R.J.B. and S.C.D.; validation, B.L.K., R.J.B. and S.R.; formal analysis, B.L.K., D.C., H.Z., and R.J.K.; investigation, B.L.K., D.C., and H.Z.; writing—original draft preparation, B.L.K.; writing—review and editing, R.J.K. and S.R.; supervision, S.C.D., R.J.K., and S.R.
Funding
This research was supported by the Colorado School of Mines Foundation via the Angel Research Fund.
Acknowledgments
The authors gratefully thank Christian Kjølseth and Per Vestre (CoorsTek Membrane Sciences), Rombout Swanborn and Albert Bos (HyET), and Grover Coors (Hydrogen Helix, SAS) for their insights and fruitful discussions.
Conflicts of Interest
The authors declare no conflict of interest.
References
- Sdanghi, G.; Maranzana, G.; Celzard, A.; Fierro, V. Review of the current technologies and performances of hydrogen compression for stationary and automotive applications. Renew. Sustain. Energy Rev. 2019, 102, 150–170. [Google Scholar] [CrossRef]
- Malerød-Fjeld, H.; Clark, D.; Yuste-Tirados, I.; Zanón, R.; Catalán-Martinez, D.; Beeaff, D.; Morejudo, S.; Vestre, P.; Norby, T.; Haugsrud, R.; et al. Thermo-electrochemical production of compressed hydrogen from methane with near-zero energy loss. Nat. Energy 2017, 2, 923–931. [Google Scholar] [CrossRef]
- Morejudo, S.; Zanón, R.; Escolástico, S.; Yuste-Tirados, I.; Malerød-Fjeld, H.; Vestre, P.; Coors, W.; Martínez, A.; Norby, T.; Serra, J.; et al. Direct conversion of methane to aromatics in a catalytic co-ionic membrane reactor. Science 2017, 353, 563–566. [Google Scholar] [CrossRef] [PubMed]
- Norby, T. Advances in Proton Ceramic Fuel Cells, Steam Electrolyzers, and Dehydrogenation Reactors Based on Materials and Process Optimizations. ECS Trans. 2017, 80, 23–32. [Google Scholar] [CrossRef]
- Ding, D.; Zhang, Y.; Wu, W.; Chen, D.; Liu, M.; He, T. A novel low-thermal-budget approach for the co-production of ethylene and hydrogen via the electrochemical non-oxidative deprotonation of ethane. Energy Environ. Sci. 2018, 11, 1710–1716. [Google Scholar] [CrossRef]
- Vasileiou, E.; Kyriakou, V.; Garagounis, I.; Vourros, A.; Stoukides, M. Ammonia synthesis at atmospheric pressure in a BaZr0.7Ce0.2Y0.1O2.9 solid electrolyte cell. Solid State Ionics 2015, 275, 110–116. [Google Scholar] [CrossRef]
- Kyriakou, V.; Garagounis, I.; Vourros, A.; Vasileiou, E.; Manerbino, A.; Coors, W.; Stoukides, M. Methane steam reforming at low temperatures in a BaZr0.7Ce0.2Y0.1O2.9 proton conducting membrane reactor. Appl. Catal. B-Environ. 2016, 186, 1–9. [Google Scholar] [CrossRef]
- Kyriakou, V.; Garagounis, I.; Vourros, A.; Marnellos, G.; Stoukides, M. A protonic ceramic membrane reactor for the production of hydrogen from coal steam gasification. J. Membr. Sci. 2018, 553, 163–170. [Google Scholar] [CrossRef]
- Deibert, W.; Ivanova, M.; Baunmann, S.; Guillon, O.; Meulenberg, W. Ion-conducting ceramic membrane reactors for high-temperature applications. J. Membr. Sci. 2017, 543, 79–97. [Google Scholar] [CrossRef]
- Duan, C.; Kee, R.; Zhu, H.; Sullivan, N.; Zhu, L.; Bian, L.; Jennings, D.; O’Hayre, R. Highly efficient reversible protonic ceramic electrochemical cells for power generation and fuel production. Nat. Energy 2019, 4, 230–240. [Google Scholar] [CrossRef]
- Veras, T.; Mozer, T.; Santos, D.; Cesar, A. Hydrogen: Trends, production and characterization of the main process worldwide. Int. J. Hydrogen Energy 2017, 42, 2018–2033. [Google Scholar] [CrossRef]
- Ramachandran, R.; Menon, R. An overview of industrial uses of hydrogen. Int. J. Hydrogen Energy 1998, 23, 593–598. [Google Scholar] [CrossRef]
- Stolten, D.; Emonts, B. Hydrogen Science and Engineering: Materials, Processes, Systems and Technology; Wiley: Weinheim, Germany, 2016. [Google Scholar]
- Bessarabov, D.; Wang, H.; Li, H.; Zhao, N. PEM Electrolysis for Hydrogen Production: Principles and Applications; CRC Press: Boca Raton, FL, USA, 2016. [Google Scholar]
- Satyapal, S.; Petrovic, J.; Read, C.; Thomas, G.; Ordaz, G. The U.S. Department of Energy’s National Hydrogen Storage Project: Progress towards meeting hydrogen-powered vehicle requirements. Catal. Today 2007, 120, 246–256. [Google Scholar] [CrossRef]
- Forsberg, C. Future hydrogen markets for large-scale hydrogen production systems. Int. J. Hydrogen Energy 2007, 32, 431–439. [Google Scholar] [CrossRef]
- Staffell, I.; Scamman, D.; Abad, A.; Balcombe, P.; Dodds, P.; Ekins, P.; Shah, N.; Ward, K. The role of hydrogen and fuel cells in the global energy system. Energy Environ. Sci. 2019, 12, 463–491. [Google Scholar] [CrossRef]
- Eberle, U.; Müller, B.; von Helmolt, R. Fuel cell electric vehicles and hydrogen infrastructure: Status 2012. Energy Environ. Sci. 2012, 5, 8780–8798. [Google Scholar] [CrossRef]
- Gallucci, F.; Fernandez, E.; Corengia, P.; van Sin Annaland, M. Recent advances on membranes and membrane reactors for hydrogen production. Chem. Eng. Sci. 2013, 92, 40–66. [Google Scholar] [CrossRef]
- Rahimpour, M.; Samimi, F.; Babapoor, A.; Tohidian, T.; Mohebi, S. Palladium membranes applications in reaction systems for hydrogen separation and purification: A review. Chem. Eng. Process 2017, 121, 24–49. [Google Scholar] [CrossRef]
- Lundin, S.; Patki, N.; Fuerst, T.; Ricote, S.; Wolden, C.; Way, J. Dense Inorganic Membranes for Hydrogen Separation. In Membranes for Gas Separation; Carreon, M., Ed.; World Scientific Publishing Company: Singapore, 2017; Chapter 7. [Google Scholar]
- Zhang, K.; Way, J. Palladium-copper membranes for hydrogen separation. Sep. Purif. Technol. 2017, 47, 39–44. [Google Scholar] [CrossRef]
- Al-Mufachi, N.; Rees, N.; Steinberger-Wilkens, R. Hydrogen selective membranes: A review of palladium-based dense metal membranes. Renew. Sustain. Energy Rev. 2015, 186, 540–551. [Google Scholar] [CrossRef]
- Boyano, A.; Blanco-Marigorta, A.; Morosuk, T.; Tsatsaronis, G. Exergoenvironmental analysis of a steam methane reforming process for hydrogen production. Energy 2011, 36, 2202–2214. [Google Scholar] [CrossRef]
- Boyano, A.; Morosuk, T.; Blanco-Marigorta, A.; Tsatsaronis, G. Conventional and advanced exergoenvironmental analysis of a steam methane reforming reactor for hydrogen production. J. Clean. Prod. 2012, 20, 152–160. [Google Scholar] [CrossRef]
- Rosen, M. Thermodynamic Investigation of Hydrogen Production by Steam-Methane Reforming. Int. J. Hydrogen Energy 1991, 16, 207–217. [Google Scholar] [CrossRef]
- Lutz, A.; Bradshaw, R.; Keller, J.; Witmer, D. Thermodynamic analysis of hydrogen production by steam reforming. Int. J. Hydrogen Energy 2003, 28, 159–167. [Google Scholar] [CrossRef]
- Nordio, M.; Rizzi, F.; Manzolini, G.; Mulder, M.; Raymakers, L.; van Sint Annaland, M.; Gallucci, F. Experimental and modelling study of an electrochemical hydrogen compressor. Chem. Eng. J. 2019, 369, 432–442. [Google Scholar] [CrossRef]
- Griffith, W.; Flanagan, E. Online, continuous monitoring of mechanical condition and performance for critical reciprocating compressors. In Proceedings of the 30th tUrbomachinery Symposium; Texas A&M University, Turbomachinery Laboratories: College Station, TX, USA, 2001; pp. 209–218. [Google Scholar]
- Duan, C.; Tong, J.; Shang, M.; Nikodemski, S.; Sanders, M.; Ricote, S.; Almansoori, A.; O’Hayre, R. Readily processed protonic ceramic fuel cells with high performance at low temperature. Science 2015, 349, 1321–1326. [Google Scholar] [CrossRef]
- Zhu, H.; Ricote, S.; Coors, W.; Kee, R. Interpreting equilibrium-conductivity and conductivity-relaxation measurements to establish thermodynamic and transport properties for multiple charged defect conducting ceramics. Faraday Discuss. 2015, 182, 49–74. [Google Scholar] [CrossRef]
- Duan, C.; Kee, R.; Zhu, H.; Karakaya, C.; Chen, Y.; Ricote, S.; Jarry, A.; Crumlin, E.; Hook, D.; Braun, R.; et al. Highly durable, coking and sulfur tolerant, fuel-flexible protonic ceramic fuel cells. Nature 2018, 557, 217–222. [Google Scholar] [CrossRef]
- Zhu, H.; Ricote, S.; Duan, C.; O’Hayre, R.; Tsvetkov, D.; Kee, R. Defect incorporation and transport with BaZr0.8Y0.2O3−δ(BZY20) proton-conducting membranes. J. Electrochem. Soc. 2018, 165, F581–F588. [Google Scholar] [CrossRef]
- Zhu, H.; Ricote, S.; Duan, C.; O’Hayre, R.; Kee, R. Defect chemistry and transport within dense BaCe0.7Zr0.1Y0.1Yb0.1O3−δ (BCZYYb) proton-conducting membranes. J. Electrochem. Soc. 2018, 165, F845–F853. [Google Scholar] [CrossRef]
- Katahira, K.; Kohchi, Y.; Shimura, T.; Iwahara, H. Protonic conduction in Zr-substituted BaCeO3. Solid State Ionics 2000, 138, 91–98. [Google Scholar] [CrossRef]
- Ricote, S.; Bonanos, N.; Caboche, G. Water vapour solubility and conductivity study of the proton conductor BaCe0.9−xZrxY0.1O3−δ. Solid State Ionics 2009, 180, 990–997. [Google Scholar] [CrossRef]
- Kreuer, K. Proton-Conducting Oxides. Annu. Rev. Mater. Res. 2003, 33, 333–359. [Google Scholar] [CrossRef]
- Bonanos, N. Oxide-based protonic conductors: Point defects and transport properties. Solid State Ionics 2001, 145, 265–274. [Google Scholar] [CrossRef]
- Hancke, R.; Larson, T.; Xing, W.; Li, Z.; Fontaine, M.; Norby, T. Ohmically heated ceramic asymmetric tubular membranes for gas separation. J. Membr. Sci. 2018, 564, 598–604. [Google Scholar] [CrossRef]
- Todd, D.; Schwager, M.; Mérida, W. Thermodynamics of high-temperature, high-pressure water electrolysis. J. Power Sources 2014, 269, 424–429. [Google Scholar] [CrossRef]
- Leachman, J.; Jacobson, R.; Penoncello, S.; Lemmon, E. Fundamental Equations of State for Parahydrogen, Normal Hydrogen, and Orthohydrogen. J. Phys. Chem. Ref. Data 2009, 38, 721–748. [Google Scholar] [CrossRef]
- Tang, Z.; Svoboda, R.; Lawton, J.; Aaron, D.; Papandrew, A.; Zawodzinski, T. Composition and Conductivity of Membranes Equilibrated with Solutions of Sulfuric Acid and Vanadyl. J. Electrochem. Soc. 2013, 160, F1040–F1047. [Google Scholar] [CrossRef]
- Zhu, H.; Kee, B.; Karakaya, C.; O’Hayre, R.; Kee, R. Equilibrium thermodynamic predictions of coking propensity in membrane-based dehydrogenation of hydrocarbons and alcohols. Catal. Today 2019, 331, 7–11. [Google Scholar] [CrossRef]
- Corgnale, C.; Sulic, M. Techno-Economic analysis of high-pressure metal hydride compression systems. Metals 2018, 8, 469. [Google Scholar] [CrossRef]
© 2019 by the authors. Licensee MDPI, Basel, Switzerland. This article is an open access article distributed under the terms and conditions of the Creative Commons Attribution (CC BY) license (http://creativecommons.org/licenses/by/4.0/).

 ,
, 


