Abstract
In agreement with the Water Framework Directive, Circular Economy and European Union (EU) Green Deal packages, the EU-funded WATER-MINING project aims to validate next-generation water resource solutions at the pre-commercial demonstration scale in order to provide water management and recovery of valuable materials from alternative sources. In the framework of the WATER-MINING project, desalination brines from the Lampedusa (Italy) seawater reverse osmosis (SWRO) plant will be used to produce freshwater and recover valuable salts by integrating different technologies. In particular, electrodialysis with bipolar membranes (EDBM) will be used to produce chemicals (NaOH and HCl). A novel EDBM pilot plant (6.4 m2, FuMa-Tech) has been installed and operated. The performance of EDBM for single pass under different flowrates (2–8 L·min−1) for acid, base and saline channels, and two current densities (200 and 400 A·m−2), has been analyzed in terms of specific energy consumption (SEC) and current efficiency (CE). Results showed that by increasing the flowrates, generation of HCl and NaOH slightly increased. For example, ΔOH− shifted from 0.76 to 0.79 mol·min−1 when the flowrate increased from 2 to 7.5 L·min−1 at 200 A·m−2. Moreover, SEC decreased (1.18–1.05 kWh·kg−1) while CE increased (87.0–93.4%), achieving minimum (1.02 kWh·kg−1) and maximum (99.4%) values, respectively, at 6 L·min−1.
1. Introduction
Nowadays, it is estimated that 4.0 billion people (c.a. 2/3rds of the world population) face severe water scarcity during at least part of the year [1]. Moreover, it is expected that water demand will increase by 50–80% over the next three decades due to population growth, urbanization, socioeconomic development, intensification of agriculture, quality deterioration of available water and climate change [2,3]. By 2050, near half of the global urban population will live in water-scarce regions [2]. High water scarcity levels appear in areas with: (i) high population density, (ii) irrigated agriculture, or (iii) very low natural water availability (arid areas) [1]. In addition, even though water scarcity can be addressed by improving the water-use efficiency, or via seawater desalination, groundwater exploitation, or by applying water disinfection and decontamination techniques, these management options will affect the natural environment, as they are chemically, energetically and operationally intensive [2,4]. Therefore, some actions must be taken to ensure a reliable water supply, such as (i) reducing pressure on limited blue water resources by using green water (e.g., rainwater) or by increasing the productivity in agriculture, (ii) applying emerging water-saving technologies, (iii) controlling population growth in water-scarce regions and (iv) mitigating climate change through energy efficiency and emissions abatement measures [1,2].
To date, water reuse and desalination technologies for either sea or brackish waters from saline aquifers and rivers are the only options that can secure reliable access to water in terms of quantity and quality [3,4,5,6]. It is estimated that by increasing the desalination capacity from 2.9 to 13.6 billion m3·month−1 and water reuse from 1.6 to 4.0 billion m3·month−1, it can be possible to reduce the percentage under severe water scarcity to 14% [3,7]. Reverse osmosis (RO) accounts for 70% of desalination plants. In comparison, the thermal-based processes (multi-stage flash distillation and multi-effect distillation) account for 25%, nanofiltration and electrodialysis being the remaining percentage [7]. The conventional thermal desalination processes are inefficient due to their large use of energy and high capital and operational costs (7.7–70.0 kWh·m−3) [4,7]. During the last decades, the continuous improvement of seawater desalination using RO, in terms of energy recovery and more robust membranes, has made it possible to reduce the energy consumption from 10 kWh·m−3 in the 1980s to below 4.0 kWh·m−3 of produced water [4]. In addition, from a theoretical point of view, energy consumption is expected to be decreased to 1.29 kWh·m−3 at a 75% recovery [4]. Nevertheless, major challenges of seawater RO desalination still remain, such as: (i) fouling, (ii) concentration polarization, (iii) low water recovery (<55%) and (iv) the need to remove low molecular weight contaminants (e.g., boron) [4].
In addition, there are some environmental concerns in relation to seawater RO desalination plants, such as: (i) the management of brines, (ii) emission of air pollutants and greenhouse gases (c.a. 1.4–1.8 kg CO2·m−3 of produced water), (iii) entrainment of planktonic organisms and juvenile-stage fish in the sea water uptake systems, and (iv) the release of chemicals to the environment (e.g., anti-scalants) [5]. Concerning the brine discharge, it has been reported that brine salinity (c.a. 65–85 g·L−1) is the main factor that impacts the environment [8]. Moreover, some chemicals such as ClO2(g), NaOCl, FeCl3, AlCl3, H2SO4, HCl and NaHSO3 are usually dosed in the pre-treatment stage to avoid algal growth, reduce corrosion, inhibit scaling and adjust the pH and chlorinating water [8,9]. One example of the harm caused by the brine discharge is the meadows regression of Posidonia oceanica in the Mediterranean area [10,11]. Several methods to deal with brine management, such as evaporation, membrane distillation, well injection and dilution with a wastewater treatment plant or seawater can be applied [9,12]. In order to reduce the volume of brine and its disposal cost, zero liquid discharge (ZLD) and near-ZLD approaches can be applied [13,14,15].
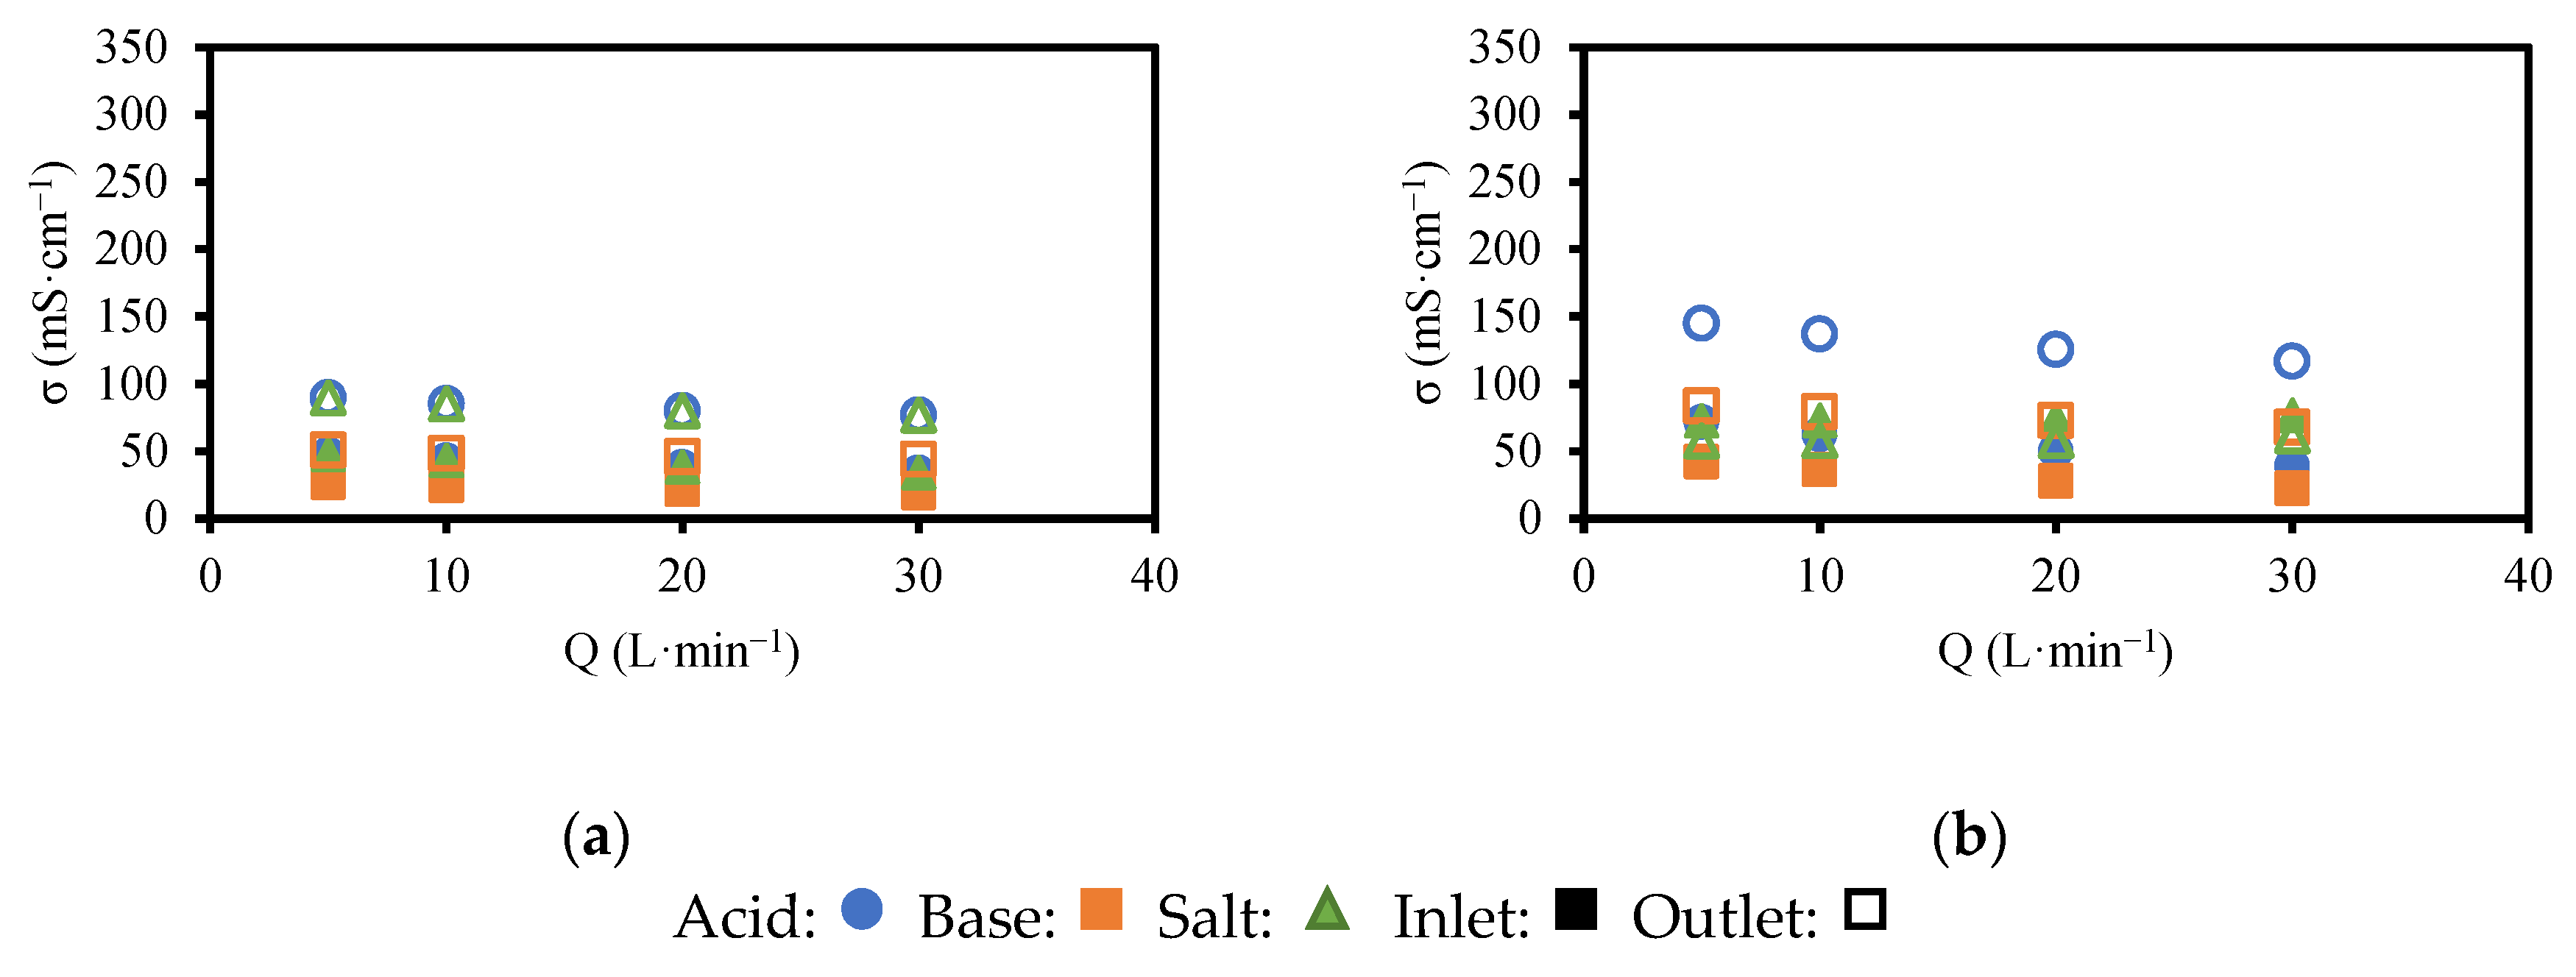
Within this context, the WATER-MINING project aims to ensure access to water by exploring alternative water sources through the development of innovative solutions that are being tested with urban and industrial wastewater and seawater desalination [16]. Case Study 1, placed at the seawater reverse osmosis (SWRO) of Lampedusa (Italy), evaluates the performance of innovative technologies to avoid brine discharge by their valorization into chemicals or freshwater. The treatment chain (Figure 1), with an inlet flow capacity of 2.2 m3·h−1, is composed of a nanofiltration unit treating seawater, which splits the stream in two. The permeate (mainly containing NaCl and KCl) will be sent to a multiple-effect distillation unit (employing waste heat) to produce high-quality water. The remaining brine, almost NaCl-saturated, will be treated in a thermal crystallizer to obtain high-quality water and NaCl(s). On the other hand, the nanofiltration concentrate (rich in Mg and Ca) will be sent to a selective Mg and Ca crystallizer to precipitate them as hydroxides [17]. The remaining solution (Na2SO4 and NaCl mixture) will be treated in the Eutectic Freeze Crystallization unit to precipitate Na2SO4(s). Finally, the residual brine (mainly NaCl) will be fed to the electrodialysis with bipolar membranes (EDBM) unit to produce NaOH and HCl that can be reused internally in the process [18]. The proposed treatment scheme would allow a more competitive desalination process due to the higher freshwater production and water recovery, the lower energy consumption and the production of high-purity salts (NaCl(s) and Na2SO4(s)) and chemicals (Mg(OH)2(s) Ca(OH)2(s), securing sustainable access to Mg (listed as a Critical Raw Material) within the European Union. Moreover, the volume of brine discharged to the environment will be reduced.
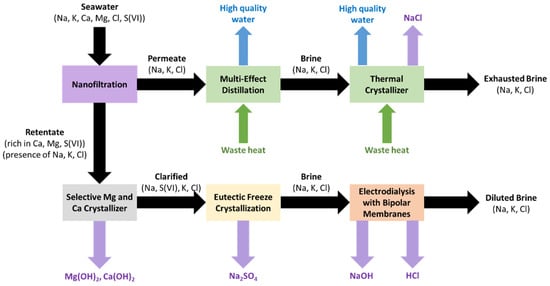
Figure 1.
Scheme of the treatment chain evaluated in Case Study 1 (Lampedusa, Italy) within the WATER-MINING project (adapted from Culcasi et al. [18]).
EDBM is an electro-membrane process that uses a repeating sequence of anion exchange, cation exchange and bipolar membranes (AEM, CEM and BPM, respectively) that can convert salts into acids and bases under the application of an external current field [19,20,21]. The use of EDBM has been widely studied at a laboratory scale for the production of acid and bases from brines [22,23,24,25,26,27]. For instance, Yang et al. [23] treated RO brine from a power plant using a set-up provided by Shandong Tianwei Membrane Technology Co., Ltd. (88 cm2). The stack was equipped with AEM and CEM from Qianqiu Environmental Protection & Water Treatment Corporation (China), while the BPM was from FuMa-Tech GmbH (Germany). In order to avoid scaling, the RO brine was previously treated with NaOH and CO2(g) to precipitate Mg(OH)2 (>99.9%) and CaCO3(s) (>99%). By applying a current density of 570 A·m−2 working in batch configuration, the authors were able to produce 0.65 mol·L−1 H+ with a SEC of 9.0 kWh·kg−1 HCl. Davis et al. [24] produced acids and bases from NaCl solutions (50 mmol·L−1 to 400 mmol·L−1) using Neosepta membranes (ACM, CMX and BP−1) in a lab-scale unit (PC-Cell EDQ380, 380 cm2). Tests carried out in a single pass showed that it was possible to achieve a 75% salt conversion working at an inlet of 192 mmol·L−1 NaCl and 192 A·m−2. Under these conditions, authors achieved a SEC of 3.65 kWh·kg−1 HCl and a current efficiency higher than 80%. Reig et al. [25] integrated nanofiltration, selective precipitation and EDBM for treating seawater RO brines from El Prat de Llobregat (Spain). The permeate of the nanofiltration (52 g·L−1 NaCl, 0.76 g·L−1 Mg and 0.42 g·L−1 Ca) was treated with Na2CO3 and NaOH to precipitate CaCO3(s) (removal of 96%) and Mg(OH)2(s) (removal of 99%). This would allow having residual amounts of Mg (<10 mg·L−1) and Ca (<20 mg·L−1) prior to the treatment with EDBM. Experiments carried out in batch configuration using EDBM at 450 A·m−2 showed the possibility of producing 0.88 mol·L−1 of HCl and 0.71 mol·L−1 of NaOH with a current efficiency of 77% and a SEC of 2.58 kWh·kg−1 of NaOH. Recently, Herrero-González et al. [26] tested the production of HCl and NaOH from 1 mol·L−1 of NaCl solutions in a PC-Cell lab-unit (100 cm2) using Ralex (CM-PP and AM-PP) and Fumasep (BPM) membranes. Working in a constant and variable (solar photovoltaic) current intensity mode at 1000 A·m−2 and a volume salt to acid (or base) ratio of 20, they were able to achieve 3.2 mol·L−1 of HCl and 3.6 mol·L−1 of NaOH with a SEC value of 41 kWh·kg−1 of HCl after 40 h of operation.
Although EDBM has been validated at a laboratory scale (technology readiness level (TRL) 4) and even in a real environment (TRL 5), in the open literature there is still a lack of knowledge about the operation of EDBM plans with a higher TRL (TRL 6, i.e., technology demonstrated in a real environment) [28]. To the authors knowledge, there is only one paper that evaluates the performance of EDBM at the pilot plant scale. Gazigil et al. [27] fed the RO concentrate to treat wastewater in an EDBM pilot plant. The module provided by FuMa-Tech (EDBM FT-ED 100) has an active area of 100 cm2 with a feed flowrate of 180 L·h−1 (10 triplets). The system operated under batch configuration at 25 V, but once the brine was exhausted, it was replaced with the fresh one keeping the solutions for acid and base. After performing six cycles of operation, concentrations of 1.44% and 2% of acids and bases, respectively, were reached. No data on specific energy consumption or current efficiency was provided.
Very recently, the authors have presented the production of HCl and NaOH from NaCl brines by means of EDBM in a novel pilot plant [29]. This EDBM unit is configured with a total membrane area of 19.2 m2, more than 16 times larger than that reported in the literature for the same application. The pilot unit was operated in three operation modes (batch, feed and bleed and fed-batch) and two current densities (200 and 400 A·m−2). At 200 A·m−2, the lowest SEC (1.4 kWh·kg−1) and highest CE (80%) were obtained operating in batch mode. However, at 400 A·m−2, the feed and bleed operation mode presented lower SEC (2.1 kWh·kg−1) and higher specific production (SP) (1.1 ton·y−1·m−2).
This work evaluates the performance of a novel EDBM pilot plant (FT-ED1600-3, FuMa-Tech), one of the largest stacks that has been tested in the literature. In particular, its total membrane area is much larger (i.e., more than 16 times larger) than those reported so far for the production of HCl and NaOH aqueous solutions, starting from NaCl brines. The aim of this work was to determine the effect of flowrates (acid, base, salt and ERS), initial concentrations in the compartments and the current density in a one-pass configuration using single-salt (NaCl) solutions on the increase of H+ and OH− concentrations, SECEDBM and CEEDBM. Additionally, the contribution of pump consumption was considered within the SECTotal.
2. Materials and Methods
2.1. Experimental Set-Up
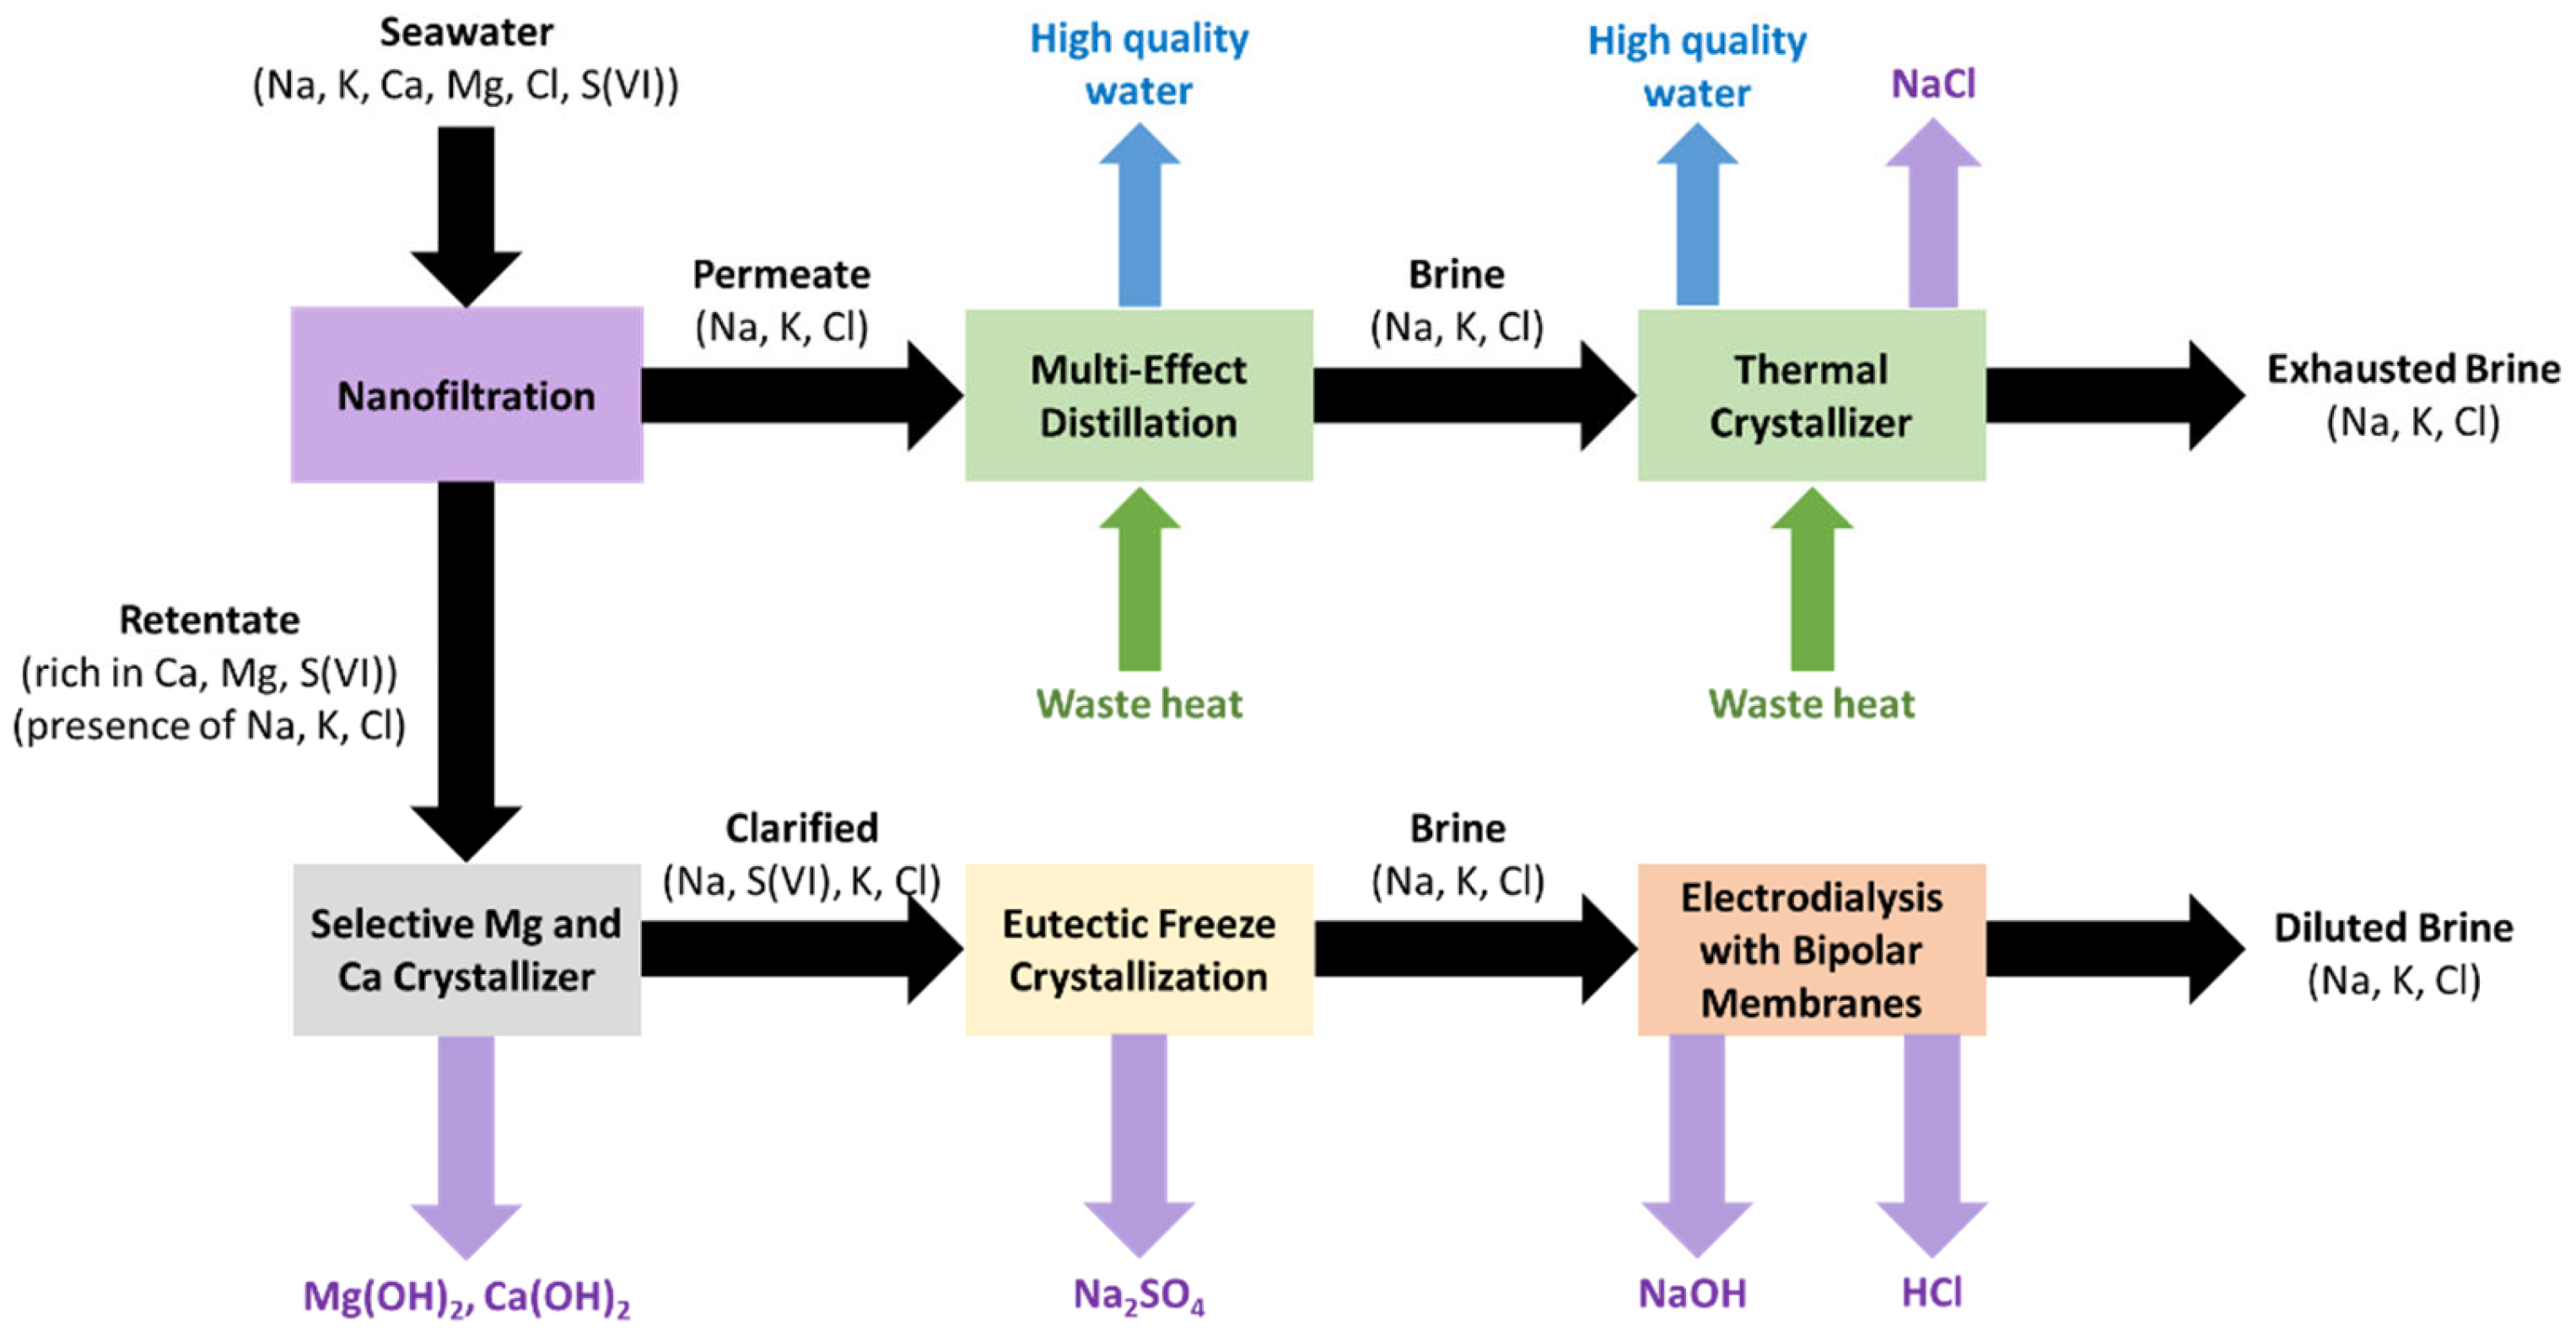
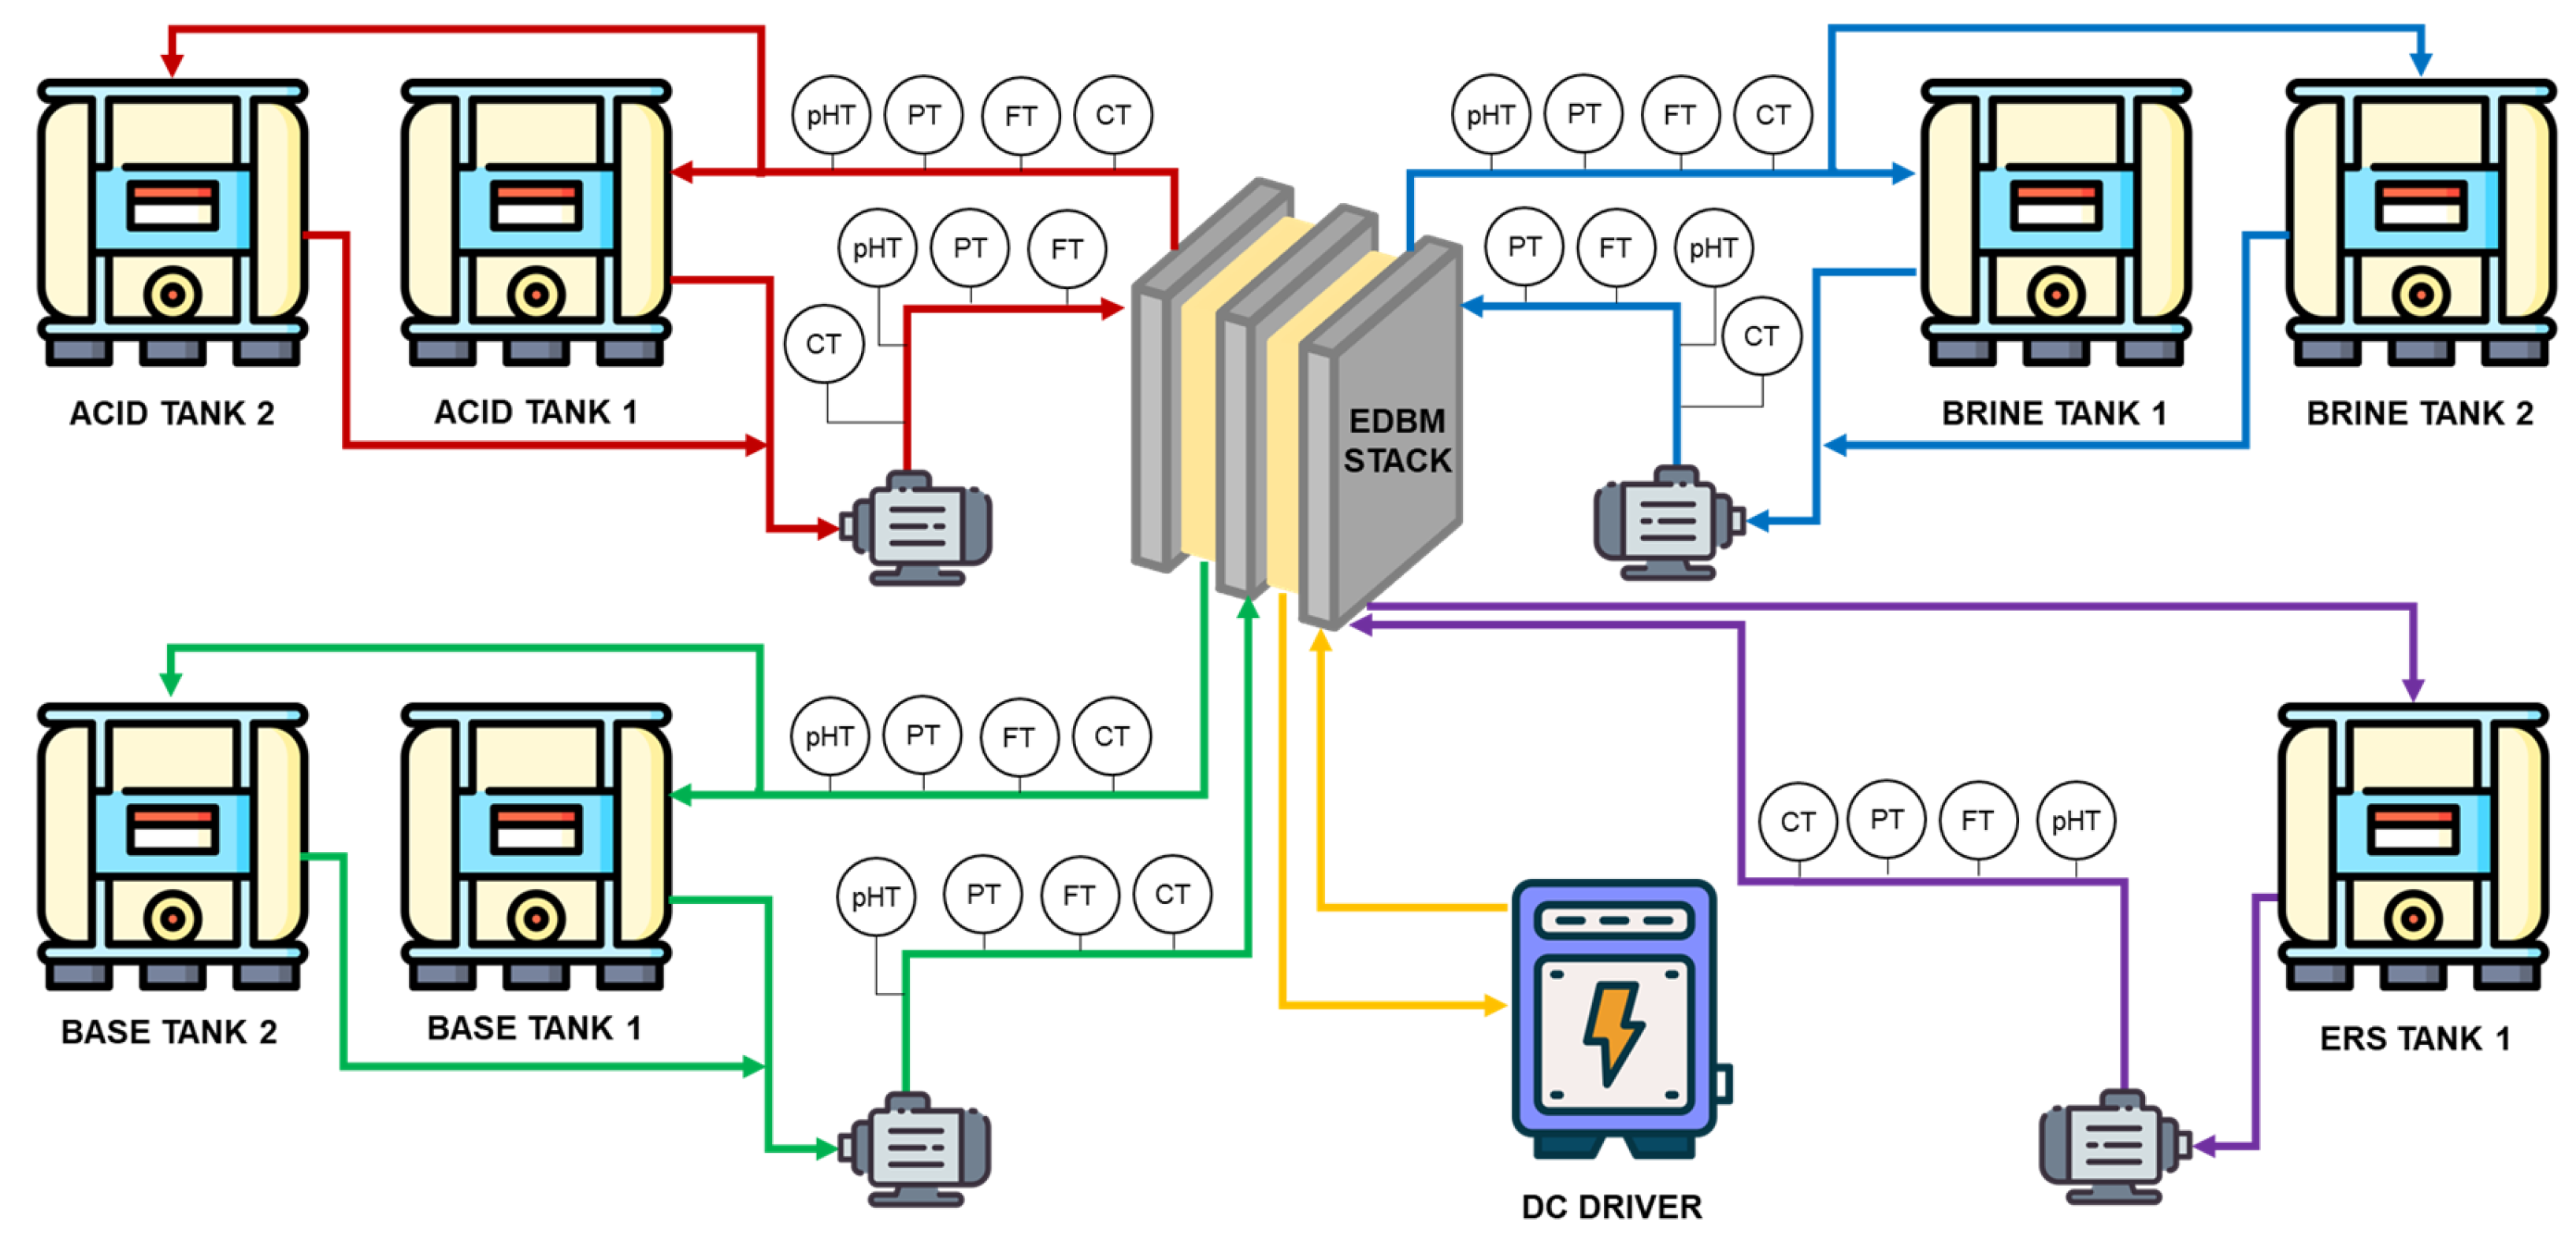
The EDBM pilot plant (Figure 2) is composed by two skid-mounted units: (i) the pumping, monitoring and control station, and (ii) the EDBM stack. The former contains the pumps to feed the solution to the stack and the instrumentation devices to monitor and control the main variables involved in the process, while the latter is composed using an EDBM FT-ED1600-3 module provided by FuMa-Tech BWT GmbH (Bietigheim-Bissingen, Germany).
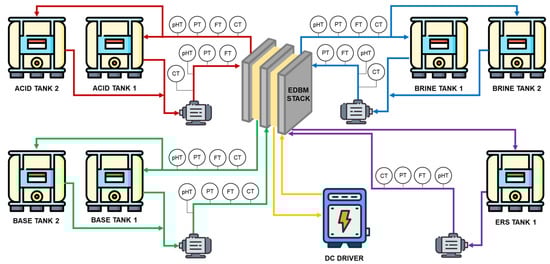
Figure 2.
Simplified flowsheet of the EDBM pilot plant (adapted from [29]).
The EDBM stack was equipped with homogeneous FUMASEP® FAB-PK, FKB-PK and FBM-PK as AEM, CEM and BPM respectively, also supplied by FuMa-Tech BWT GmbH (Bietigheim-Bissingen, Germany). Their main properties are collected in Table 1 [30]. Each channel is provided with net-spacers 350 µm thick and made of PP-overlapped wires (FuMa-Tech FT-ED-1600-3). The stack is configured with 2 sets of 20 triplets (repeating units of anionic, cationic and bipolar membranes), which sums an area of 6.4 m2 for each type of membrane; this means a total membrane area of 19.2 m2.

Table 1.
Main properties of the FuMa-Tech BWT GmbH membranes used [30].
The three main line of process (acid, base and salt) were equipped with 2 tanks (IBC) of 1 m3 each. These tanks together with a complex system of piping allow the operation of the pilot plant in different process configuration (batch, continuous, and feed and bleed mode) [29]. In addition, a cylindrical tank of 0.125 m3 is used for the electrode rinse solution (ERS), which is continuously recirculated.
A DC drive (AF02, Giussani SRL, Milano, Italy) capable of providing 17.5 kW is installed at the pilot plant to provide the electrical energy to power the EDBM unit.
The continuous sampling of the process variables (inlet and outlet pH, flowrate and conductivity in the four streamlines, as well as stack current and voltage) was obtained using a CompactDAQ model NI cDAQ-9179, provided by National Instruments (NI, Austin, TX, USA). Moreover, a LabVIEW (NI, Austin, TX, USA) interface was built to show the trend of the main variables and to control the system.
2.2. Experiments Design
A total of three sets of experimental runs have been carried out in the EDBM pilot plant. Table 2 depicts a summary of experimental conditions adjusted. Note that the pilot has been operated at 200 and 400 A·m−2 because: (i) these values are representative of a wide range of current densities, (ii) lower than the supplier-recommended upper limit of 500 A·m−2 and (iii) lower than the limiting current density estimated using a validated process model [31].
Table 2.
Summary of the experimental conditions of the performed tests.
In the first set, the initial concentrations have been fixed to be the initial values of a batch experiment (ca. 0.1 mol·L−1 HCl and NaOH and 1 mol·L−1 NaCl), and the flowrates of acid, base and saline channels were varied from 2 to 8 L·min−1, while the one of ERS remained constant (20 L·min−1). Only the experiment T-200-F was performed at 8 L·min−1, whereas the other tests were performed at 7.5 L·min−1. This was due to the high inlet pressure (>2 bar) that was observed when working at 8 L·min−1, which caused external leakage. By working at 7.5 L·min−1, the pressure remained below two bar, which avoided the presence of an external leakage. Similarly, the second set varied the initial concentrations of the tests, which were those close to the end of a batch experiment (ca. 0.7 mol·L−1 HCl and NaOH and 0.5 mol·L−1 NaCl). In this case, the flowrates were varied within the same range. Finally, the third set was focused on studying the effect of ERS flowrates (from 5 to 30 L·min−1) with the initial concentration of the first set and by keeping the acid, base and saline flowrates at 6 L·min−1. In all the sets, experiments were performed at 200 and 400 A·m−2.
2.3. Experimental Procedure
Firstly, the acid, base and saline tanks were filled with 600 L and the ERS tank was filled with 125 L of the corresponding solutions for each test (Table 2). The main purpose of the experiments was to evaluate the performance of the EDBM stack operating on the once-through (i.e., single-pass) operation mode. This configuration guarantees that the osmotic phenomena lead to a negligible variation of the volumes of the three solutions. Then, the system was powered up by fixing the initial flowrates and current density. After 15 min of stabilization, samples at the inlet and outlet of the stack for the four channels were collected via purposely installed valves, thus characterizing a single pass through the stack. After collecting the samples, they were stored at 4 °C. Once these tasks were completed, the flowrates were changed, starting the procedure from the stabilization.
In addition to the samples, both manual and automatic (using LabVIEW software) records of current, voltage, flowrates, pressure and temperature were carried out.
The pH and conductivity of the samples was measured offline using a multi-meter (Xylem Analytic Germany FmbH D-82362, Weilheim, Germany). In order to measure the concentrations of acid and bases, titration was executed twice per sample using a standard HCl 0.10 mol·L−1 and Na2CO3 0.05 mol·L−1 solutions, and methyl orange as pH indicator.
The accuracy of sample measurement was evaluated through error propagation theory, considering the error of equipment, deviation between the titrations performed and the variability in the recorded values in LabVIEW. Thus, the possible deviations in the results reported are included as error bars in the graphs.
2.4. Calculation of Performance Parameters
Specific energy consumption (SECEDBM) and current efficiency (CEEDBM) have been calculated for the evaluation of the performance of the EDBM process.
SECEDBM is an indicator of the energy consumed by the EDBM in the production of 1 kg of product. SECEDBM (kWh·kg−1) is calculated according to Equation (1):
where I is the current (A); V is the voltage (V); Cin and Cout are the inlet and outlet concentrations in the channel (mol·L−1); Qin and Qout are the inlet and outlet flowrates to the stack (L·h−1); and MW the molecular weight (g·mol−1).
CEEDBM measures the effectiveness of ion transportation across ion exchange membranes, thus the product generation, for a given applied current. CEEDBM is calculated using the ratio between the equivalent charge transported per unit of time and the electric current (Equation (2)):
where Cin and Cout are the inlet and outlet concentrations in the channel (mol·L−1); Qin and Qout are the inlet and outlet flowrates to the stack (L·s−1); z is the ion valence; F is the Faraday constant (96485 C·mol−1); n is the number of membrane triplets within the stack (20); and I is the current (A).
Both SECEDBM and CEEDBM can be referred either to NaOH or HCl, as they are simultaneously produced. However, in this work, SECEDBM and CEEDBM are referred to NaOH as it is the product of higher economic market value [32]. Therefore, all the energy consumption of the EDBM is attributed to NaOH, whereas HCl is considered as a by-product.
Additionally, given that different flowrates in the channels are compared, the energy consumption related to the pumping of all the solutions through the different channels (Pcons, W) was determined as the sum of pumping energy in the saline, acid, alkaline and ERS channels, according to Equation (3) [33].
where Qin,i is the inlet flowrate to the stack for channel i (m3·s−1); Pin,i and Pout,i are the inlet and outlet pressures to the stack for channel i (Pa); and η is the pump efficiency (70%).
The specific energy consumption associated to pumping (SECPump), referred to the kg of NaOH, can be calculated according to (Equation (4)):
where Pcons is the energy consumed by the pumping system (W); Cin and Cout are the inlet and outlet concentrations in the channel (mol·L−1); Qin and Qout are the inlet and outlet flowrates to the stack (L·h−1); and MW the molecular weight (g·mol−1).
The total specific energy consumption (SECTotal) is the sum of the SECEDBM and the SECPump (Equation (5)):
3. Results and Discussion
3.1. Effect of Acid, Base and Saline Flowrates on the Performance of the EDBM Unit
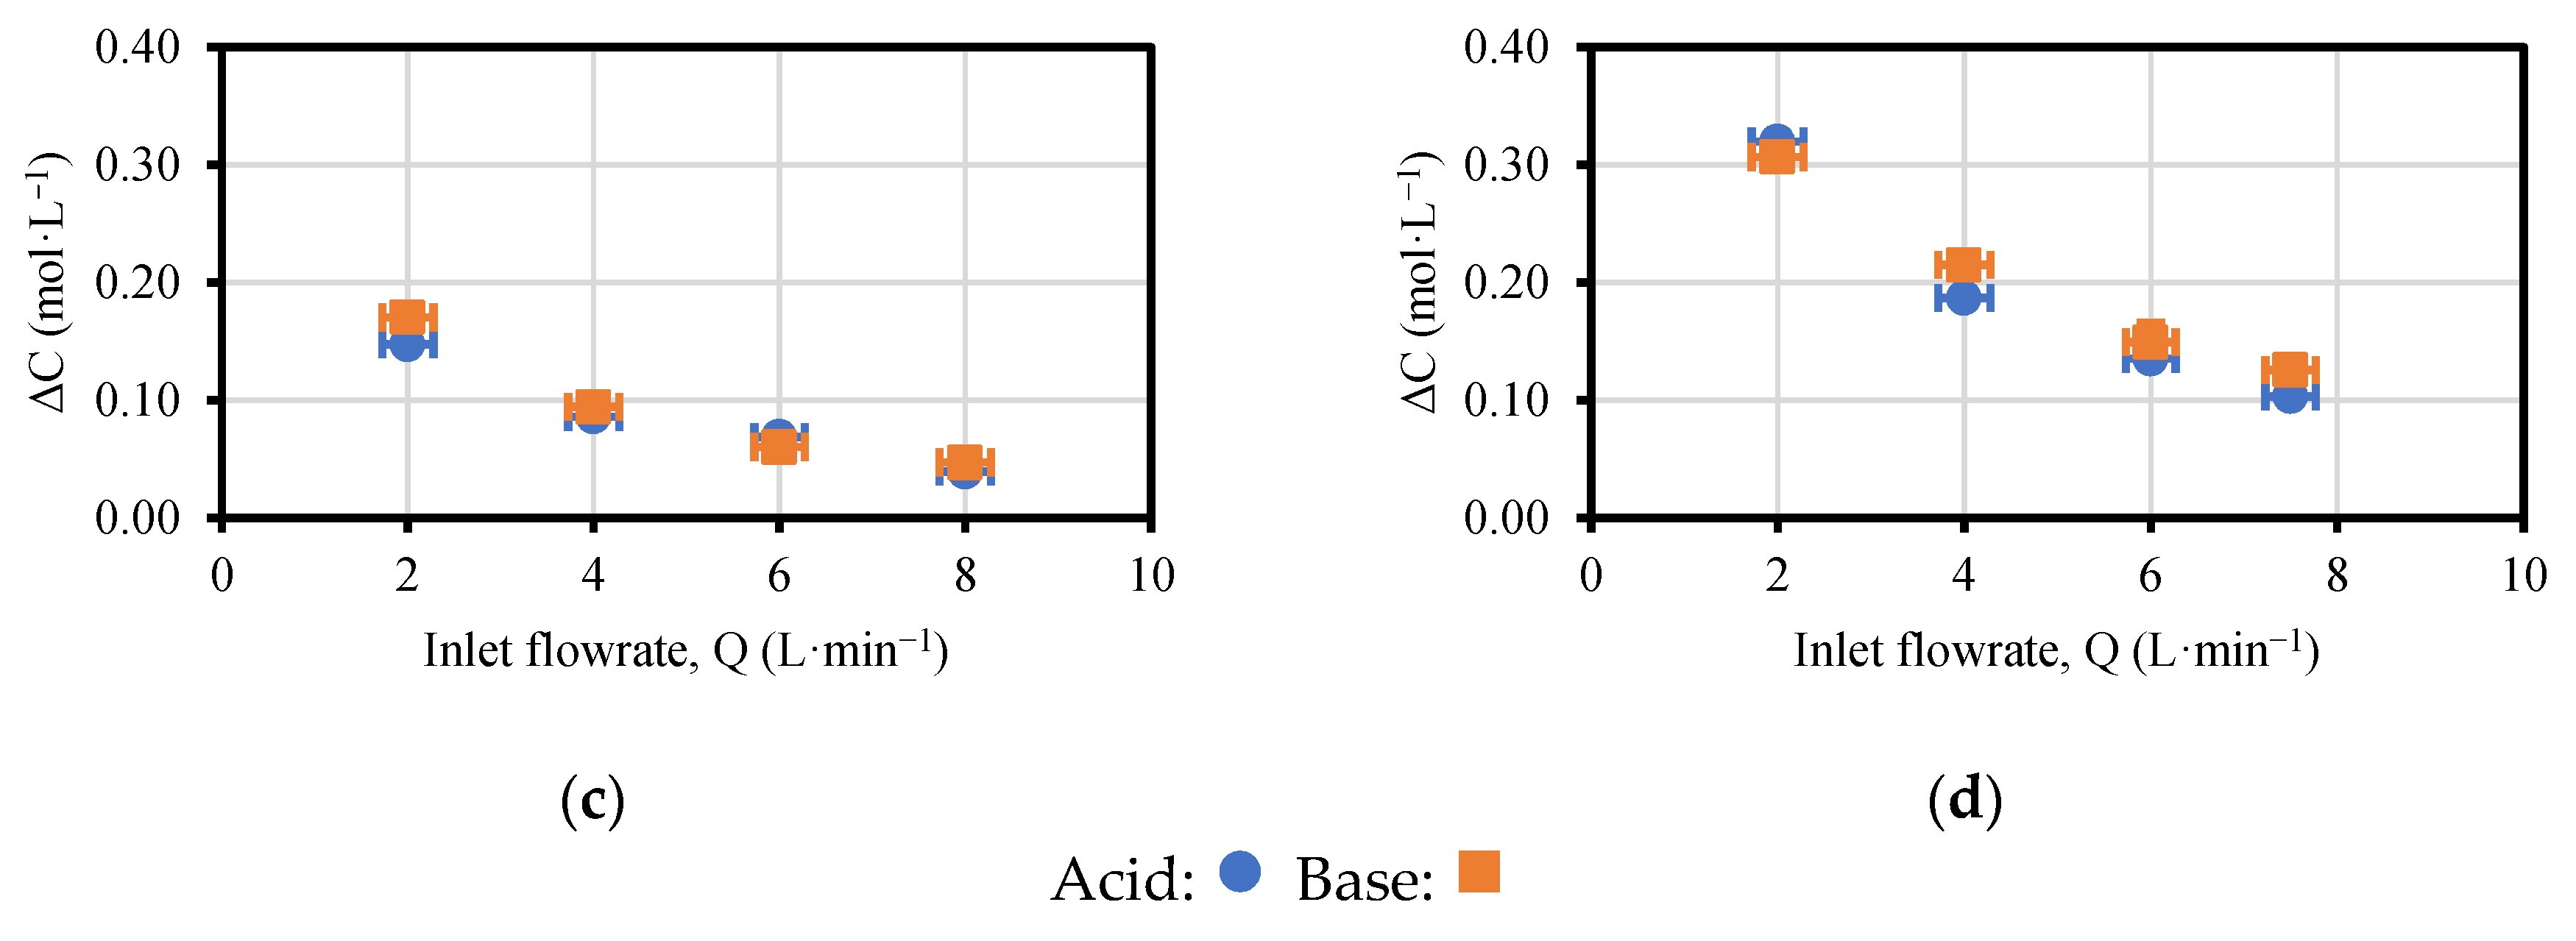
The variation in concentration profiles (Figure 3) is equivalent in shape for the four cases in which the flowrates of the acid, base and saline channels were manipulated (T-200-I, T-400-I, T-200-F and T-400-F). In the four cases, both products, NaOH and HCl, also presented similar profiles. However, acid concentrations were slightly lower than for the base due to the higher mobility of protons that migrated to other compartments (saline or ERS) and to the non-ideality (permselectivity) of the AEMs.
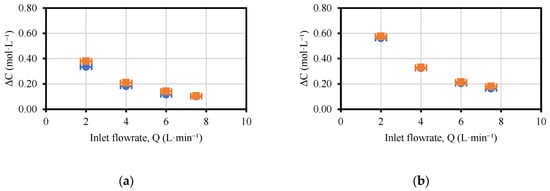
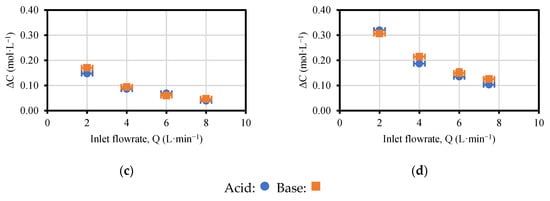
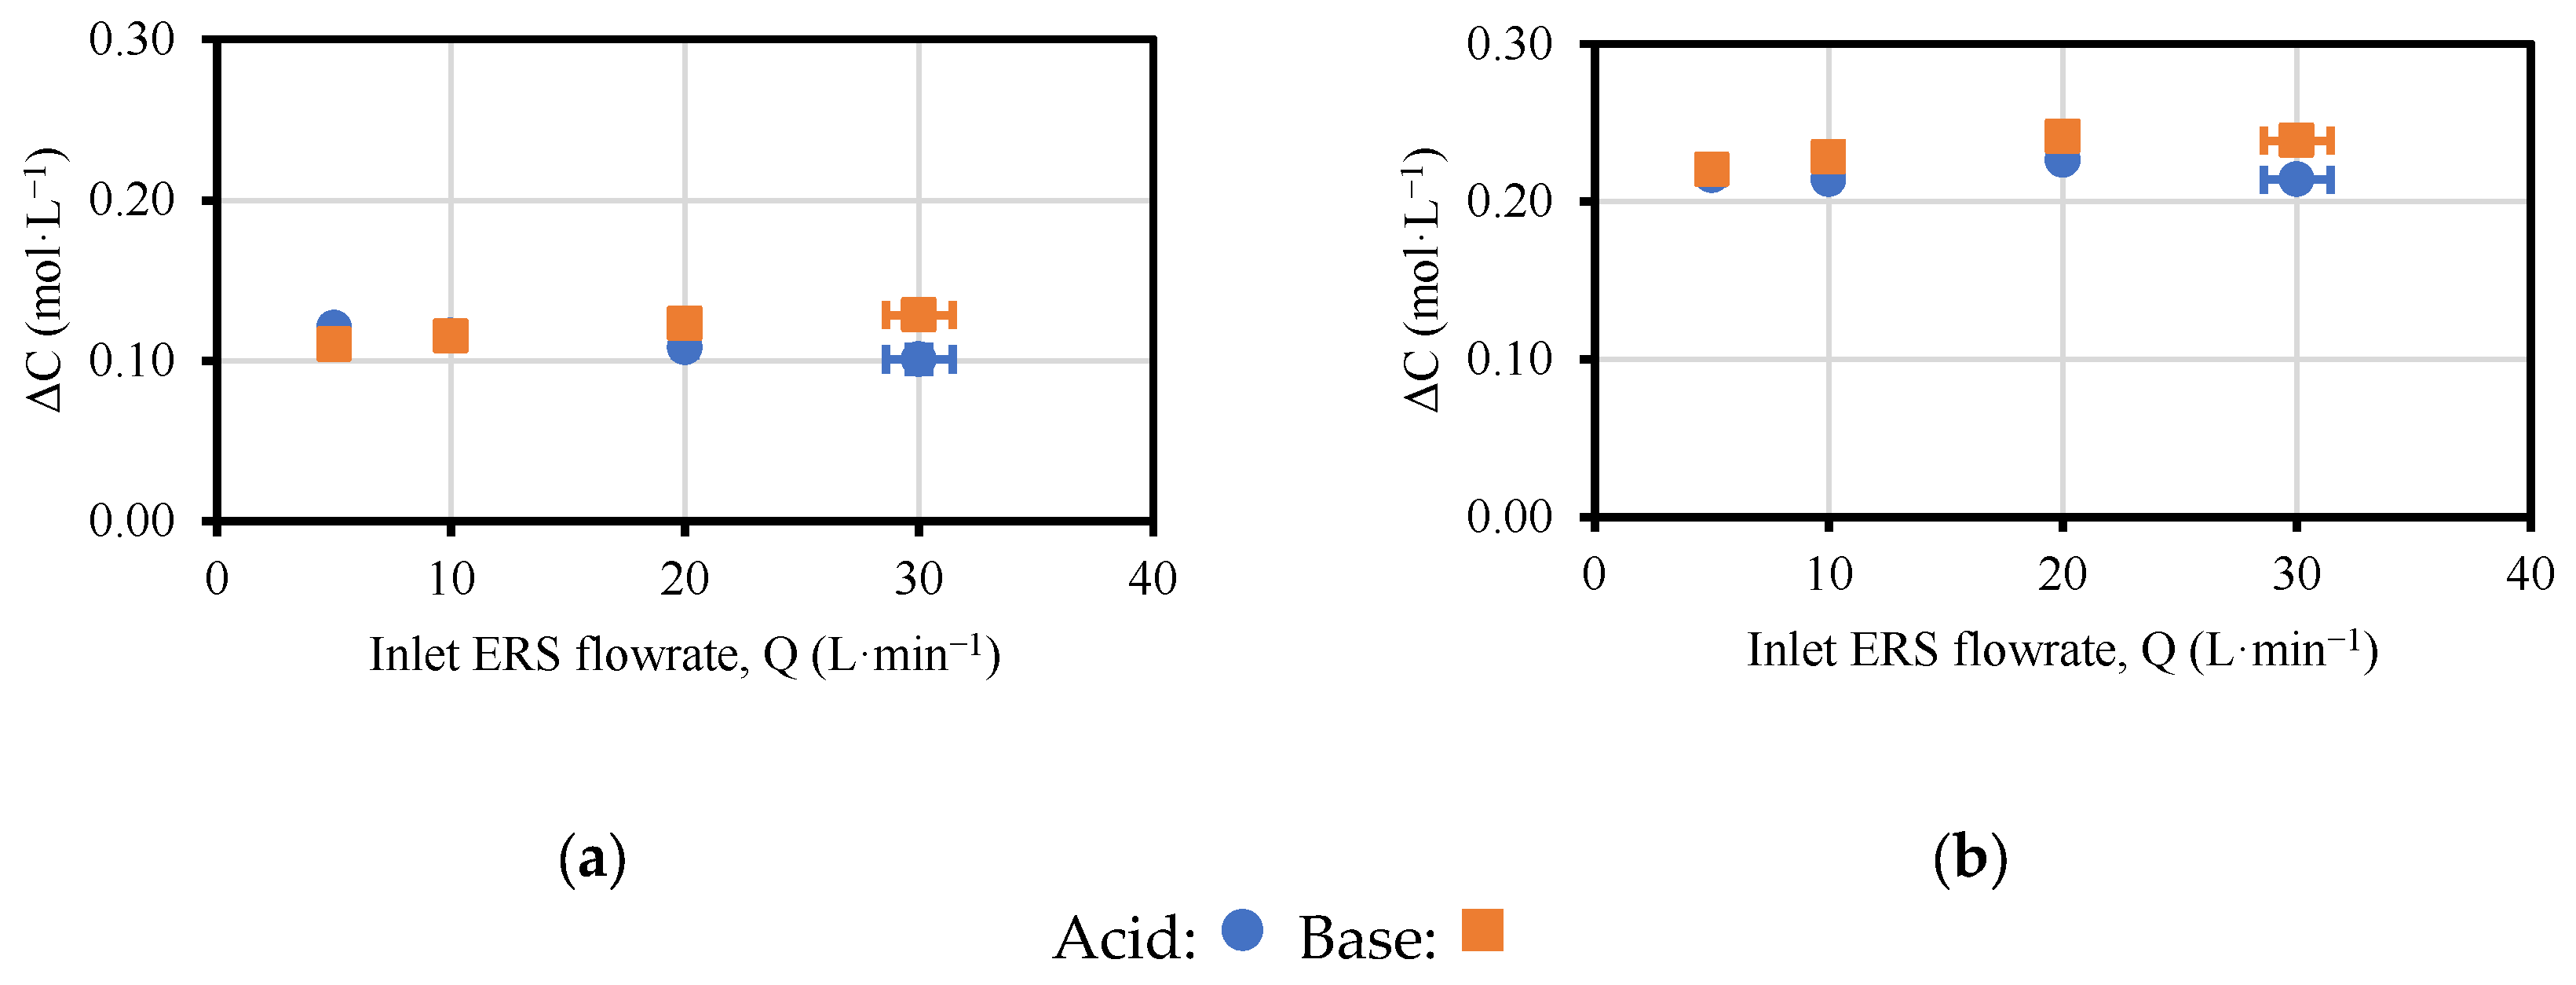
Figure 3.
Values of concentration variation versus feed flowrate: (a) T-200-I; (b) T-400-I; (c) T-200-F; (d) T-400-F. The associated errors to the variation in the acid and base concentrations (vertical error bars), estimated via acid–base titrations, are below 3% and cannot be visualized in practice in the figure.
The reduction of the concentration with the increasing flowrate was not linear but followed a trend inversely proportional to the inlet flowrate. As expected, the highest variation of the concentration was obtained at the lowest flowrate (2 L·min−1) since the residence time in the stack was increased. Considering the flow path (454 mm × 350 μm), the velocity of the fluid inside the channel was moved from 0.88 cm·s−1 (at 2 L·min−1) to 3.52 cm·s−1 (at 8 L·min−1). By considering the free volume of the spacer (47.25 cm3), the residence time of the stack was moved from 53.6 s to 13.4 s when the flowrate was increased from 2 to 8 L·min−1.
Higher variations of concentration were obtained when initial concentrations were employed (T-200-I and T-400-I) and when compared with tests performed at final concentrations (T-200-F and T-400-F). In the latter case, the larger concentrations achieved and the relevant pH gradient across the bipolar membranes generate a voltage which must be overcome to produce further chemicals. Thus, operating at the same current density intrinsically leads to a lower inlet–outlet concentration variation. Moreover, higher inlet concentrations favored the appearance of non-ideal phenomena (such as osmosis, electro-osmosis and diffusion) that worsen the EDBM performance.
On the other hand, working at a higher current density (400 A·m−2) increased the final acid and base concentrations and, therefore, the variation of concentrations. This is related to the presence of the electric field, which accelerates the kinetics of water dissociation at the bipolar membrane junction, as stated by the second Wien effect for under-limiting current densities [34]. In particular, close to the double concentration variation was obtained by shifting the current density from 200 to 400 A·m−2 (from T-200-I to T-400-I or from T-200-F to T-400-F).
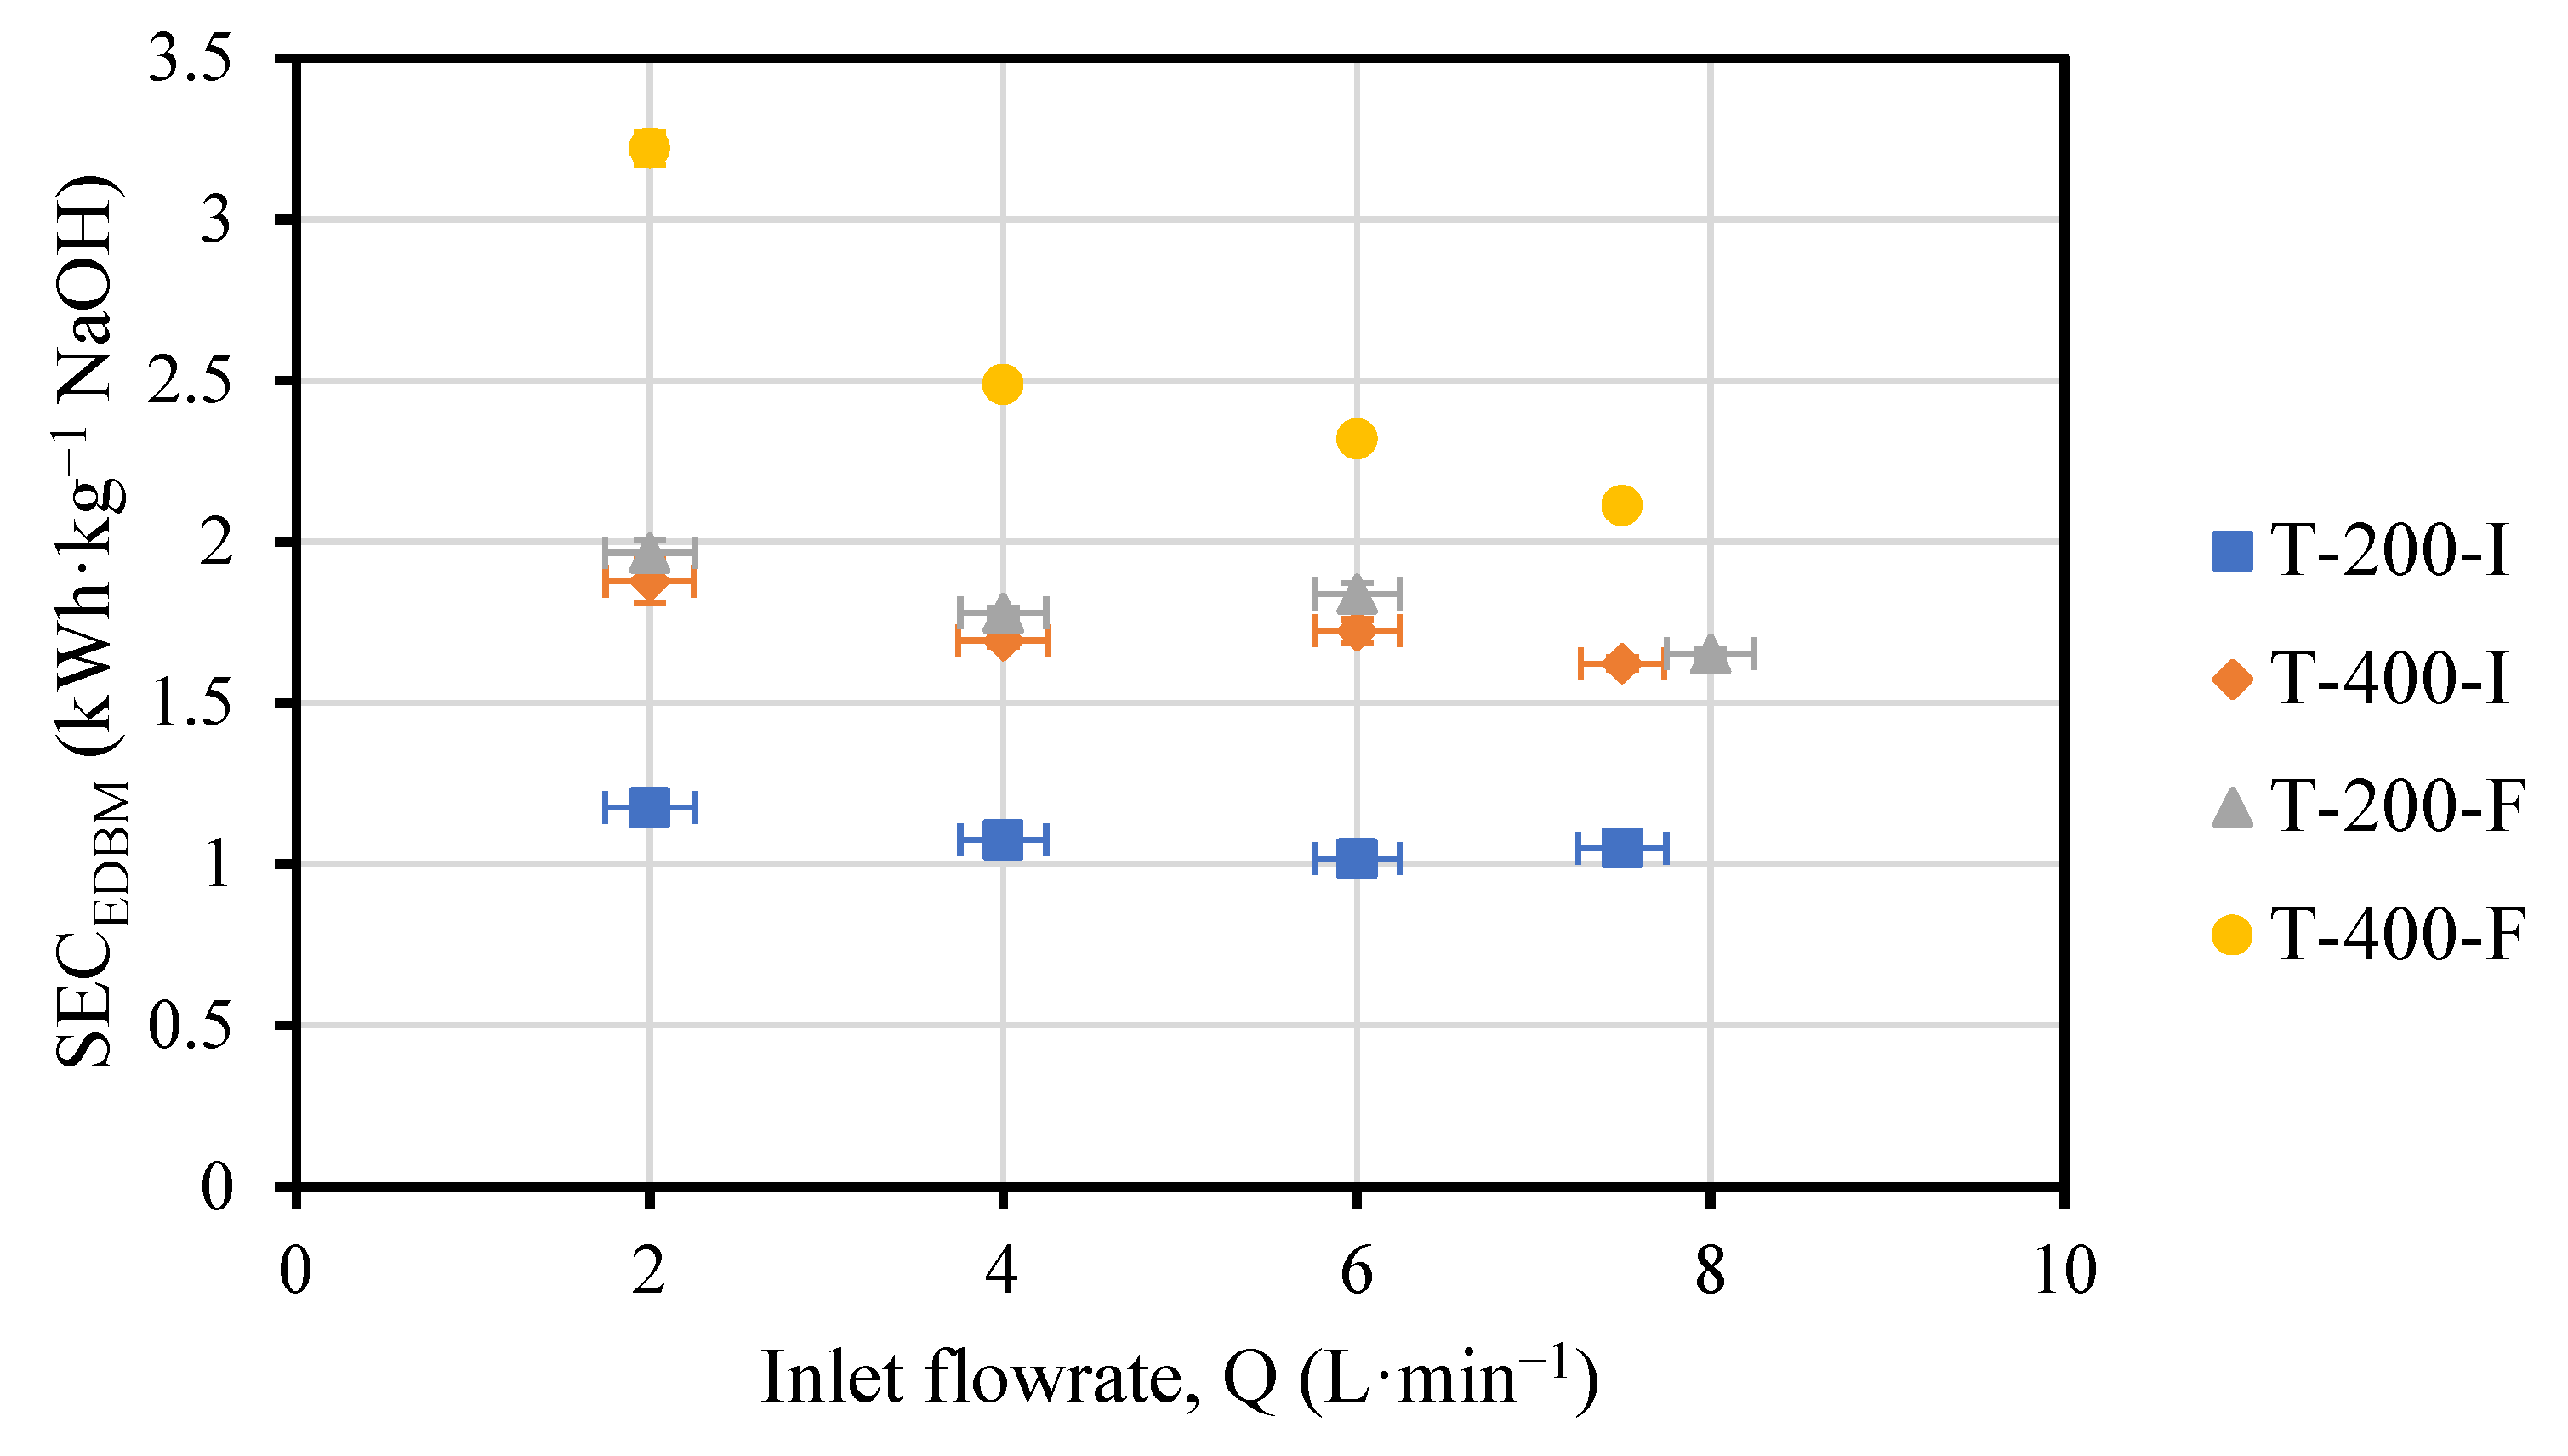
As depicted in Figure 4, SECEDBM slightly decreased when the flowrate was increased in the four cases (T-200-I, T-400-I, T-200-F, and T-400-F). However, within the same experiment, there were no significant changes in the SECEDBM. Since the energy supplied was approximately the same, the SECEDBM variations were due to the production, which, in turn, was dependent on the flowrate and the variation in concentration. Despite the fact that the variation in concentration was reduced, the production was slightly enhanced for higher flowrates, therefore, the SECEDBM was reduced.
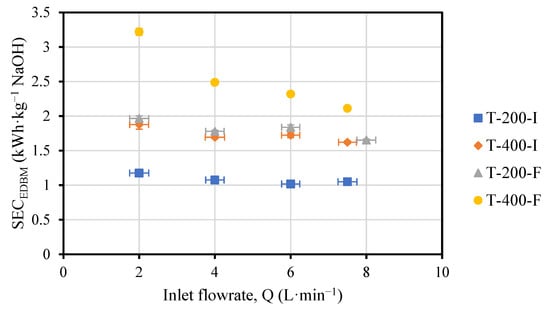
Figure 4.
Values of SECEDBM (kWh·kg−1 NaOH) versus flowrate. Vertical error bars have been estimated via error propagation theory and are so low (i.e., <5%) that cannot be visualized in the figure.
Doubling the current density in the tests with initial conditions (T-200-I and T-400-I) made the SECEDBM 1.6–1.8 times larger, while in the tests with final conditions (T-200-F and T-400-F) the SECEDBM increased only 1.2–1.3 times. Surprisingly, the SECEDBM followed a quite horizonal tendency with the flowrate, except for the case of T-400-F. In this test, the SECEDBM reached values up to 3.2 kWh·kg−1 NaOH and followed a decreasing trend as the flowrate increased. This was related to the fact that the salt at the outlet of the stack was depleted (conductivity value of 3.8 mS·cm−1, see Figure A1), which caused: (i) an increase in the compartment resistance and therefore, an increase in voltage, but also (ii) a limitation of the water splitting phenomena due to the absence of counter-ions in the salt compartment that can compensate the charge balance.
On the other hand, for the tests with the same applied current density, the SECEDBM was 1.8 times higher for T-200-F compared to T-200-I, and 1.2–1.4 times higher for T-400-F compared to T-400-I. The variations were more remarkable in the tests with initial conditions (T-200-I and T-400-I) due to the contribution of the ohmic resistance in the voltage. The stack resistance was higher when the concentrations in the stack were lower (i.e., initial conditions, I), so the energy input was increased not only via a higher current but also via the voltage (composed by the electrode overpotential and the ohmic contribution). At the same time, the voltage was increased by the current and the resistance.
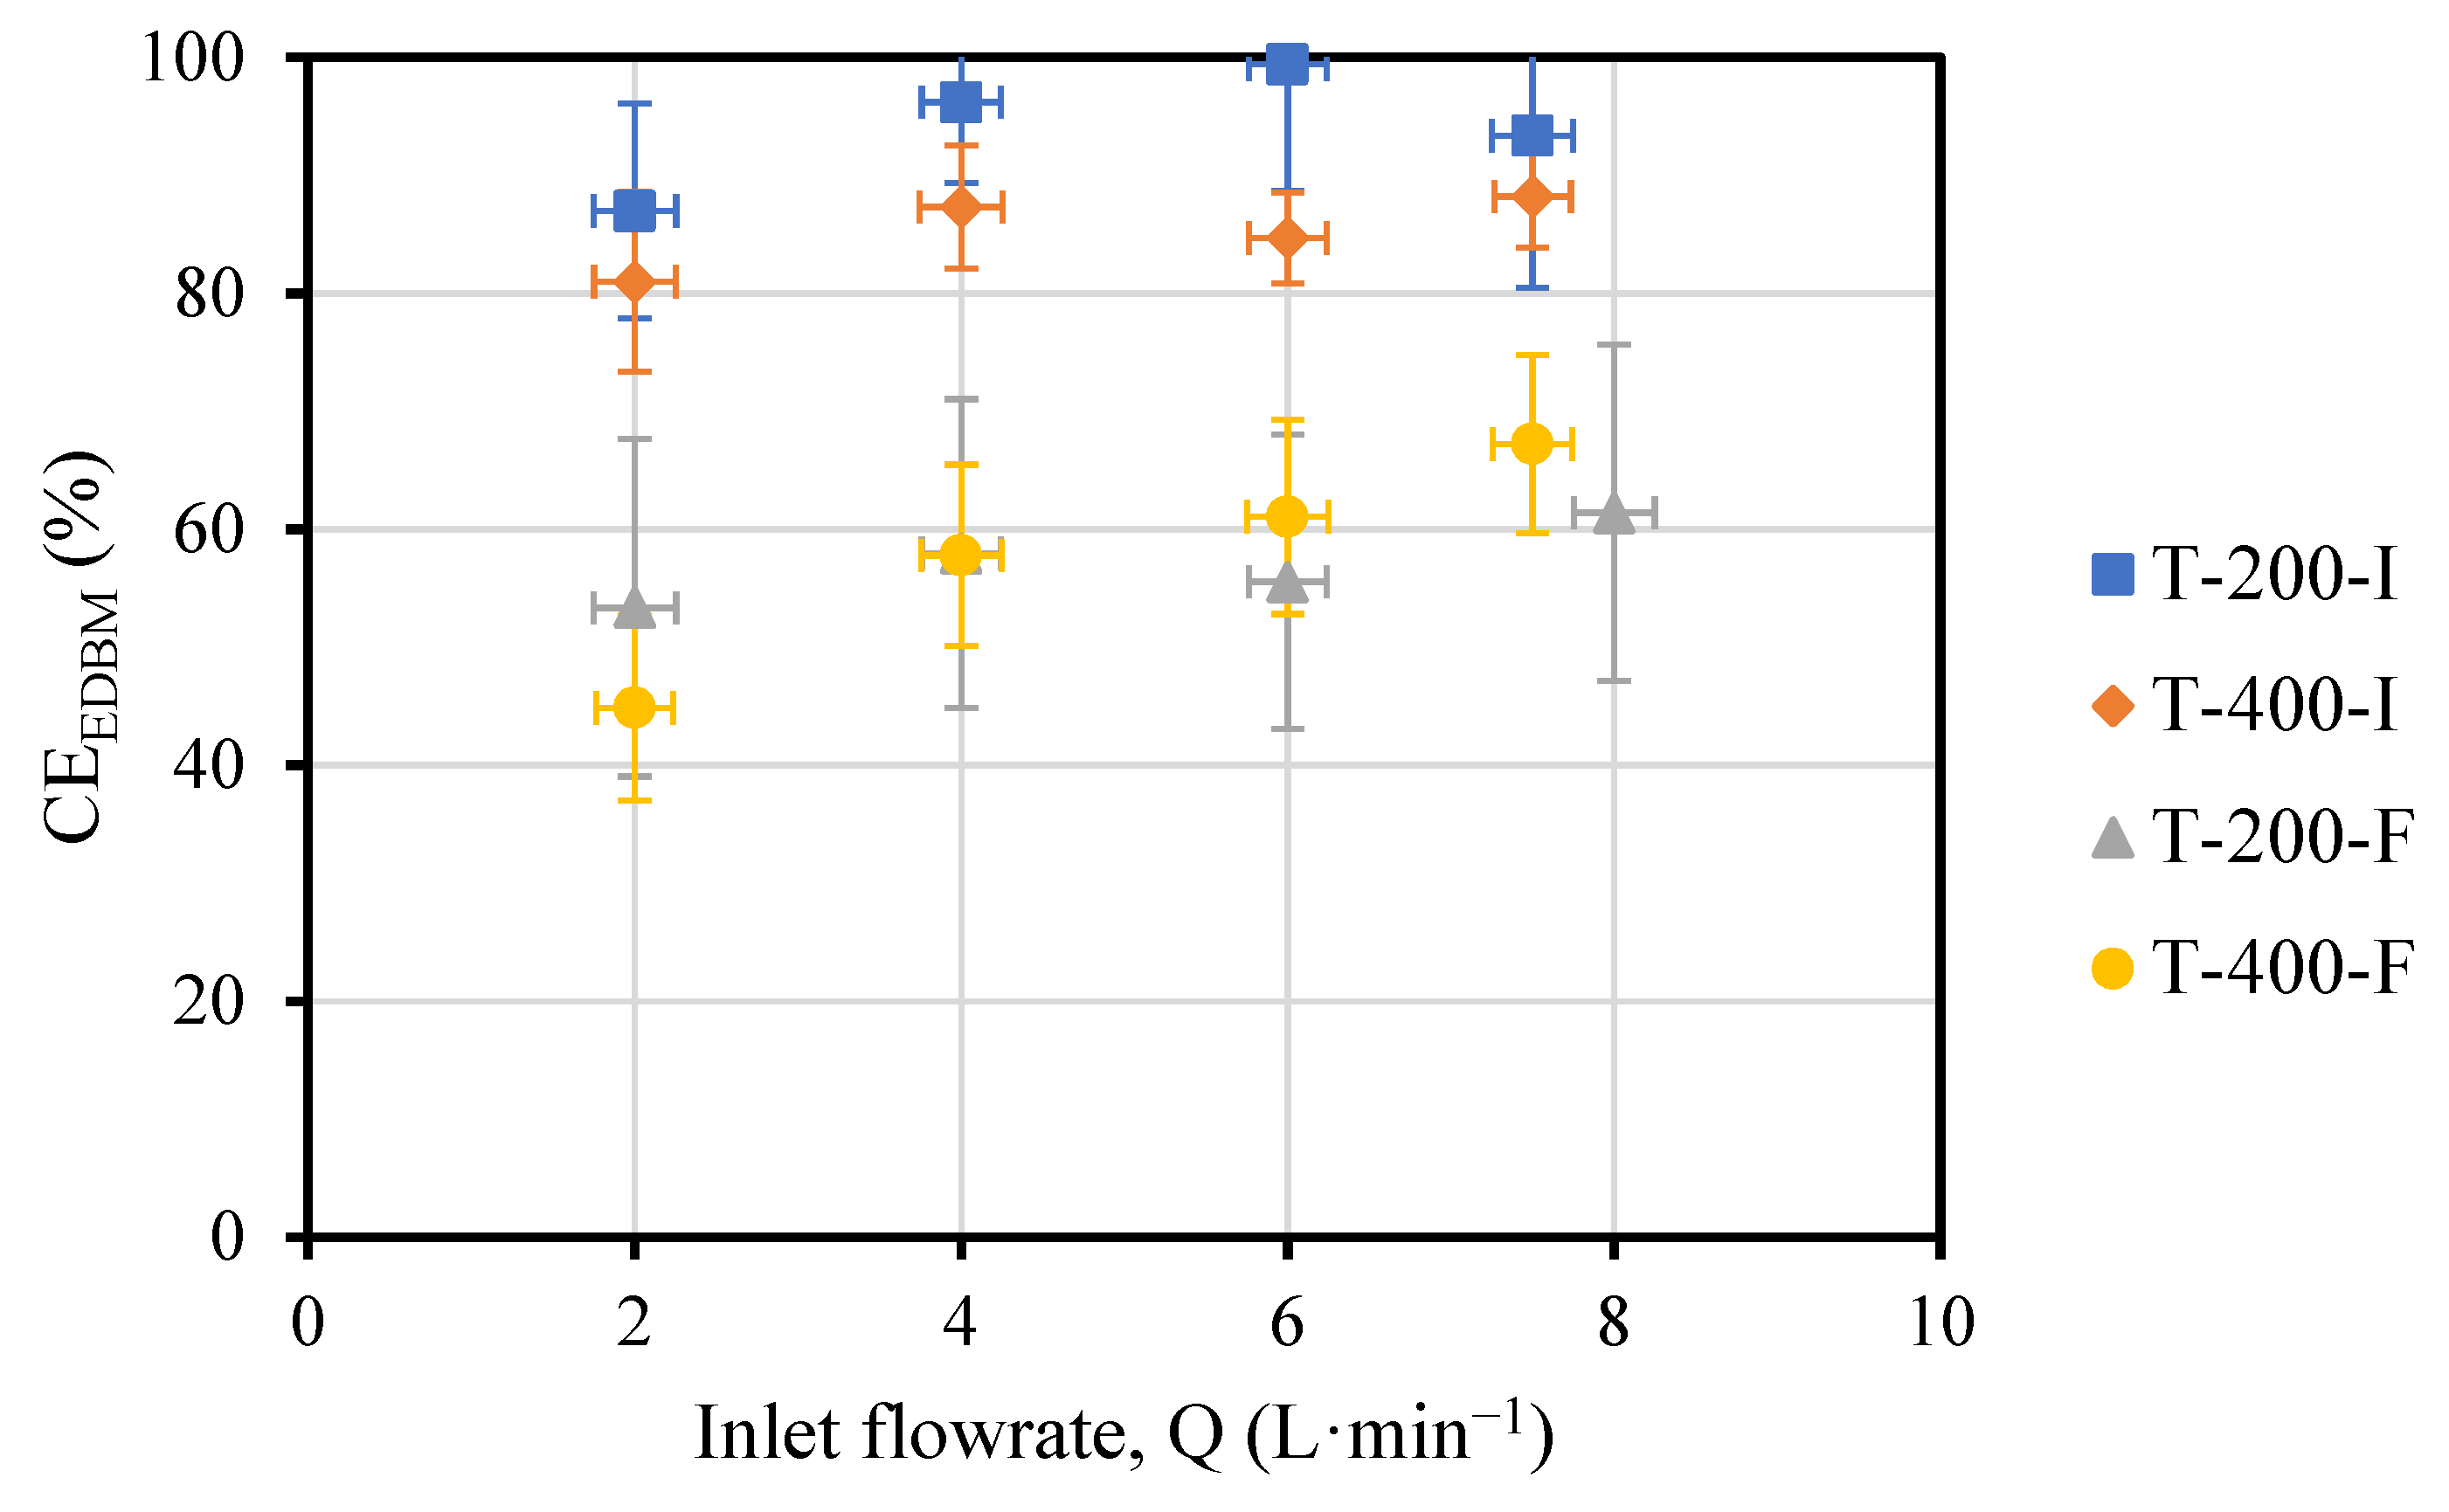
On the other hand, according to Figure 5, a small increase in CEEDBM was observed as the flowrate increased, which was due to an increase in productivity.
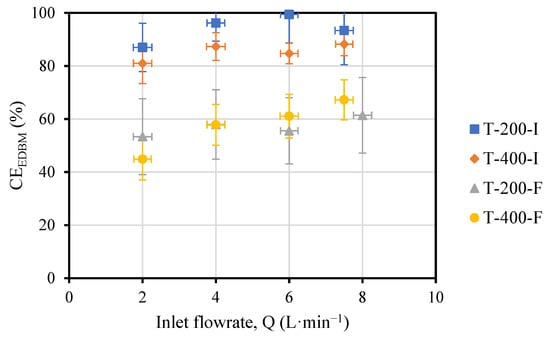
Figure 5.
Profiles of the CEEDBM versus the flowrate for tests.
For the same applied current densities (T-200-I and T-200-F, or T-400-I and T-400-F) the tests with the initial conditions had better CEEDBM (1.8–2.0 times higher for T-200-I compared to T-200-F, and 1.3–1.4 times higher for T-400-I compared to T-400-F). This fact is due to the higher variations in the concentration obtained in the test with the initial conditions than those with the final conditions; that is, there was not so much of a loss of energy (current).
Looking at the CEEDBM, when the current density was increased, a reduction of 20% was observed in the tests with initial conditions, while only 10% differences were observed in the test at the final conditions.
3.2. Effect of ERS Flowrate on the Performance of the EDBM Unit
In this section, results from test T-200-I-ERS and T-400-I-ERS, in which the ERS flowrate was manipulated, are presented. Data related to the variation of electrical conductivities is reported in Figure A2.
The performance in the variation of concentration profiles (Figure 6) was different between the T-200-I-ERS (Figure 6a) and the T-400-I-ERS (Figure 6b) tests. For T-200-I-ERS, the acid concentration slightly decreased when increasing the flowrate, while the base concentration slightly increased. However, the changes throughout the test were small, for both products (<0.02 mol·L−1). In T-400-I-ERS, a maximum in the variation of concentration was observed for both products (although the acid concentration was somewhat lower due to the mobility and migration of protons) for the flowrate of 20 L·min−1, which was the flowrate recommended by the supplier for the ERS channel. In this case, the changes throughout the test were very small (<0.02 mol·L−1).
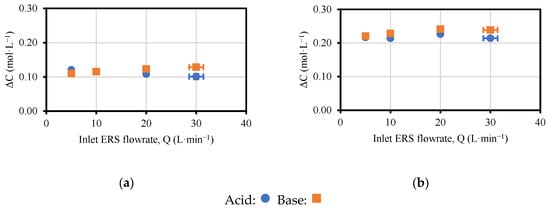
Figure 6.
Values of concentration variation versus flowrate: (a) T-200-I-ERS; (b) T-400-I-ERS.
The final concentration and, therefore, the variation of concentration increased along with the current density. Almost twice the amount of concentration variation was achieved (for both NaOH and HCl) when the current density was doubled (from 200 A·m−2 in T-200-I-ERS to 400 A·m−2 in T-400-I-ERS).
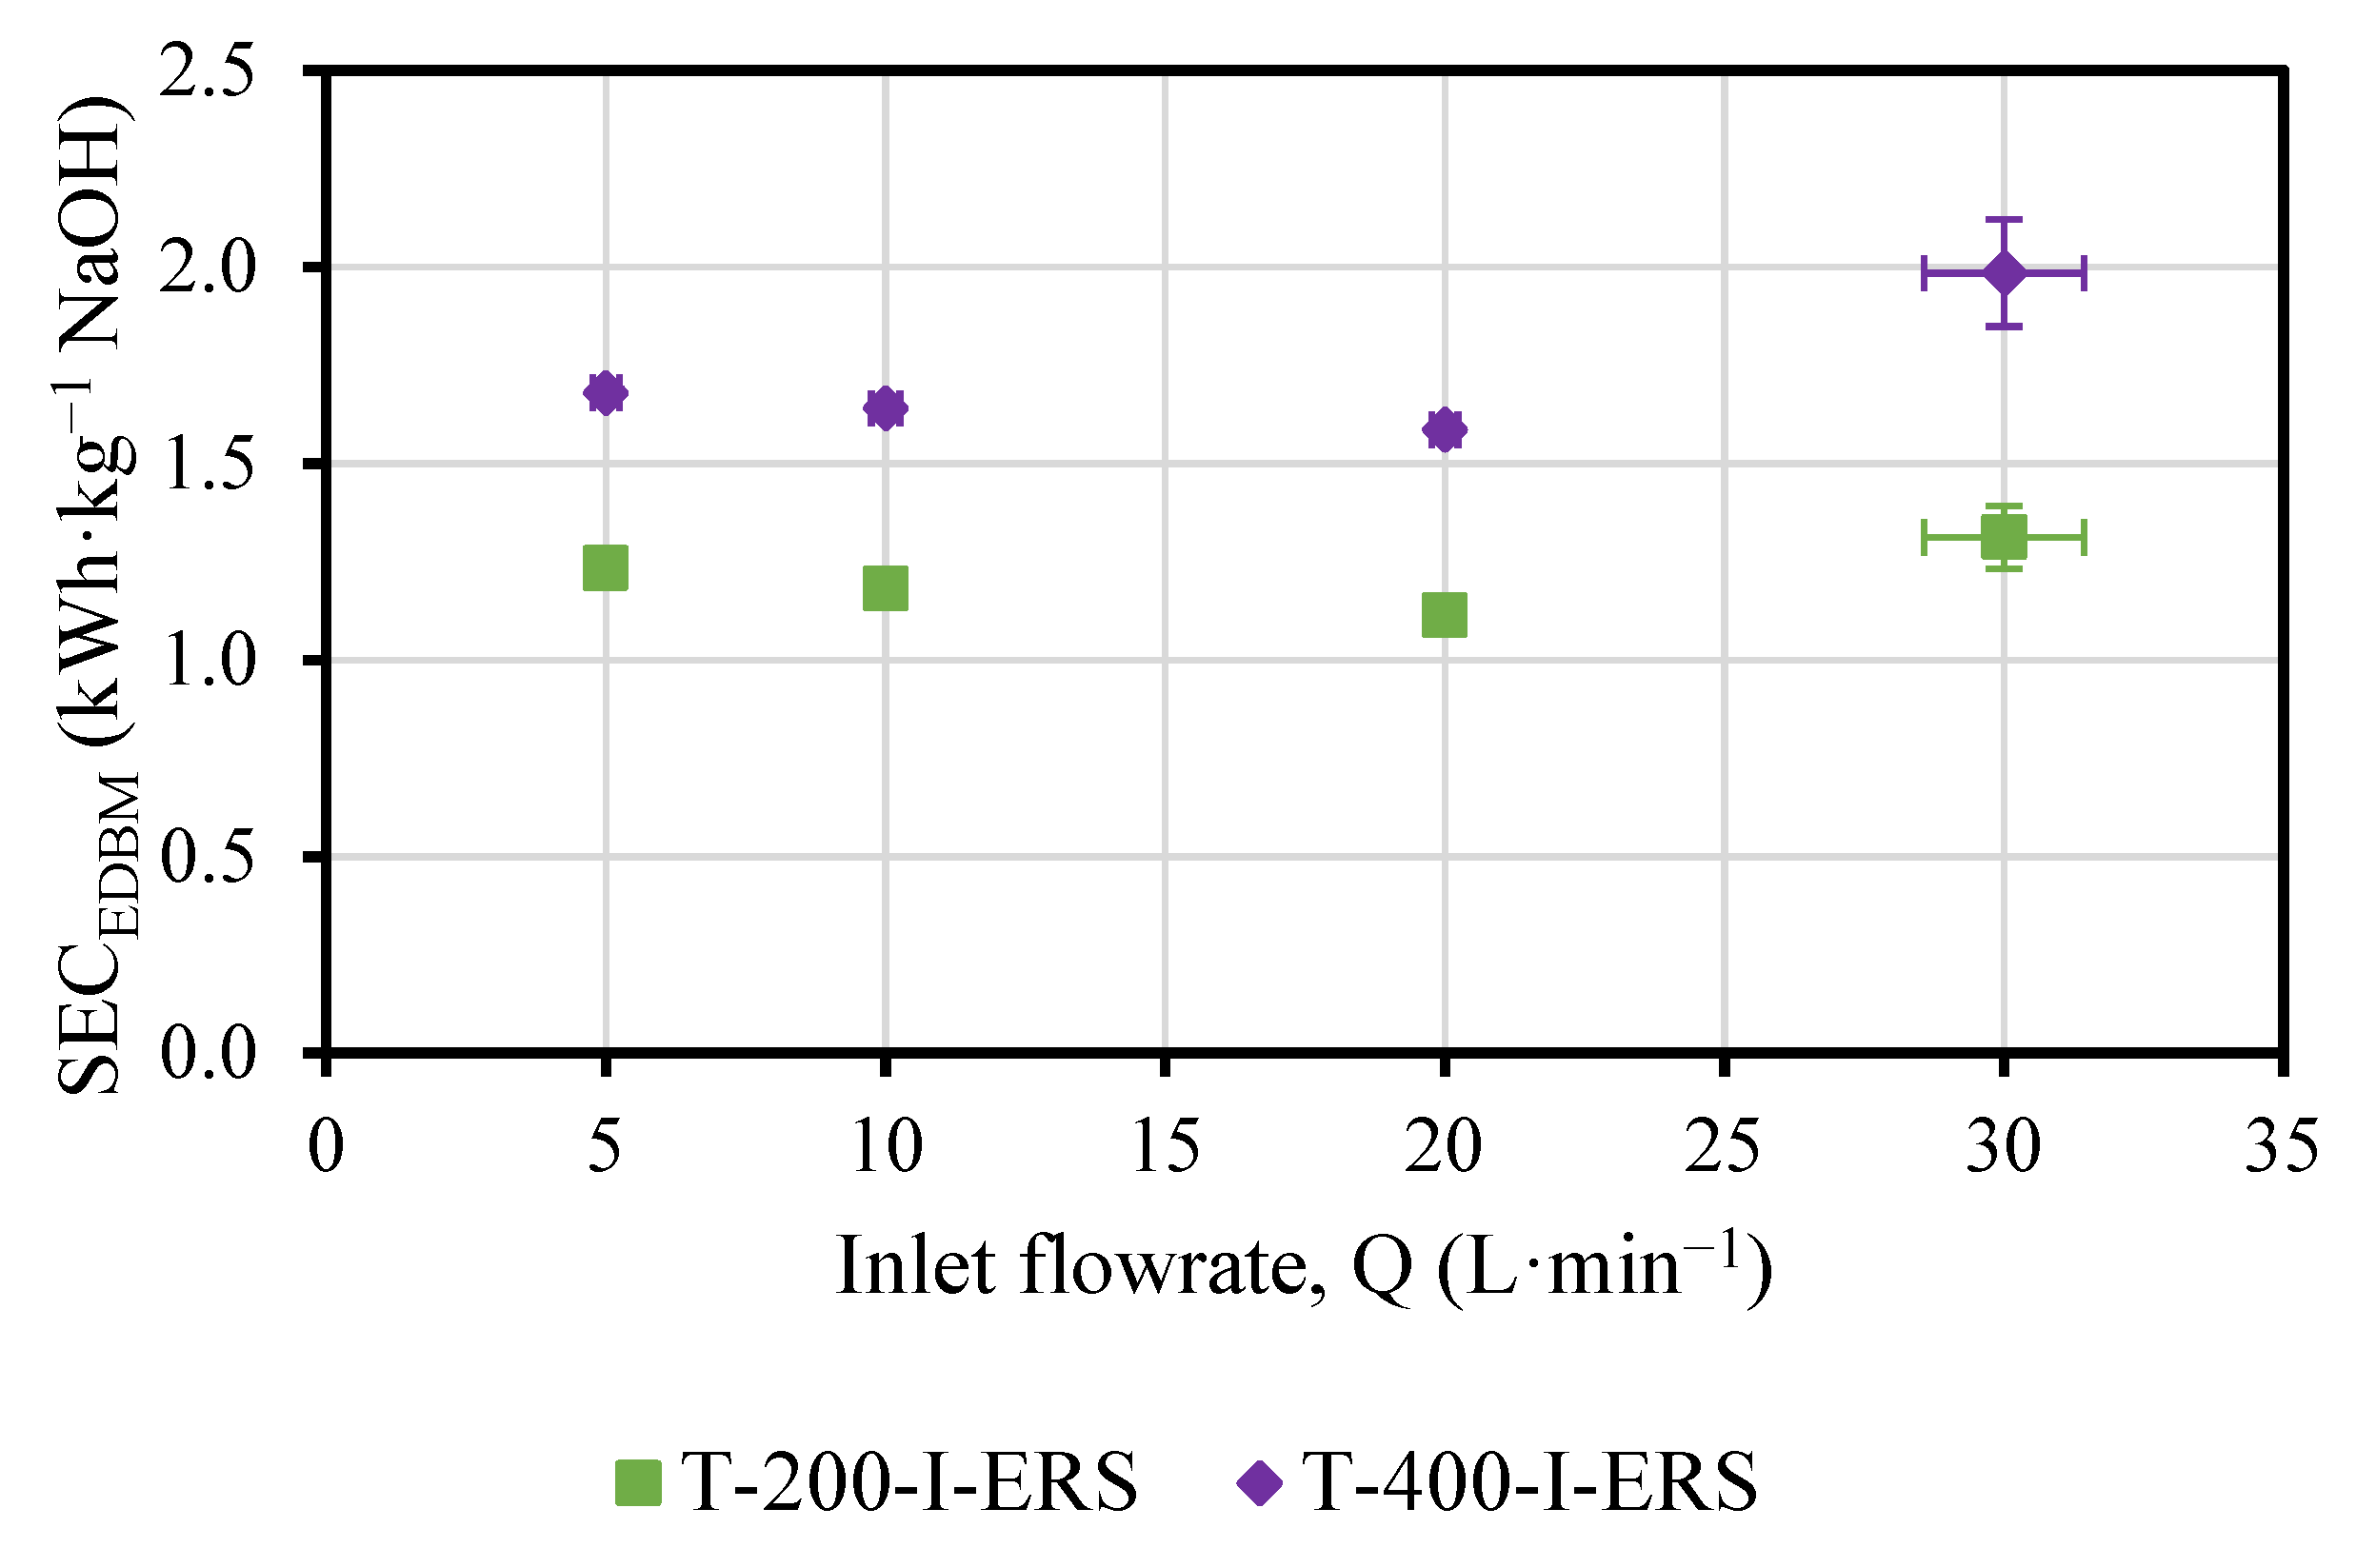
Both the SECEDBM (Figure 7) and the CEEDBM (Figure 8) were slightly affected by the variations in concentration obtained.
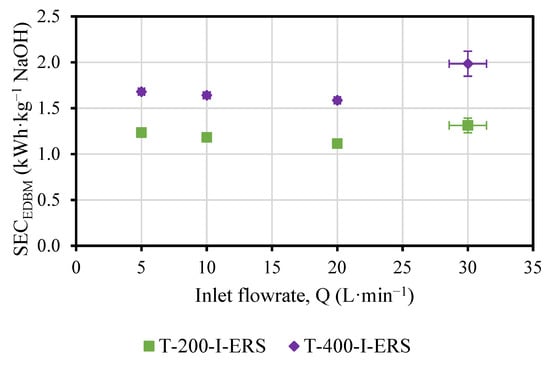
Figure 7.
SECEDBM versus the flowrate (Q) and as a function of the applied current density.
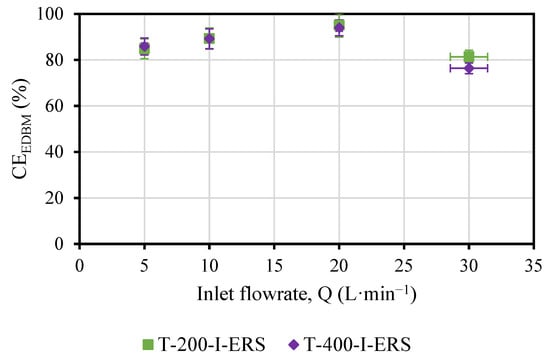
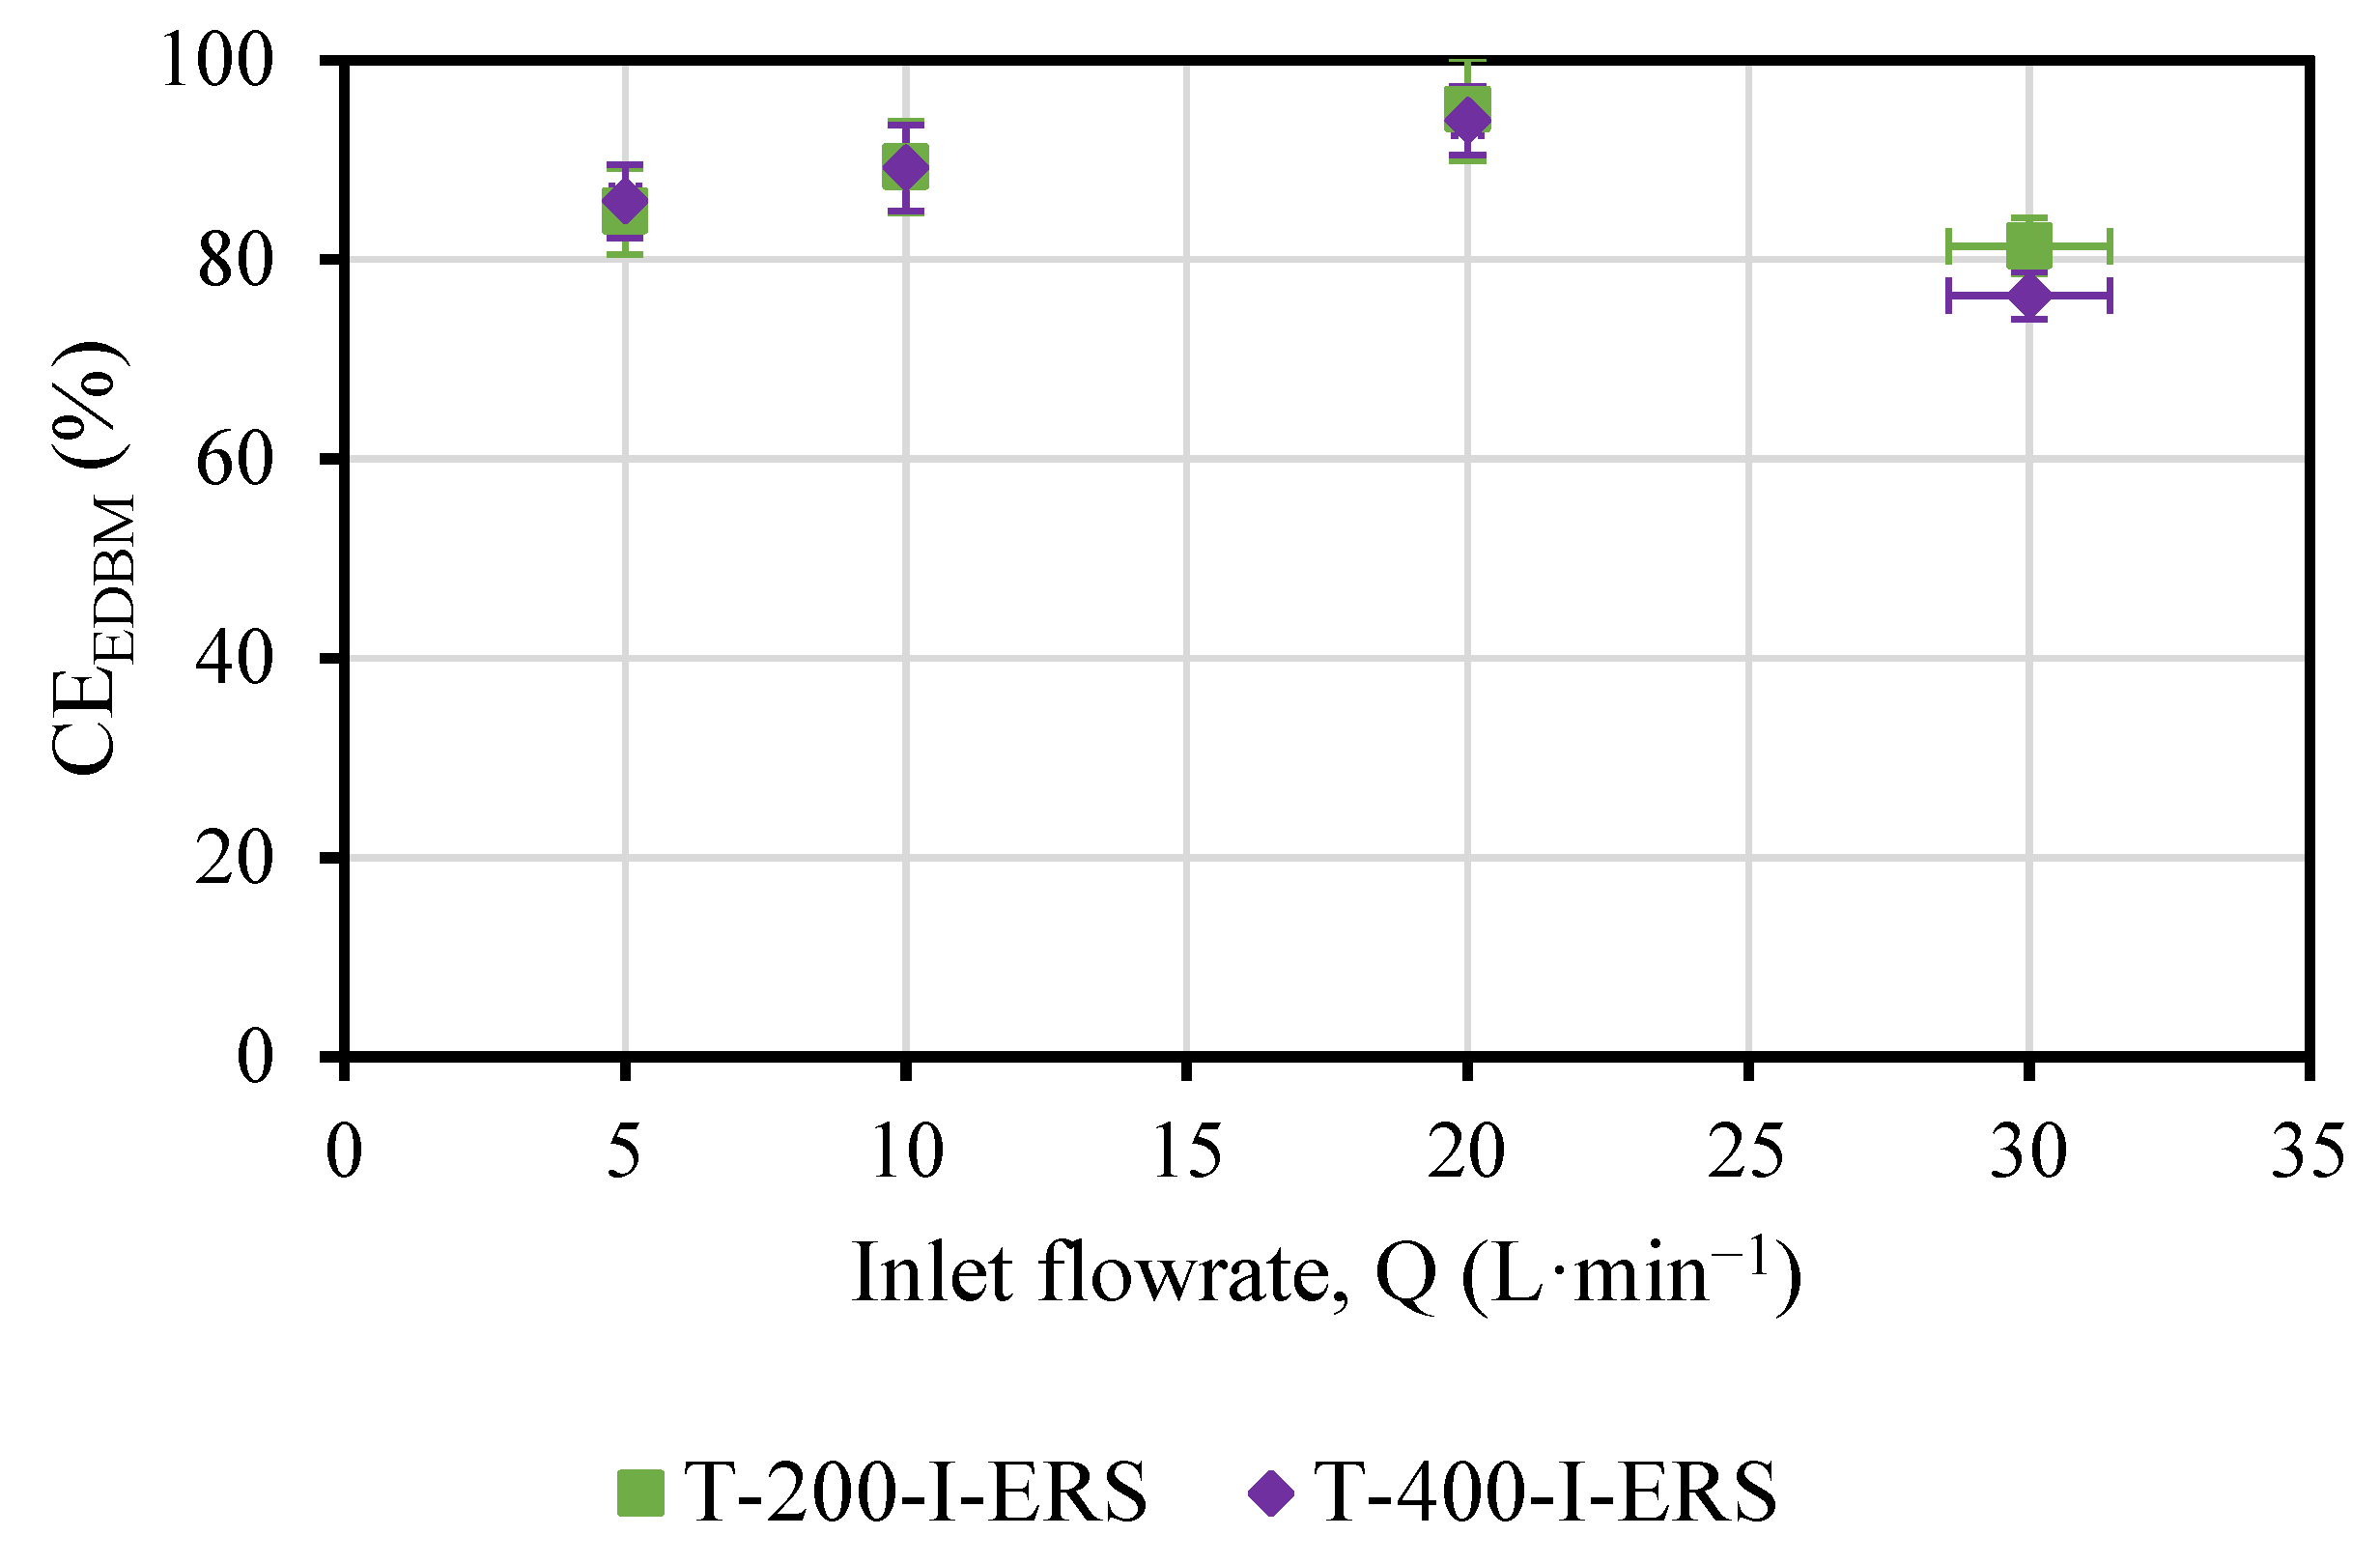
Figure 8.
CEEDBM versus the flowrate and as a function of the applied current density.
A minimum in the SECEDBM was observed for the flowrate of 20 L·min−1 (nominal flowrate) for both T-200-I-ERS and T-400-I-ERS.
The SECEDBM increased 1.3–1.5 times when the current density was doubled. Since the variation in concentration was doubled by changing the current density, the increase in SECEDBM was due to the higher power consumption, and, in particular, to the voltage associated with the ohmic behavior (in turn, it is dependent on the current).
Similar behavior was observed for the T-200-I-ERS and the T-400-I-ERS tests (Figure 8), where a maximum in the CEEDBM was observed for the flowrate of 20 L·min−1 (nominal flowrate). The changes in CEEDBM throughout the test were <13% for T-200-I-ERS and <5% for T-400-I-ERS. The changes in the CEEDBM by doubling the current density were minimal (<5%) since twice the variation of the concentration was achieved.
3.3. Evaluation of Pumping Contribution to SECTotal
In this section, results from the calculation of the SECPump and SECTotal are presented.
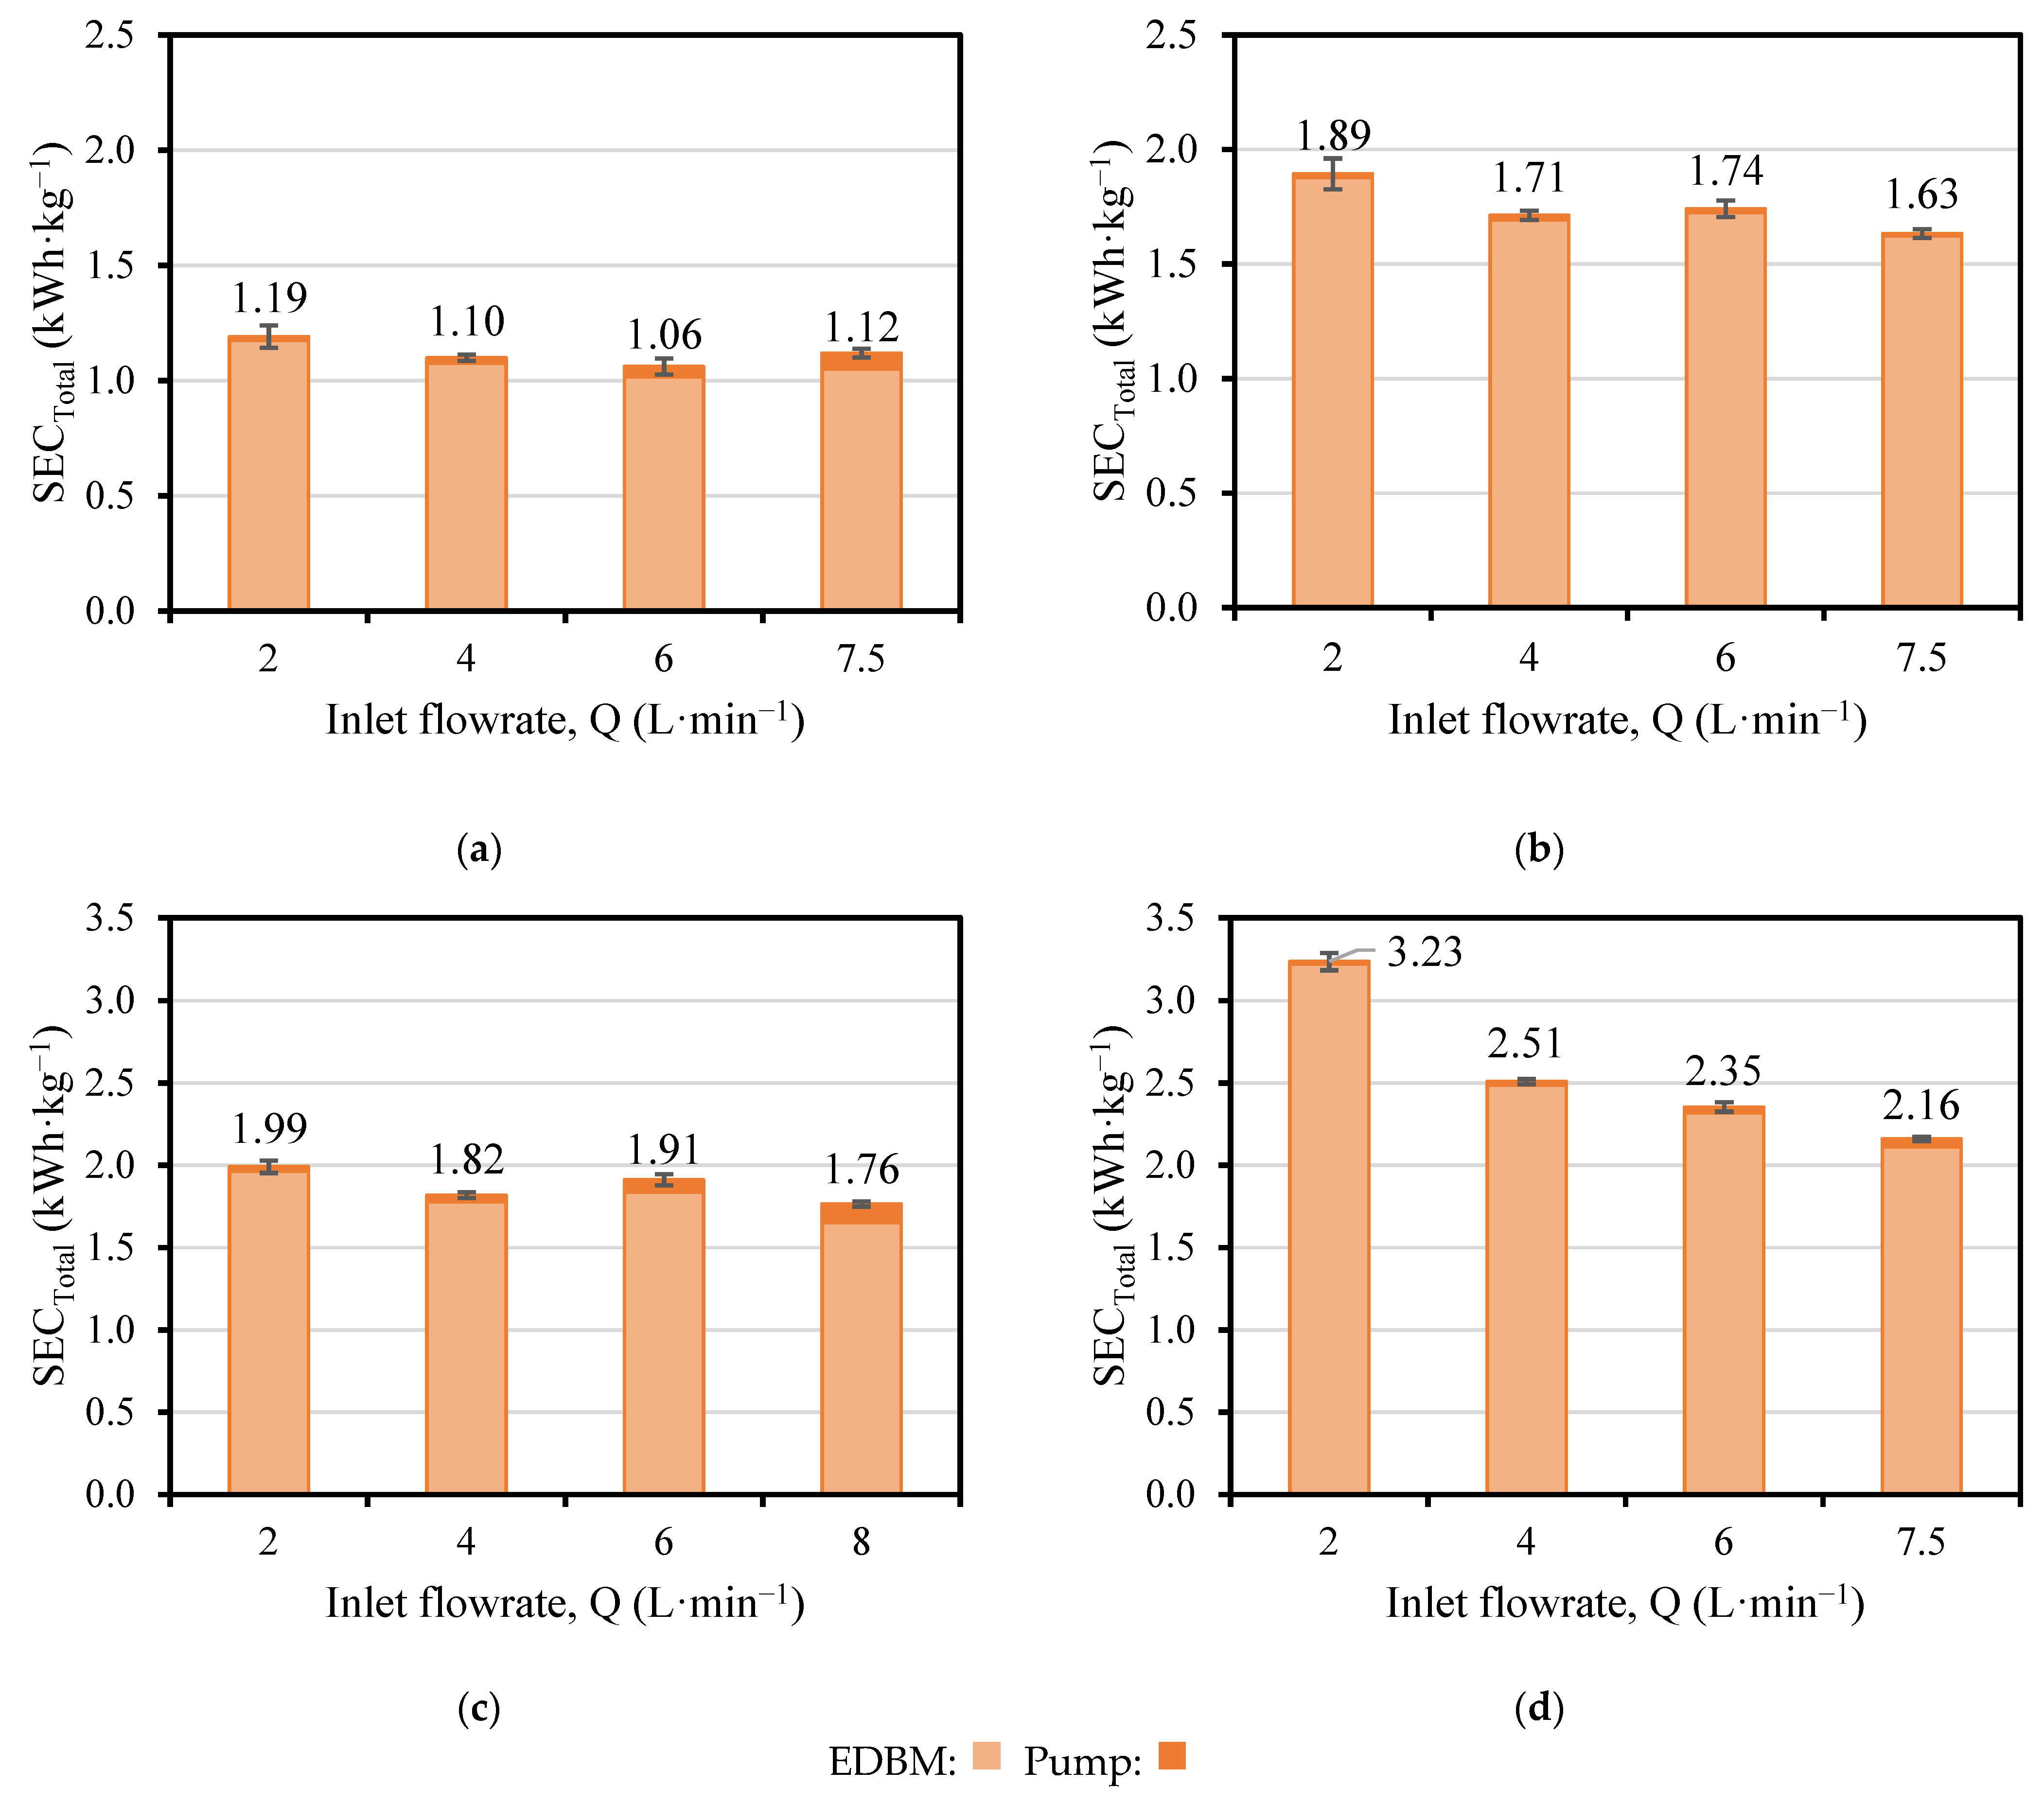
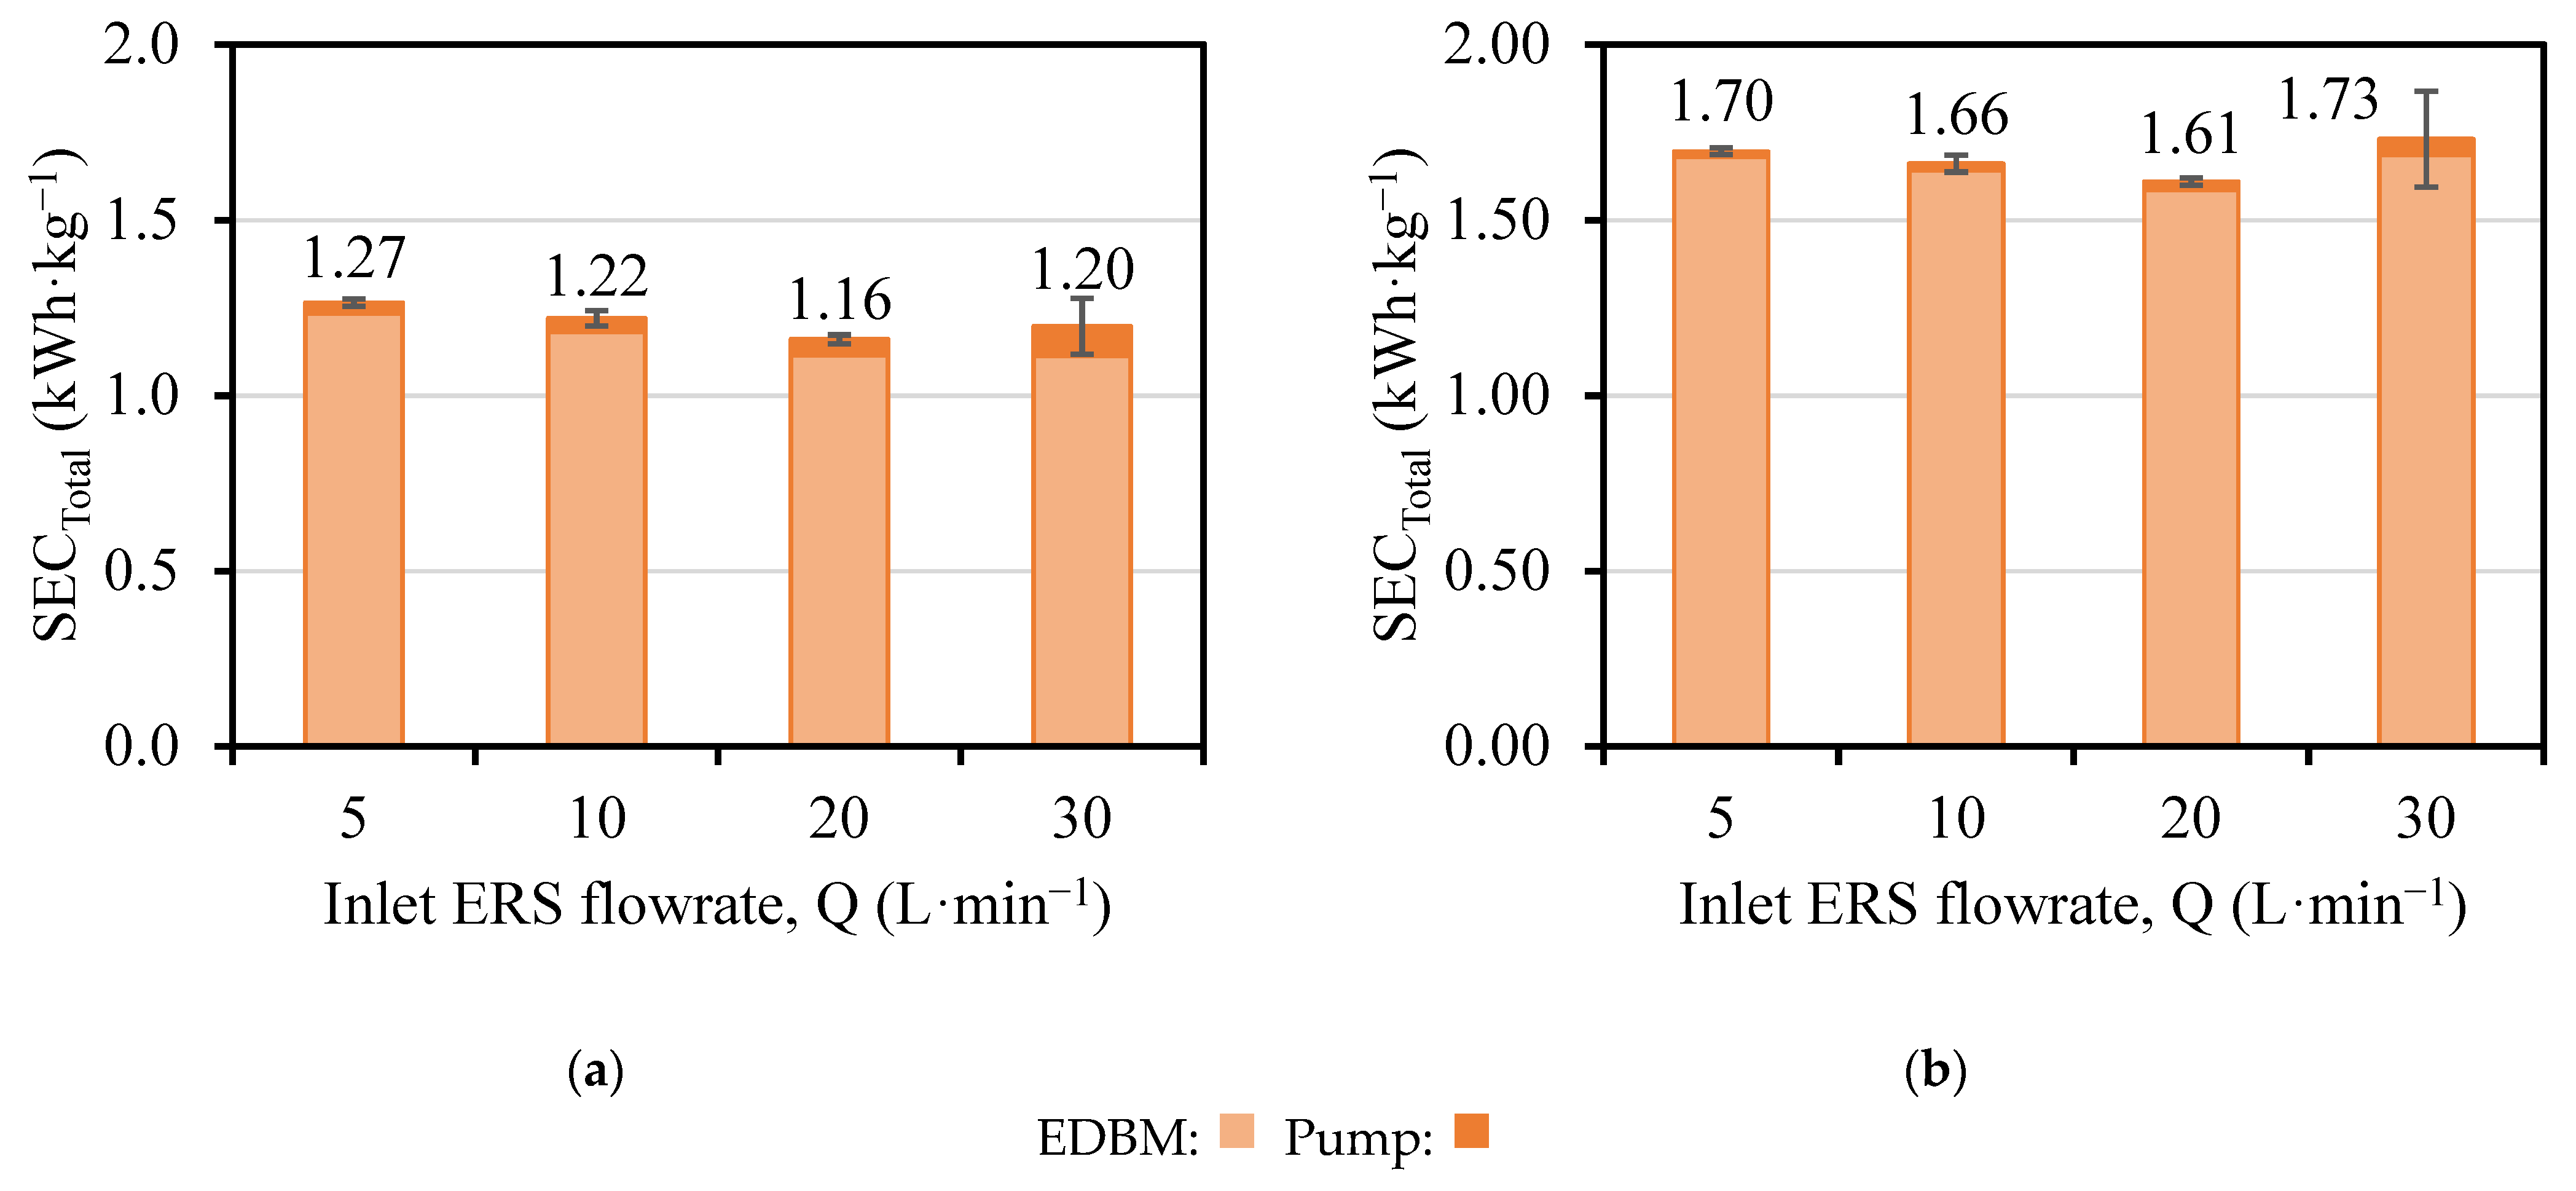
Increasing the flowrate by definition increases the pumps consumption (Equation (3)), and therefore the SECPump, as seen in Figure 9 and Figure 10. Although the SECPump presented values two orders of magnitude lower than the SECEDBM, it may have an impact on the estimation of the SECTotal given that the SECEDBM presents values with small variations, but with a growing trend regarding the increase in flowrate. In particular, the contribution of the SECPump to SECTotal in the tests employing 200 A·m−2 current density (T-200-I and T-200-F) was in the range of 1.3–6.9%, while in the 400 A·m−2 current density tests (T-400-I and T-400-F) it was in the range of 0.5–2.3%.
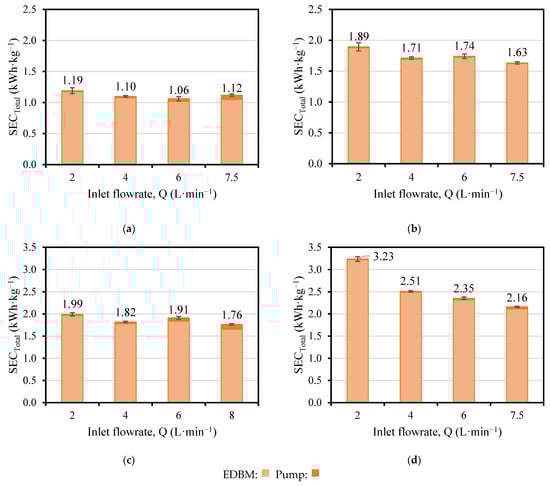
Figure 9.
Values of SECTotal versus flowrate: (a) T-200-I; (b) T-400-I; (c) T-200-F; (d) T-400-F.
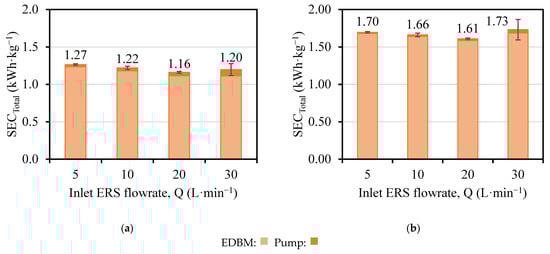
Figure 10.
SECTotal versus the flowrate and as a function of the applied current density (a) T-200-I-ERS; (b) T-400-I-ERS.
For the tests in which the acid, base and saline channel flowrates have been manipulated (T-200-I, T-200-F, T-400-I and T-400-F), different trends for the SECTotal were observed depending on the current density employed. Due to the similar values obtained with the tests T-200-I and T-200-F (Figure 9a,c), an Analysis of Variance (ANOVA) was performed to evaluate if the values were statistically different (F > Fcr). Accordingly, the analysis of the values obtained for both tests reported that the SEC values were statistically different (10.1 > 5.9 for T-200-I and 6.1 > 5.9 for T-200-F). Therefore, it can be observed that a minimum value for SECTotal was obtained for the tests T-200-I and T-200-F (Figure 9a,c) between flowrates of 4 and 6 L·min−1, which may correspond to the nominal flowrate for these compartments (5 L min−1). On the other hand, for tests T-400-I and T-400-F (Figure 9b,d), there was a decreasing trend for SECTotal, that is, the lowest value of SECTotal was given by the highest flowrate.
For the tests in which the ERS channel flowrate has been manipulated (T-200-I-ERS and T-400-I-ERS), different trends for the SECTotal were reported, with a decreasing trend for the increase in the flowrate in T-200-I-ERS (Figure 10a), while in T-400-I-ERS (Figure 10b) a minimum value for SECTotal was obtained in the nominal flowrate (20 L·min−1). Contributions of 3.2–6.4% and 1.2–2.3% for tests T-200-I-ERS and T-400-I-ERS were respectively obtained.
4. Conclusions
In this work, the effect of flowrates of acid, base, salt and ERS solutions, and the current density on the performance of EDBM in terms of H+ and OH− generation, SECEDBM and CEEDBM have been evaluated.
In relation to the effect of acid, base and salt flowrates, it was observed that the values tested reported a higher increase in the concentrations of acid and base in one single pass. It was also observed that the concentrations of base were slightly higher than the ones of acid due to the higher H+ diffusion and the non-ideality of the AEMs. Regarding the concentrations of the solutions at the beginning of the experiment, the higher their values, the higher the H+ and OH− concentrations. This was related to a higher contribution of non-ideal phenomena when working with higher concentrations. As expected, a higher current density enhanced the production of H+ and OH− in agreement with the second Wien effect. It was observed that the best values for SECEDBM (1.02–1.18 kWh·kg−1 NaOH) and CEEDBM (ca. 100%) were attained working at higher saline concentrations and low current densities.
On the contrary, the ERS flowrate showed little effect on the H+ and OH− concentrations, as well as on SECEDBM and CEEDBM. Nevertheless, a minimum value of SECEDBM was observed when working at 20 L·min−1 ERS (nominal operating conditions), independently of the current density applied.
Finally, the contribution of the pumping needs to the SECTotal was determined. As expected in the electro-membrane processes, the energy consumed related to the EDBM represented the majority of the contribution to the SECTotal. In all the scenarios, the pumping needs remained below 7%.
Author Contributions
Conceptualization, J.L., M.H.-G., A.C. and A.T.; methodology, A.C. and J.L.; formal analysis, J.L. and M.H.-G.; investigation, J.L. and M.H.-G.; resources, A.C., A.T. and G.M.; writing—original draft preparation, J.L., M.H.-G., G.V. and C.C.; writing—review and editing, A.T., A.C., J.L.C., R.I. and G.M.; visualization, J.L. and M.H.-G.; supervision, J.L.C., R.I. and A.C.; project administration, G.M.; funding acquisition, G.M. All authors have read and agreed to the published version of the manuscript.
Funding
This project has received funding from the European Union’s Horizon 2020 research and innovation programme under grant agreement 869474 (WATER-MINING, https://watermining.eu/ (accessed 1 February 2023)). This output reflects only the author’s view. The European Health and Digital Executive Agency (HaDEA) and the European Commission cannot be held responsible for any use that may be made of the information contained therein. M. Herrero-Gonzalez and J. López research was developed under the Margarita Salas postdoctoral fellowship from Ministerio de Universidades (MIU) and founded by the European Union–NextGenerationEU.
Data Availability Statement
Data will be available by request.
Acknowledgments
Authors acknowledge the help of F. Vassallo during the experimental campaign.
Conflicts of Interest
The authors declare no conflict of interest.
Abbreviations
| Acronyms/Abbreviations | |
| AEM | Anion exchange membrane |
| BPM | Bipolar membrane |
| CEM | Cation exchange membrane |
| EDBM | Electrodialysis with bipolar membranes |
| ERS | Electrode rinse solution |
| PP | Polypropylene |
| RO | Reverse osmosis |
| SWRO | Sea water reverse osmosis |
| TRL | Technology readiness level |
| ZLD | Zero liquid discharge |
Nomenclature
| Symbols | |
| C | Molar concentrations in the channel |
| CE | Current efficiency |
| F | Faraday constant |
| I | Current |
| MW | Molecular weight |
| n | Number of triplets |
| η | Pump efficiency |
| P | Pressure in the stack |
| Pcons | Energy consumed by the pumping system |
| Q | Volumetric flowrate in the stack |
| SEC | Specific energy consumption |
| V | Voltage |
| z | Ion valence |
| Subscripts/Superscripts | |
| EDBM | Related to the electrodialysis with bipolar membranes |
| in | Inlet |
| out | Outlet |
| pump | Related to pumping |
| Total | Related to both EDBM and pumping |
Appendix A. Electrical Conductivity Profiles
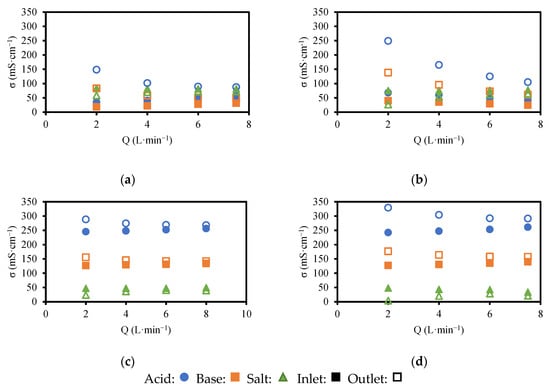
Figure A1.
Values of conductivity versus feed flowrate: (a) T-200-I; (b) T-400-I; (c) T-200-F; (d) T-400-F.
Figure A1.
Values of conductivity versus feed flowrate: (a) T-200-I; (b) T-400-I; (c) T-200-F; (d) T-400-F.
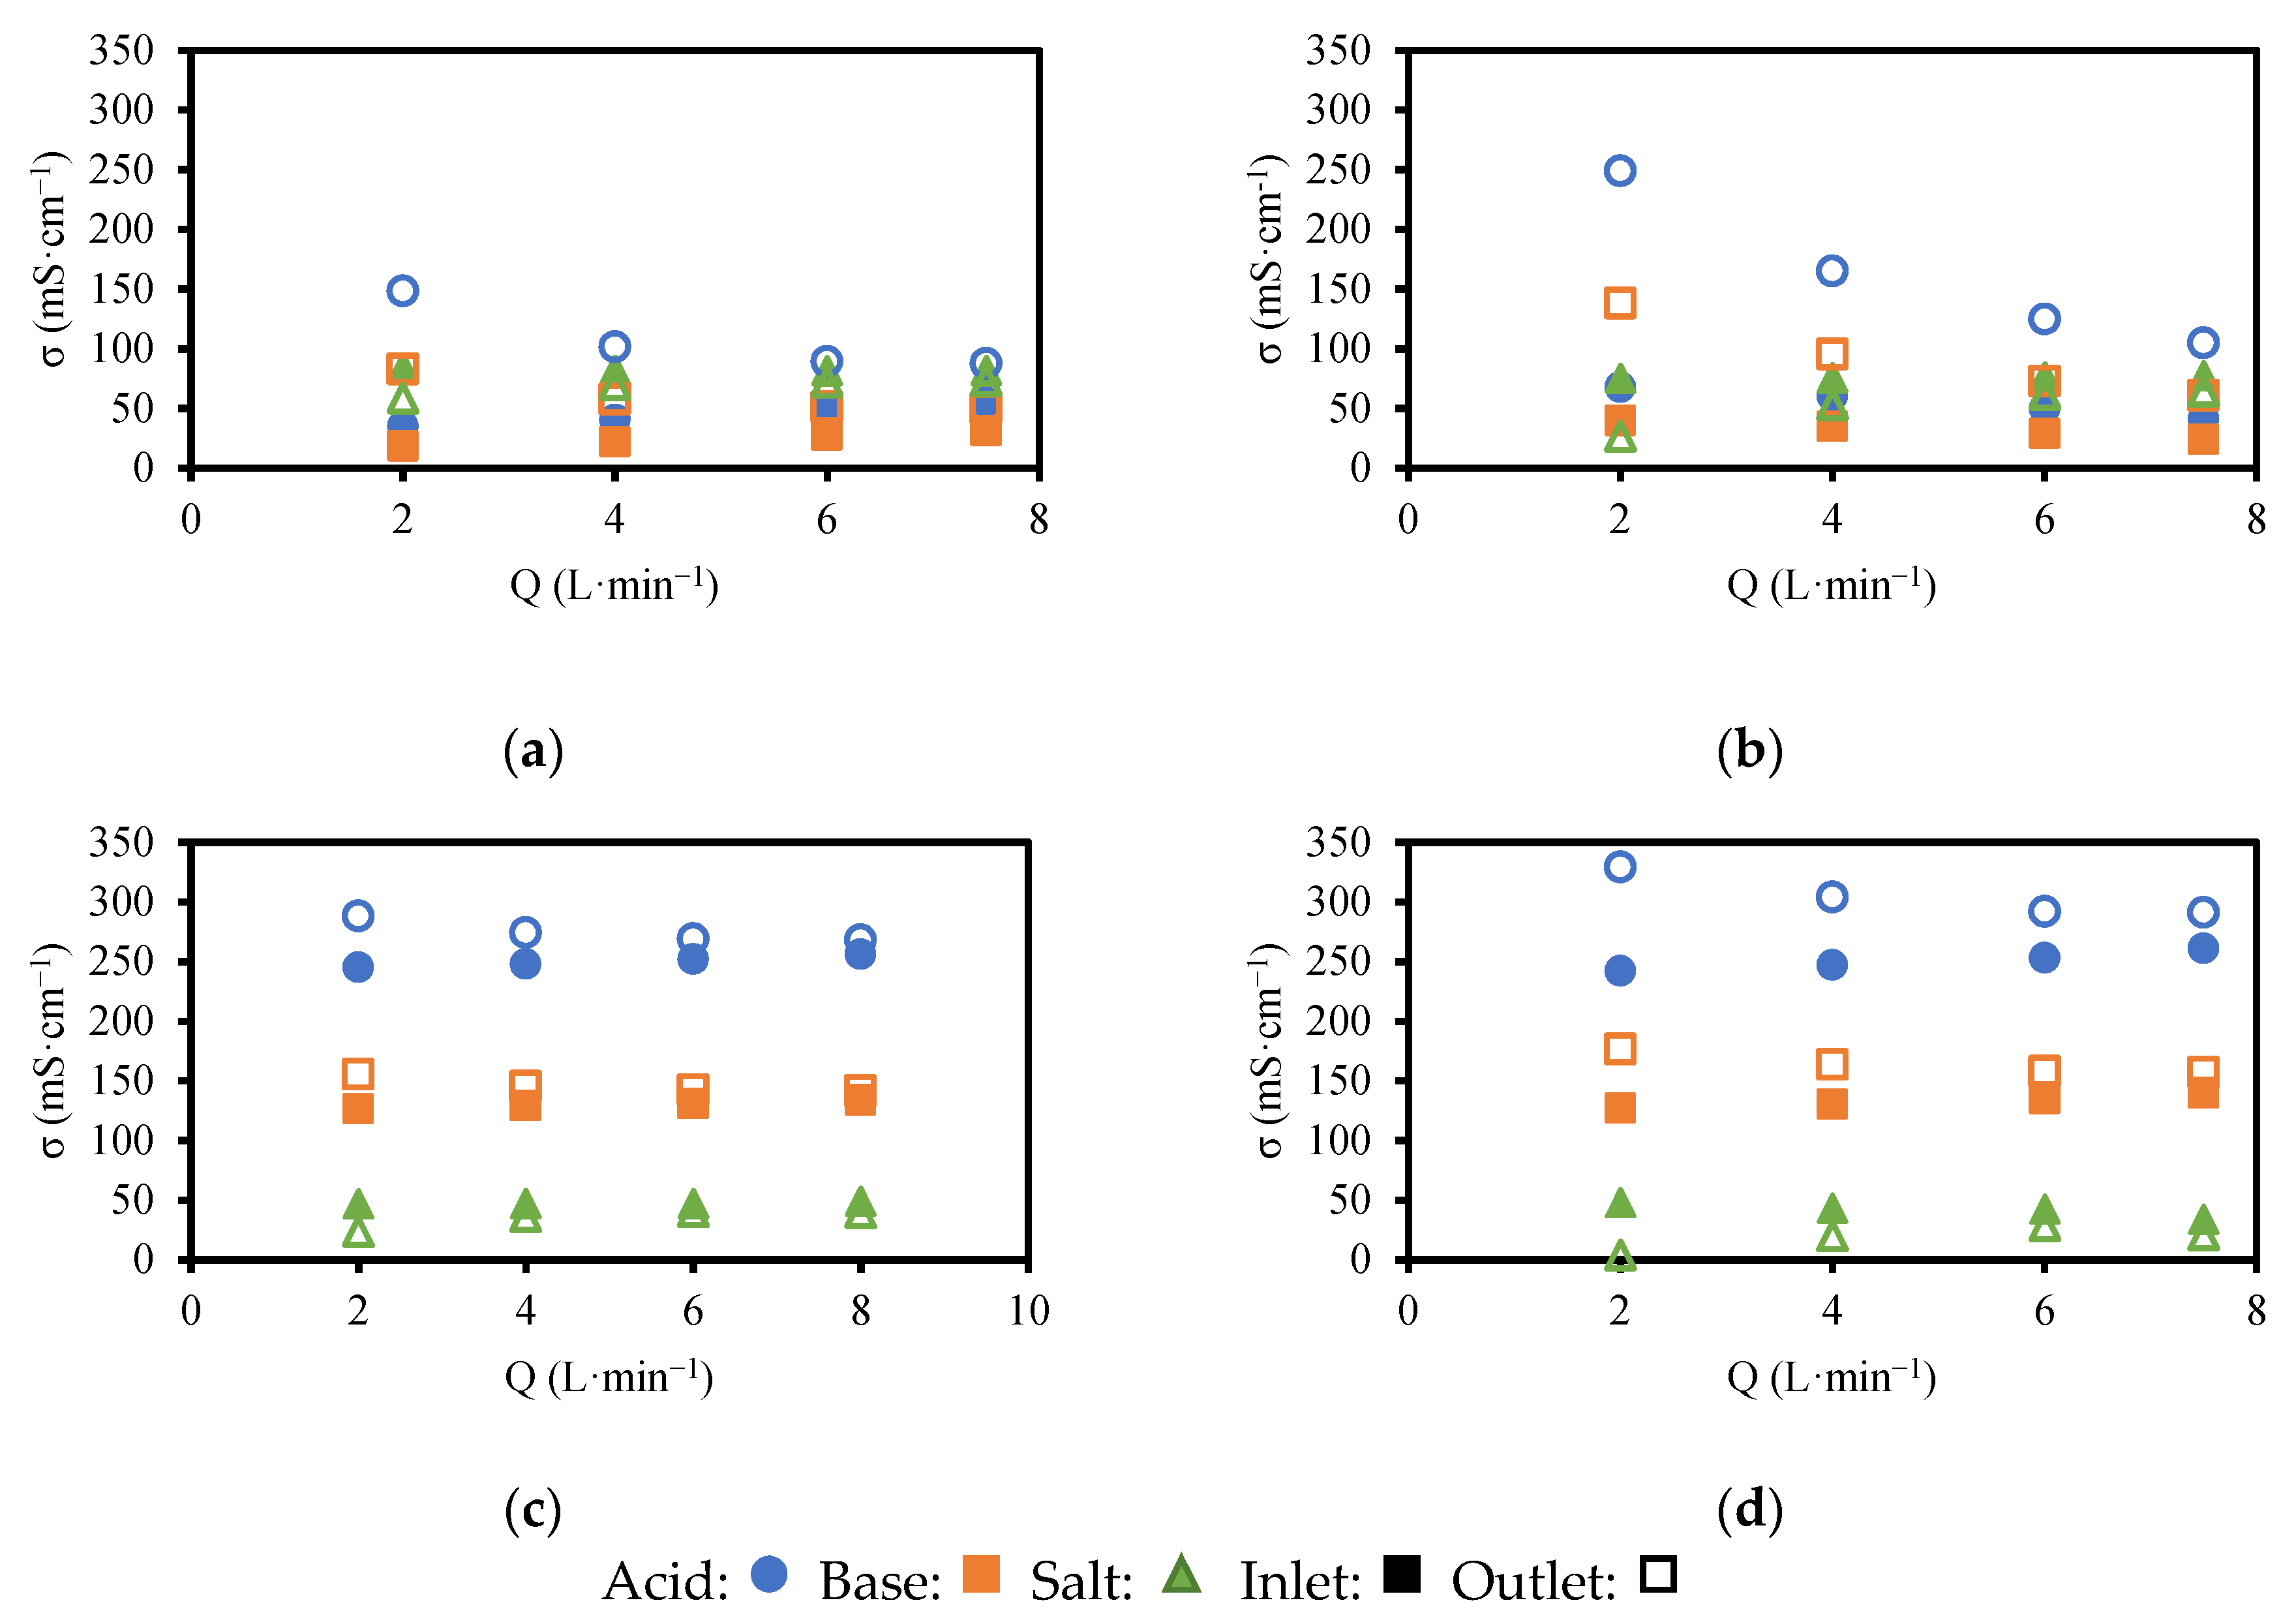
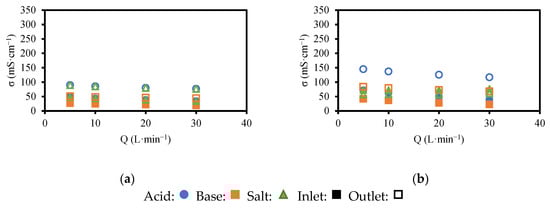
Figure A2.
Values of conductivity versus feed flowrate: (a) T-200-I-ERS; (b) T-400-I-ERS.
Figure A2.
Values of conductivity versus feed flowrate: (a) T-200-I-ERS; (b) T-400-I-ERS.
References
- Mekonnen, M.M.; Hoekstra, A.Y. Four billion people facing severe water scarcity. Sci. Adv. 2016, 2, e1500323. [Google Scholar] [CrossRef]
- He, C.; Liu, Z.; Wu, J.; Pan, X.; Fang, Z.; Li, J.; Bryan, B.A. Future global urban water scarcity and potential solutions. Nat. Commun. 2021, 12, 4667. [Google Scholar] [CrossRef]
- van Vliet, M.T.H.; Jones, E.R.; Flörke, M.; Franssen, W.H.P.; Hanasaki, N.; Wada, Y.; Yearsley, J.R. Global water scarcity including surface water quality and expansions of clean water technologies. Environ. Res. Lett. 2021, 16, 024020. [Google Scholar] [CrossRef]
- Shannon, M.A.; Bohn, P.W.; Elimelech, M.; Georgiadis, J.G.; Mariñas, B.J.; Mayes, A.M. Science and technology for water purification in the coming decades. Nature 2008, 452, 301–310. [Google Scholar] [CrossRef]
- Elimelech, M.; Phillip, W.A. The Future of Seawater Desalination: Energy, Technology, and the Environment. Science 2011, 333, 712–717. [Google Scholar] [CrossRef] [PubMed]
- Department of Economic and Social Affairs, U.N. Ensure Availability and Sustainable Management of Water and Sanitation for All. Available online: https://sdgs.un.org/goals/goal6 (accessed on 11 October 2022).
- Panagopoulos, A. Water-energy nexus: Desalination technologies and renewable energy sources. Environ. Sci. Pollut. Res. 2021, 28, 21009–21022. [Google Scholar] [CrossRef]
- Elsaid, K.; Kamil, M.; Sayed, E.T.; Abdelkareem, M.A.; Wilberforce, T.; Olabi, A. Environmental impact of desalination technologies: A review. Sci. Total Environ. 2020, 748, 141528. [Google Scholar] [CrossRef] [PubMed]
- Mavukkandy, M.O.; Chabib, C.M.; Mustafa, I.; al Ghaferi, A.; AlMarzooqi, F. Brine Management in Desalination Industry: From Waste to Resources Generation. Desalination 2019, 472, 114187. [Google Scholar] [CrossRef]
- Morillo, J.; Usero, J.; Rosado, D.; El Bakouri, H.; Riaza, A.; Bernaola, F.-J. Comparative study of brine management technologies for desalination plants. Desalination 2014, 336, 32–49. [Google Scholar] [CrossRef]
- Gacia, E.; Invers, O.; Manzanera, M.; Ballesteros, E.; Romero, J. Impact of the brine from a desalination plant on a shallow seagrass (Posidonia oceanica) meadow. Estuar. Coast. Shelf Sci. 2007, 72, 579–590. [Google Scholar] [CrossRef]
- Meneses, M.; Pasqualino, J.; Céspedes-Sánchez, R.; Castells, F. Alternatives for Reducing the Environmental Impact of the Main Residue From a Desalination Plant. J. Ind. Ecol. 2010, 14, 512–527. [Google Scholar] [CrossRef]
- Oren, Y.; Korngold, E.; Daltrophe, N.; Messalem, R.; Volkman, Y.; Aronov, L.; Weismann, M.; Bouriakov, N.; Glueckstern, P.; Gilron, J. Pilot studies on high recovery BWRO-EDR for near zero liquid discharge approach. Desalination 2010, 261, 321–330. [Google Scholar] [CrossRef]
- Pérez-González, A.; Urtiaga, A.; Ibáñez, R.; Ortiz, I. State of the art and review on the treatment technologies of water reverse osmosis concentrates. Water Res. 2012, 46, 267–283. [Google Scholar] [CrossRef] [PubMed]
- Zarzo, D. Beneficial Uses and Valorization of Reverse Osmosis Brines; Elsevier Inc.: Amsterdam, The Netherlands, 2018; ISBN 9780128167120. [Google Scholar]
- Revolve Water-Mining. Available online: https://watermining.eu/ (accessed on 11 October 2022).
- Morgante, C.; Vassallo, F.; Battaglia, G.; Cipollina, A.; Vicari, F.; Tamburini, A.; Micale, G. Influence of Operational Strategies for the Recovery of Magnesium Hydroxide from Brines at a Pilot Scale. Ind. Eng. Chem. Res. 2022, 61, 15355–15368. [Google Scholar] [CrossRef] [PubMed]
- Culcasi, A.; Ktori, R.; Pellegrino, A.; Rodriguez-Pascual, M.; van Loosdrecht, M.; Tamburini, A.; Cipollina, A.; Xevgenos, D.; Micale, G. Towards sustainable production of minerals and chemicals through seawater brine treatment using Eutectic freeze crystallization and Electrodialysis with bipolar membranes. J. Clean. Prod. 2022, 368, 133143. [Google Scholar] [CrossRef]
- Fernandez-Gonzalez, C.; Dominguez-Ramos, A.; Ibañez, R.; Irabien, A. Electrodialysis with Bipolar Membranes for Valorization of Brines. Sep. Purif. Rev. 2016, 45, 275–287. [Google Scholar] [CrossRef]
- Thiel, G.P.; Kumar, A.; Gómez-González, A.; Lienhard, V.J.H. Utilization of Desalination Brine for Sodium Hydroxide Production: Technologies, Engineering Principles, Recovery Limits, and Future Directions. ACS Sustain. Chem. Eng. 2017, 5, 11147–11162. [Google Scholar] [CrossRef]
- Campione, A.; Gurreri, L.; Ciofalo, M.; Micale, G.; Tamburini, A.; Cipollina, A. Electrodialysis for water desalination: A critical assessment of recent developments on process fundamentals, models and applications. Desalination 2018, 434, 121–160. [Google Scholar] [CrossRef]
- Ibáñez, R.; Pérez-González, A.; Gómez, P.; Urtiaga, A.; Ortiz, I. Acid and base recovery from softened reverse osmosis (RO) brines. Experimental assessment using model concentrates. Desalination 2013, 309, 165–170. [Google Scholar] [CrossRef]
- Yang, Y.; Gao, X.; Fan, A.; Fu, L.; Gao, C. An innovative beneficial reuse of seawater concentrate using bipolar membrane electrodialysis. J. Membr. Sci. 2014, 449, 119–126. [Google Scholar] [CrossRef]
- Davis, J.R.; Chen, Y.; Baygents, J.C.; Farrell, J. Production of Acids and Bases for Ion Exchange Regeneration from Dilute Salt Solutions Using Bipolar Membrane Electrodialysis. ACS Sustain. Chem. Eng. 2015, 3, 2337–2342. [Google Scholar] [CrossRef]
- Reig, M.; Casas, S.; Gibert, O.; Valderrama, C.; Cortina, J. Integration of nanofiltration and bipolar electrodialysis for valorization of seawater desalination brines: Production of drinking and waste water treatment chemicals. Desalination 2016, 382, 13–20. [Google Scholar] [CrossRef]
- Herrero-Gonzalez, M.; Diaz-Guridi, P.; Dominguez-Ramos, A.; Irabien, A.; Ibañez, R. Highly concentrated HCl and NaOH from brines using electrodialysis with bipolar membranes. Sep. Purif. Technol. 2020, 242, 116785. [Google Scholar] [CrossRef]
- Gazigil, L.; Er, E.; Kestioğlu, O.E.; Yonar, T. Pilot-Scale Test Results of Electrodialysis Bipolar Membrane for Reverse-Osmosis Concentrate Recovery. Membranes 2022, 12, 83. [Google Scholar] [CrossRef] [PubMed]
- Blommaert, M.A.; Aili, D.; Tufa, R.A.; Li, Q.; Smith, W.A.; Vermaas, D.A. Insights and Challenges for Applying Bipolar Membranes in Advanced Electrochemical Energy Systems. ACS Energy Lett. 2021, 6, 2539–2548. [Google Scholar] [CrossRef]
- Cassaro, C.; Virruso, G.; Culcasi, A.; Cipollina, A.; Tamburini, A.; Micale, G. Electrodialysis with Bipolar Membranes for the Sustainable Production of Chemicals from Seawater Brines at Pilot Plant Scale. ACS Sustain. Chem. Eng. 2023. [Google Scholar] [CrossRef]
- FuMa-Tech BWT GmbH Membranes for Water Treatment Processes. Available online: https://www.fumatech.com/en/products/membranes-water-treatment-processes/ (accessed on 13 January 2023).
- Culcasi, A.; Gurreri, L.; Cipollina, A.; Tamburini, A.; Micale, G. A comprehensive multi-scale model for bipolar membrane electrodialysis (BMED). Chem. Eng. J. 2022, 437, 135317. [Google Scholar] [CrossRef]
- Herrero-Gonzalez, M.; Ibañez, R. Technical and Environmental Feasibilities of the Commercial Production of NaOH from Brine by Means of an Integrated EDBM and Evaporation Process. Membranes 2022, 12, 885. [Google Scholar] [CrossRef]
- Micari, M.; Cipollina, A.; Tamburini, A.; Moser, M.; Bertsch, V.; Micale, G. Combined membrane and thermal desalination processes for the treatment of ion exchange resins spent brine. Appl. Energy 2019, 254, 113699. [Google Scholar] [CrossRef]
- Mareev, S.; Evdochenko, E.; Wessling, M.; Kozaderova, O.; Niftaliev, S.; Pismenskaya, N.; Nikonenko, V. A comprehensive mathematical model of water splitting in bipolar membranes: Impact of the spatial distribution of fixed charges and catalyst at bipolar junction. J. Membr. Sci. 2020, 603, 118010. [Google Scholar] [CrossRef]

Disclaimer/Publisher’s Note: The statements, opinions and data contained in all publications are solely those of the individual author(s) and contributor(s) and not of MDPI and/or the editor(s). MDPI and/or the editor(s) disclaim responsibility for any injury to people or property resulting from any ideas, methods, instructions or products referred to in the content. |
© 2023 by the authors. Licensee MDPI, Basel, Switzerland. This article is an open access article distributed under the terms and conditions of the Creative Commons Attribution (CC BY) license (https://creativecommons.org/licenses/by/4.0/).