
Alkaline Liquid Ventilation of the Membrane Lung for Extracorporeal Carbon Dioxide Removal (ECCO2R): In Vitro Study

 , , ,
, , ,
Abstract
:1. Introduction
2. Materials and Methods
2.1. Mathematical Modeling
2.2. Definitions and Calculations
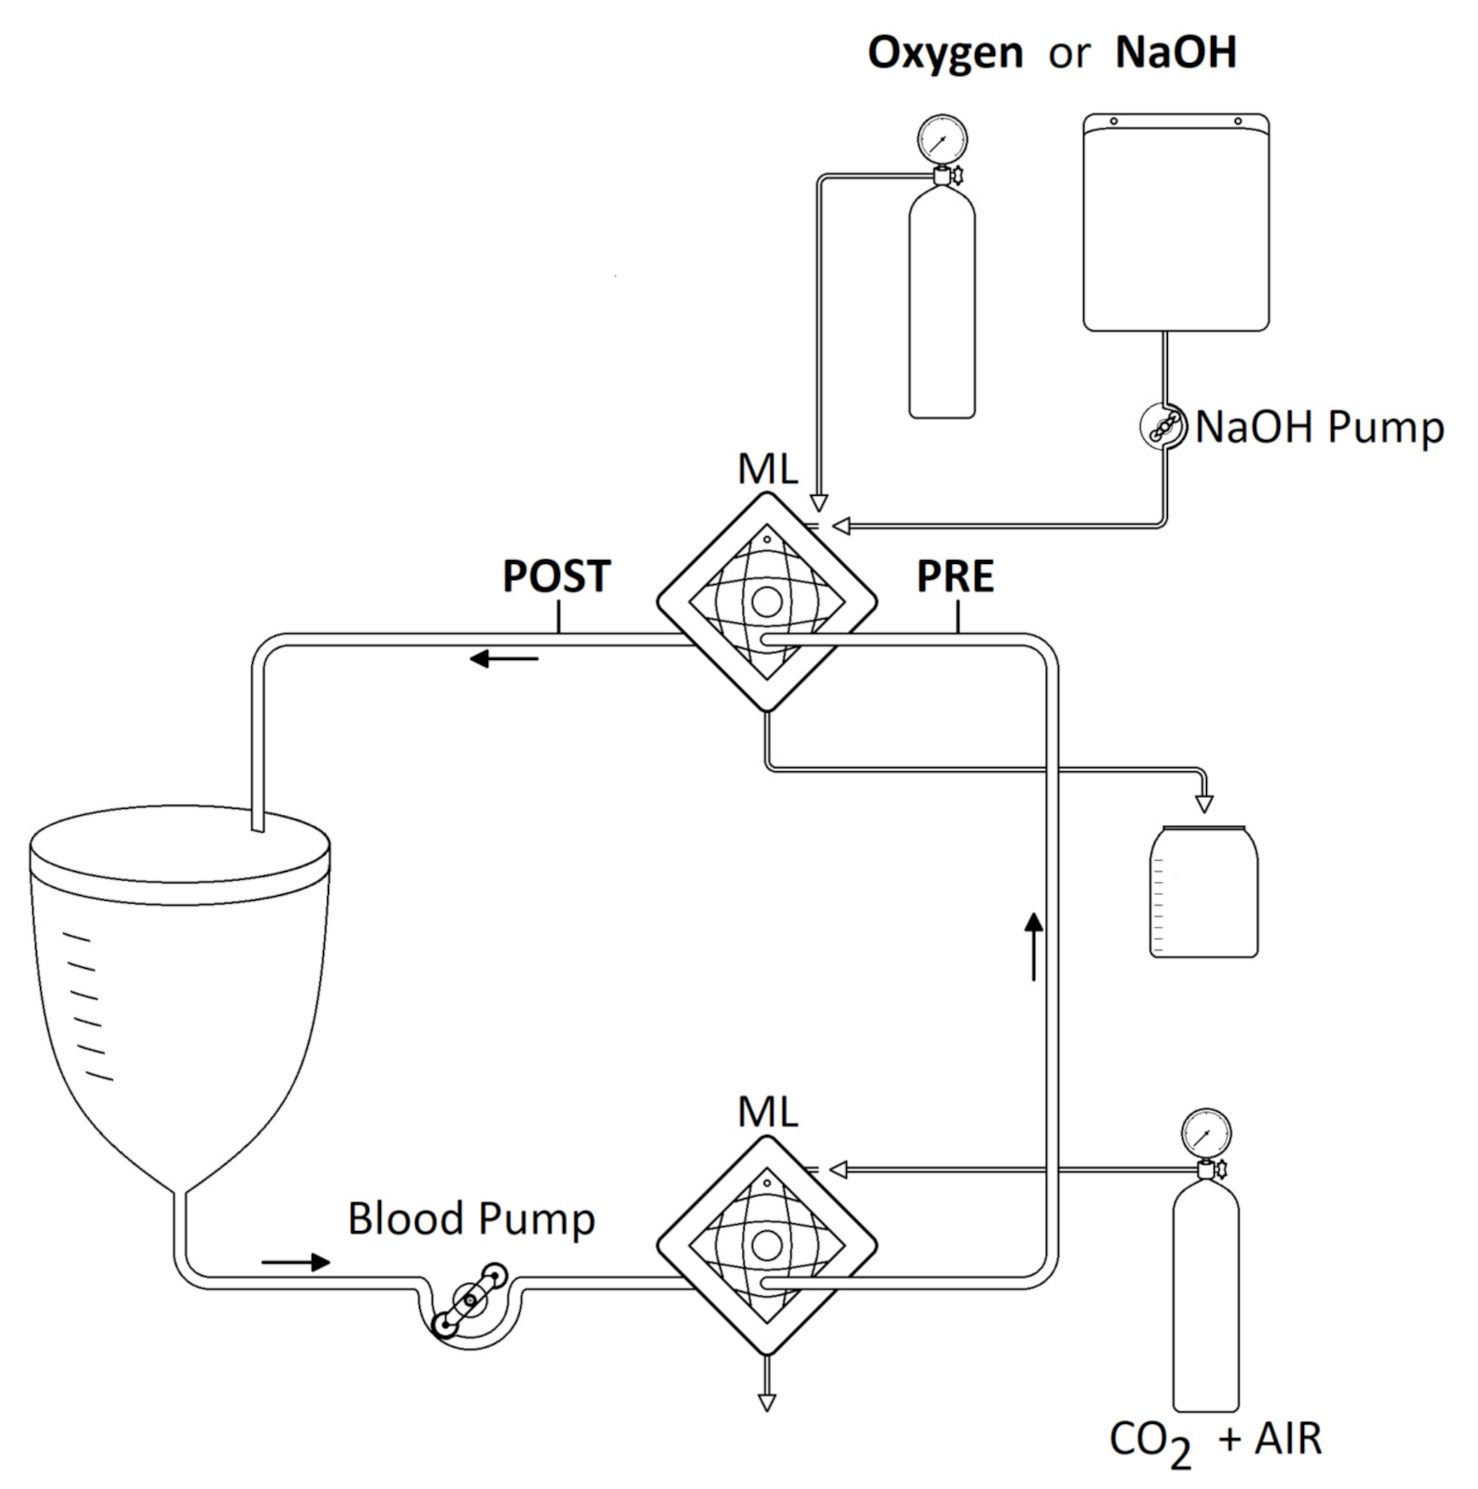
2.3. Safety and Feasibility Test
2.4. Efficiency and Efficacy Tests
2.5. Statistical Analysis
3. Results
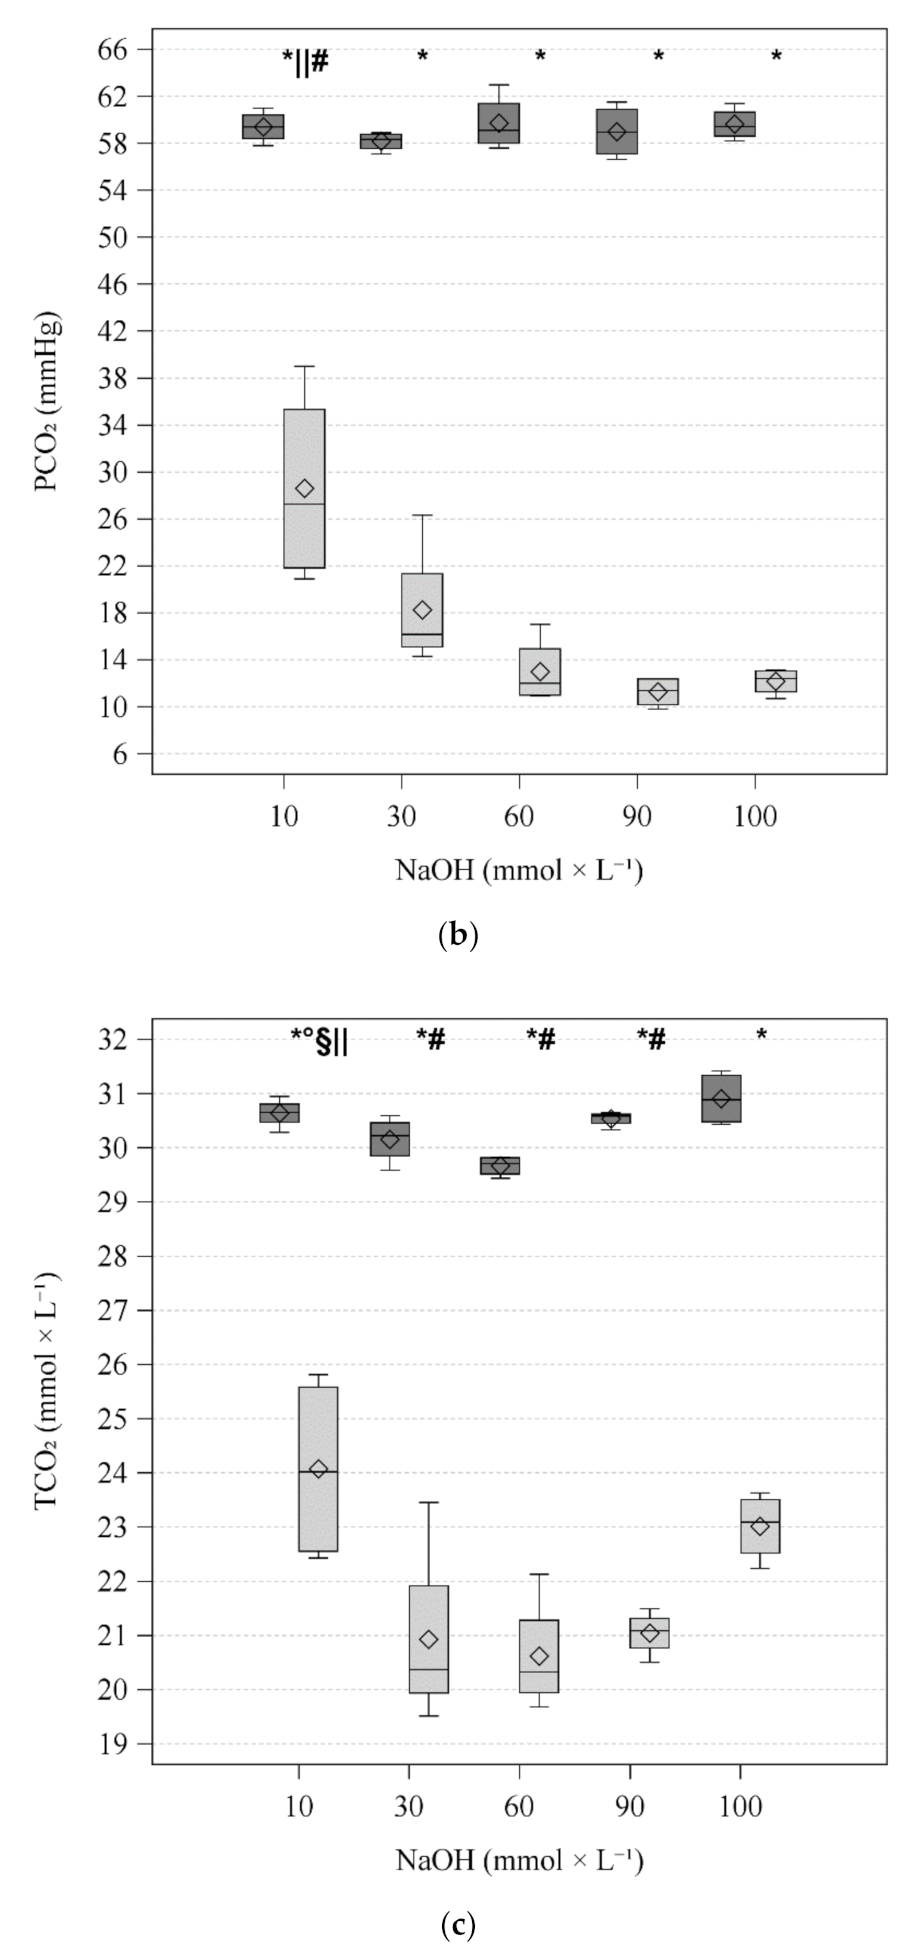
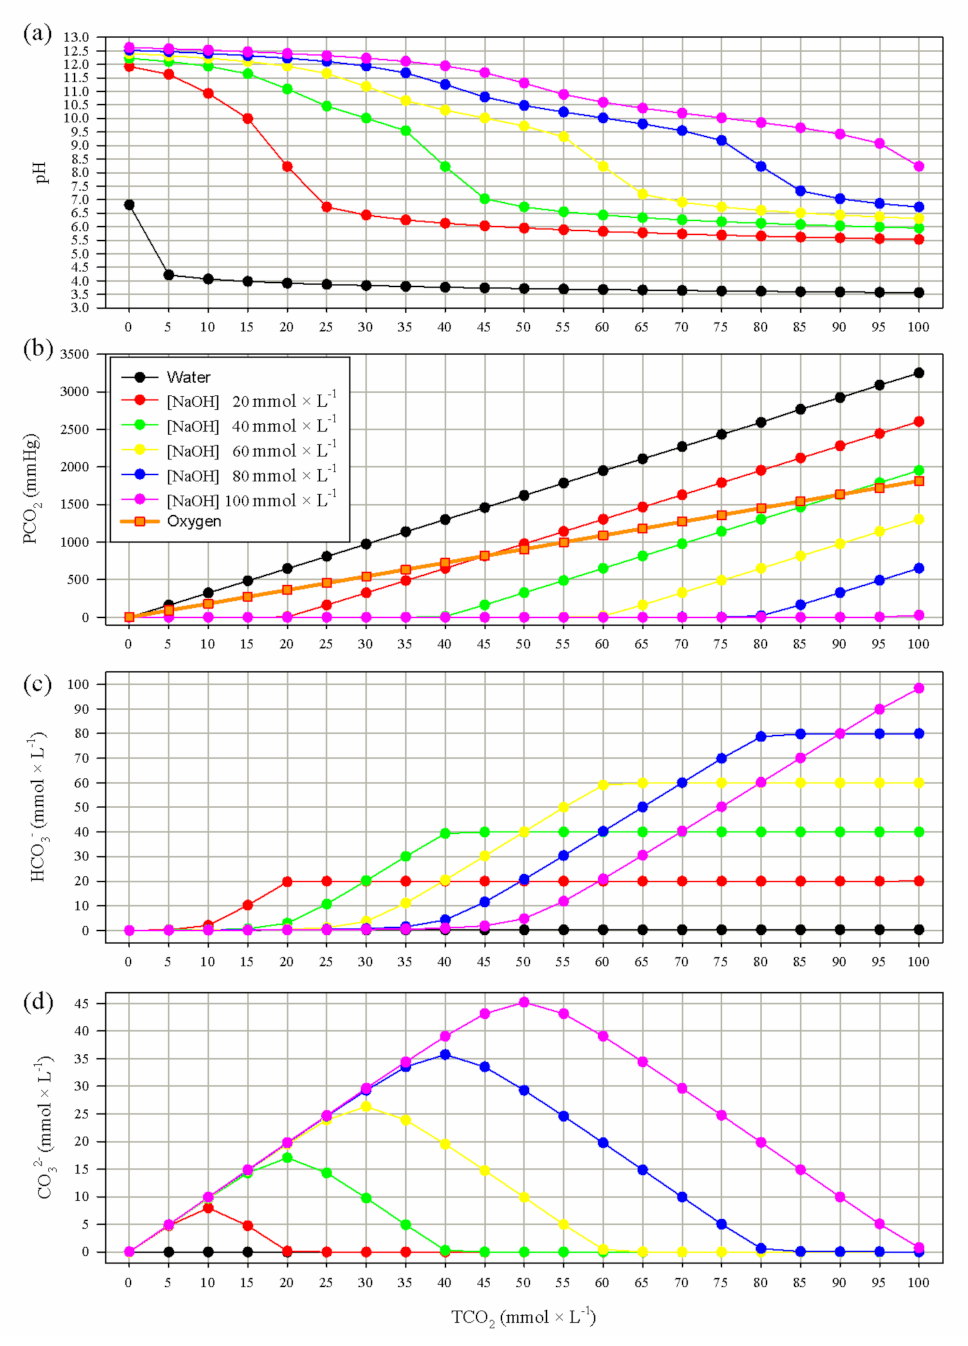
3.1. Mathematical Modeling
3.2. Feasibility and Safety Test
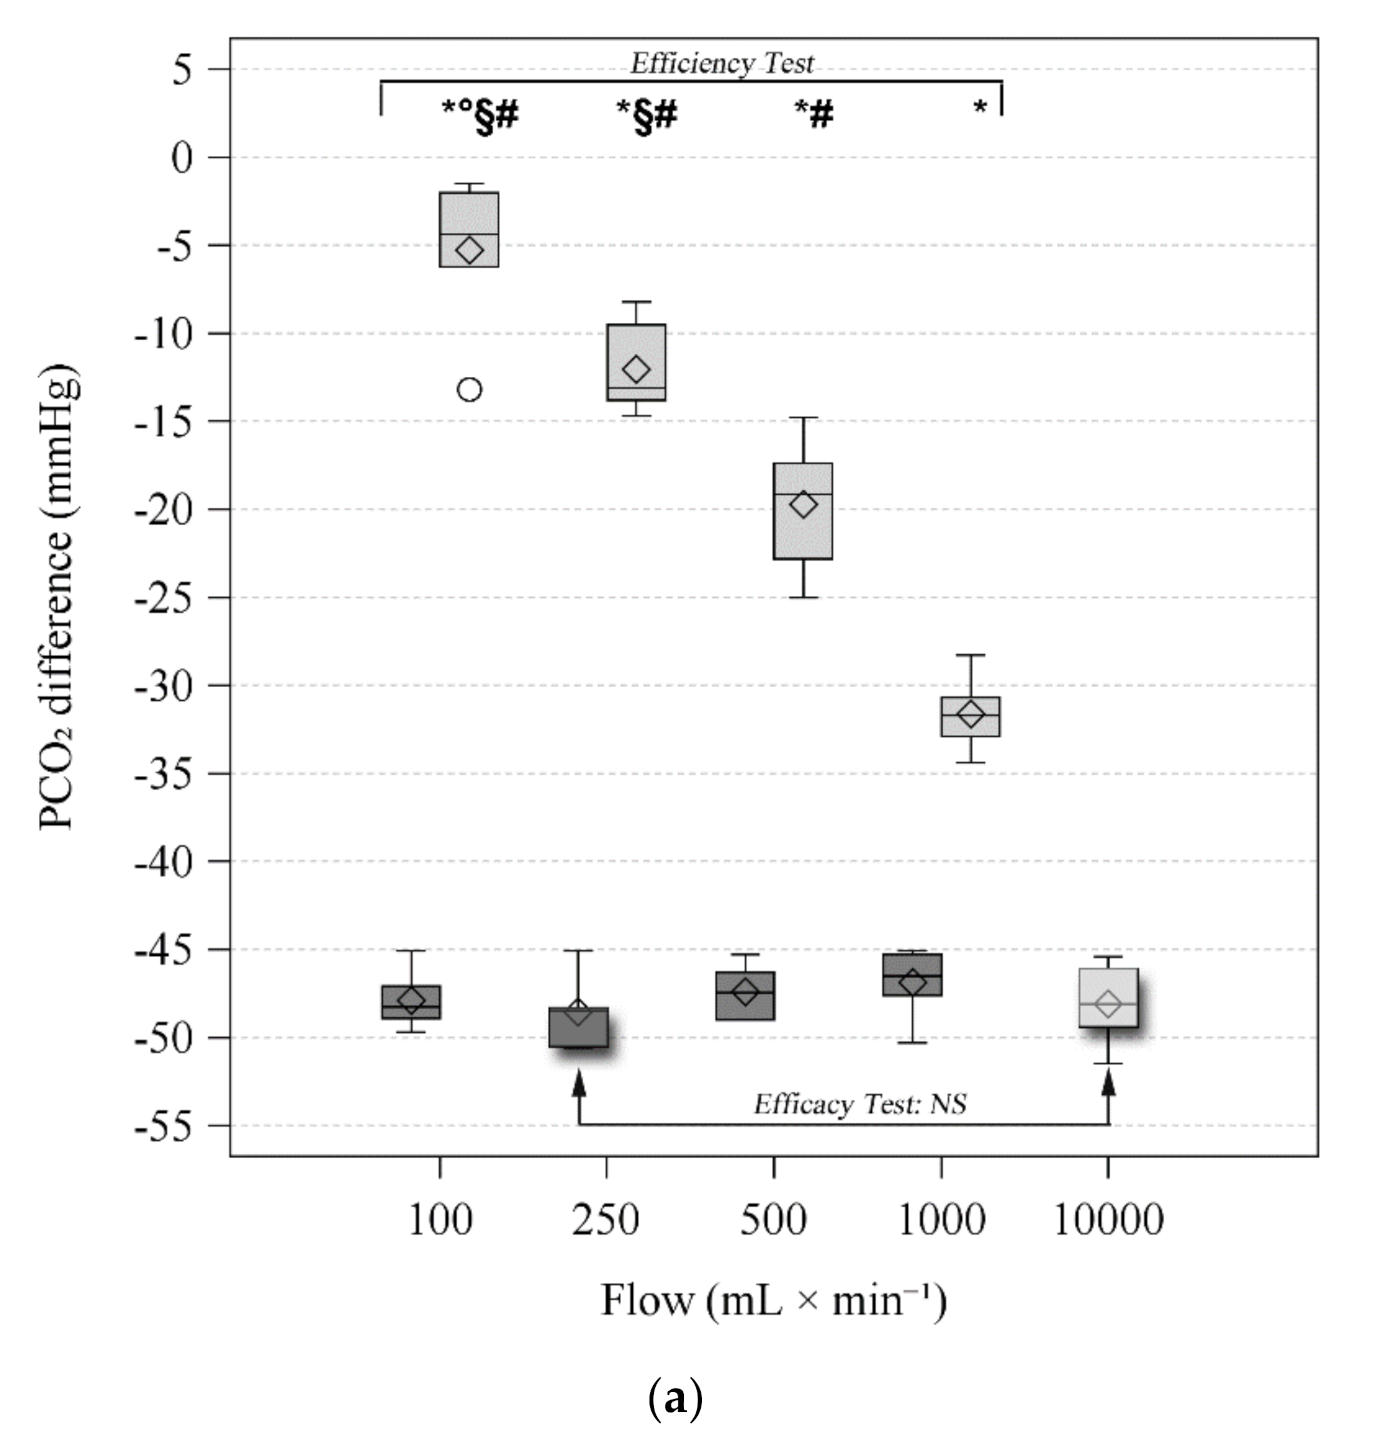
3.3. Efficiency Test
3.4. Efficacy Tests
4. Discussion
5. Conclusions
Supplementary Materials
Author Contributions
Funding
Institutional Review Board Statement
Informed Consent Statement
Data Availability Statement
Acknowledgments
Conflicts of Interest
Abbreviations
References
- Kolobow, T.; Gattinoni, L.; Tomlinson, T.A.; Pierce, J.E. Control of breathing using an extracorporeal membrane lung. Anesthesiology 1977, 46, 138–141. [Google Scholar] [CrossRef]
- Terragni, P.P.; Del Sorbo, L.; Mascia, L.; Urbino, R.; Martin, E.L.; Birocco, A.; Faggiano, C.; Quintel, M.; Gattinoni, L.; Ranieri, V.M. Tidal volume lower than 6 ml/kg enhances lung protection: Role of extracorporeal carbon dioxide removal. Anesthesiology 2009, 111, 826–835. [Google Scholar] [CrossRef] [PubMed] [Green Version]
- Combes, A.; Fanelli, V.; Pham, T.; Ranieri, V.M. European Society of Intensive Care Medicine Trials Group; the “Strategy of Ultra-Protective lung ventilation with Extracorporeal CO2 Removal for New-Onset moderate to severe ARDS” (SUPERNOVA) investigators. Feasibility and safety of extracorporeal CO2 removal to enhance protective ventilation in acute respiratory distress syndrome: The SUPERNOVA study. Intensive Care Med. 2019, 45, 592–600. [Google Scholar] [CrossRef] [Green Version]
- Cipriani, E.; Langer, T.; Bottino, N.; Brusatori, S.; Carlesso, E.; Colombo, S.M.; Zanella, A.; Pesenti, A.; Grasselli, G. Key Role of Respiratory Quotient to Reduce the Occurrence of Hypoxemia During Extracorporeal Gas Exchange: A Theoretical Analysis. Crit. Care Med. 2020, 48, e1327–e1331. [Google Scholar] [CrossRef] [PubMed]
- Kluge, S.; Braune, S.A.; Engel, M.; Nierhaus, A.; Frings, D.; Ebelt, H.; Uhrig, A.; Metschke, M.; Wegscheider, K.; Suttorp, N.; et al. Avoiding invasive mechanical ventilation by extracorporeal carbon dioxide removal in patients failing noninvasive ventilation. Intensive Care Med. 2012, 38, 1632–1639. [Google Scholar] [CrossRef] [PubMed]
- d’Andrea, A.; Banfi, C.; Bendjelid, K.; Giraud, R. The use of extracorporeal carbon dioxide removal in acute chronic obstructive pulmonary disease exacerbation: A narrative review. Can. J. Anaesth. 2020, 67, 462–474. [Google Scholar] [CrossRef]
- Grasselli, G.; Castagna, L.; Bottino, N.; Scaravilli, V.; Corcione, N.; Guzzardella, A.; Bonifazi, M.; Rossi, N.; Zanella, A.; Pesenti, A. Practical Clinical Application of an Extracorporeal Carbon Dioxide Removal System in Acute Respiratory Distress Syndrome and Acute on Chronic Respiratory Failure. ASAIO J. 2020, 66, 691–697. [Google Scholar] [CrossRef]
- Schellongowski, P.; Riss, K.; Staudinger, T.; Ullrich, R.; Krenn, C.G.; Sitzwohl, C.; Bojic, A.; Wohlfarth, P.; Sperr, W.R.; Rabitsch, W.; et al. Extracorporeal CO2 removal as bridge to lung transplantation in life-threatening hypercapnia. Transpl. Int. 2015, 28, 297–304. [Google Scholar] [CrossRef]
- Combes, A.; Tonetti, T.; Fanelli, V.; Pham, T.; Pesenti, A.; Mancebo, J.; Brodie, D.; Ranieri, V.M. Efficacy and safety of lower versus higher CO2 extraction devices to allow ultraprotective ventilation: Secondary analysis of the SUPERNOVA study. Thorax 2019, 74, 1179–1181. [Google Scholar] [CrossRef]
- Goligher, E.C.; Combes, A.; Brodie, D.; Ferguson, N.D.; Pesenti, A.M.; Ranieri, V.M.; Slutsky, A.S.; SUPERNOVA Investigators (European Society of Intensive Care Medicine Trials Group); International ECMO Network (ECMONet). Determinants of the effect of extracorporeal carbon dioxide removal in the SUPERNOVA trial: Implications for trial design. Intensive Care Med. 2019, 45, 1219–1230. [Google Scholar] [CrossRef] [PubMed]
- Karagiannidis, C.; Strassmann, S.; Brodie, D.; Ritter, P.; Larsson, A.; Borchardt, R.; Windisch, W. Impact of membrane lung surface area and blood flow on extracorporeal CO2 removal during severe respiratory acidosis. Intensive Care Med. Exp. 2017, 5, 34. [Google Scholar] [CrossRef] [PubMed] [Green Version]
- Morelli, A.; Del Sorbo, L.; Pesenti, A.; Ranieri, V.M.; Fan, E. Extracorporeal carbon dioxide removal (ECCO2R) in patients with acute respiratory failure. Intensive Care Med. 2017, 43, 519–530. [Google Scholar] [CrossRef] [PubMed]
- Karagiannidis, C.; Kampe, K.A.; Sipmann, F.S.; Larsson, A.; Hedenstierna, G.; Windisch, W.; Mueller, T. Veno-venous extracorporeal CO2 removal for the treatment of severe respiratory acidosis: Pathophysiological and technical considerations. Crit. Care 2014, 18, R124. [Google Scholar] [CrossRef] [Green Version]
- Duscio, E.; Cipulli, F.; Vasques, F.; Collino, F.; Rapetti, F.; Romitti, F.; Behnemann, T.; Niewenhuys, J.; Tonetti, T.; Pasticci, I.; et al. Extracorporeal CO2 Removal: The Minimally Invasive Approach, Theory, and Practice. Crit. Care Med. 2019, 47, 33–40. [Google Scholar] [CrossRef]
- Di Nardo, M.; Annoni, F.; Su, F.; Belliato, M.; Lorusso, R.; Broman, L.M.; Malfertheiner, M.; Creteur, J.; Taccone, F.S. Evaluation of a New Extracorporeal CO2 Removal Device in an Experimental Setting. Membranes 2020, 11, 8. [Google Scholar] [CrossRef] [PubMed]
- Epis, F.; Belliato, M. Oxygenator performance and artificial-native lung interaction. J. Thorac. Dis. 2018, 10, S596–S605. [Google Scholar] [CrossRef] [PubMed]
- Livigni, S.; Maio, M.; Ferretti, E.; Longobardo, A.; Potenza, R.; Rivalta, L.; Selvaggi, P.; Vergano, M.; Bertolini, G. Efficacy and safety of a low-flow veno-venous carbon dioxide removal device: Results of an experimental study in adult sheep. Crit. Care 2006, 10, R151. [Google Scholar] [CrossRef] [Green Version]
- Cove, M.E.; MacLaren, G.; Federspiel, W.J.; Kellum, J.A. Bench to bedside review: Extracorporeal carbon dioxide removal, past present and future. Crit. Care 2012, 16, 232. [Google Scholar] [CrossRef] [Green Version]
- Jeffries, R.G.; Mussin, Y.; Bulanin, D.S.; Lund, L.W.; Kocyildirim, E.; Zhumadilov, Z.; Olzhayev, F.S.; Federspiel, W.J.; Wearden, P.D. Pre-clinical evaluation of an adult extracorporeal carbon dioxide removal system with active mixing for pediatric respiratory support. Int. J. Artif. Organs 2014, 37, 888–899. [Google Scholar] [CrossRef] [Green Version]
- Arazawa, D.T.; Kimmel, J.D.; Finn, M.C.; Federspiel, W.J. Acidic sweep gas with carbonic anhydrase coated hollow fiber membranes synergistically accelerates CO2 removal from blood. Acta Biomater 2015, 25, 143–149. [Google Scholar] [CrossRef] [Green Version]
- May, A.G.; Orizondo, R.A.; Frankowski, B.J.; Ye, S.H.; Kocyildirim, E.; Wagner, W.R.; D’Cunha, J.; Federspiel, W.J. In vivo testing of the low-flow CO2 removal application of a compact, platform respiratory device. Intensive Care Med. Exp. 2020, 8, 45. [Google Scholar] [CrossRef]
- Cressoni, M.; Zanella, A.; Epp, M.; Corti, I.; Patroniti, N.; Kolobow, T.; Pesenti, A. Decreasing pulmonary ventilation through bicarbonate ultrafiltration: An experimental study. Crit. Care Med. 2009, 37, 2612–2618. [Google Scholar] [CrossRef] [PubMed]
- Zanella, A.; Patroniti, N.; Isgro, S.; Albertini, M.; Costanzi, M.; Pirrone, F.; Scaravilli, V.; Vergnano, B.; Pesenti, A. Blood acidification enhances carbon dioxide removal of membrane lung: An experimental study. Intensive Care Med. 2009, 35, 1484–1487. [Google Scholar] [CrossRef]
- Zanella, A.; Mangili, P.; Giani, M.; Redaelli, S.; Scaravilli, V.; Castagna, L.; Sosio, S.; Pirrone, F.; Albertini, M.; Patroniti, N.; et al. Extracorporeal carbon dioxide removal through ventilation of acidified dialysate: An experimental study. J. Heart Lung Transpl. 2014, 33, 536–541. [Google Scholar] [CrossRef] [PubMed]
- Zanella, A.; Mangili, P.; Redaelli, S.; Scaravilli, V.; Giani, M.; Ferlicca, D.; Scaccabarozzi, D.; Pirrone, F.; Albertini, M.; Patroniti, N.; et al. Regional blood acidification enhances extracorporeal carbon dioxide removal: A 48-hour animal study. Anesthesiology 2014, 120, 416–424. [Google Scholar] [CrossRef]
- Scaravilli, V.; Kreyer, S.; Linden, K.; Belenkiy, S.; Pesenti, A.; Zanella, A.; Cancio, L.C.; Batchinsky, A.I. Enhanced Extracorporeal CO2 Removal by Regional Blood Acidification: Effect of Infusion of Three Metabolizable Acids. ASAIO J. 2015, 61, 533–539. [Google Scholar] [CrossRef] [PubMed]
- Zanella, A.; Castagna, L.; Salerno, D.; Scaravilli, V.; Abd El Aziz El Sayed Deab, S.; Magni, F.; Giani, M.; Mazzola, S.; Albertini, M.; Patroniti, N.; et al. Respiratory Electrodialysis. A Novel, Highly Efficient Extracorporeal CO2 Removal Technique. Am. J. Respir. Crit. Care Med. 2015, 192, 719–726. [Google Scholar] [CrossRef] [Green Version]
- Abrams, D.; Bacchetta, M.; Brodie, D. When the momentum has gone: What will be the role of extracorporeal lung support in the future? Curr. Opin. Crit. Care 2018, 24, 23–28. [Google Scholar] [CrossRef]
- Boyle, A.J.; Sklar, M.C.; McNamee, J.J.; Brodie, D.; Slutsky, A.S.; Brochard, L.; McAuley, D.F.; International, E.N. Extracorporeal carbon dioxide removal for lowering the risk of mechanical ventilation: Research questions and clinical potential for the future. Lancet Respir. Med. 2018, 6, 874–884. [Google Scholar] [CrossRef] [Green Version]
- Austin, W.H.; Lacombe, E.; Rand, P.W.; Chatterjee, M. Solubility of carbon dioxide in serum from 15 to 38 C. J. Appl. Physiol. 1963, 18, 301–304. [Google Scholar] [CrossRef]
- Constable, P.D. Total weak acid concentration and effective dissociation constant of nonvolatile buffers in human plasma. J. Appl. Physiol. 2001, 91, 1364–1371. [Google Scholar] [CrossRef] [PubMed]
- Harned, H.S.; Bonner, F.T. The First Ionization of Carbonic Acid in Aqueous Solutions of Sodium Chloride. J. Am. Chem. Soc. 1945, 67, 1026–1031. [Google Scholar] [CrossRef]
- Putnam, R.W.; Roos, A. Which value for the first dissociation constant of carbonic acid should be used in biological work? Am. J. Physiol. 1991, 260, C1113–C1116. [Google Scholar] [CrossRef] [PubMed]
- Douglas, A.R.; Jones, N.L.; Reed, J.W. Calculation of whole blood CO2 content. J. Appl. Physiol. 1988, 65, 473–477. [Google Scholar] [CrossRef]
- Barrett, N.A.; Hart, N.; Camporota, L. In vivo carbon dioxide clearance of a low-flow extracorporeal carbon dioxide removal circuit in patients with acute exacerbations of chronic obstructive pulmonary disease. Perfusion 2020, 35, 436–441. [Google Scholar] [CrossRef] [PubMed]
- Langer, T.; Scotti, E.; Carlesso, E.; Protti, A.; Zani, L.; Chierichetti, M.; Caironi, P.; Gattinoni, L. Electrolyte shifts across the artificial lung in patients on extracorporeal membrane oxygenation: Interdependence between partial pressure of carbon dioxide and strong ion difference. J. Crit. Care 2015, 30, 2–6. [Google Scholar] [CrossRef] [Green Version]
- Mauri, T.; Langer, T.; Zanella, A.; Grasselli, G.; Pesenti, A. Extremely high transpulmonary pressure in a spontaneously breathing patient with early severe ARDS on ECMO. Intensive Care Med. 2016, 42, 2101–2103. [Google Scholar] [CrossRef]
- Augy, J.L.; Aissaoui, N.; Richard, C.; Maury, E.; Fartoukh, M.; Mekontso-Dessap, A.; Paulet, R.; Anguel, N.; Blayau, C.; Cohen, Y.; et al. A 2-year multicenter, observational, prospective, cohort study on extracorporeal CO2 removal in a large metropolis area. J. Intensive Care 2019, 7, 45. [Google Scholar] [CrossRef] [Green Version]
- Sharma, A.S.; Weerwind, P.W.; Bekers, O.; Wouters, E.M.; Maessen, J.G. Carbon dioxide dialysis in a swine model utilizing systemic and regional anticoagulation. Intensive Care Med. Exp. 2016, 4, 2. [Google Scholar] [CrossRef] [Green Version]
- Morimont, P.; Habran, S.; Desaive, T.; Blaffart, F.; Lagny, M.; Amand, T.; Dauby, P.; Oury, C.; Lancellotti, P.; Hego, A.; et al. Extracorporeal CO2 removal and regional citrate anticoagulation in an experimental model of hypercapnic acidosis. Artif. Organs 2019, 43, 719–727. [Google Scholar] [CrossRef]
- Hospach, I.; Goldstein, J.; Harenski, K.; Laffey, J.G.; Pouchoulin, D.; Raible, M.; Votteler, S.; Storr, M. In vitro characterization of PrismaLung+: A novel ECCO2R device. Intensive Care Med. Exp. 2020, 8, 14. [Google Scholar] [CrossRef] [PubMed]
- May, A.G.; Omecinski, K.S.; Frankowski, B.J.; Federspiel, W.J. Effect of Hematocrit on the CO2 Removal Rate of Artificial Lungs. ASAIO J. 2020, 66, 1161–1165. [Google Scholar] [CrossRef] [PubMed]


| Variable | Ventilation | Flow (L × min−1) | p Vent. | p Flow | p Int. | ||||
|---|---|---|---|---|---|---|---|---|---|
| 100 | 250 | 500 | 1000 | ||||||
| pH | PRE $ | NaOH | 7.346 (7.337–7.374) | 7.351 (7.333–7.359) | 7.356 (7.333–7.363) | 7.336 (7.334–7.366) | 0.027 | 0.999 | 0.020 |
| O2 | 7.325 (7.306–7.333) * | 7.313 (7.311–7.349) * | 7.321 (7.301–7.34) * | 7.325 (7.318–7.346) | |||||
| POST $ | NaOH | 7.972 (7.968–8.057) # | 7.987 (7.977–8.077) §# | 7.964 (7.932–8.040) | 7.938 (7.902–8.008) | <0.001 | <0.001 | <0.001 | |
| O2 | 7.352 (7.333–7.379) *°§# | 7.405 (7.374–7.439) *§# | 7.481 (7.435–7.514) *# | 7.616 (7.612–7.654) * | |||||
| Difference $ | NaOH | 0.628 (0.597–0.683) # | 0.643 (0.624–0.718) §# | 0.606 (0.597–0.673) | 0.591 (0.565–0.635) | <0.001 | <0.001 | <0.001 | |
| O2 | 0.028 (0.011–0.041) *°§# | 0.094 (0.063–0.101) *§# | 0.145 (0.124–0.186) *# | 0.295 (0.268–0.326) * | |||||
| PCO2 (mmHg) | PRE | NaOH | 59.7 (59.2–60.1) | 59.5 (59.0–59.7) | 59.4 (58.4–60.2) | 60.0 (59.2–60.4) | 0.909 | 0.882 | 0.332 |
| O2 | 59.0 (58.4–59.9) | 59.0 (58.7–60.5) | 60.6 (59.0–61.0) | 59.7 (59.5–59.8) | |||||
| POST | NaOH | 11.2 (11.0–13.0) | 10.5 (10.3–11.1) | 11.7 (11.3–12.1) | 13.1 (12.8–13.1) | <0.001 | <0.001 | <0.001 | |
| O2 | 54.6 (53.7–56.2) *°§# | 46.2 (45.4–49.7) *§# | 40.4 (39.0–41.6) *# | 28.2 (26.9–29.1) * | |||||
| Difference | NaOH | −48.3 (−48.9–−47.1) | −48.5 (−50.5–−48.3) | −47.5 (−49.0–−46.3) | −46.5 (−47.6–−45.3) | <0.001 | <0.001 | <0.001 | |
| O2 | −4.4 (−6.2–−2.0) *°§# | −13.1 (−13.8–−9.5) *§# | −19.1 (−22.8–−17.4) *# | −31.7 (−32.9–−30.7) * | |||||
| PO2 (mmHg) | PRE | NaOH | 138.0 (136.0–139.0) # | 137.0 (137.0–143.0) # | 137.5 (136.0–146.0) | 141.5 (137.0–153.0) | 0.231 | 0.460 | 0.002 |
| O2 | 144.0 (141.0–162.0) | 143.0 (140.0–159.0) | 143.5 (138.0–156.0) | 143.0 (139.0–154.0) | |||||
| POST $ | NaOH | 125.0 (120.0–130.0)§# | 130.5 (128.0–140.0) # | 148.5 (142.0–157.0) | 161.5 (159.0–169.0) | <0.001 | <0.001 | 0.700 | |
| O2 | 595.5 (591.0–602.0) *§# | 608.5 (603.0–623.0) *# | 616.0 (611.0.–6260) *# | 648.0 (632.0–654.0) * | |||||
| Difference | NaOH | −13.0 (−16.0— −11.0)§# | −6.5 (−9.0–−3.0) §# | 9.0 (6.0–11.0) # | 18.0 (14.0–21.0) | <0.001 | <0.001 | 0.105 | |
| O2 | 451.5 (429.0–461.0) *§# | 455.5 (445.0–471.0) *§# | 462.5 (453.0–477.0) *# | 497.5 (487.0–508.0) * | |||||
| K+ (mEq × L−1) | PRE | NaOH | 4.1 (4.0–4.4) | 4.1 (4.1–4.5) | 4.2 (4.1–4.4) | 4.2 (4.1–4.5) | 0.127 | 0.594 | 0.299 |
| O2 | 4.1 (3.9–4.2) | 4.0 (4.0–4.2) | 4.0 (4.0–4.2) | 4.1 (4.0–4.2) | |||||
| POST | NaOH | 4.1 (4.0–4.3) | 4.1 (4.0–4.4) | 4.1 (4.0–4.3) | 4.1 (4.0–4.4) | 0.265 | 0.709 | 0.363 | |
| O2 | 4.1 (3.9–4.2) | 4.0 (4.0–4.2) | 4.0 (4.0–4.1) | 4.0 (3.9–4.2) | |||||
| Difference | NaOH | 0.0 (0.0–0.1) | 0.1 (0.0–0.1) | 0.1 (0.1–0.1) | 0.1 (0.1–0.1) | 0.009 | 0.337 | 0.86 | |
| O2 | 0.0 (0.0–0.0) * | 0.0 (0.0–0.0) * | 0.0 (0.0–0.0) * | 0.0 (0.0–0.1) * | |||||
| Na+ (mEq × L−1) | PRE | NaOH | 143.0 (142.0–144.0) | 143.0 (143.0–144.0) | 143.5 (142.0–145.0) | 143.5 (143.0–144.0) | 0.038 | 0.233 | 0.973 |
| O2 | 139.0 (138.0–143.0) * | 139.0 (139.0–143.0) * | 139.5 (138.0–144.0) * | 139.5 (138.0–145.0) * | |||||
| POST | NaOH | 141.0 (139.0–142.0) | 140.0 (140.0–142.0) | 140.5 (140.0–141.0) | 141.5 (140.0–142.0) | 0.407 | 0.524 | 0.096 | |
| O2 | 139.0 (138.0–143.0) | 138.5 (137.0–143.0) | 139.0 (138.0–143.0) | 138.5 (137.0–143.0) | |||||
| Difference | NaOH | −2.0 (−3.0–−2.0) | −3.0 (−3.0–−2.0) | −3.0 (−4.0–−2.0) | −2.0 (−3.0–−2.0) | <0.001 | 0.215 | 0.012 | |
| O2 | 0.0 (0.0–0.0) *# | −1.0 (−1.0–0.0) * | −1.0 (−1.0–−1.0) * | −1.0 (−1.0–−1.0) * | |||||
| Ca++ (mEq × L−1) | PRE | NaOH | 1.3 (1.3–1.4) | 1.4 (1.3–1.4) | 1.4 (1.3–1.4) | 1.4 (1.3–1.4) | 0.755 | 0.854 | 0.769 |
| O2 | 1.4 (1.2–1.4) | 1.3 (1.2–1.4) | 1.3 (1.2–1.4) | 1.3 (1.2–1.4) | |||||
| POST | NaOH | 1.2 (1.1–1.3) | 1.2 (1.1–1.2) | 1.2 (1.2–1.3) | 1.2 (1.2–1.3) | 0.066 | 0.110 | <0.001 | |
| O2 | 1.4 (1.2–1.4) *§# | 1.3 (1.2–1.4) *§# | 1.3 (1.2–1.3) | 1.3 (1.2–1.3) | |||||
| Difference $ | NaOH | −0.1 (−0.1–−0.1) | −0.2 (−0.2–−0.1) | −0.1 (−0.1–−0.1) | −0.1 (−0.1–−0.1) | <0.001 | 0.032 | 0.002 | |
| O2 | 0.0 (0.0–0.0) *§# | 0.0 (0.0–0.0) *§# | 0.0 (0.0–0.0) * | −0.1 (−0.1–−0.1) * | |||||
| Cl− (mEq × L−1) | PRE | NaOH | 111.5 (111.0–113.0) | 111.5 (111.0–113.0) | 111.5 (111.0–113.0) | 111.5 (110.0–113.0) | 0.232 | 0.529 | 0.529 |
| O2 | 111.0 (111.0–112.0) | 111.0 (111.0–112.0) | 111.0 (110.0–112.0) | 111.0 (110.0–112.0) | |||||
| POST | NaOH | 114.0 (114.0–115.0) | 114.5 (114.0–115.0) | 114.0 (114.0–115.0) | 114.0 (114.0–115.0) | 0.002 | 0.042 | 0.002 | |
| O2 | 111.5 (111.0–113.0) *# | 111.0 (111.0–113.0) *# | 112.0 (111.0— 113.0) *# | 112.5 (112.0–114.0) * | |||||
| Difference | NaOH | 2.5 (2.0–3.0) | 3.0 (2.0–3.0) | 2.5 (2.0–3.0) | 2.5 (2.0–3.0) | 0.007 | 0.002 | 0.001 | |
| O2 | 0.5 (0.0–1.0) *# | 0.0 (0.0–1.0) *§# | 1.0 (1.0–1.0) *# | 2.0 (1.0–2.0) | |||||
| Lac (mEq × L−1) | PRE $ | NaOH | 1.4 (0.5–2.3) | 1.4 (0.5–2.4) | 1.3 (0.5–2.3) | 1.4 (0.5–2.5) | 0.180 | 0.361 | 0.614 |
| O2 | 1.1 (0.4–2.5) | 1.2 (0.4–2.6) | 1.1 (0.4–2.6) | 1.1 (0.4–2.5) | |||||
| POST $ | NaOH | 1.4 (0.5–2.3) | 1.5 (0.5–2.3) | 1.4 (0.5–2.4) | 1.4 (0.5–2.4) | 0.197 | 0.459 | 0.850 | |
| O2 | 1.0 (0.4–2.6) | 1.1 (0.4–2.6) | 1.2 (0.4–2.6) | 1.1 (0.4–2.5) | |||||
| Difference | NaOH | 0.0 (0.0–0.0) | −0.1 (−0.1–0.1) | 0.1 (0.0–0.1) | 0.0 (0.0–0.0) | 1.000 | 0.297 | 0.922 | |
| O2 | 0.0 (0.0–0.0) | 0.0 (−0.1–0.0) | 0.0 (0.0–0.1) | 0.0 (0.0–0.0) | |||||
| Hb (g × dL−1) | PRE | NaOH | 6.45 (5.50–8.20) | 6.80 (5.30–8.20) | 6.70 (5.30–8.30) | 6.70 (5.20–8.10) | 0.643 | 0.641 | 0.511 |
| O2 | 6.55 (5.50–8.30) | 6.60 (5.30–8.20) | 6.55 (5.30–8.40) | 6.55 (5.40–7.90) | |||||
| POST | NaOH | 6.60 (5.50–8.30) | 6.70 (5.40–8.20) | 6.75(5.40–8.30) | 6.60 (5.30–8.20) | 0.547 | 0.083 | 0.893 | |
| O2 | 6.55 (5.50–8.40) | 6.60 (5.30–8.20) | 6.60 (5.30–8.50) | 6.55 (5.40–7.90) | |||||
| Difference | NaOH | 0.05 (0.00–0.10) | 0 (−0.10–0.00) | 0.05 (0.00–0.10) | 0.05 (0.00–0.10) | 0.025 | 0.661 | 0.154 | |
| O2 | 0.00 (−0.10–0.00) * | 0.00 (0.00–0.00) * | 0.00 (0.00–0.10) * | 0.00 (0.00–0.00) * | |||||
| HCO3− (mmol × L−1) | PRE | NaOH | 30.1 (29.5–32.2) | 30.2 (29.3–31.8) | 30.3 (29.4–31.7) | 29.8 (29.0–31.8) | 0.050 | 0.508 | 0.165 |
| O2 | 28.3 (27.6–29.9) * | 28.2 (27.6–29.8) * | 28.1 (27.5–30.4) * | 28.5 (28.2–30.2) * | |||||
| POST | NaOH | 25.7 (23.3–29.1) | 25.9 (23.2–28.1) | 26.4 (23.2–29) | 26.3 (23.7–29.7) | 0.577 | 0.043 | 0.003 | |
| O2 | 28.0 (27.2–28.6) §# | 27.5 (26.7–28.6) # | 27.0 (26.3–28.2) | 26.6 (26.1–27.2) | |||||
| Difference | NaOH | −4.4 (−6.3–−2.4) # | −4.5 (−6.8–−2.4) # | −4.2 (−6.2–−1.3) | −3.9 (−5.7–−1.7) | 0.018 | 0.003 | <0.001 | |
| O2 | −0.3 (−0.5–−0.2) *§# | −0.8 (−0.9–−0.6) *§# | −1.3 (−1.7–−1) *# | −2.1 (−2.8–−1.4) | |||||
| plasma TCO2 (mmol × L−1) | PRE | NaOH | 31.9 (31.4–34.1) | 32.0 (31.1–33.6) | 32.1 (31.3–33.5) | 31.7 (30.9–33.6) | 0.051 | 0.476 | 0.194 |
| O2 | 30.1 (29.5–31.8) | 30.1 (29.4–31.5) | 30.0 (29.4–32.3) | 30.3 (30.1–32.0) | |||||
| POST | NaOH | 26.0 (23.6–29.5) | 26.3 (23.5–28.4) | 26.7 (23.6–29.3) | 26.7 (24.1–30.1) | 0.258 | 0.009 | <0.001 | |
| O2 | 29.7 (28.9–30.1) §# | 29.1 (28.1–30.0) # | 28.3 (27.4–29.5) # | 27.5 (26.9–28.1) | |||||
| Difference | NaOH | −5.9 (−7.8–−3.9) # | −6 (−8.3–−4.0) # | −5.7 (−7.6–−2.8) | −5.3 (−7.1–−3.3) | 0.006 | <0.001 | <0.001 | |
| O2 | −0.5 (−0.6–−0.3) *°§# | −1.1 (−1.3–−0.9) *§# | −1.9 (−2.2–−1.7) *# | −3.0 (−3.8–−2.3) | |||||
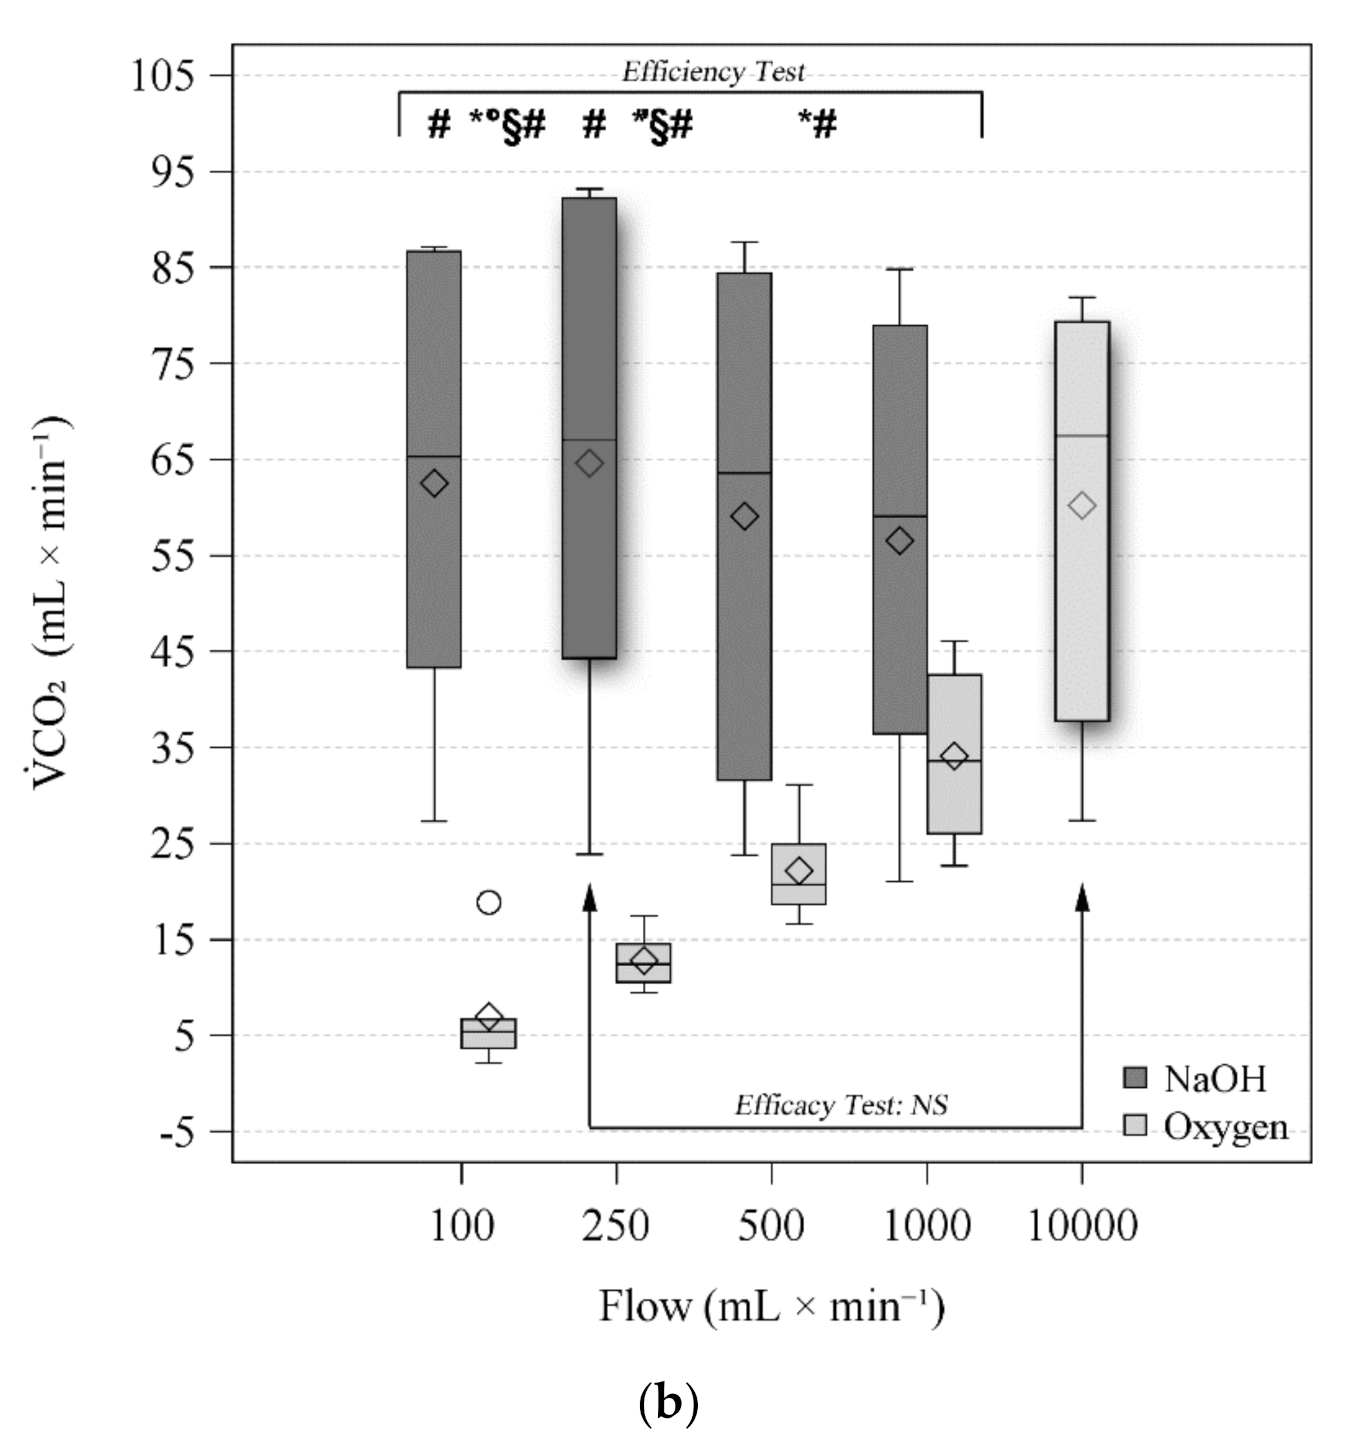
| CO2 (mL × min−1) | NaOH | 65.3 (43.3–86.7) # | 67.0 (44.3–92.2) # | 63.5 (31.6–84.5) | 59.1 (36.4–79) | 0.006 | <0.001 | <0.001 | |
| O2 | 5.4 (3.7–6.7) *°§# | 12.5 (10.5–14.6) *§# | 20.7 (18.6–24.9) *# | 33.6 (26.1–42.6) | |||||
| Variable | Ventilation | |||
|---|---|---|---|---|
| NaOH 250 mL × min−1 | O2 10,000 mL × min−1 | p | ||
| pH | PRE | 7.351 (7.333–7.359) | 7.328 (7.322–7.355) | 0.032 |
| POST | 7.987 (7.977–8.077) | 7.966 (7.921–8.013) | 0.020 | |
| Difference | 0.643 (0.624–0.718) | 0.627 (0.599–0.685) | 0.094 | |
| PCO2 (mmHg) | PRE | 59.5 (59–59.7) | 60 (59.3–60.5) | 0.254 |
| POST | 10.5 (10.3–11.1) | 11.5 (10.8–13.9) | 0.106 | |
| Difference | −48.5 (−50.5–−48.3) | −48.1 (−49.4–−46.1) | 0.522 | |
| PO2 (mmHg) | PRE $ | 137 (137–143) | 139 (137–165) | 0.625 |
| POST | 130.5 (128–140) | 661.5 (649–677) | <0.001 | |
| Difference | −6.5 (−9–−3) | 518.5 (509–536) | <0.001 | |
| K+ (mEq × L−1) | PRE | 4.1 (4.1–4.5) | 4.2 (4–4.4) | 0.611 |
| POST $ | 4.1 (4–4.4) | 4.1 (4–4.3) | 0.438 | |
| Difference | 0.1 (0–0.1) | 0.1 (0–0.1) | 1.000 | |
| Na+ (mEq × L−1) | PRE | 143 (143–144) | 142 (141–145) | 0.516 |
| POST | 140 (140–142) | 139.5 (139–143) | 1.000 | |
| Difference | −3 (−3–−2) | −2 (−2–−2) | 0.102 | |
| Ca++ (mEq × L−1) | PRE | 1.4 (1.3–1.4) | 1.3 (1.3–1.4) | 0.927 |
| POST | 1.2 (1.1–1.2) | 1.2 (1.1–1.3) | 0.413 | |
| Difference | −0.2 (−0.2–−0.1) | −0.1 (−0.1–−0.1) | 0.067 | |
| Cl− (mEq × L−1) | PRE $ | 111.5 (111–113) | 111.5 (111–112) | 0.813 |
| POST | 114.5 (114–115) | 115 (114–115) | 1.000 | |
| Difference | 3 (2–3) | 3 (2–3) | 0.611 | |
| Lac (mEq × L−1) | PRE $ | 1.4 (0.5–2.4) | 1.3 (0.5–2.5) | 0.375 |
| POST | 1.5 (0.5–2.3) | 1.2 (0.4–2.5) | 0.233 | |
| Difference | −0.1 (−0.1–0.1) | 0 (−0.1–0) | 1.000 | |
| Hb (g × dL−1) | PRE | 6.80 (5.30–8.20) | 6.55 (5.50–8.40) | 0.499 |
| POST | 6.70 (5.40–8.20) | 6.55 (5.40–7.90) | 0.590 | |
| Difference | 0.00 (−0.10–0.00) | 0.00 (0.00–0.00) | 0.363 | |
| HCO3− (mmol × L−1) | PRE | 30.2 (29.3–31.8) | 29.4 (28.7–30.6) | 0.205 |
| POST | 25.9 (23.2–28.1) | 25.1 (23.1–28.1) | 0.652 | |
| Difference | −4.5 (−6.8–−2.4) | −4.6 (−5.7–−1.8) | 0.185 | |
| plasma TCO2 (mmol × L−1) | PRE $ | 32 (31.1–33.6) | 31.3 (30.6–32.5) | 0.313 |
| POST | 26.3 (23.5–28.4) | 25.5 (23.5–28.4) | 0.695 | |
| Difference | −6 (−8.3–−4) | −6.1 (−7.1–−3.4) | 0.191 | |
| CO2 (mL × min−1) | 67 (44.3–92.2) | 67.4 (37.8–79.4) | 0.191 | |
Publisher’s Note: MDPI stays neutral with regard to jurisdictional claims in published maps and institutional affiliations. |
© 2021 by the authors. Licensee MDPI, Basel, Switzerland. This article is an open access article distributed under the terms and conditions of the Creative Commons Attribution (CC BY) license (https://creativecommons.org/licenses/by/4.0/).
Share and Cite
Vivona, L.; Battistin, M.; Carlesso, E.; Langer, T.; Valsecchi, C.; Colombo, S.M.; Todaro, S.; Gatti, S.; Florio, G.; Pesenti, A.; et al. Alkaline Liquid Ventilation of the Membrane Lung for Extracorporeal Carbon Dioxide Removal (ECCO2R): In Vitro Study. Membranes 2021, 11, 464. https://doi.org/10.3390/membranes11070464
Vivona L, Battistin M, Carlesso E, Langer T, Valsecchi C, Colombo SM, Todaro S, Gatti S, Florio G, Pesenti A, et al. Alkaline Liquid Ventilation of the Membrane Lung for Extracorporeal Carbon Dioxide Removal (ECCO2R): In Vitro Study. Membranes. 2021; 11(7):464. https://doi.org/10.3390/membranes11070464
Chicago/Turabian StyleVivona, Luigi, Michele Battistin, Eleonora Carlesso, Thomas Langer, Carlo Valsecchi, Sebastiano Maria Colombo, Serena Todaro, Stefano Gatti, Gaetano Florio, Antonio Pesenti, and et al. 2021. "Alkaline Liquid Ventilation of the Membrane Lung for Extracorporeal Carbon Dioxide Removal (ECCO2R): In Vitro Study" Membranes 11, no. 7: 464. https://doi.org/10.3390/membranes11070464
APA StyleVivona, L., Battistin, M., Carlesso, E., Langer, T., Valsecchi, C., Colombo, S. M., Todaro, S., Gatti, S., Florio, G., Pesenti, A., Grasselli, G., & Zanella, A. (2021). Alkaline Liquid Ventilation of the Membrane Lung for Extracorporeal Carbon Dioxide Removal (ECCO2R): In Vitro Study. Membranes, 11(7), 464. https://doi.org/10.3390/membranes11070464