1. Introduction
Apart from longitudinal medical observational cohort studies [
2], there have been few cross-country empirical studies that have used daily country-level COVID-related data to analyze the effectiveness of vaccination levels across countries on the dynamics of the number of new COVID cases, new hospitalizations, new ICU patients, and new deaths with COVID. To our knowledge, there are only two econometric studies that use cross-country data to analyze the effectiveness of vaccines. The first study analyzed the impact of vaccination on the ratio of mortality to infections [
3]. Using the data for the first half of 2019, another study examined the determinants of COVID-19 vaccine rollouts and their effects on health outcomes [
4]. The study found that early vaccine procurement, domestic production of vaccines, the severity of the pandemic, a country’s health infrastructure, and vaccine acceptance are significant determinants of the speed of vaccination rollouts. None of the papers reached a wide audience in terms of number of shares and citations.
On the other hand, there is a much read and cited paper that uses very simple descriptive analysis to examine the effectiveness of vaccines on the incidence of new COVID-19 (hereafter: COVID) cases (see [
1]). As of March 2022, more than 2.25 million people have read this article online. However, despite its broad popular appeal, this study is fraught with many methodological problems.
In examining the relationship between vaccination rates and the incidence of new COVID cases, a recent study used a simple static framework [
1]. First, it employed bivariate analysis by plotting a graph with the COVID cases per 1 million people for 68 countries on the vertical axis against the latest available percentage of the population that is fully vaccinated on the horizontal axis. No rigorous regression analysis was performed, correlations were only visually assessed to determine that there was no relationship between the two variables. Secondly, they chose only one cross-sectional observation per country (the last available) to show the relationship between the number of new cases and the vaccination rate. Thirdly, all other factors that might influence the dynamics of epidemics except vaccination rate are ignored.
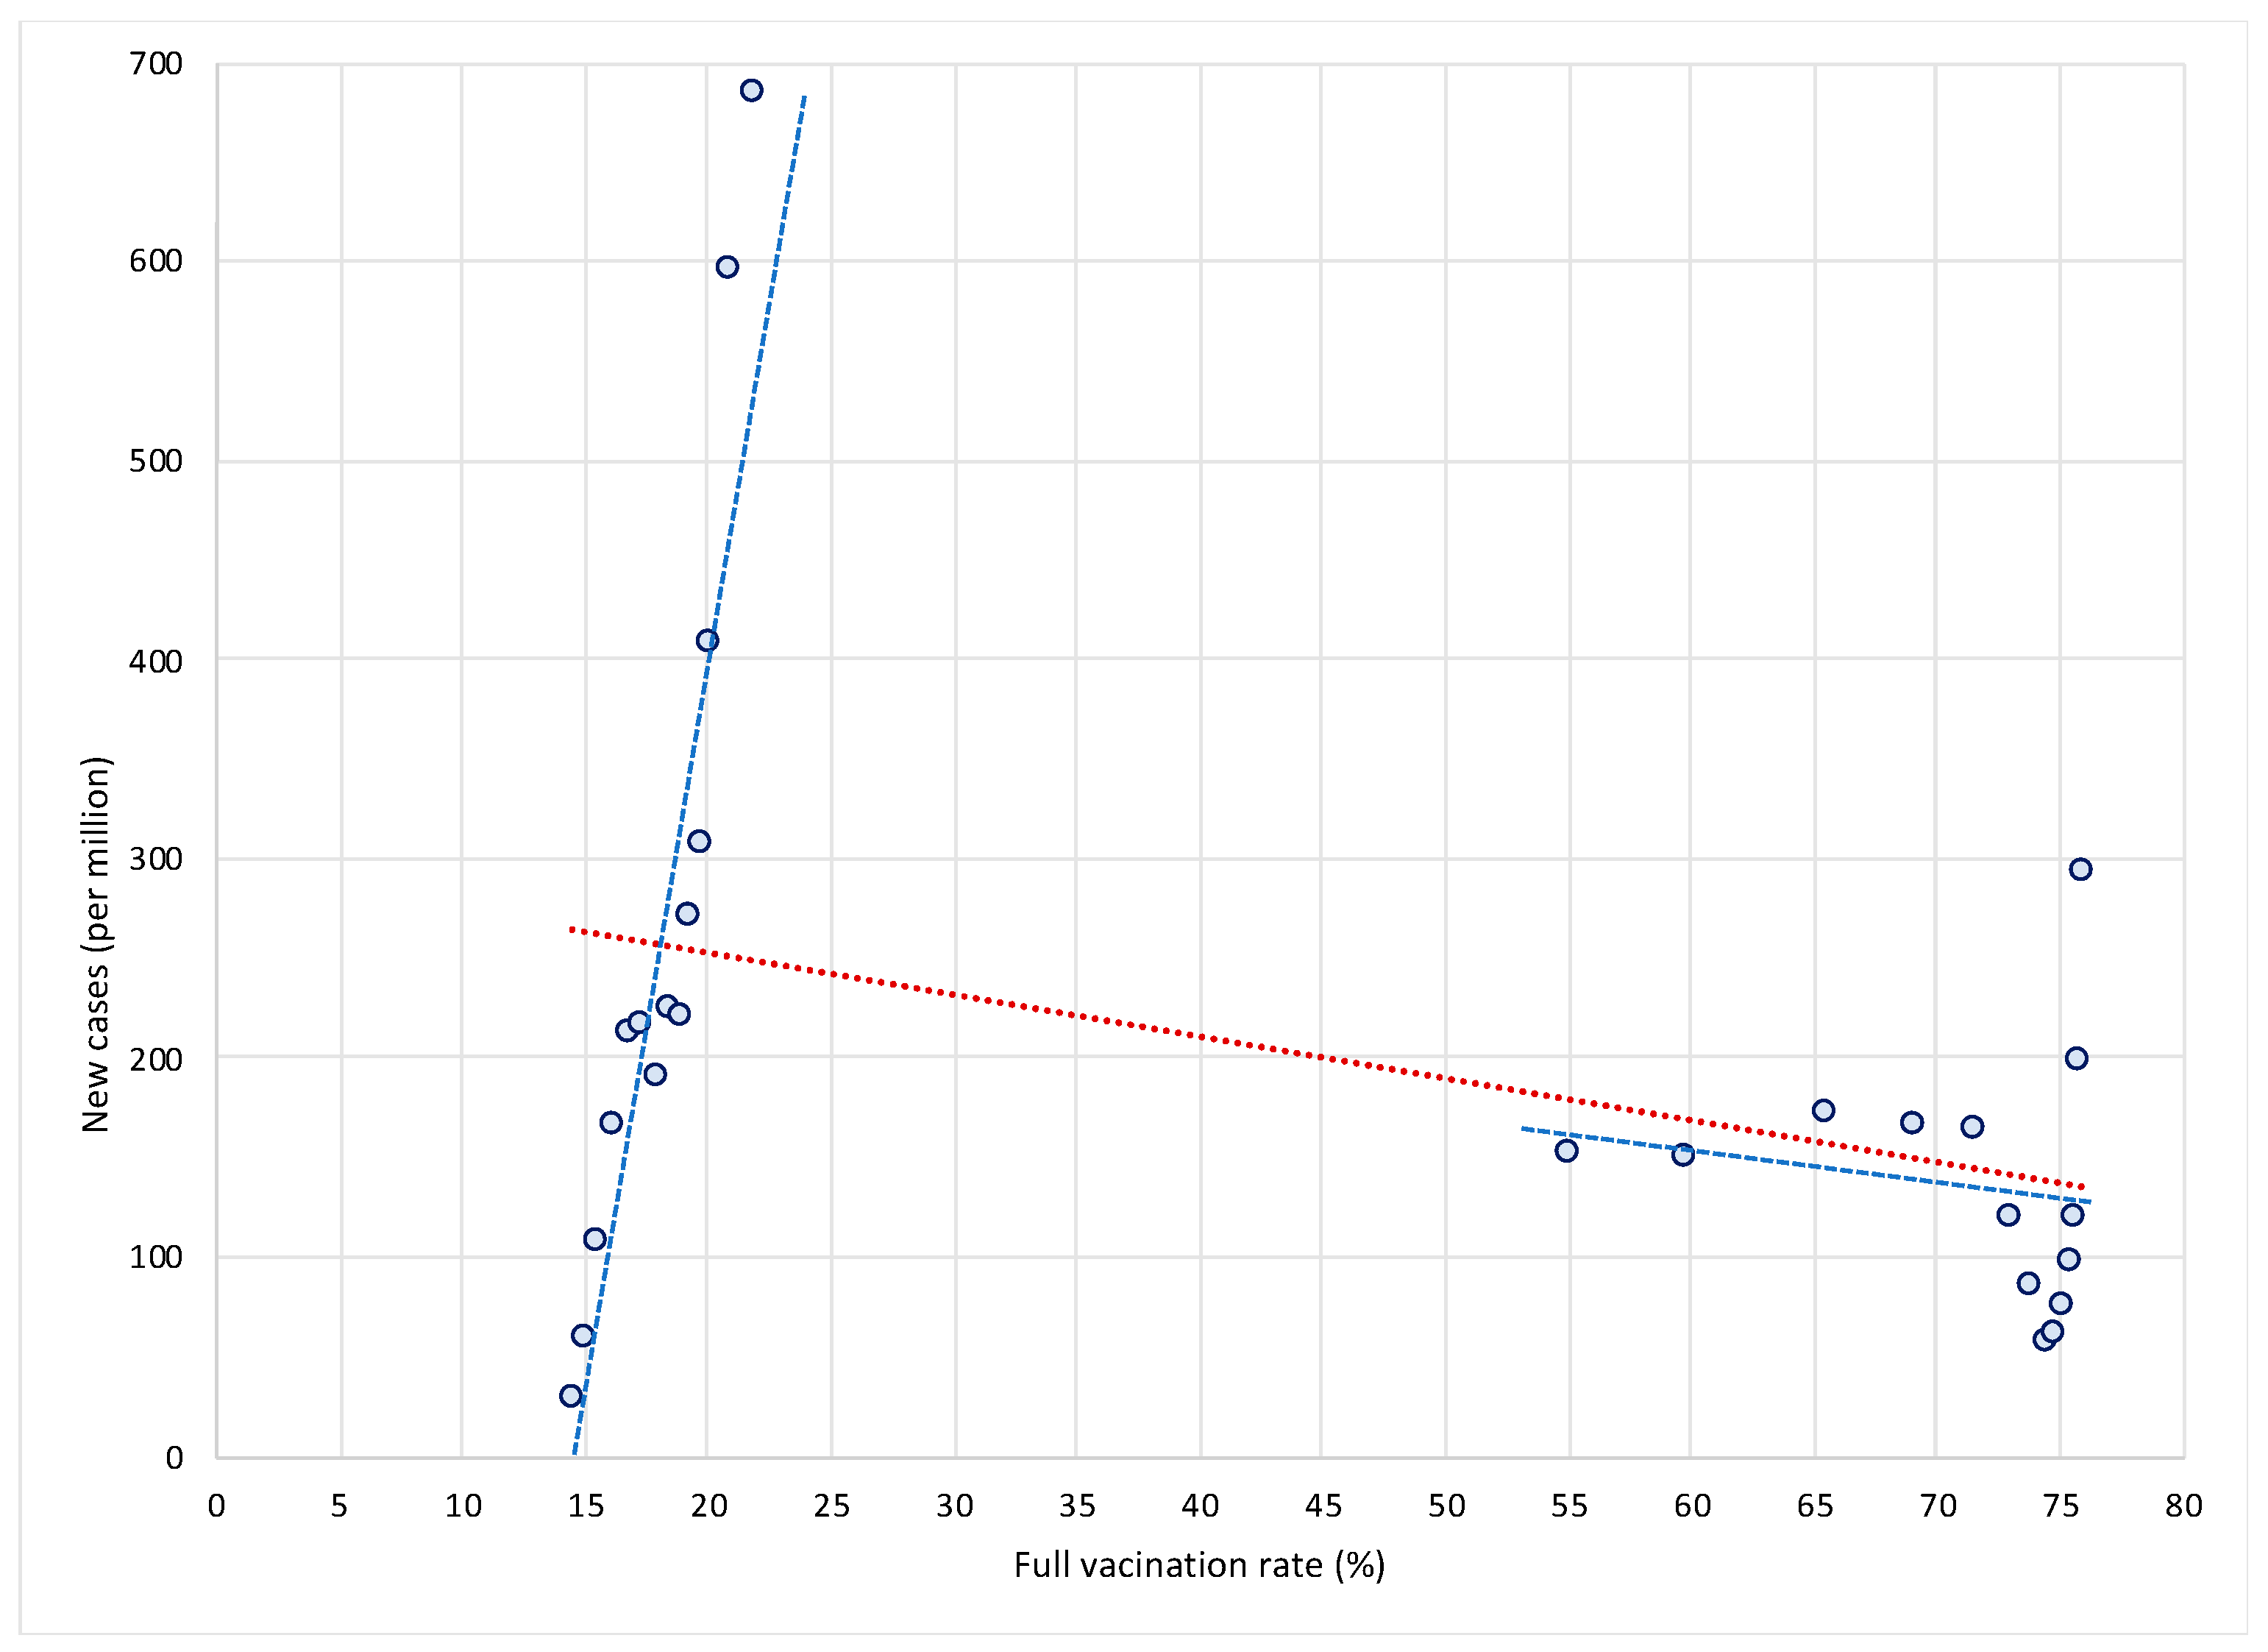
Let us first show why this approach is misleading and why it gives rise to potentially wrong conclusions. We illustrate two main concerns with this approach. The first issue is related to the use of only one cross-sectional observation per country. To illustrate this, let us take two extreme cases in terms of vaccination rates—Bulgaria and Denmark. As shown in
Figure 1, Bulgaria is characterized by very low vaccination rates—between 15 and 22 percent in the period from 1 August to 31 October 2021—while at the same time it was affected by a dramatic increase in new COVID cases (see the steep blue trend line in the left part of the
Figure 1). On the other hand, Denmark managed to vaccinate a large portion of its population—between 1 August and 31 October 2021, vaccination rates increased from 55 percent to more than 75 percent. At the same time, new COVID infections decreased (see the flat blue trend line in the right part of the
Figure 1).
This suggests that the high (and increasing) vaccination rates might have dampened the spread of infections in Denmark as opposed to Bulgaria, as shown by a negative (red) trend line for the sample of both countries. In other words, differences in vaccination rates (and in their dynamics in terms of the rollout of vaccines) between countries can have a crucial impact on the dynamics of COVID epidemics over time. High (and increasing) vaccination rates may lead to reduced rates of increase in COVID infections. This can only be observed over a longer time period and in a large sample of countries. If we were to use only one observation per country, as in the study [
1], we would miss this fundamental insight on the dynamic relationship between vaccination and spread of infections. For this reason, an analysis based on single cross-sectional observation per country is misleading and easily leads to false conclusions that are not justified by the data.
The second issue is related to omitting all factors other than vaccination rates that might influence the dynamics of the pandemic from the analysis. This leads to what is commonly known known in statistics as the omitted variable problem. It occurs when one or more relevant variables are omitted from the empirical model, leading to bias in the results because the model attributes the effect of the missing variables to those that were included. In the economics literature this problem was popularized by [
5], which used a sample of 98 countries over the period 1960–1985 to try to uncover the factors that drive economic growth. Estimating the relationship between the growth rate of real GDP per capita and the initial (1960) level of real GDP per capita in a bivariate setting, the study finds a positive but insignificant relationship between the two. Based on this, one might conclude that there is no empirical support for the Solow–Swan hypothesis of convergence across countries. However, after including additional factors in the model (such as differences in human capital, fertility rates, ratio of physical investment to GDP, share of government consumption to GDP, share of public investment, measures of political stability, and a proxy for market distortions) The study finds that the relationship between the growth rate of real GDP per capita and the initial level of real GDP per capita turns negative and significant [
5]. This means that when important factors are omitted, the model may attribute the effect of the missing variables to those that were included.
The same problem occurs in the study [
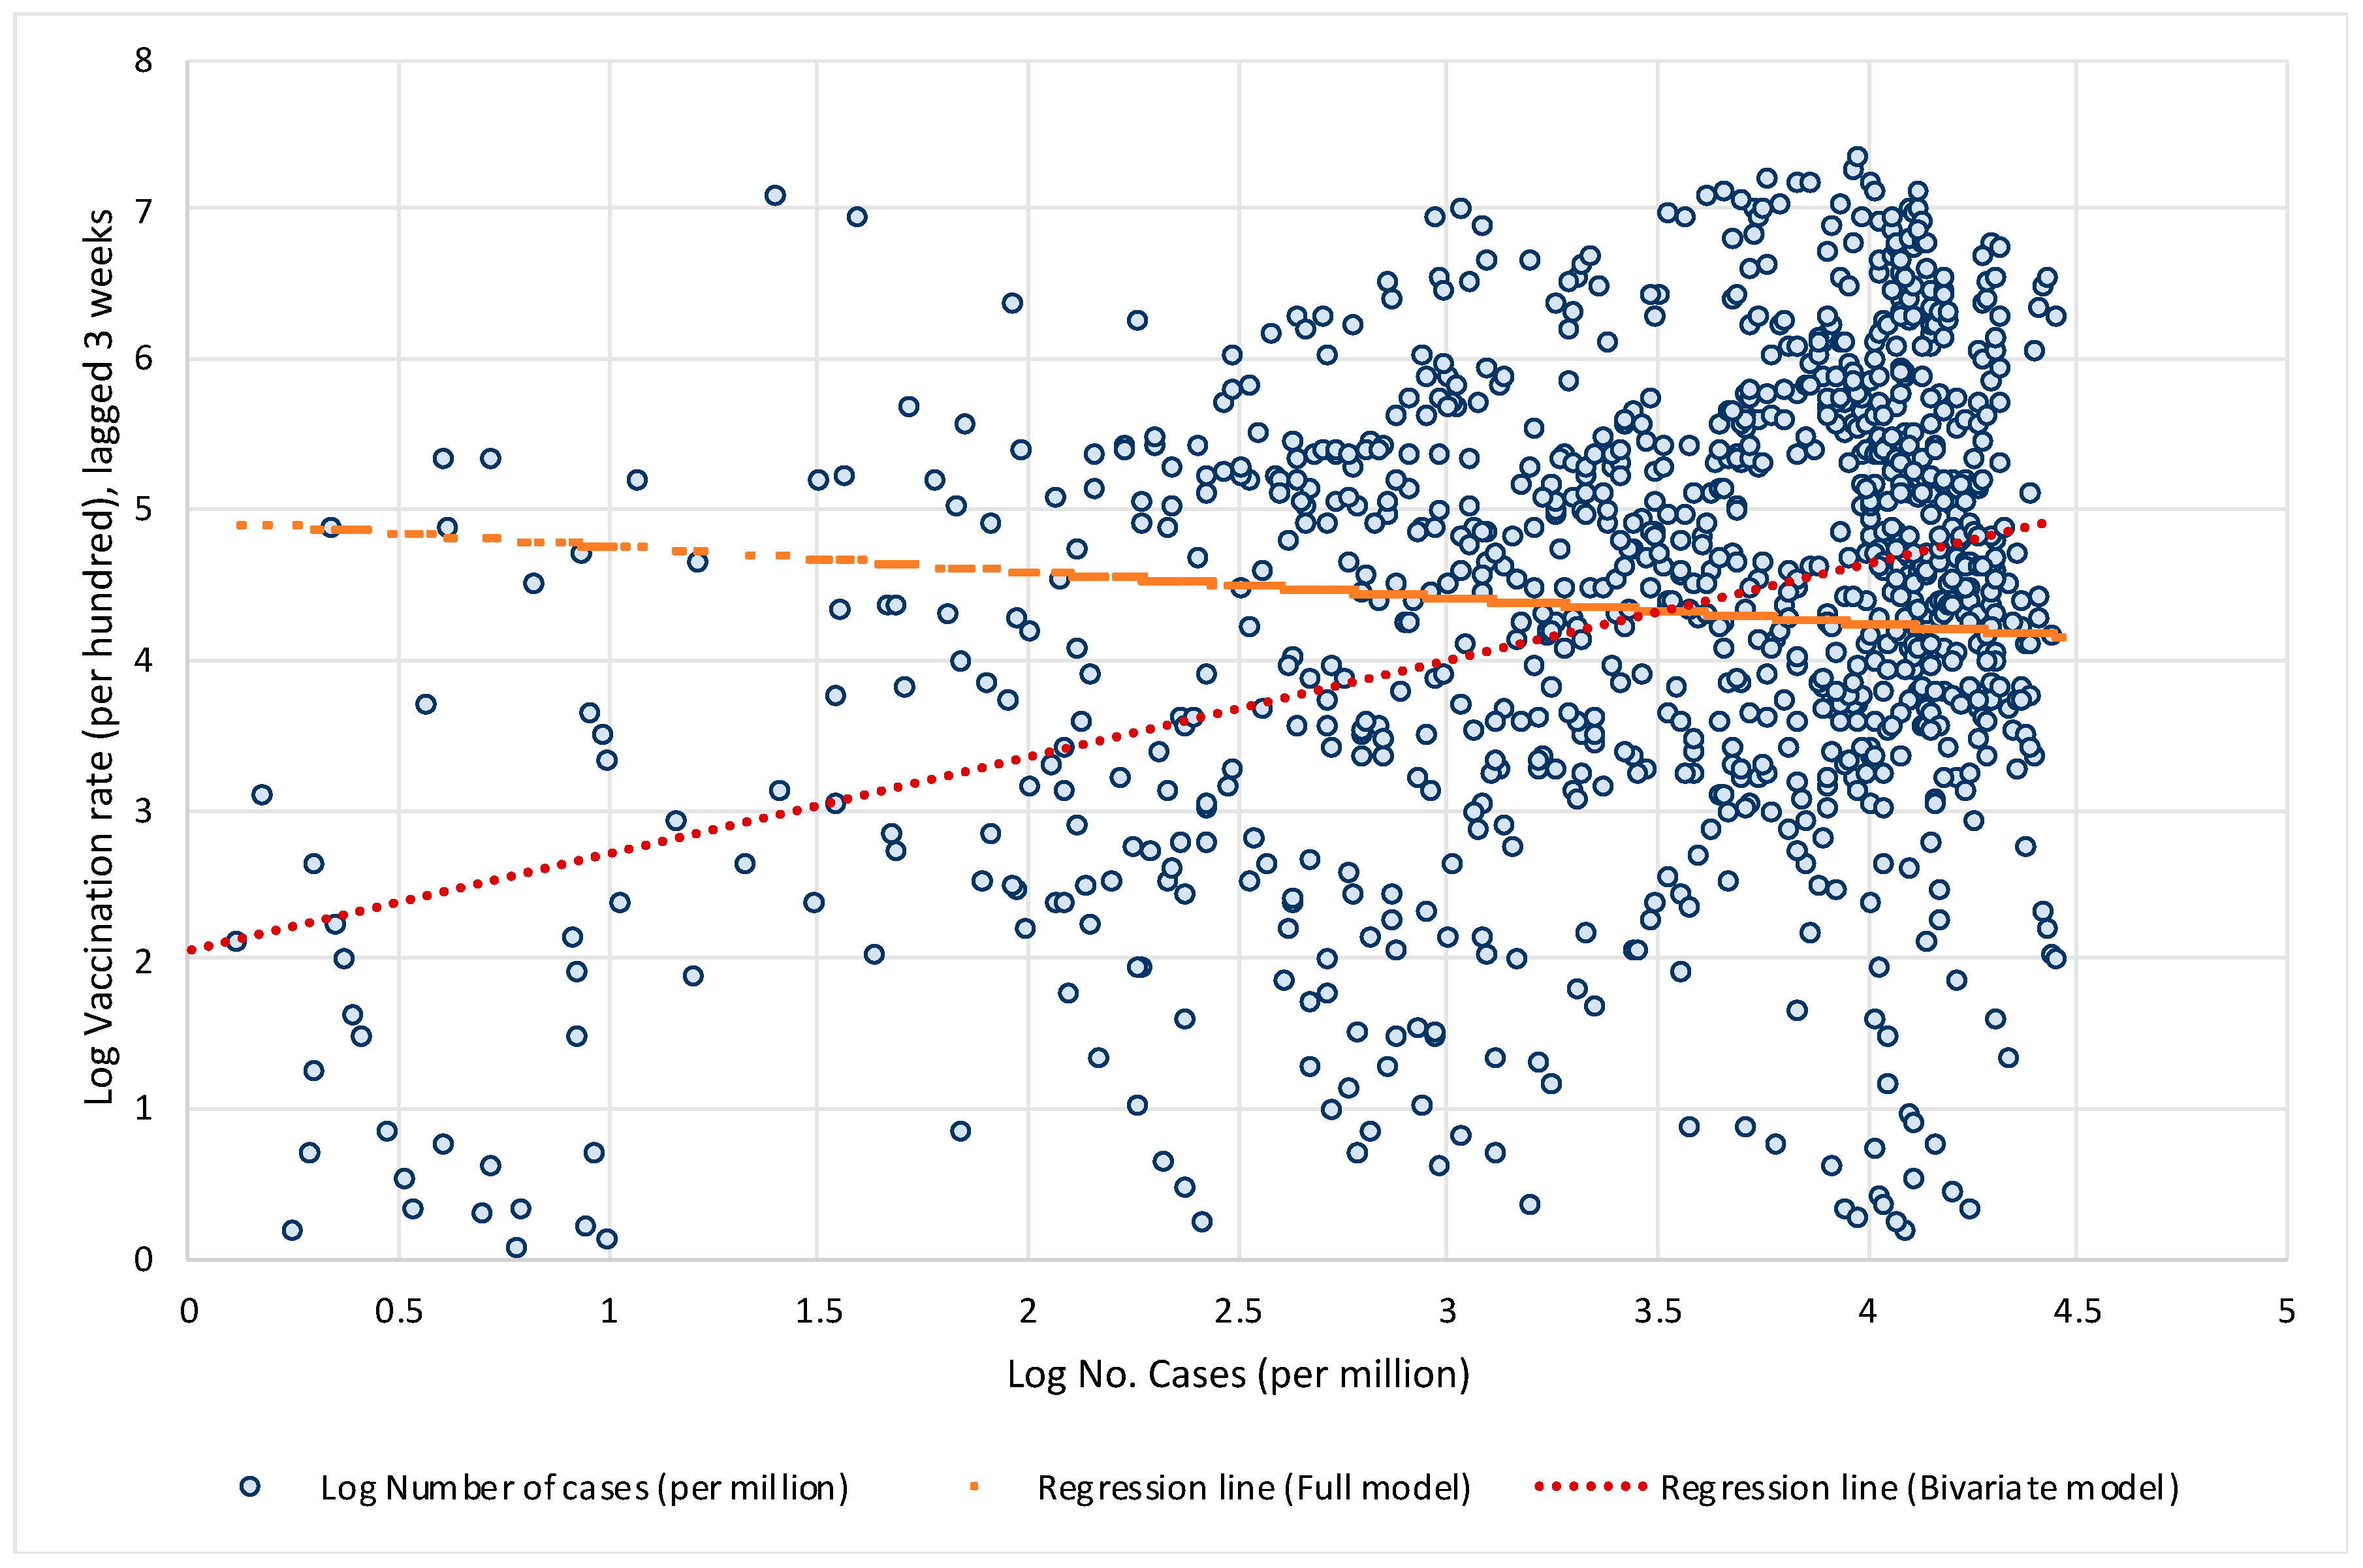
1], which analyzed only the bivariate relationship between vaccination rates and the number of COVID cases but omitted large structural differences between countries in the factors that significantly influence the spread of COVID and the public health consequences. Let us illustrate what bias this might have in terms of the impact of vaccination on the spread of COVID infection. To show this, we estimate two models. First, we estimate a simple bivariate model by regressing the logarithm of the 7-day moving average number of new cases per 1 million population on the logarithm of the three-week lagged vaccination rate. In the next step, we estimate a full model that also includes other structural factors, such as the age structure of the population, population density, the prevalence of other diseases that increase the risk of developing severe COVID symptoms such as diabetes or cardiovascular disease, etc., the availability of quality health care, the current state of the pandemic, and an indicator of countries’ responses to epidemics (the stringency index).
Figure 2 shows the data and linear regression lines for the bivariate relationship between vaccination rates and the number of new COVID infections. In the simplest model when all structural differences and policy responses of countries are omitted, the model yields a positive and significant relationship (see red regression line trending upwards), i.e., it may wrongly suggest that high vaccination rates lead to a higher number of COVID infections. However, when structural differences and country policy responses are included in the model, the relationship between vaccination rates and the number of new COVID infections becomes negative and significant (see orange regression line trending downwards).
Both issues illustrated above show that investigating the impact of vaccination on the transmission of COVID in a cross-country setting requires careful analysis. First of all, there are large structural differences between countries in underlying factors that significantly influence the spread of COVID and the public health consequences. In addition, there is wide variation in the response of countries to the pandemic in terms of policies to reduce transmission of COVID, effectiveness in vaccination rollout, etc. There are also large differences between countries in terms of the state of epidemics. One should also consider the timing of vaccination, as immunity takes time to build up, while its effectiveness also gradually wanes after the vaccination. The study [
1] triggered many other responses to the journal, which also raised some major methodological issues [
6,
7].
In this large cross-country study, we consider the above factors in examining the impact of vaccination on the transmission of COVID and its public health consequences. To analyze the impacts of vaccination, we estimate two comprehensive models—one for the impact on the spread of COVID infections (in terms of number of new confirmed cases) and another for the impact on severe COVID disease progression (in terms of number of new hospitalizations, admissions to intensive care and deaths). We take into account both the static cross-section and the dynamic aspects of the COVID pandemic. Our empirical models are designed to capture the differences across countries regarding the state of the pandemic (by including the initial level of infections per 1 million) and its dynamics (by including the most recent weekly reproduction rate). In addition to differences in vaccination rates and their dynamics, our model also includes country-specific factors that account for differences between countries that determine their specific vulnerabilities or strengths when dealing with the pandemic.
To examine the effectiveness of vaccination, we used the data for the latest wave of the COVID outbreak (the Delta variant) in most countries (the period from 1 August 2021, onwards), while vaccines were also widely available. We used data for 110 countries (from Our World in Data) on the number of cases, deaths, hospitalized and intensive care patients, the percentage of people fully vaccinated, the reproduction rate, and the policy stringency index—all with daily frequency. The COVID-related daily frequency data (per million people) were then transformed into weekly averages using 7-day moving averages. As a point of reference, we used the data for the last day of the week capturing the average effects of the current week. We combined these data with a number of country-specific indicators accounting for demography, overall health of the population, state of the healthcare infrastructure and economic development.
Our data were structured as a panel with a cross-sectional (country) and time (week) dimension. Both models were estimated using a pooled ordinary least squares (OLS) estimator. We first estimated our baseline models and then proceeded with two alternative specifications to examine vaccination effectiveness from a different perspective.
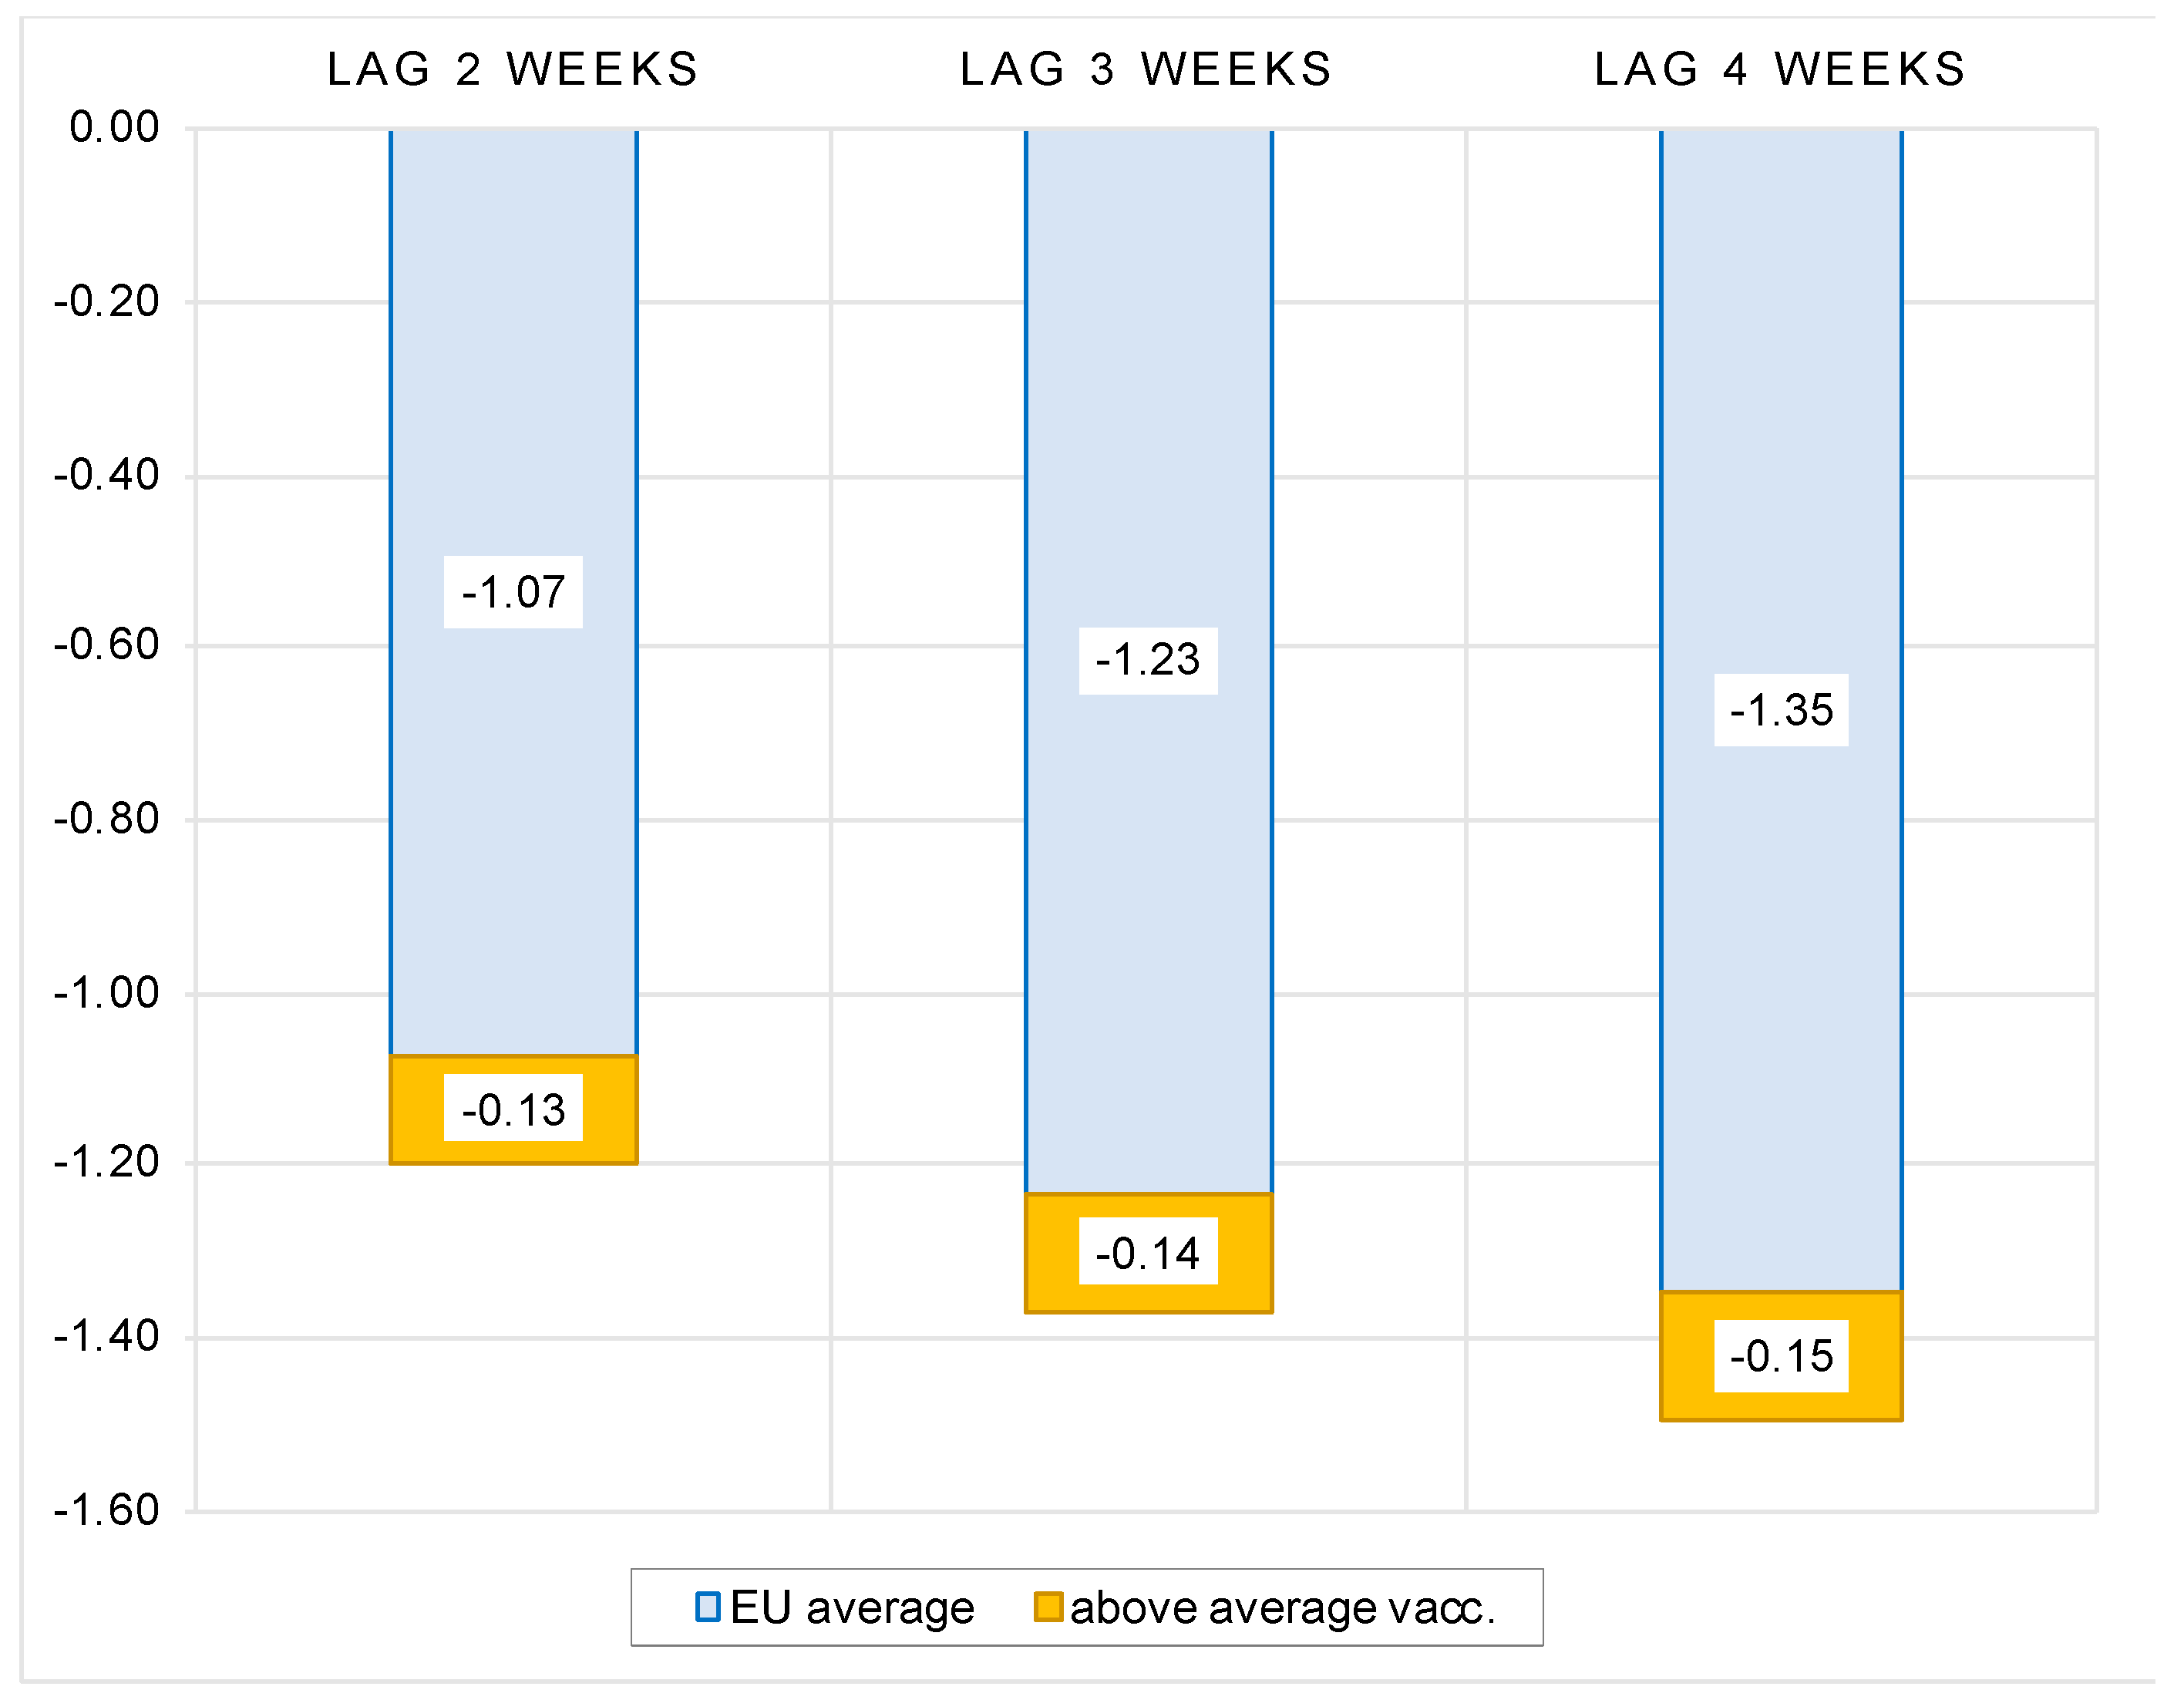
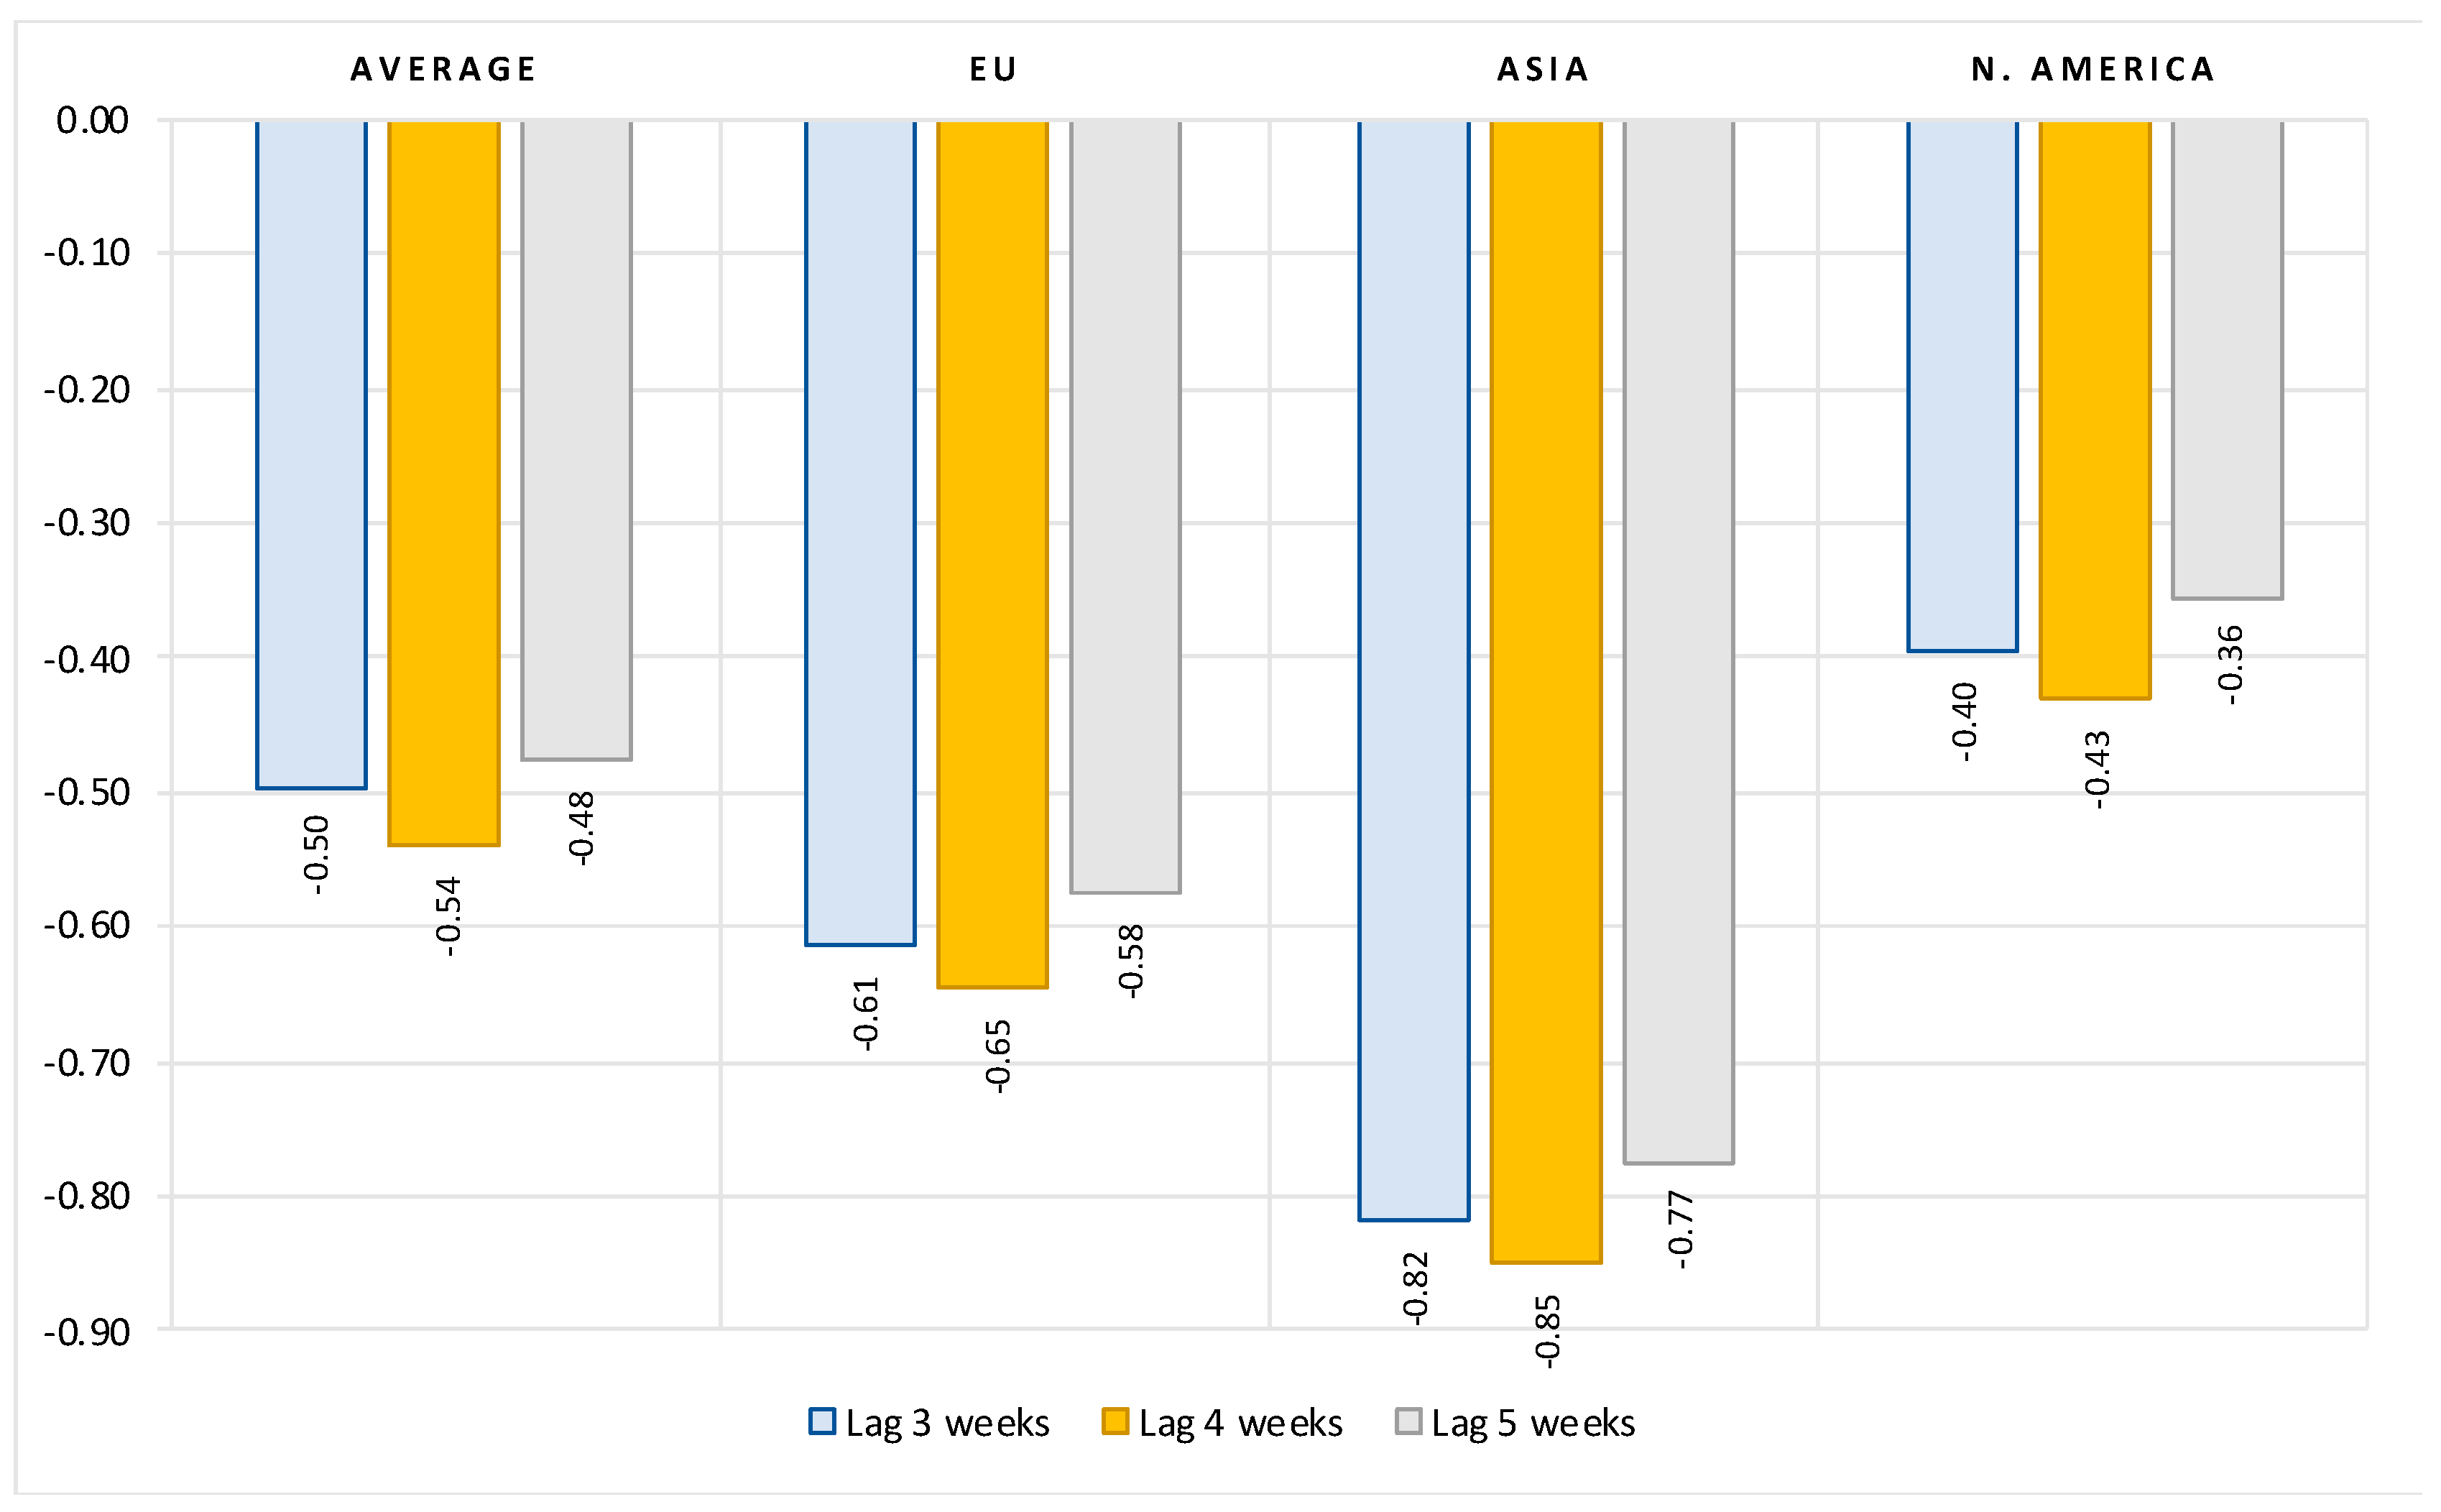
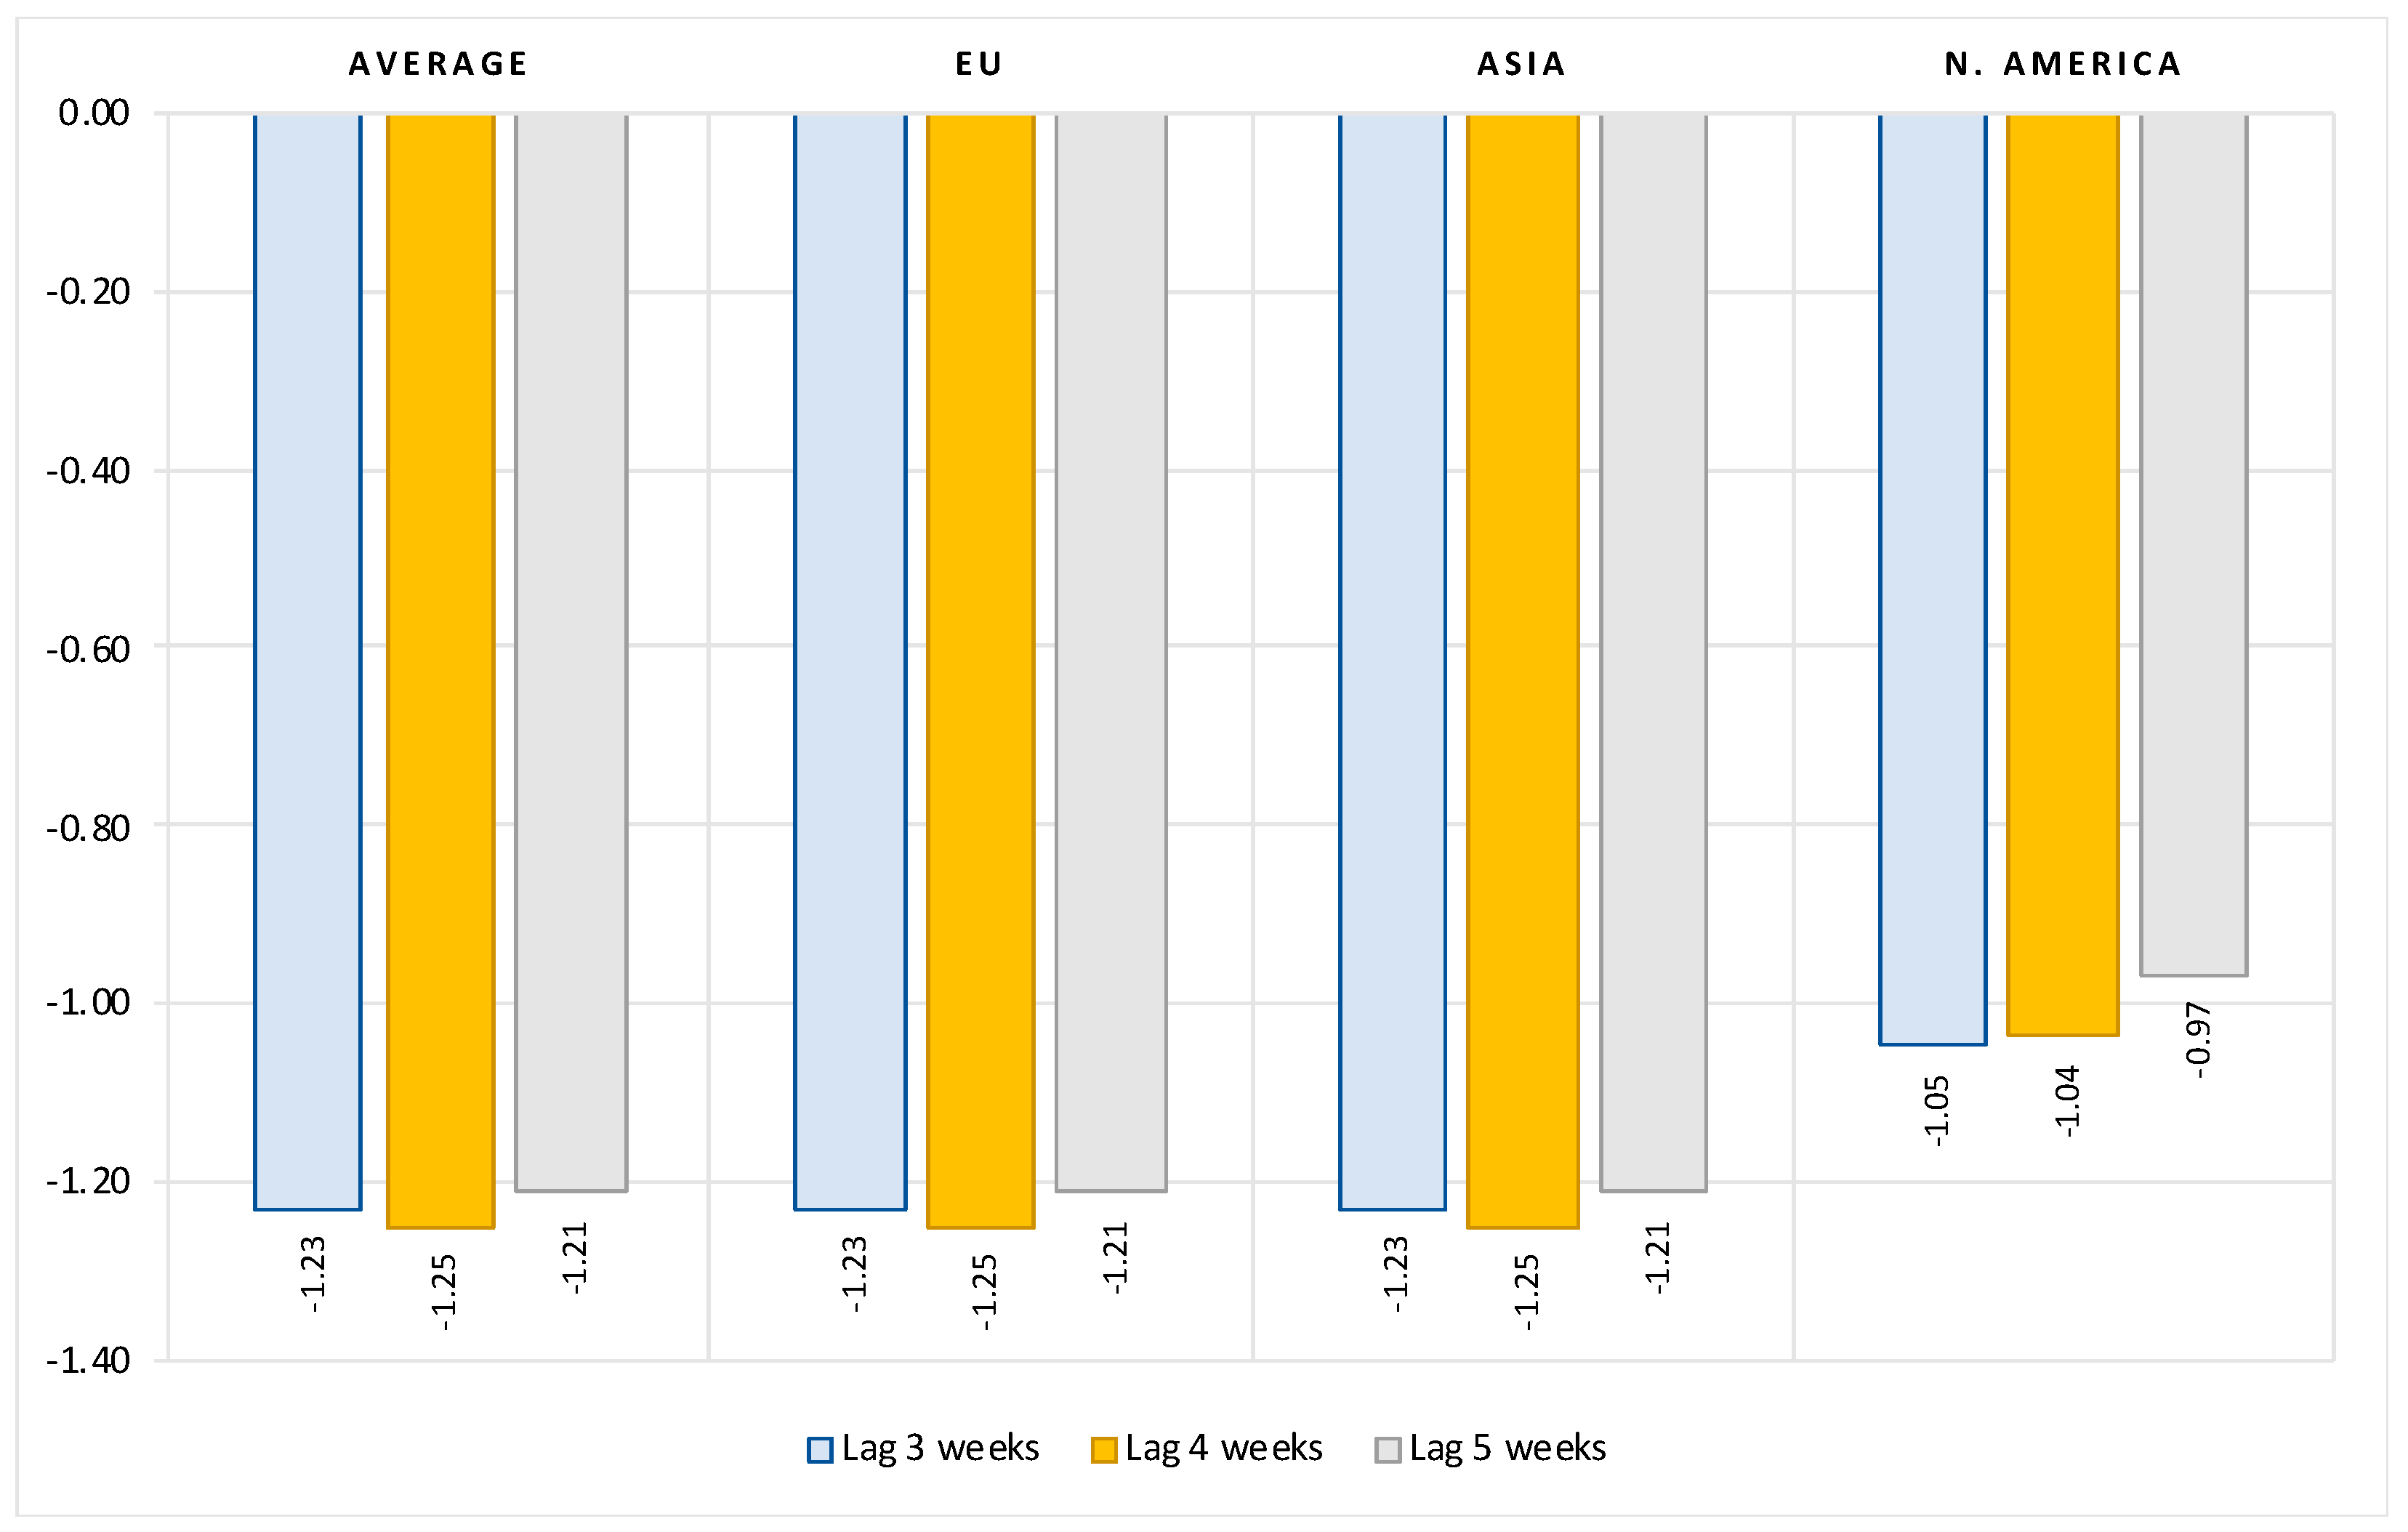
The results can be summarized as follows. First, we show that, after controlling for the number of previous infections, the reproduction rate, the stringency of government protection measures and structural country-specific factors, the full vaccination rate is consistently and significantly negatively correlated with the number of new COVID cases. The regression coefficients indicate that, on average, at a lag of two weeks after the second dose, a 10 percent increase in vaccination rate is associated with a 1.3 percent decrease in new COVID cases. Extending the time elapsed after full vaccination results in a greater decrease in the number of new infections. The overall vaccination effectiveness, however, varies widely from region to region.
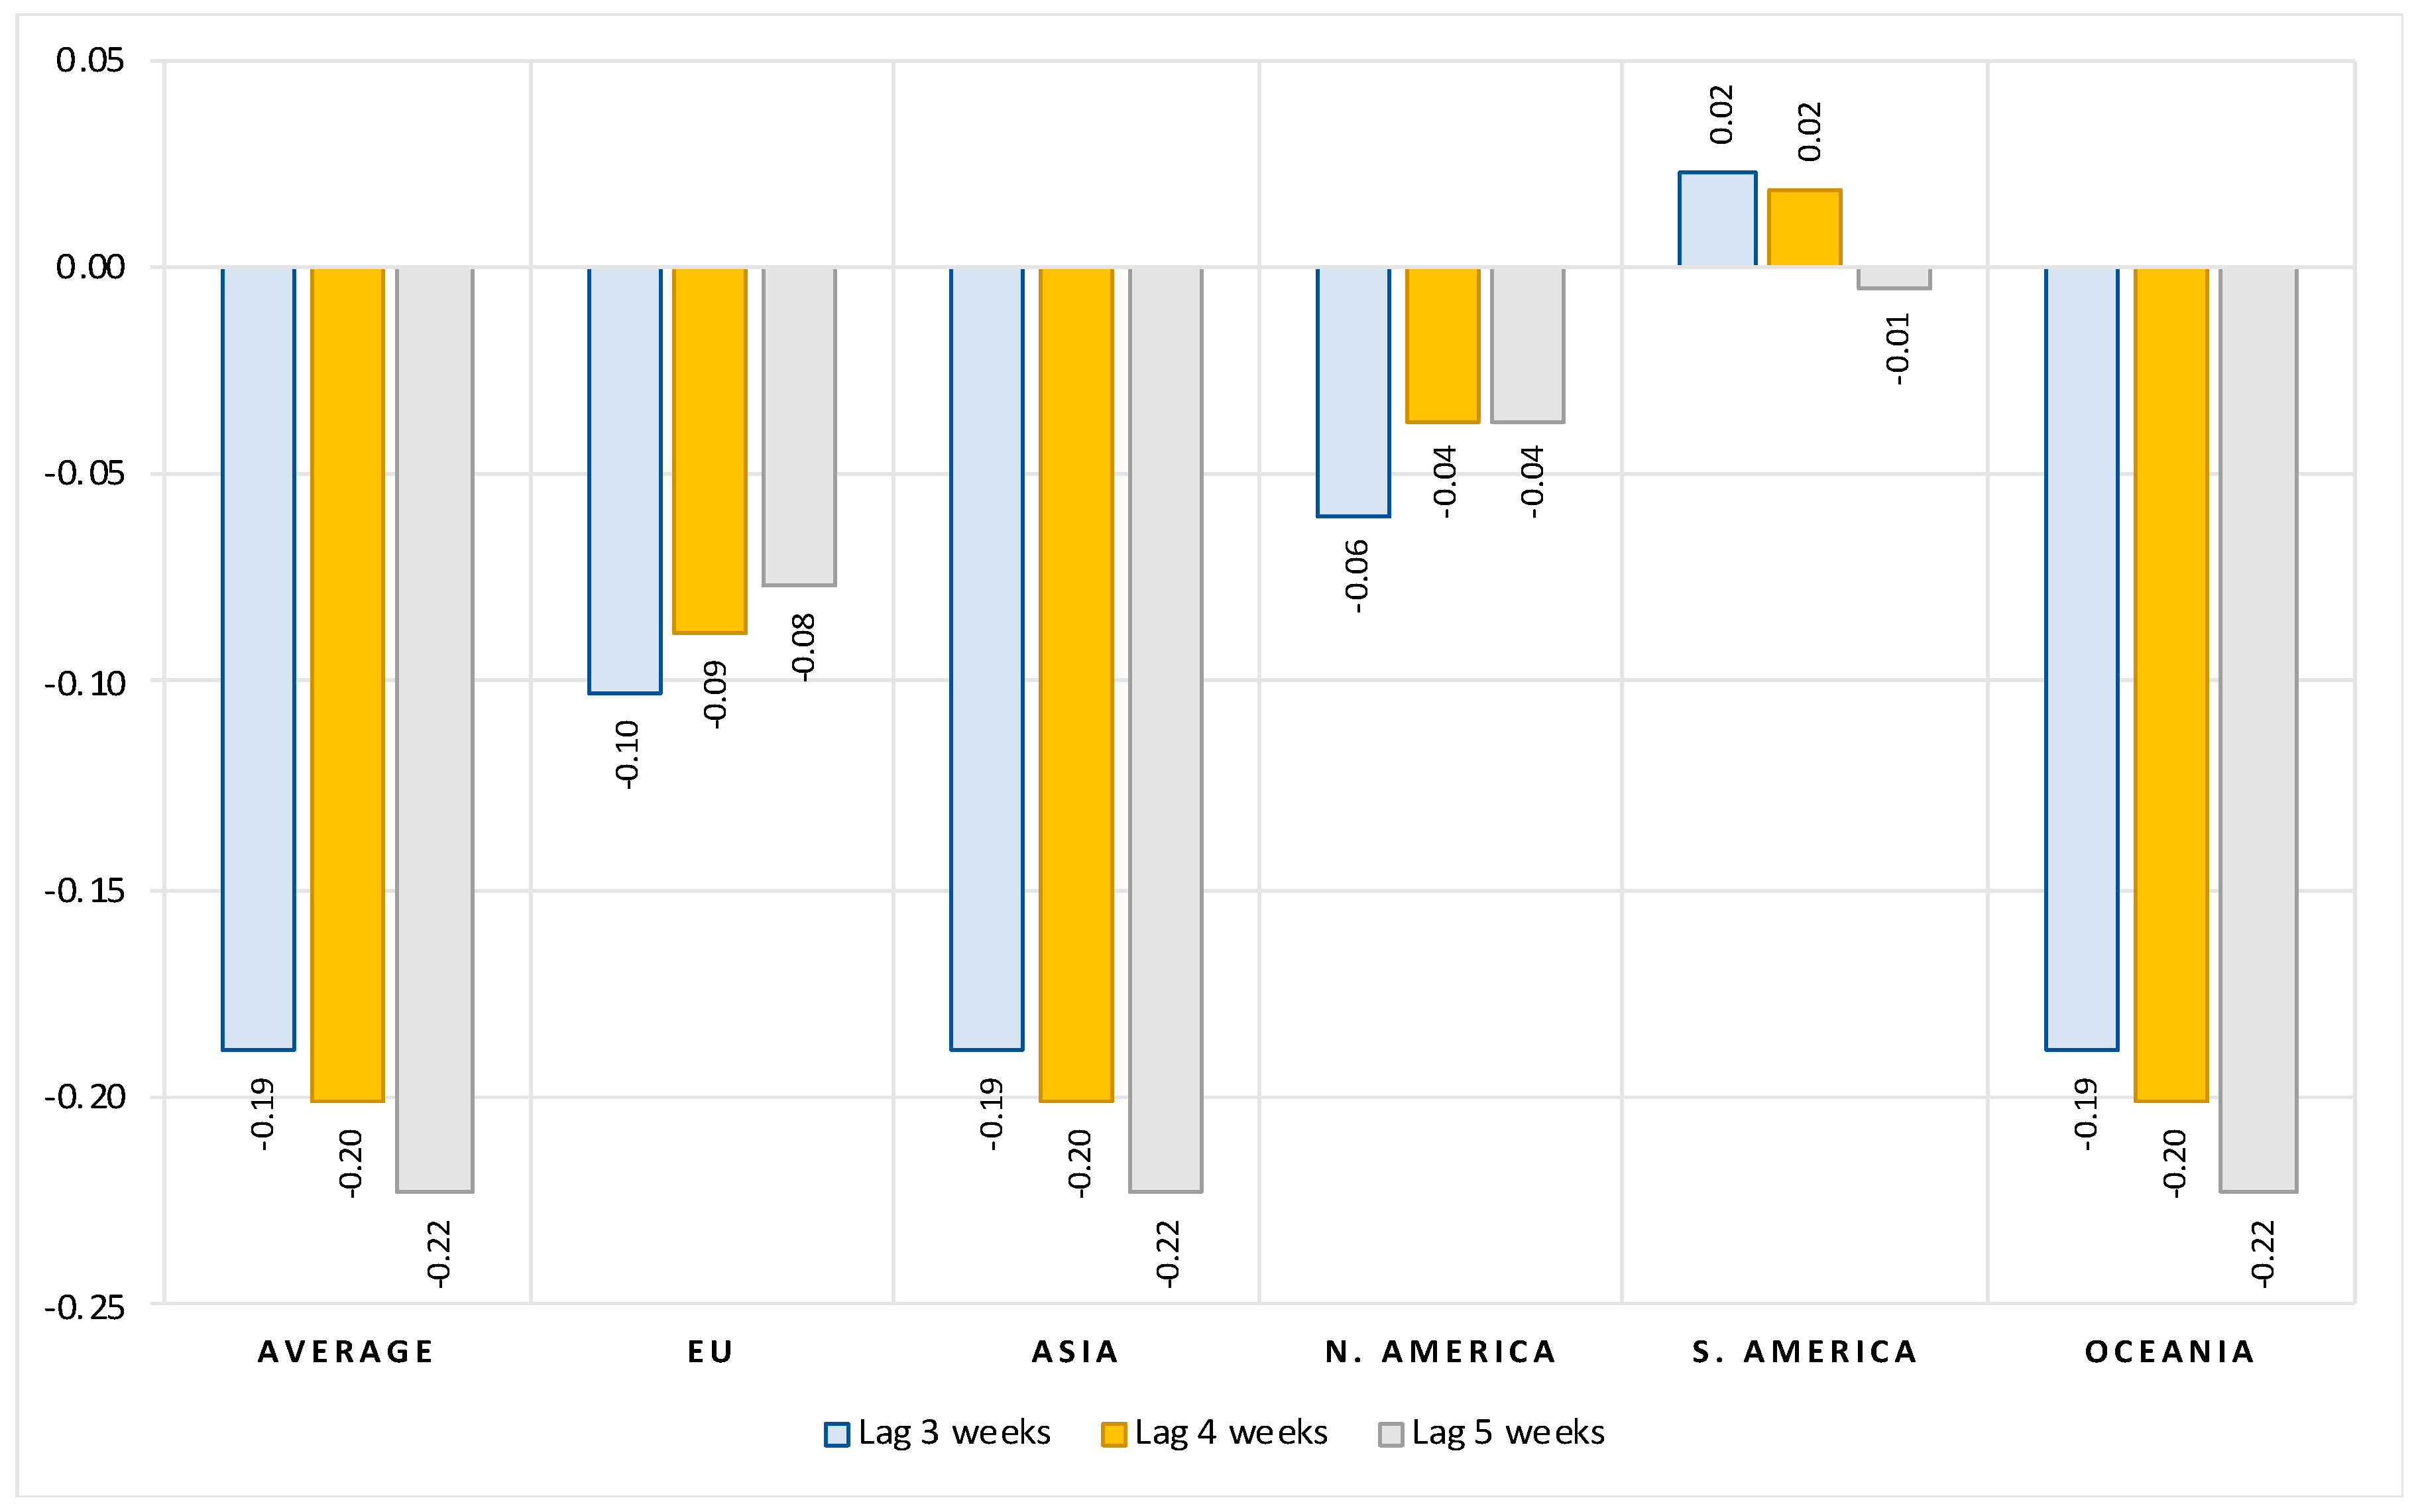
Second, our estimations show that magnitude of vaccination contributes significantly to reducing hospitalizations, intensive care (ICU) admissions and deaths with COVID. On average, after controlling for the number of previous infections and structural country-specific factors, a 10 percent increase in the rate of vaccination leads to a reduction of about 5 percent in the number of new hospitalizations, 12 percent decrease in the number of new intensive care patients and 2 percent reduction in the number of new deaths with COVID. Again, there are large differences in vaccination effectiveness between regions. The effects increase the longer the period after full vaccination.
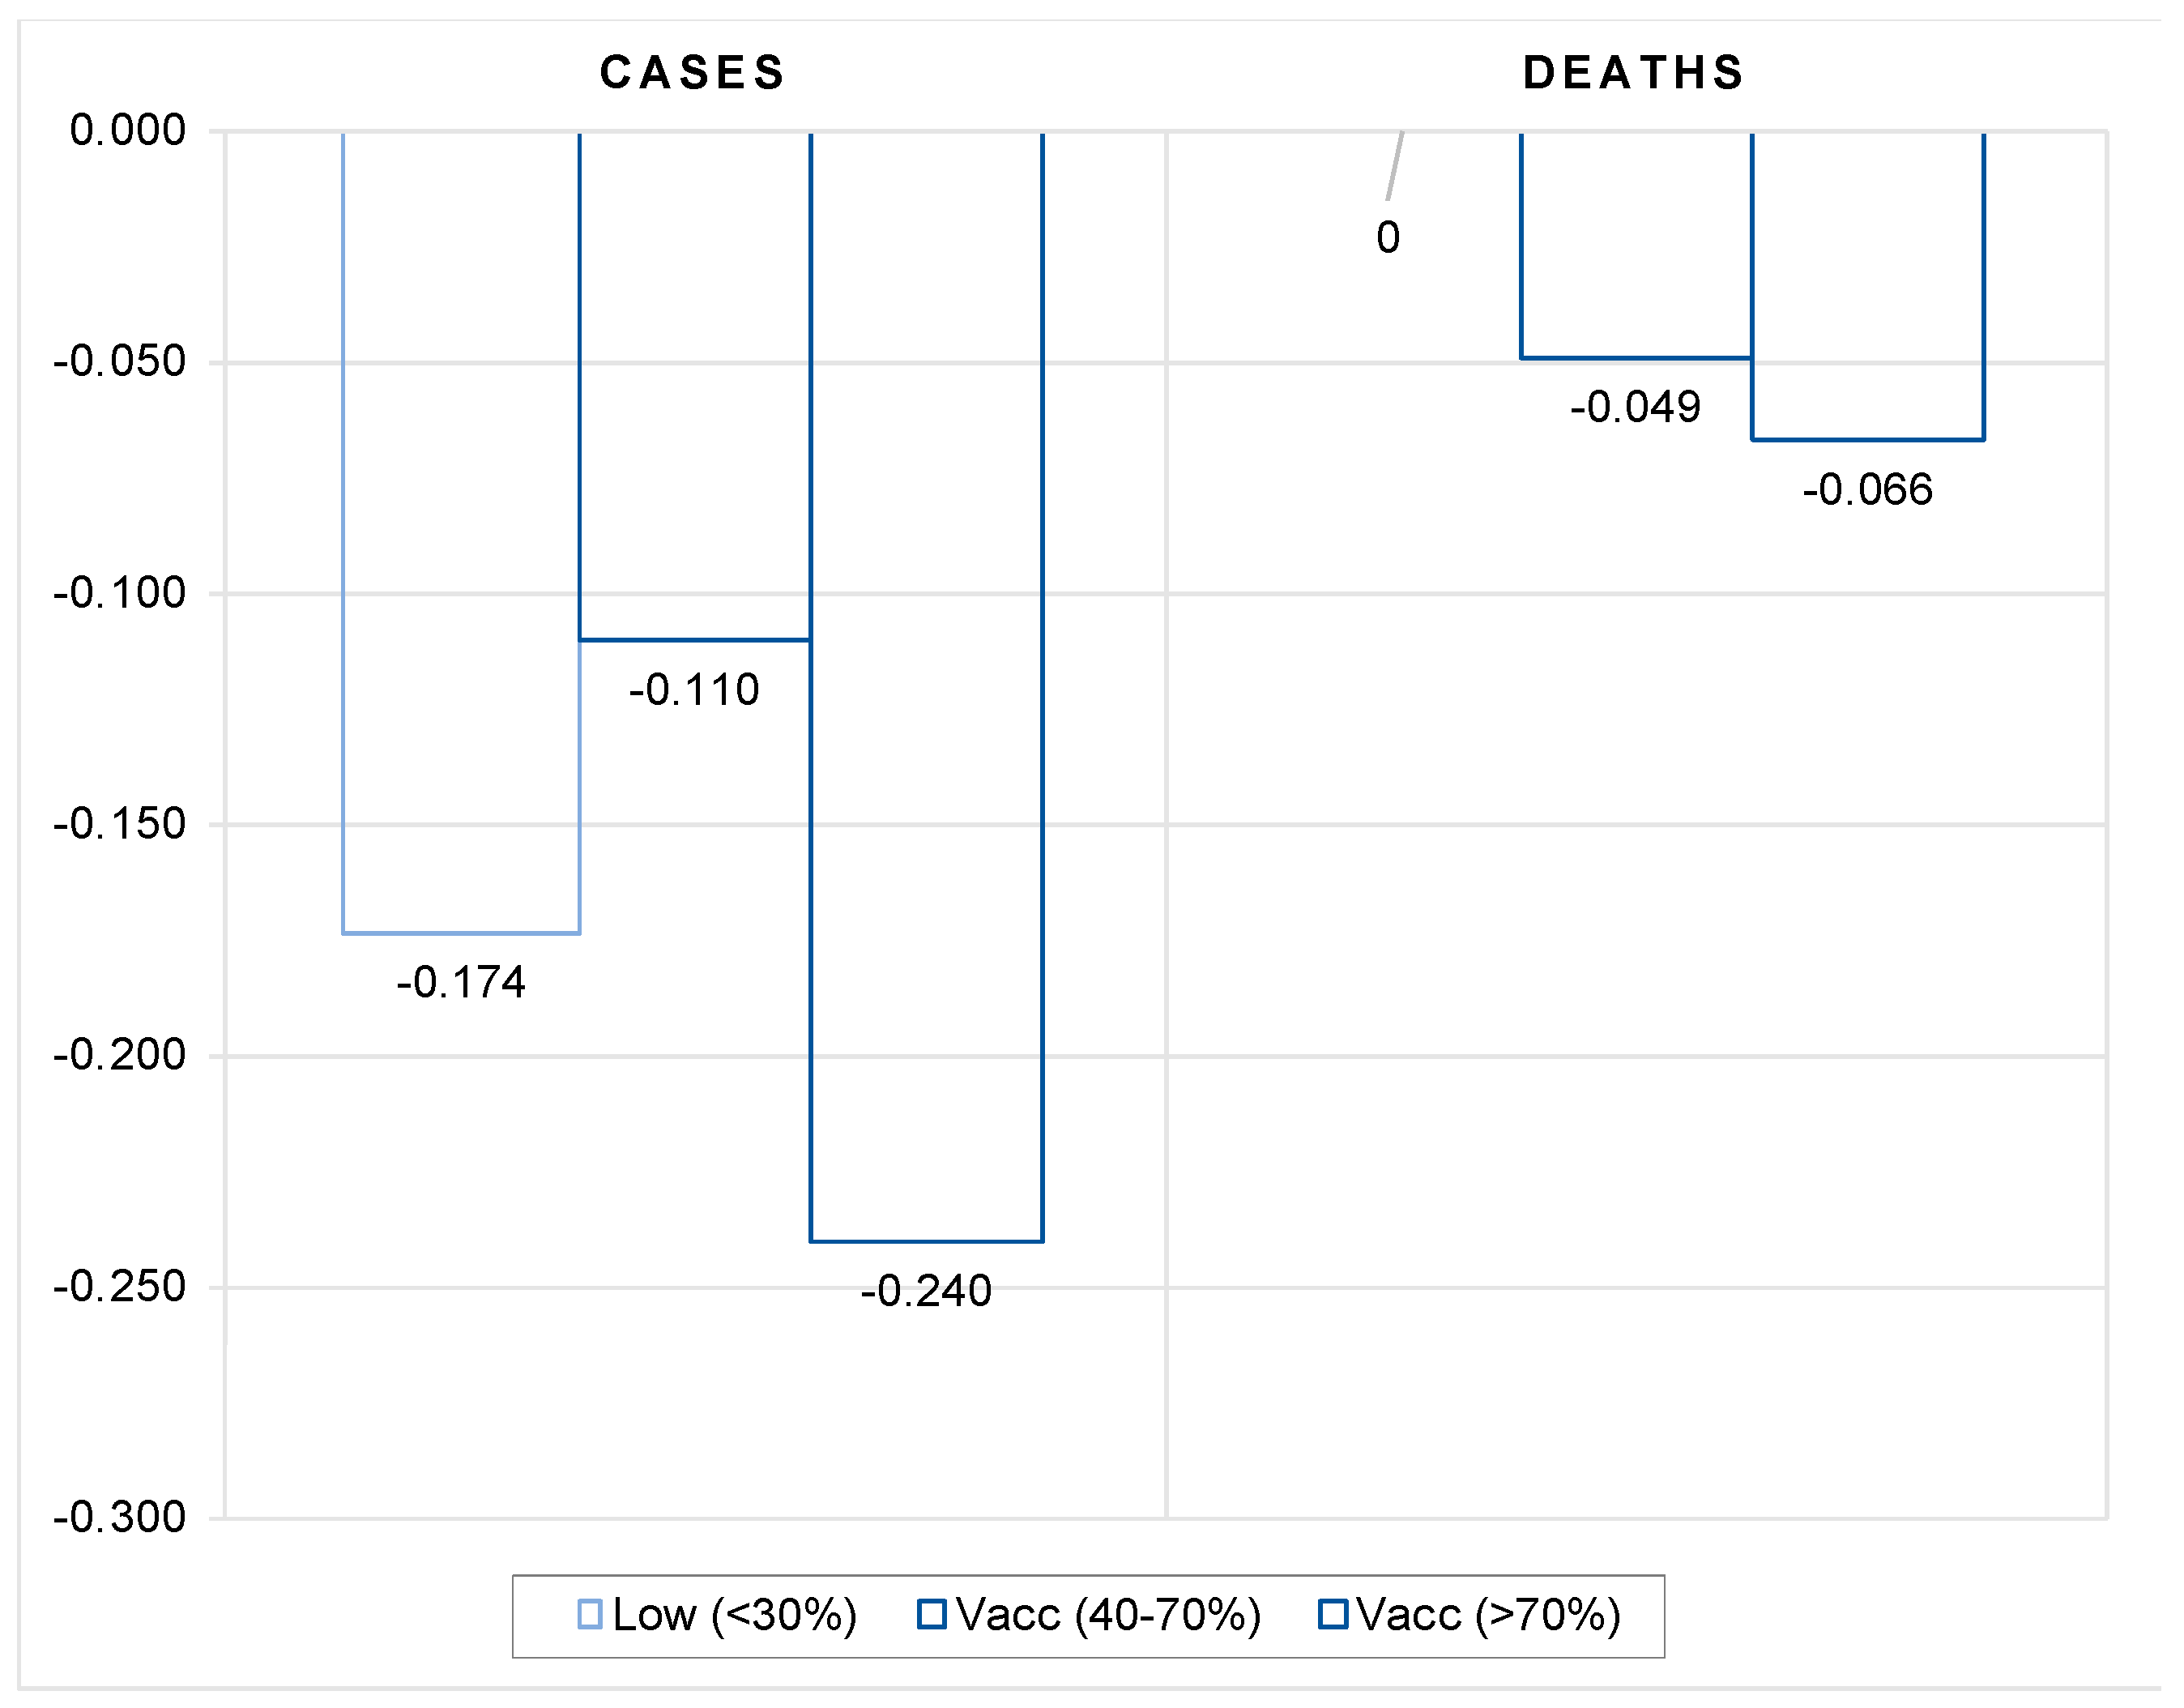
Third, the estimates confirm that the moderating effect of vaccines on the number of cases and deaths occurs when the overall full vaccination coverage is sufficiently high.
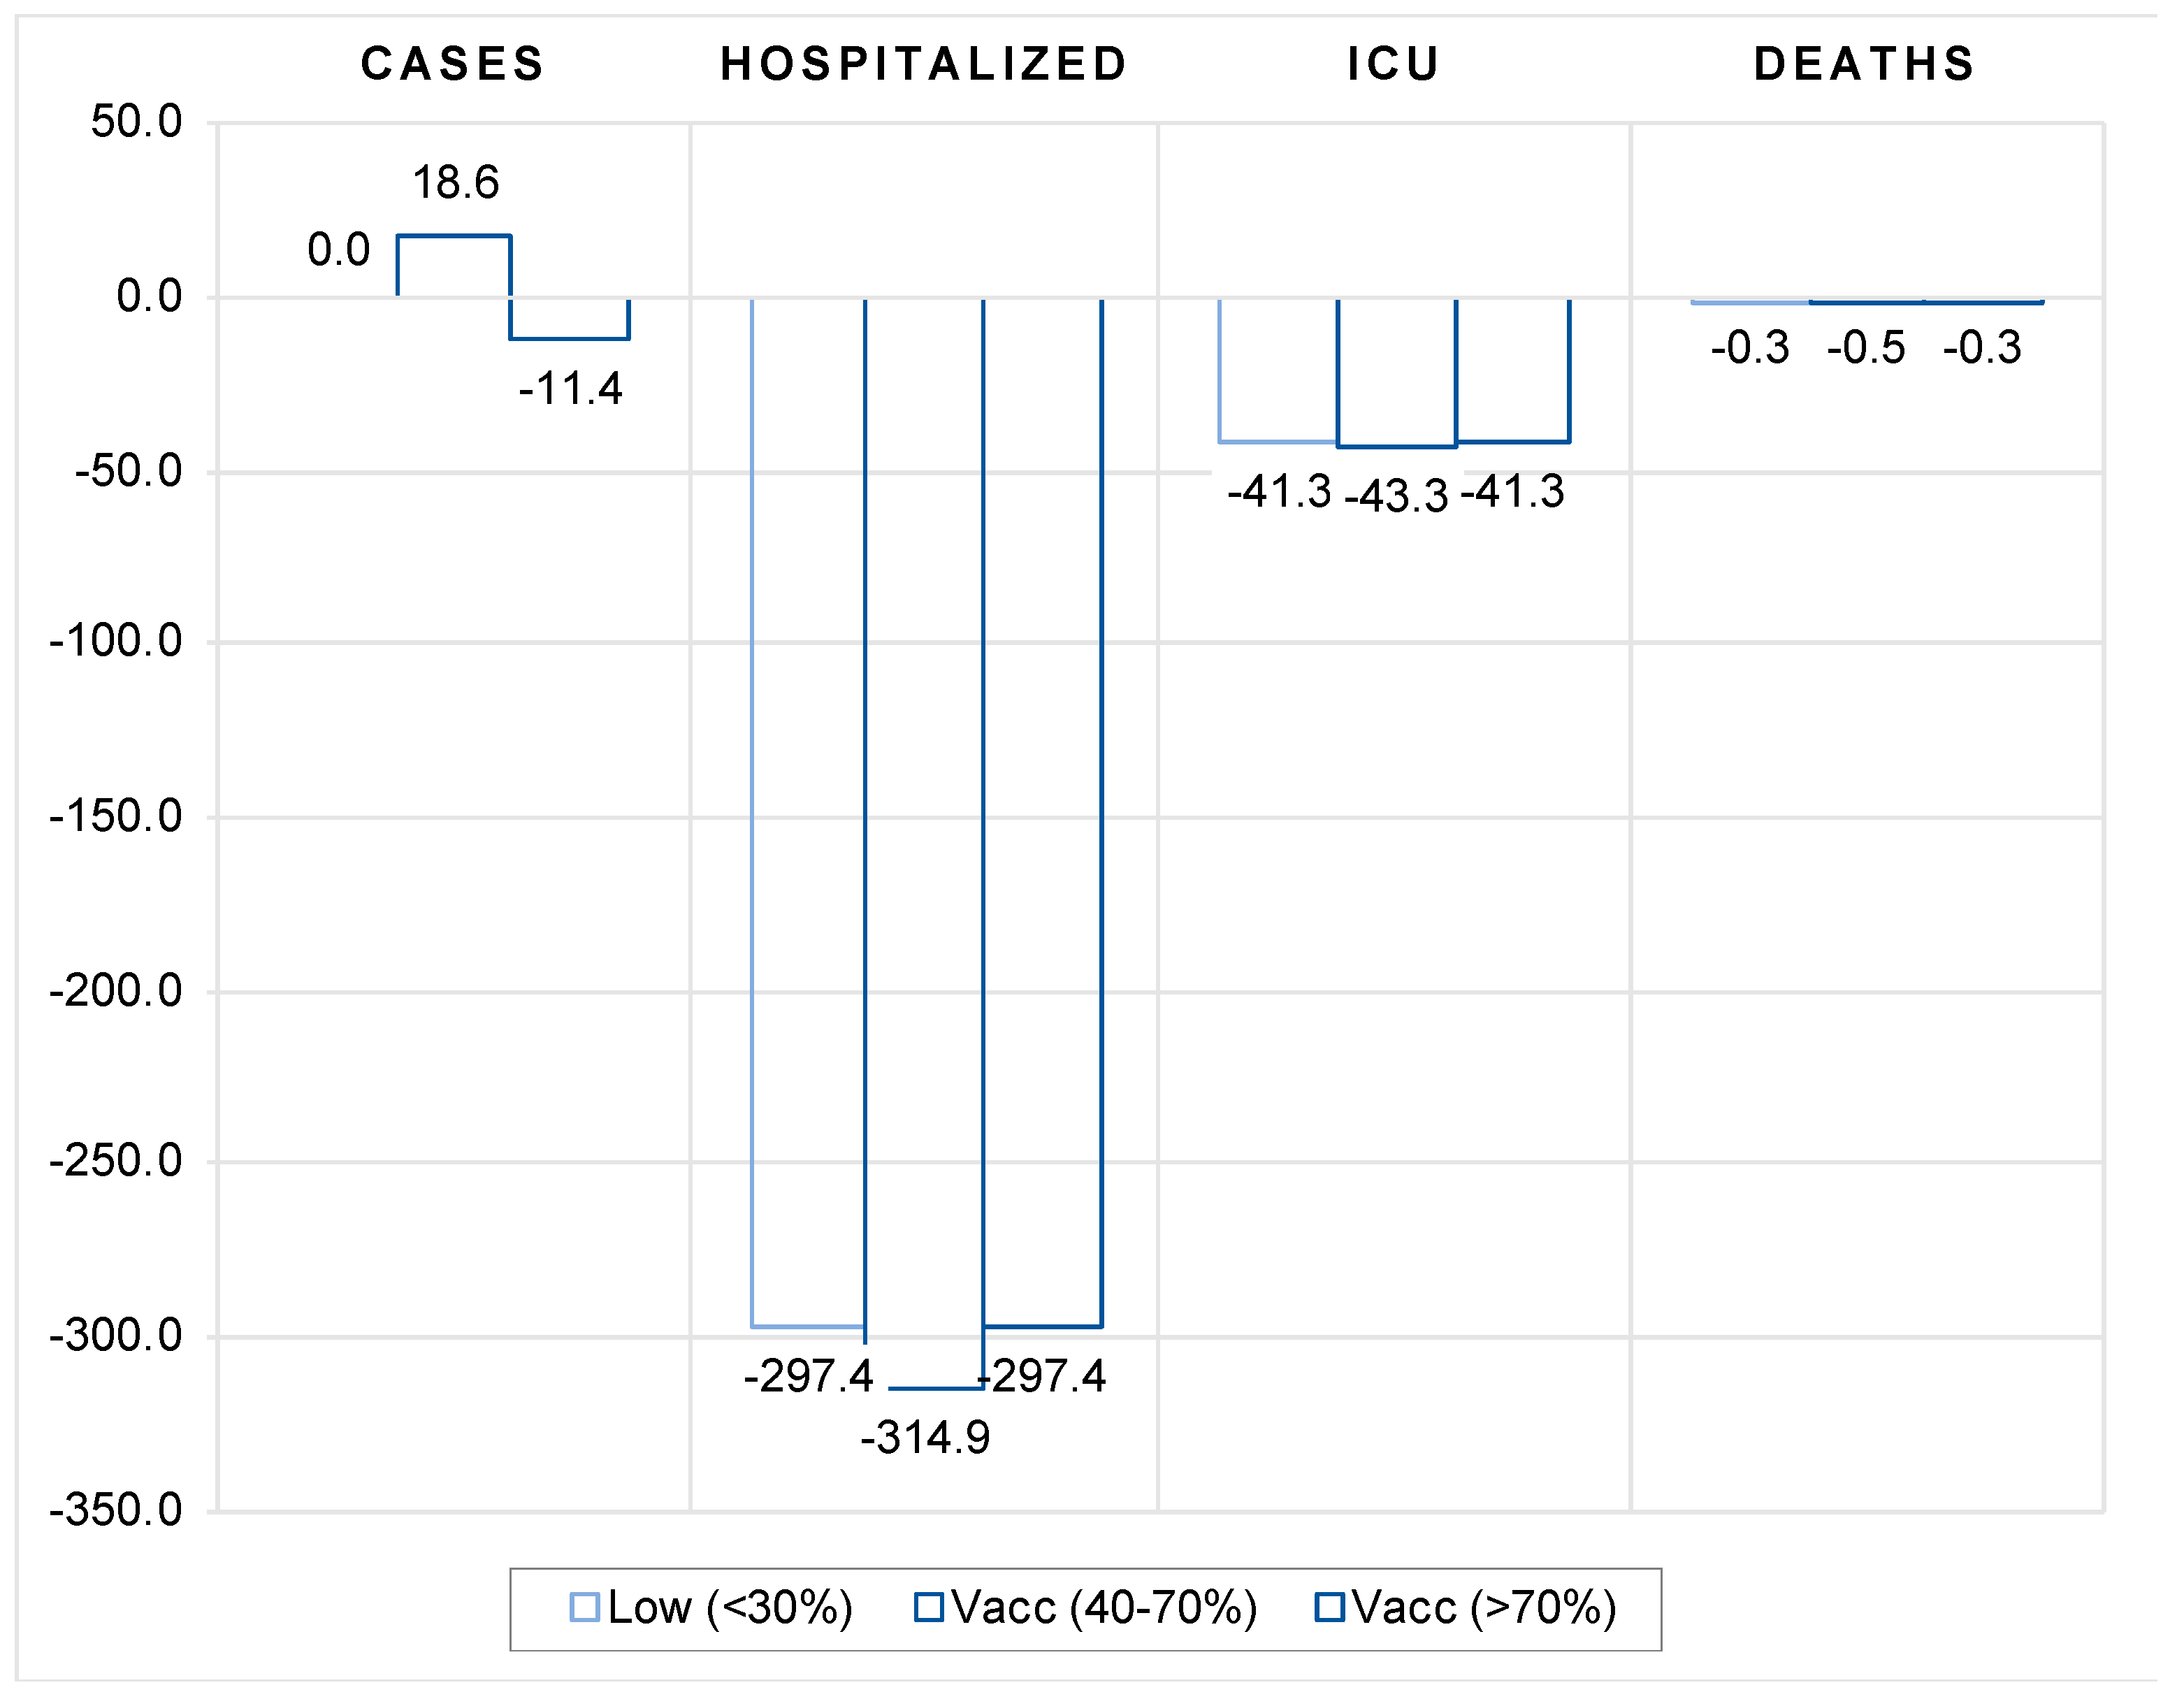
Finally, by comparing the data for the same period between 2020 and 2021, we also checked the viability of vaccination as a substitute for lockdowns or other, less stringent government protection measures. To do so, we tested whether the availability of vaccines has helped countries curb infections and cases of severe disease progression compared with the same period in the previous year when vaccines were not available. More specifically, we checked whether the dynamics of the COVID pandemic in the fall of 2021 as compared with the same period in 2020 was moderated in countries with high vaccination rate compared with countries with lower vaccination coverage. Our results suggest that vaccination does not appear to be an effective substitute for more stringent government safety measures to contain the spread of COVID infections until a certain vaccination coverage threshold has been achieved. The spread of infections is shown to be significantly reduced compared with the same period in 2020 only in countries with high vaccination coverage (more than 70 percent).
On the other hand, moderate vaccination coverage (between 40 and 70 percent) seems to be already a fairly effective tool and can serve in part as a substitute for more stringent government protective measures to reduce the pressure on the health care system. The availability and efficient rollout of vaccines allowed countries to adopt less stringent containment measures, which explains the favourable economic performance in the second half of 2021 despite the severe outbreak of the delta variant.
2. Study Design, Data and Methodology
2.1. Study Design
The primary goal of COVID vaccination is to protect people against the severe progression of the COVID disease and its public health consequences, i.e., to reduce the number of hospitalizations and the number of people in need of intensive care, and ultimately reduce the number of deaths due to COVID disease. However, the extent to which vaccines reduce transmission of COVID is key to containing the pandemic, which depends on the capacity of vaccines to protect against the spread of the virus. For this reason, we begin our research by first analyzing the impact of vaccination on the spread of new COVID cases and then proceed to study the effectiveness of vaccination in reducing hospitalizations, intensive care unit (ICU) admissions and deaths with COVID.
Studying the impact of vaccination on transmission of COVID in a cross-country setting requires careful consideration. Countries vary considerably in terms of the state of the COVID pandemic, vaccination uptake, policies to reduce transmission, age structure of population, the extent of diseases that increase the risk of developing severe COVID symptoms (such as the prevalence of diabetes and the prevalence and severity of cardiovascular disease, etc.), the availability of quality health care, etc. All these and a number of other factors affect the dynamics of COVID epidemics as well as their severity (see [
4,
8,
9]). It is therefore of utmost importance to control for all relevant factors, but also to capture their impact on the dynamics of COVID epidemics.
The analysis should also consider the timing of vaccination. First, immunity takes a while to build up. According to population-based evidence, (We consider the latest evidence from the United Kingdom compiled by the UK Health Security Agency and published in «COVID-19 vaccine surveillance report (week 45)» [
10]. In this report, vaccine effectiveness against symptomatic COVID-19 has been assessed in England based on community testing data linked to vaccination data from the National Immunisation Management System (NIMS), cohort studies such as the COVID Infection Survey and GP electronic health record data. The report focuses mostly on the Delta variant that has been a prevalent COVID-19 variant in the UK and other countries since the early summer of 2021) there is a lag of at least two weeks after the second dose before the vaccine becomes fully effective in protecting against symptomatic disease. One should also allow for additional lags to account for the lagged effects of vaccination on protection against more severe developments of COVID-19, such as an additional week for protection against hospitalization and an additional two to three weeks for protection against mortality. For this reason, in our study, we controlled for the lagged effects of full vaccination (defined by vaccination with two doses) by allowing for a two-to-four week lag after full vaccination in estimating the model of the effects of vaccination on the number of new COVID cases and a three-to-five week lag after full vaccination in estimating the model of the effects of vaccination on hospitalizations, intensive care admissions, and mortality.
There is some evidence of the waning of protection against infection and symptomatic disease over time [
11,
12]. Observed protection for the fully inoculated is shown to weaken after 15+ weeks since the second dose (to about 45 to 50 percent with AstraZeneca and 70 to 75% with Pfizer-BioNTech and Moderna vaccine). Protection against severe disease and mortality, however, is shown to remain high for at least five months after the second dose in most groups (at about 80 to 90 percent with AstraZeneca and 90 to 95% with Pfizer-BioNTech and Moderna vaccine, see [
10]). These waning effects of vaccination may not affect our results, as countries have built up substantial proportions of the fully vaccinated by early summer of 2021, while our data cover the period between August and November of 2021.
Our empirical model is designed to capture the differences across countries regarding the state of the pandemic (by including the initial level of infections per 1 million) and its dynamics (measured by the past week reproduction rate). In addition to differences in vaccination rates and their dynamics, our model also includes country-specific factors that account for differences between countries that determine countries’ pandemic performance.
To study the effectiveness of vaccination, we chose the period from 1 August 2021, onwards (the most recent data available was until 14 November 2021), as this is the period when the last wave (the Delta variant) of COVID infections reappeared in most countries and when countries had vaccines available. We collect data on the number of cases, deaths, hospitalized and intensive care patients, the percentage of people fully vaccinated, the reproduction rate, and the policy stringency index—all with daily frequency. The last day of the week (Sunday) was used as a reference day in the period capturing the average effect of the previous week. We combine these data with a number of country-specific indicators.
We first estimate our baseline models to test whether the dynamics of COVID epidemics are mitigated in countries with high vaccination coverage. In addition, we also estimate two alternative specifications to examine vaccination effectiveness from a different perspective. The first test examines whether there is a threshold for vaccination coverage above which vaccines are more effective in moderating the spread of infections and deaths. In the second test, we examine whether the availability of vaccines has helped countries curb the spread of infections and mitigate severe disease progression compared with the same period in the previous year when vaccines were not available. More specifically, we test whether the dynamics of COVID epidemics in the fall of 2021 is moderated in countries with high vaccination coverage compared with countries with low vaccination coverage as compared with the same week in 2020.
2.2. Methodology
Unlike observational longitudinal cohort studies, (see for example [
2]), we applied more rigorous statistical methods using the country-level data to study the effectiveness of vaccination levels across countries on the dynamics of the levels of new COVID cases, new hospitalizations, new ICU patients and new deaths with COVID. To this end, we designed two empirical models to be estimated using the detailed country-level data as specified in the next section.
The first model estimates the impact of vaccination levels on the spread of infections across countries after controlling for other factors. We estimated an exhaustive model that relates the number of new COVID cases to the initial number of COVID cases, the lagged average weekly reproduction rate, full vaccination rate, lagged by 2 to 4 weeks, and a number of country-specific indicators.
The following model was estimated:
where
is a dependent variable defined as an end-of-the-week 7-day moving average of the number of new COVID cases per million people in country
i and week
t (
t = 1,…, 16). Our main explanatory variable of interest is the vaccination rate,
, which is defined as end-of-the-week 7-day moving average full vaccination rate for each country lagged by the period
s (
s = 2, 3, 4). With two to four lags (weeks after full vaccination) we controlled for lagged effects of differences in the levels of vaccination between countries on mitigating the spread of infections. The vaccination variable is interacted with vector
D capturing regional dummy variables, with regions defined by continents (Europe, Asia, North America, South America, Oceania). The control group are African countries. By using these interaction terms, we checked for any significant differences in the effectiveness of vaccination rollout across continents.
refers to the initial number of new COVID cases defined as a 7-day average of the per-million number of COVID cases at the end of the first week in our data sample (t = 1). This variable controls for differences in the initial levels of infection between countries. is the end-of-the-week reproduction rate lagged by 1 week, which captures differences in the weekly dynamics of infections between countries. Vector captures all included country-specific indicators, such as a percentage of people aged 70+, life expectancy, population density, GDP per capita, stringency index, number of hospital beds per thousand, diabetes prevalence rate and cardiovascular death rate. Population density is an indicator of the number of potential contacts between people in different countries, while the percentage of people aged 70, life expectancy, diabetes prevalence, and cardiovascular mortality rates all account for the susceptibility of the population to the more severe consequences of COVID infections. The number of hospital beds per thousand is an indicator of the availability of quality health care infrastructure, while GDP per capita controls, among other things, for the ability of countries to effectively implement the vaccination campaign. The stringency index measures the stringency of government action to curb the spread of new infections.
Lastly, refers to time (week) fixed effects, while is the remaining i.i.d. error term.
The second model estimates the effectiveness of vaccination levels across countries in protecting against severe COVID disease and its consequences. In this model we related the number of either new hospitalizations, new ICU patients or new deaths with COVID to the lagged number of COVID cases, full vaccination rate, lagged by 3 to 5 weeks, and several country-specific indicators, such as a percentage of people aged 70+, life expectancy, population density, GDP per capita, stringency index, number of hospital beds per thousand, diabetes prevalence rate and cardiovascular death rate. The following model was estimated:
where
is a dependent variable defined interchangeably either in terms of new hospitalizations, new ICU patients or new deaths with COVID. It is defined as end-of-the-week 7-day moving average of the per-million number of new hospitalizations, new ICU patients or new deaths with COVID in country
i and week
t (
t = 1,…, 16). Our main explanatory variable, the vaccination rate
, is defined as end-of-the-week 7-day moving average full vaccination rate for each country lagged by the period
s (
s = 3, 4, 5). With three to five-week lags (weeks after full vaccination) we controlled for lagged effects of differences in the levels of vaccination between countries on protection against severe COVID disease. Similar to the first model, we interact the vaccination variable with a vector
D capturing regional dummy variables.
refers to the lagged number of new COVID cases defined as 7-day moving average of the per-million number of COVID cases at the end of the previous week. This variable controls for differences in the levels of infections between countries. Again, vector
captures all included country-specific indicators, such as a percentage of people aged 70+, life expectancy, population density, GDP per capita, stringency index, number of hospital beds per thousand, diabetes prevalence rate and cardiovascular death rate.
refers to time (week) fixed effects, while
is the remaining i.i.d. error term.
In both models, all variables are defined in logarithms, which allows all estimated coefficients to be interpreted as elasticities.
Both models were estimated using pooled ordinary least squares (OLS) estimator. Our data are structured as panel data with a cross-sectional (country) and time (week) dimension, which violates the assumption of independence of all observations and leads to the possibility that the error term is correlated with individual regressors in the model. In principle, this requires estimation using the panel data estimator, either with random effects (RE) or with fixed effects (FE). In this case, neither estimator is appropriate. Using the FE estimator would be preferable, but since we include country-specific variables at annual frequency, using the FE estimator would result in dropping all country-specific variables from the estimates. On the other hand, the RE estimator assumes there are unique, time-constant attributes of countries that are not correlated with the individual regressors, which is clearly not the case here. To address this issue, we therefore assumed that all country fixed effects are captured by the time-invariant country-specific variables included in the model. Moreover, as the theory suggests, pooled OLS including time fixed effects can be used to derive unbiased and consistent parameter estimates.
We first estimated our baseline models (1) and (2) and then provided several robustness checks to our baseline estimations.
2.3. Data Collection
We used COVID-19 data and other country-specific data collected by the Our World in Data. (
https://github.com/owid/covid-19-data/tree/master/public/data, accessed on 18 November 2021). The dataset included daily data on COVID-19 number of cases, deaths, hospitalizations and ICU patients, number of people fully vaccinated, reproduction rate and stringency index (The Oxford Coronavirus Government Response Tracker (OxCGRT) project calculated a Stringency Index, a composite measure of nine of the response metrics measuring strictness of government policies [
13]. For details see [
14]. These data were combined with several country-specific structural indicators reported at the annual level reflecting population size, age structure, state of the health system and income.
The COVID-related daily data was selected for the period 1 August to 14 November 2021 (The last available data at the time when this research was conducted.), and for the same period in 2020. This period in 2021 was deliberately chosen to study the effectiveness of vaccination during the period when the last wave of COVID infections hit most countries, while the same period in 2020 is used as control data for the period when COVID vaccines were not available. First, we calculated all COVID-related daily data per 1 million population and then calculated the 7-day moving average for each variable of number of cases, deaths, hospitalizations, and intensive care patients. Next, we kept only the data for every last day of the week (Sunday) i.e., the 7-day moving average data for the past week, effectively giving us up to 16 data points for most countries.
For the vaccination rate, COVID reproduction rate and stringency index, we used the data for the last day in the week in the same period. All other data in our empirical model are annual and therefore there is no variation during the study period.
Our final dataset consists of 110 countries for which data were available for all variables in our empirical model for at least 6 consecutive weeks. The only exemption were data for two dependent variables (number of hospitalized patients and number of ICU patients) for which data are available only for most of 15 European countries, United States, Canada and Israel. For these two dependent variables the model was estimated using the reduced sample, while for all other model specifications the full data sample for all countries is used. In its simplest form, our model was estimated at 1324 observations. However, the inclusion of up to 5 lags for some of the variables reduced the effective data sample to between 900 and 1100 observations. Summary statistics are presented in
Table A1 in the
Appendix A.
4. Conclusions
This study analyzed the impact of vaccination on the transmission of COVID and its public health consequences. To this purpose, we made use of large cross-country dataset for 110 countries to estimate two comprehensive models of the effects of inoculation—one for the impact on the spread of COVID infections and another for the impact on the frequency of severe COVID disease progression. In estimating the vaccines effectiveness, the models captured the differences across countries regarding the state of epidemics and its dynamics and country-specific factors. The latter account for differences between countries that determine countries’ specific vulnerabilities or strengths to perform worse or better during epidemics.
To examine the effectiveness of vaccination, we used daily COVID-related data (from Our World in Data) for the period from 1 August 2021 onwards, which captured both the last wave of COVID outbreak (the Delta variant) in most countries and the availability of vaccines.
Our results confirm that vaccines are reasonably effective in both limiting the spread of infections and containing more severe disease progression in symptomatic patients. Firstly, the results show that the vaccination rate (of fully inoculated individuals) is consistently negatively correlated with the number of new COVID cases, whereby a 10 percent increase in vaccination rate is associated with a 1.3 to 1.7 percent decrease in new COVID cases. Second, the estimates show that the magnitude of vaccination contributes significantly to moderating severe disease progression. On average, a 10 percent increase in the rate of vaccination leads to about a 5 percent reduction in the number of new hospitalizations, 12 percent decrease in the number of new intensive care patients and 2 percent reduction in the number of new deaths with COVID. While the effects increase with time since full vaccination, the overall vaccination effectiveness is also shown to vary widely from region to region. Third, the estimations show that the moderating effect of vaccines on the number of cases and deaths occurs when the total number of vaccinations is sufficiently high.
And finally, by comparing the data for the same period between 2020 and 2021, we also checked how viable vaccination is as a substitute for lockdowns or other less restrictive government measures against the spread of COVID. Our results suggest that vaccination does not appear to be an effective substitute for more restrictive government safety measures until a high vaccination coverage threshold (more than 70 percent) has been achieved. On the other hand, vaccination is shown to be moderately effective in limiting the more severe course of the disease in symptomatic patients already at moderate vaccination coverage (between 40 and 70 percent).
In conclusion, our results show that vaccines are quite effective in both limiting the spread of infection and containing a more severe course of disease in symptomatic patients. In this way, it can also help to reduce pressure on the health system and thus benefit the overall public health of society during such severe pandemics. In addition, high vaccination coverage has been shown to be a reasonably effective tool and may serve in part as a substitute for more stringent government protective measures. The availability and efficient dissemination of vaccines allowed countries to adopt less stringent containment measures that enabled economic recovery in the second half of 2021 despite the severe outbreak of delta variant.


