The Antioxidant Content of Coffee and Its In Vitro Activity as an Effect of Its Production Method and Roasting and Brewing Time


Abstract
1. Introduction
2. Materials and Methods
2.1. Chemicals
2.2. Coffee Bean Origin
2.3. Coffee Roasting
2.4. Polyphenol Analysis
2.5. Antioxidant Activity Analysis
2.6. Statistical Analysis
3. Results and Discussion
4. Conclusions
Supplementary Materials
Author Contributions
Funding
Acknowledgments
Conflicts of Interest
References
- Faostat Database. Available online: http://www.fao.org/faostat/en/#home (accessed on 15 March 2020).
- Cardoso, R.G.S.; Pedrosa, A.W.; Rodrigues, M.C.; Santos, R.H.S.; Martinez, H.E.P.; Cecon, P.R. Intercropping period between species of green manures and organically-fertilized coffee plantation. Coffee Sci. 2018, 13, 2–9. [Google Scholar] [CrossRef][Green Version]
- Ozuna, C.; Mulík, S.; Valdez-Rodríguez, B.; Abraham-Juárez, M.D.R.; Fernández-López, C.L. The effect of organic farming on total phenols, total flavonoids, brown compounds and antioxidant activity of spent coffee grounds from Mexico. Biol. Agric. Hortic. 2019, 1–12. [Google Scholar] [CrossRef]
- Król, K.; Gantner, M.; Tatarak, A.; Hallmann, E. The effect of roasting, storage, origin on the bioactive compounds in organic and conventional coffee (Caffea arabica). Eur. Food Res. Technol. 2019, 246, 33–39. [Google Scholar] [CrossRef]
- Zinoviadou, K.G.; Galanakis, C.M.; Brnčić, M.; Grimi, N.; Boussetta, N.; Mota, M.J.; Saraivae, J.A.; Patrasf, A.; Tiwari, B.; Barba, F.J. Fruit juice sonication: Implications on food safety and physicochemical and nutritional properties. Food Res. Int. 2015, 77, 743–752. [Google Scholar] [CrossRef]
- Barba, F.J.; Galanakis, C.M.; Esteve, M.J.; Frigola, A.; Vorobiev, E. Potential use of pulsed electric technologies and ultrasounds to improve the recovery of high-added value compounds from blackberries. J. Food Eng. 2015, 167, 38–44. [Google Scholar] [CrossRef]
- Galanakis, C.M. Emerging technologies for the production of nutraceuticals from agricultural by-products: A viewpoint of opportunities and challenges. Food Bioprod. Process. 2013, 91, 575–579. [Google Scholar] [CrossRef]
- Ullah, R.; Ahmad, S.; Atiq, A.; Hussain, H.; Ur Rehman, N.; Abd Elsalam, N.; Adnan, M. Quantification and antibacterial activity of flavonoids in coffee samples. AJTCAM 2015, 12, 84–86. [Google Scholar] [CrossRef]
- Lee, M.; McGeer, E.G.; McGeer, P.L. Quercetin, not caffeine, is a major neuroprotective component in coffee. Neurobiol. Aging 2016, 46, 113–123. [Google Scholar] [CrossRef]
- Niseteo, T.; Komes, D.; Belščak-Cvitanović, A.; Horžić, D.; Budeč, M. Bioactive composition and antioxidant potential of different commonly consumed coffee brews affected by their preparation technique and milk addition. Food Chem. 2012, 134, 1870–1877. [Google Scholar] [CrossRef]
- Soares, P.V.; Kannen, V.; Jordão Junior, A.A.; Garcia, S.B. Coffee, but neither decaffeinated coffee nor caffeine, elicits chemoprotection against a direct carcinogen in the colon of Wistar rats. Nutr. Cancer 2018, 1–9. [Google Scholar] [CrossRef]
- Çelik, E.E.; Gökmen, V.A. Study on interactions between the insoluble fractions of different coffee infusions and major cocoa free antioxidants and different coffee infusions and dark chocolate. Food Chem. 2018, 255, 8–14. [Google Scholar] [CrossRef] [PubMed]
- Chen, X.-M.; Ma, Z.; Kitts, D.D. Effects of processing method and age of leaves on phytochemical profiles and bioactivity of coffee leaves. Food Chem. 2018, 249, 143–153. [Google Scholar] [CrossRef] [PubMed]
- Mojica, B.E.; Fong, L.E.; Biju, D.; Muharram, A.; Davis, I.M.; Vela, K.O.; Rios, D.; Osorio-Camacena, E.; Kaur, B.; Rojas, S.M.; et al. The Impact of the roast levels of coffee extracts on their potential anticancer activities. J. Food Sci. 2018, 83, 1125–1130. [Google Scholar] [CrossRef] [PubMed]
- Gökcen, B.B.; Şanlier, N. Coffee consumption and disease correlations. Crit. Rev. Food Sci. Nutr. 2017, 1–13. [Google Scholar] [CrossRef]
- Pimentel, G.D.; Micheletti, T.O.; Fernandes, R.C.; Nehlig, A. Coffee Intake and obesity. In Nutrition in the Prevention and Treatment of Abdominal Obesity; Academic Press: Cambridge, MA, USA, 2017; pp. 329–351. [Google Scholar]
- Hu, Y.; Ding, M.; Yuan, C.; Wu, K.; Smith-Warner, S.A.; Hu, F.B.; Chan, A.T.; Meyerhardt, J.A.; Ogino, S.; Fuchs, C.S.; et al. Association between coffee intake after diagnosis of colorectal cancer and reduced mortality. Gastroenterology 2018, 154, 916–926. [Google Scholar] [CrossRef]
- Xu, D.; Deng, Y.; Han, T.; Jiang, L.; Xi, P.; Wang, Q.; Jiang, Z.; Gao, L. In Vitro and In Vivo effectiveness of phenolic compounds for the control of postharvest gray mold of table grapes. Postharvest Biol. Technol. 2018, 139, 106–114. [Google Scholar] [CrossRef]
- Sanzani, S.M.; Schena, L.; Ippolito, A. Effectiveness of phenolic compounds against citrus green mould. Molecules 2014, 19, 12500–12508. [Google Scholar] [CrossRef]
- Średnicka-Tober, D.; Ponder, A.; Hallmann, E.; Głowacka, A.; Rozpara, E. The profile and content of polyphenols and carotenoids in local and commercial sweet cherry fruits (Prunus avium L.) and their antioxidant activity In Vitro. Antioxidants 2019, 8, 534. [Google Scholar] [CrossRef]
- Gonthier, D.J.; Witter, J.D.; Spongberg, A.L.; Philpott, S.M. Effect of nitrogen fertilization on caffeine production in coffee (Coffea arabica). Chemoecology 2011, 21, 123–130. [Google Scholar] [CrossRef]
- Heimler, D.; Romani, A.; Ieri, F. Plant polyphenol content, soil fertilization and agricultural management: A review. Eur. Food Res. Technol. 2017, 243, 1107–1115. [Google Scholar] [CrossRef]
- Hallmann, E.; Kazimierczak, R.; Marszałek, K.; Drela, N.; Kiernozek, E.; Toomik, P.; Matt, D.; Luik, A.; Rembiałkowska, E. The nutritive value of organic and conventional white cabbage (Brassica oleracea L. var. capitata) and anti-apoptotic activity in gastric adenocarcinoma cells of sauerkraut juice produced therof. J. Agric. Food Chem. 2017, 65, 8171–8183. [Google Scholar] [CrossRef] [PubMed]
- Fibrianto, K.; Umam, K.; Wulandari, E.S. Effect of roasting profiles and brewing methods on the characteristics of bali kintamani coffee. Adv. Eng. Res. 2017, 172, 194–197. [Google Scholar]
- Głowacka, R.; Górska, A.; Wirkowska-Wojdyła, M.; Wołosiak, R.; Majewska, E.; Derewiaka, D. The influence of brewing method on bioactive compounds residues in spent coffee grounds of different roasting degree and geographical origin. Int. J. Food Sci. Technol. 2017, 54, 3008–3014. [Google Scholar] [CrossRef]
- Shishikura, Y.; Khokhar, S. Factors affecting the levels of catechins and caffeine in tea beverage: Estimated daily intakes and antioxidant activity. J. Sci. Food Agric. 2005, 85, 2125–2133. [Google Scholar] [CrossRef]
- Ranilla, L.G.; Kwon, Y.I.; Apostolidis, E.; Shetty, K. Phenolic compounds, antioxidant activity and In Vitro inhibitory potential against key enzymes relevant for hyperglycemia and hypertension of commonly used medicinal plants, herbs and spices in Latin America. Bioresour. Technol. 2010, 101, 4676–4689. [Google Scholar] [CrossRef]
- Young, J.E.; Zhao, X.; Carey, E.E.; Welti, R.; Yang, S.-S.; Wang, W. Phytochemical phenolics in organically grown vegetables. Mol. Nutr. Food Res. 2005, 49, 1136–1142. [Google Scholar] [CrossRef]
- Bursać Kovačević, D.; Barba, F.J.; Granato, D.; Galanakis, C.M.; Herceg, Z.; Dragović-Uzelac, V.; Putnik, P. Pressurized hot water extraction (PHWE) for the green recovery of bioactive compounds and steviol glycosides from Stevia rebaudiana Bertoni leaves. Food Chem. 2018, 254, 150–157. [Google Scholar] [CrossRef]
- Galanakis, C.M. Phenols recovered from olive mill wastewater as additives in meat products. Trends Food Sci. Technol. 2018, 79, 98–105. [Google Scholar] [CrossRef]
- Galanakis, C.M.; Tsatalas, P.; Galanakis, I.M. Implementation of phenols recovered from olive mill wastewater as UV booster in cosmetics. Ind. Crop. Prod. 2018, 111, 30–37. [Google Scholar] [CrossRef]
- D’Amelio, N.; Fontanive, L.; Uggeri, F.; Suggi-Liverani, F.; Navarini, L. NMR reinvestigation of the caffeine–chlorogenate complex in aqueous solution and in coffee brews. Food Biophys. 2009, 4, 321–330. [Google Scholar] [CrossRef]
- Alemu, K.; Adugna, G.; Lemessa, F.; Muleta, D. Induction of systemic resistance in Arabica coffee (Coffea arabica L.) against coffee berry disease (Colletotrichum kahawae Waller & Bridge) mediated through plant defense activator. Int. J. Pest Manag. 2018, 65, 313–323. [Google Scholar]
- Pelvan, E.; Olgun, E.Ö.; Karadağ, A.; Alasalvar, C. Phenolic profiles and antioxidant activity of Turkish Tombul hazelnut samples (natural, roasted, and roasted hazelnut skin). Food Chem. 2018, 244, 102–108. [Google Scholar] [CrossRef] [PubMed]
- Fernando, C.D.; Soysa, P. Extraction Kinetics of phytochemicals and antioxidant activity during black tea (Camellia sinensis L.) brewing. Nutr. J. 2015, 14, 74. [Google Scholar] [CrossRef] [PubMed]
- Rohn, S.; Buchner, N.; Driemel, G.; Rauser, M.; Kroh, L.W. Thermal degradation of onion quercetin glucosides under roasting conditions. J. Agric. Food Chem. 2007, 55, 1568–1573. [Google Scholar] [CrossRef] [PubMed]
- Mahapatra, A.K.; Sahoo, P.; Goswami, S.; Fun, H.-K.; Yeap, C.S. First artificial acidic fluorescent receptors for caffeine and other xanthine alkaloids. J. Incl. Phenom. Macrocycl. 2009, 67, 99–108. [Google Scholar] [CrossRef]


| Roasting Day | 23 of November 2019 | 23 of November 2019 | ||
|---|---|---|---|---|
| Coffee Type | Conventional Coffee | Organic Coffee | ||
| Light roasting | Weight of green coffee: | 200 g | Weight of green coffee: | 165 g |
| Roaster temperature: | 186.5 °C | Roaster temperature: | 186.5 °C | |
| First crack | 6:40 min. | First crack | 4:40 min | |
| Roasting time | 7:15 min. | Roasting time | 6:40 min | |
| Coffee weight after roasting: | 177.7 g | Coffee weight after roasting: | 145.3 g | |
| Coffee weight lost | 22.3 g | Coffee weight lost | 19.7 g | |
| Roasting process efficiency | 88.85% | Roasting process efficiency | 88.06% | |
| Medium roasting | Weight of green coffee: | 200 g | Weight of green coffee: | 165 g |
| Roaster temperature: | 186.5 °C | Roaster temperature: | 186.5 °C | |
| First crack | 6:20 min | First crack | 5:05 min | |
| Roasting time | 8:25 min | Roasting time | 7:55 min | |
| Coffee weight after roasting: | 175.0 g | Coffee weight after roasting: | 141.9 g | |
| Coffee weight lost | 25 g | Coffee weight lost | 23.1 g | |
| Roasting process efficiency | 87.50% | Roasting process efficiency | 86.00% | |
| Dark roasting | Weight of green coffee: | 200 g | Weight of green coffee: | 165 g |
| Roaster temperature: | 186.5 °C | Roaster temperature: | 186.5 °C | |
| First crack | 6:05 min | First crack | 5:10 min | |
| Roasting time | 14:02 min | Roasting time | 13:46 min | |
| Coffee weight after roasting: | 162.3 g | Coffee weight after roasting: | 135.2 g | |
| Coffee weight lost | 37.7 g | Coffee weight lost | 29.8 g | |
| Roasting process efficiency | 81.15% | Roasting process efficiency | 81.93% | |
| Compounds/Combination | Coffee Origin | Coffee Roasting | Coffee Brewing | p-Value | ||||||
|---|---|---|---|---|---|---|---|---|---|---|
| Organic Coffee | Conventional Coffee | Light | Medium | Dark | 3 Min | 6 Min | Origin | Roasting | Brewing | |
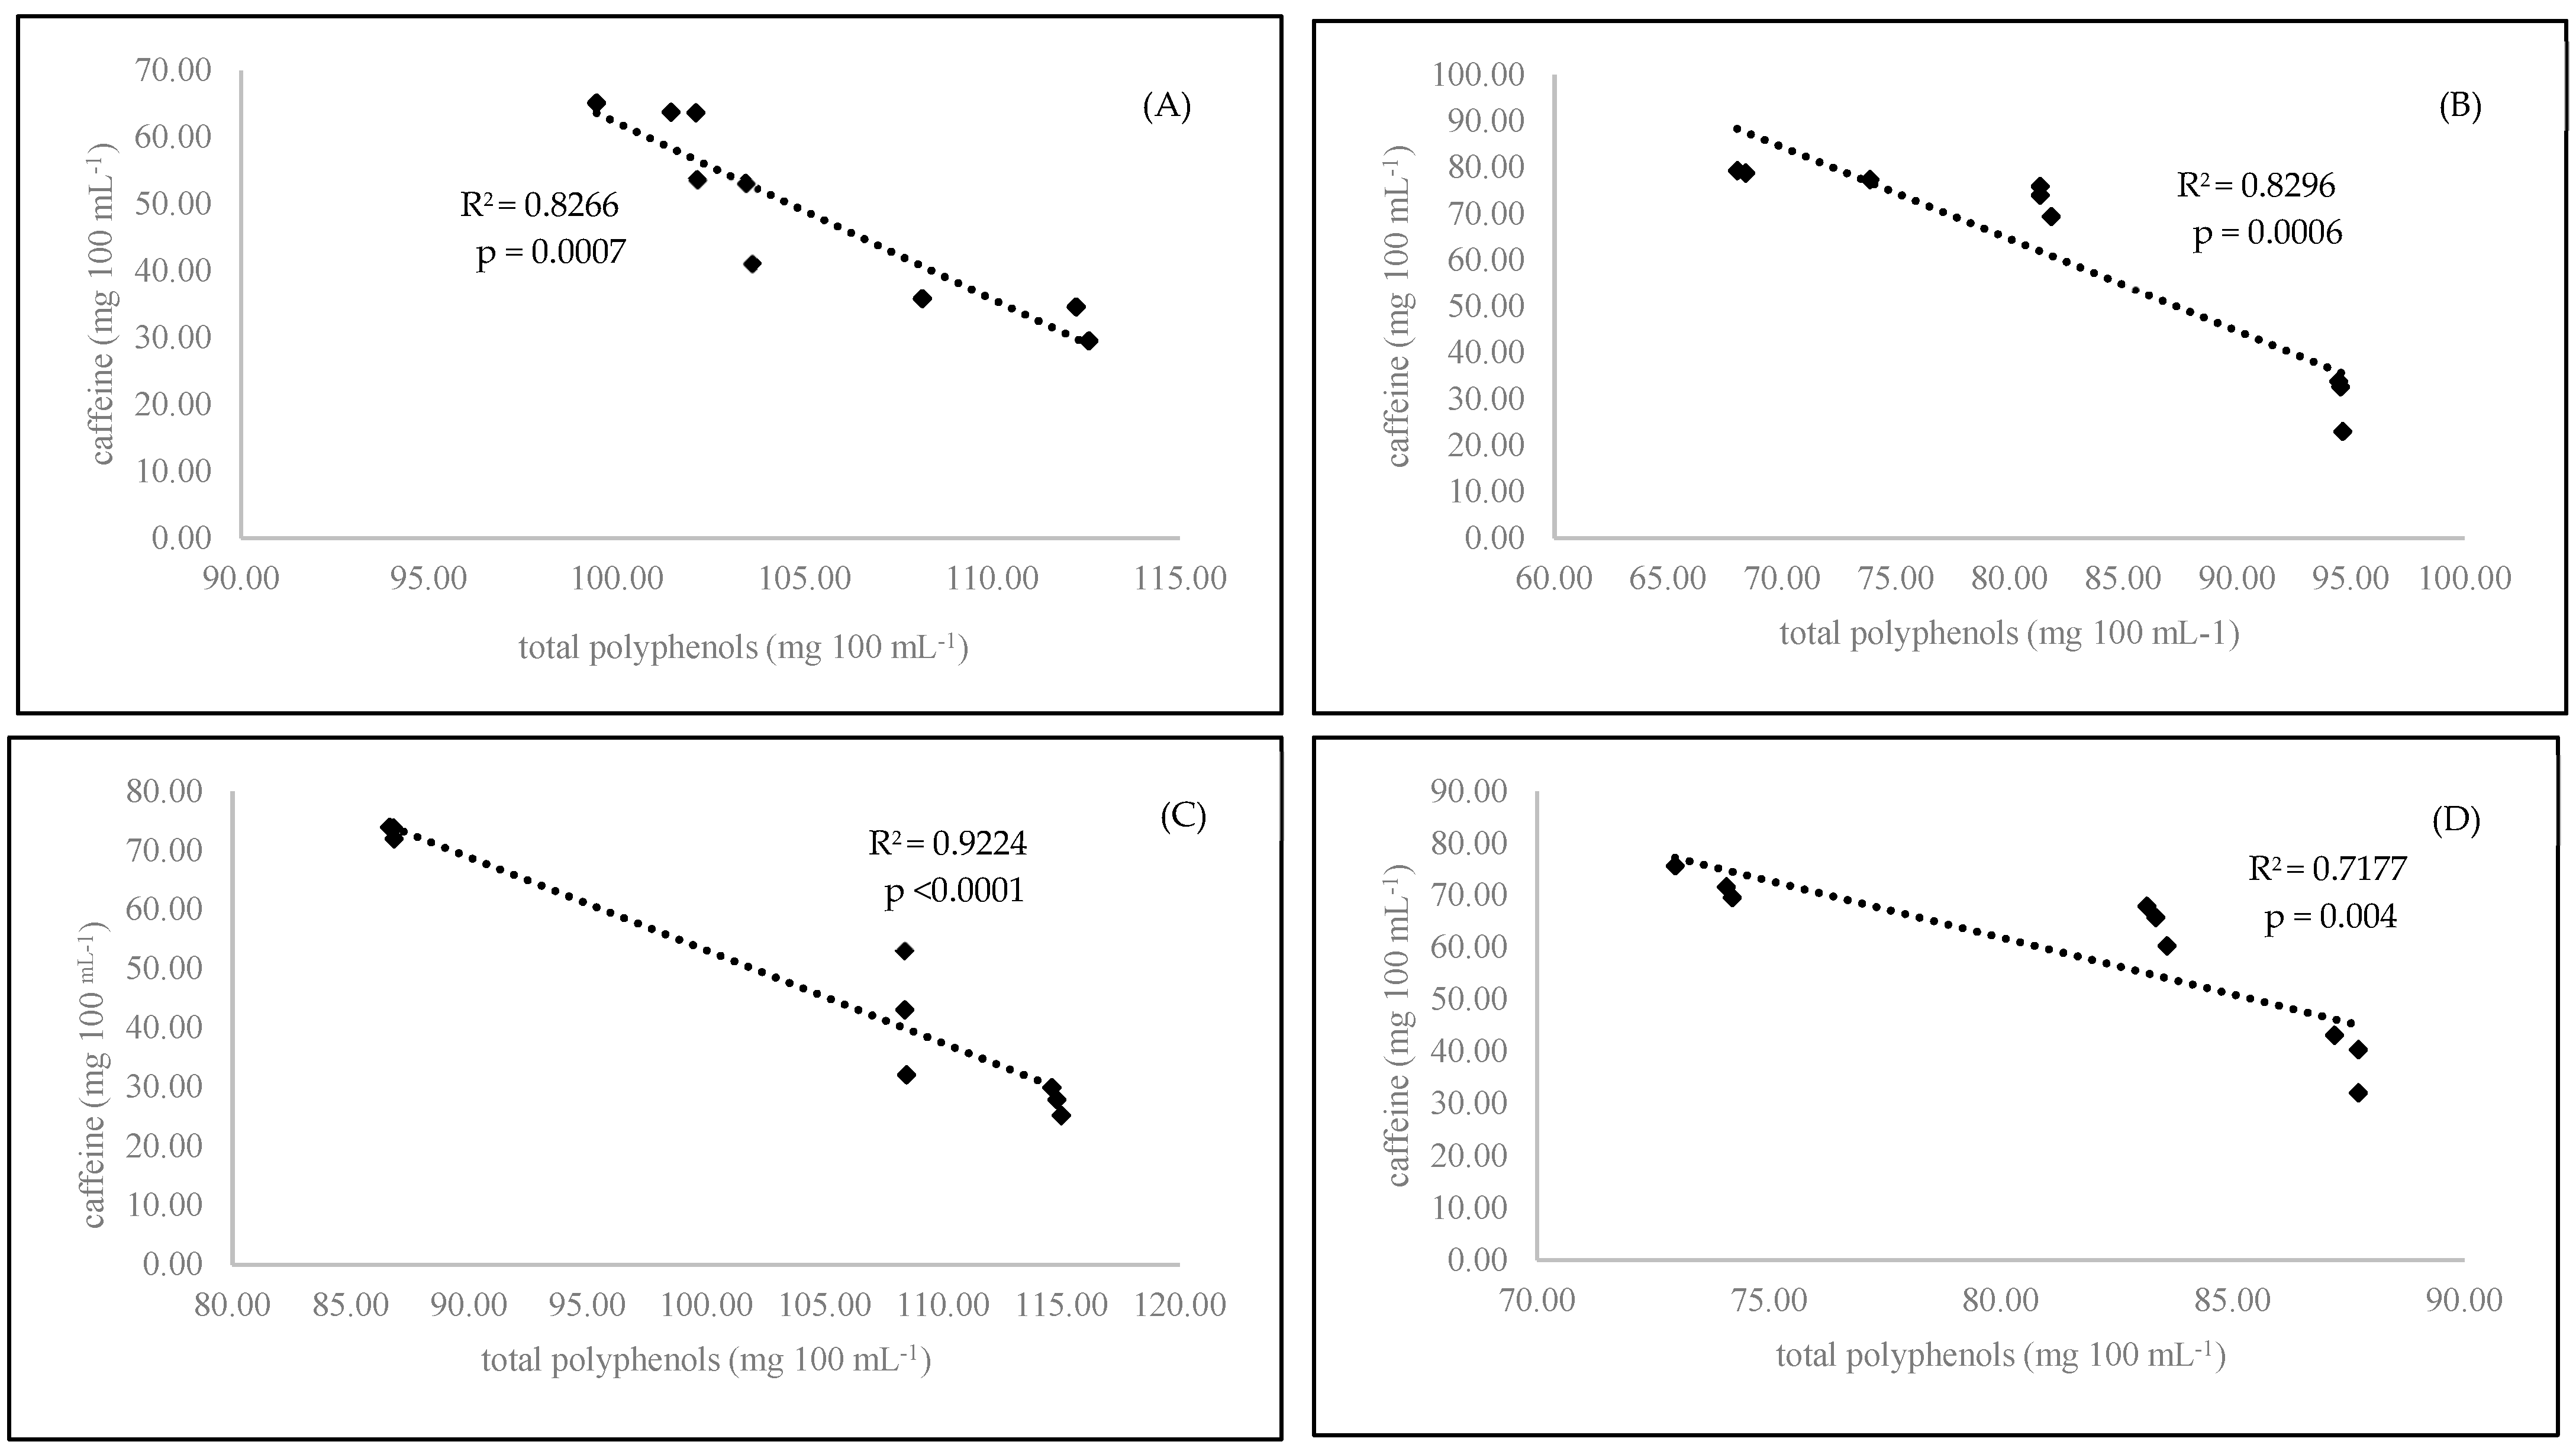
| caffeine | 48.10 ± 3.95b | 57.95 ± 5.39a | 72.96 ± 1.57a | 58.25 ± 3.75b | 27.87 ± 1.43c | 54.76 ± 4.49a | 51.29 ± 5.19b | <0.0001 | <0.0001 | 0.0022 |
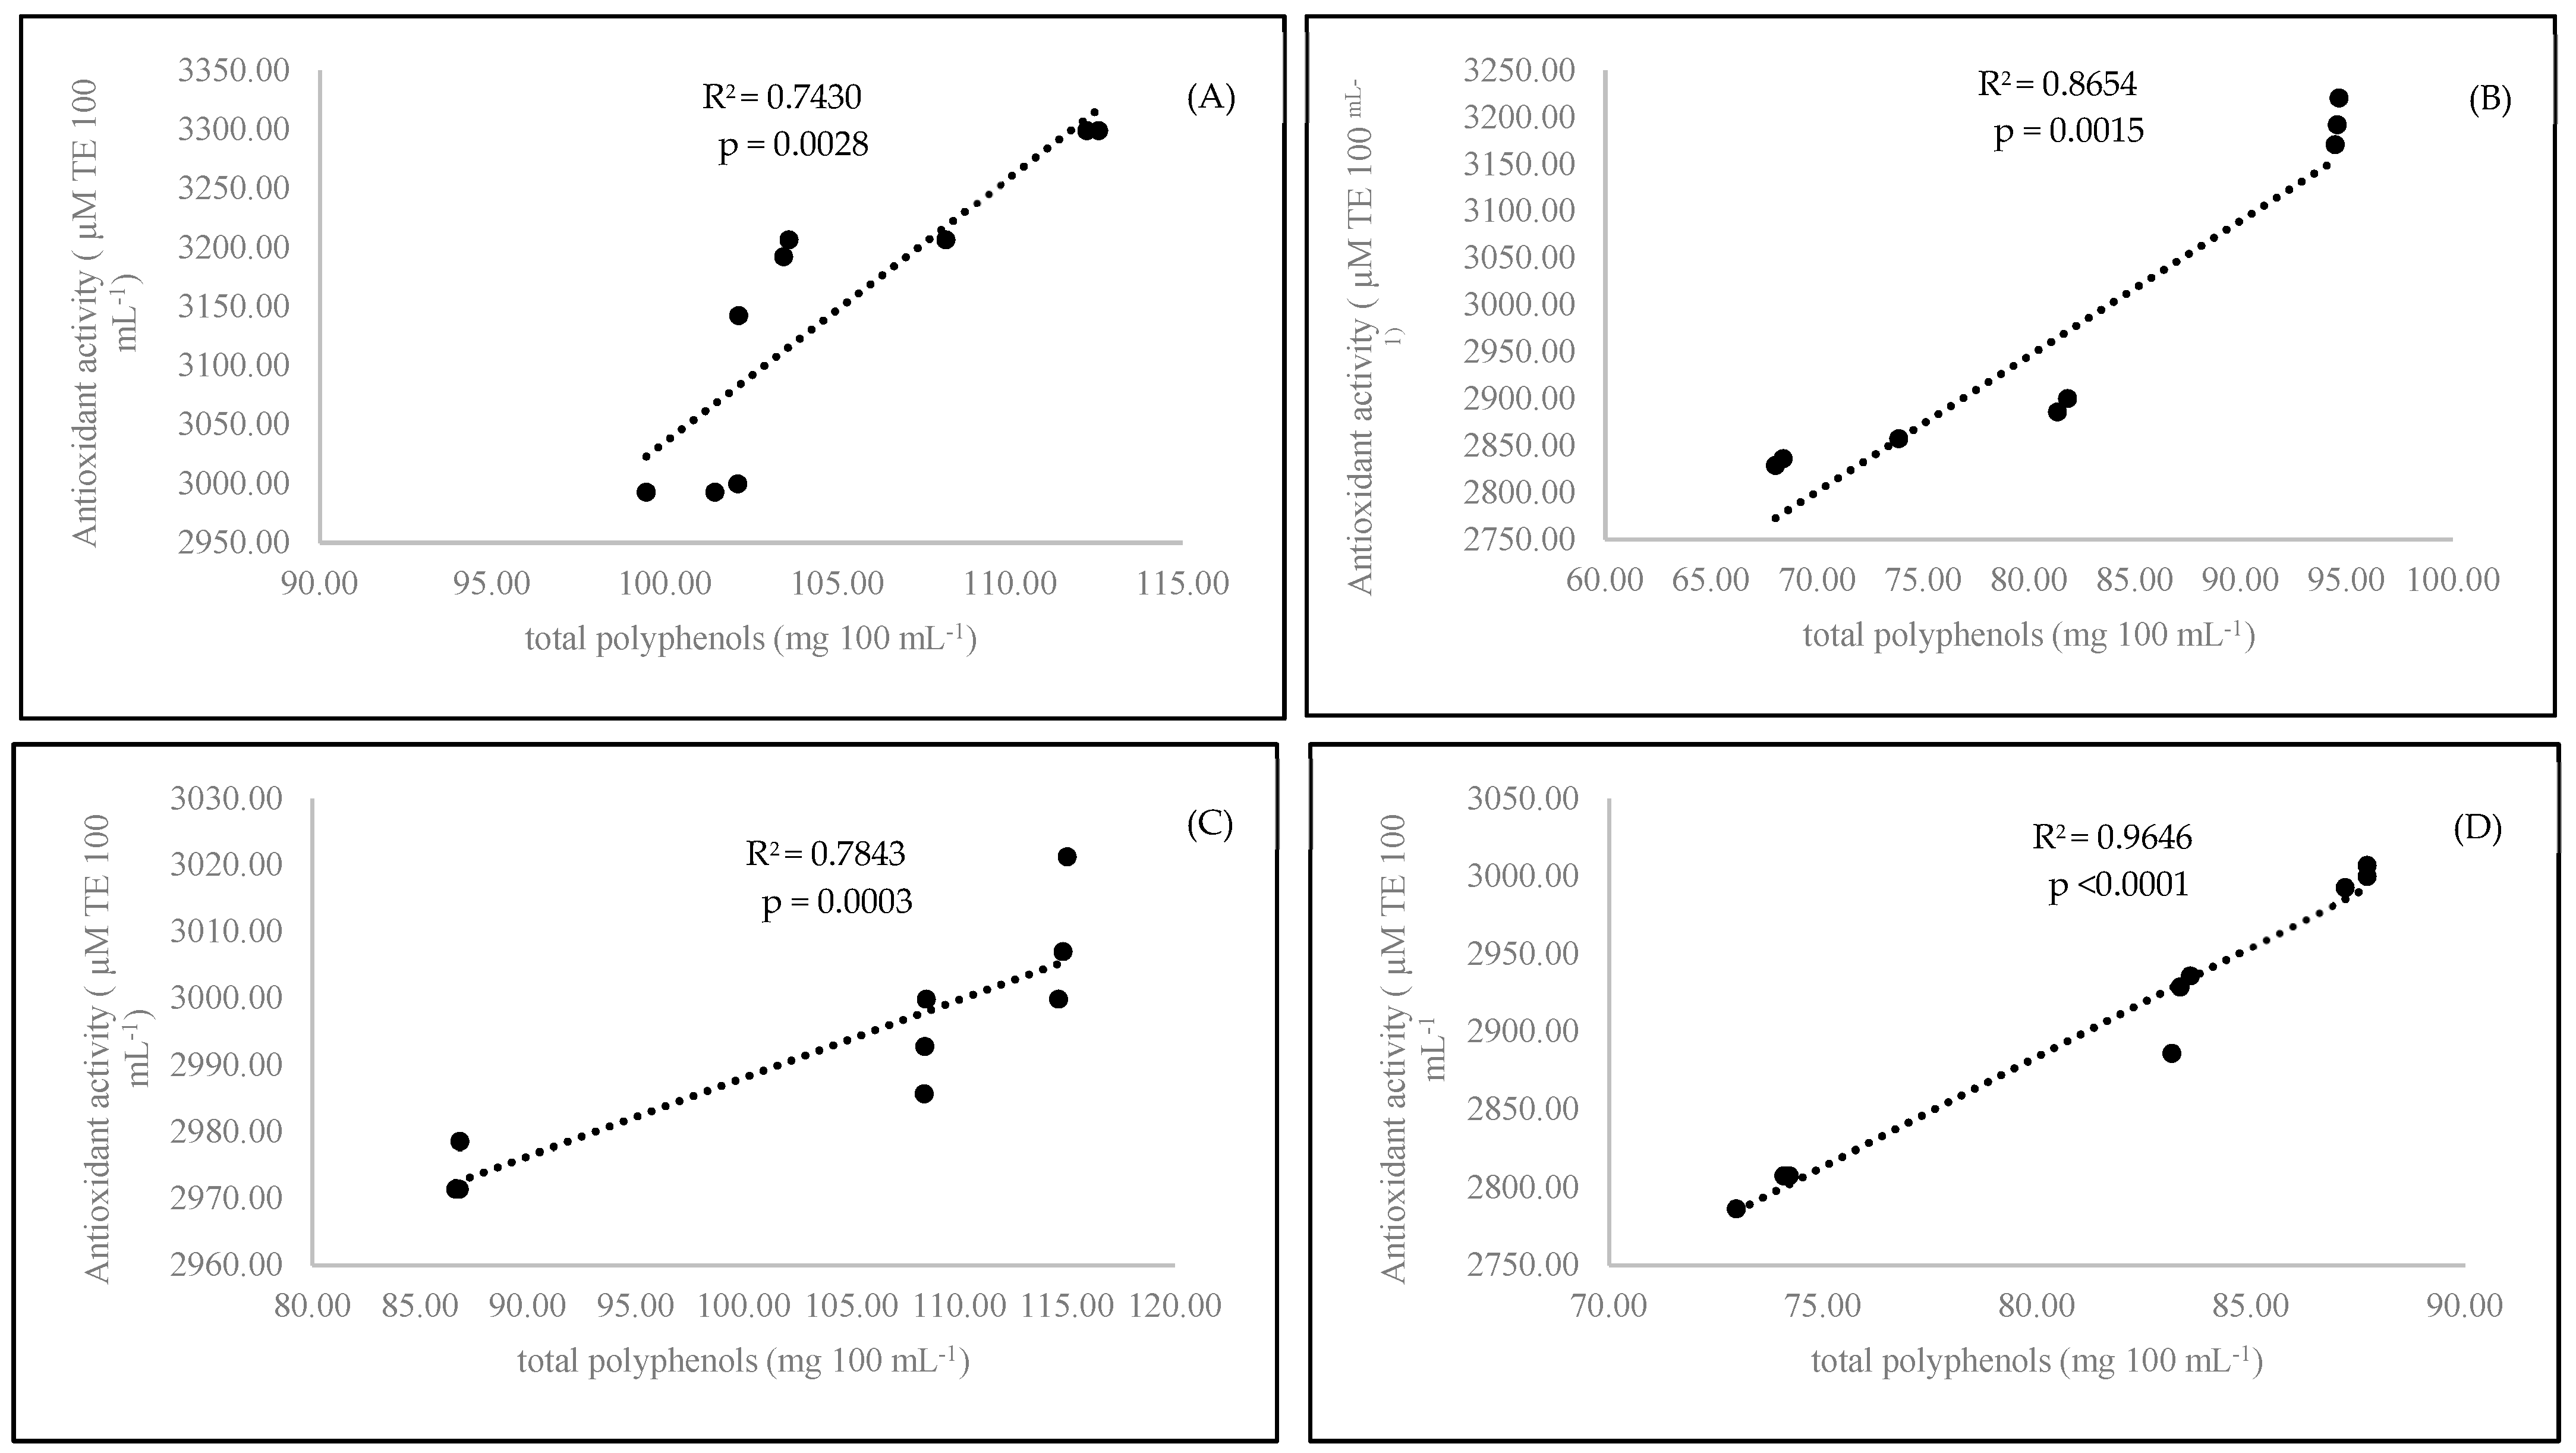
| total polyphenols | 104.18 ± 2.15a | 81.80 ± 1.94b | 88.54 ± 4.87b | 98.71 ± 4.17a | 91.71 ± 2.12a | 93.54 ± 3.28a | 92.44 ± 3.39b | <0.0001 | <0.0001 | 0.0026 |
| total phenolic acids | 97.51 ± 2.17a | 75.16 ± 2.39b | 79.97±5.12c | 92.42 ± 4.11a | 86.62 ± 2.25b | 87.07 ± 3.52a | 85.60 ± 3.44b | <0.0001 | <0.0001 | 0.044 |
| gallic acid | 8.92 ± 0.53b | 9.07 ± 0.23a | 7.00 ± 0.37c | 9.42 ± 0.27b | 10.57 ± 0.04a | 9.09 ± 0.39a | 8.91 ± 0.43b | 0.003 | <0.0001 | 0.0001 |
| chlorogenic acid | 54.09 ± 5.45a | 36.94 ± 3.38b | 59.37 ± 5.06a | 56.21 ± 2.19a | 20.96 ± 2.20b | 45.79 ± 3.93a | 45.24 ± 5.82a | <0.0001 | <0.0001 | N.S. |
| caffeic acid | 30.49 ± 3.58a | 25.62 ± 4.40b | 11.22 ± 0.38c | 22.30 ± 2.21b | 50.64 ± 0.38a | 28.37 ± 3.98a | 27.74 ± 4.13a | <0.0001 | <0.0001 | N.S. |
| salicylic acid | 3.99 ± 0.25a | 3.54±0.25b | 2.37 ± 0.07b | 4.48 ± 0.09a | 4.44 ± 0.20a | 3.82 ± 0.26a | 3.71 ± 0.25b | <0.0001 | <0.0001 | 0.0039 |
| total flavonoids | 6.67 ± 0.25a | 6.63 ± 0.49a | 8.58 ± 0.25a | 6.30 ± 0.06b | 5.09 ± 0.32c | 6.46 ± 0.43b | 6.84 ± 0.34a | N.S. | <0.0001 | <0.0001 |
| epigallocatechin | 0.728 ± 0.02a | 0.717 ± 0.03b | 0.680 ± 0.01b | 0.861 ± 0.01a | 0.628 ± 0.01b | 0.699 ± 0.02b | 0.747 ± 0.02a | 0.006 | <0.0001 | <0.0001 |
| quercetin-3-O-rutinoside | 0.93 ± 0.10b | 1.06 ± 0.14a | 1.53 ± 0.08a | 1.11 ± 0.02a | 0.34 ± 0.01b | 0.99 ± 0.13a | 1.00 ± 0.12a | <0.0001 | <0.0001 | N.S. |
| kaempferol-3-O-glucoside | 0.980 ± 0.18a | 0.959 ± 0.23b | 1.803 ± 0.16a | 0.332 ± 0.02c | 0.772 ± 0.27b | 0.793 ± 0.18b | 1.146 ± 0.22a | 0.0113 | <0.0001 | <0.0001 |
| quercetin | 0.87 ± 0.02a | 0.86 ± 0.02b | 0.86 ± 0.02b | 0.80 ± 0.01b | 0.94 ± 0.02a | 0.87 ± 0.02a | 0.86 ± 0.02a | 0.044 | <0.0001 | N.S. |
| quercetin-3-O-glucoside | 2.20 ± 0.09b | 2.28 ± 0.16a | 2.88 ± 0.08a | 2.19 ± 0.04a | 1.64 ± 0.06b | 2.26 ± 0.15a | 2.22 ± 0.11a | 0.0001 | <0.0001 | N.S. |
| kaempferol | 0.96 ± 0.04a | 0.76 ± 0.01b | 0.82 ± 0.02b | 1.00 ± 0.05a | 0.77 ± 0.02b | 0.85 ± 0.04b | 0.87 ± 0.04a | <0.0001 | <0.0001 | 0.005 |
| antioxidant activity | 3069.93 ± 27.0a | 2940.54 ± 30.7b | 3022.45 ± 30.3a | 3036.69 ± 39.1a | 2956.57 ± 45.4b | 3061.62 ± 38.5a | 2948.85 ± 17.4b | <0.0001 | <0.0001 | <0.0001 |
© 2020 by the authors. Licensee MDPI, Basel, Switzerland. This article is an open access article distributed under the terms and conditions of the Creative Commons Attribution (CC BY) license (http://creativecommons.org/licenses/by/4.0/).
Share and Cite
Górecki, M.; Hallmann, E. The Antioxidant Content of Coffee and Its In Vitro Activity as an Effect of Its Production Method and Roasting and Brewing Time. Antioxidants 2020, 9, 308. https://doi.org/10.3390/antiox9040308
Górecki M, Hallmann E. The Antioxidant Content of Coffee and Its In Vitro Activity as an Effect of Its Production Method and Roasting and Brewing Time. Antioxidants. 2020; 9(4):308. https://doi.org/10.3390/antiox9040308
Chicago/Turabian StyleGórecki, Maciej, and Ewelina Hallmann. 2020. "The Antioxidant Content of Coffee and Its In Vitro Activity as an Effect of Its Production Method and Roasting and Brewing Time" Antioxidants 9, no. 4: 308. https://doi.org/10.3390/antiox9040308
APA StyleGórecki, M., & Hallmann, E. (2020). The Antioxidant Content of Coffee and Its In Vitro Activity as an Effect of Its Production Method and Roasting and Brewing Time. Antioxidants, 9(4), 308. https://doi.org/10.3390/antiox9040308