1. Introduction
The genus
Epilobium (
Onagraceae) is distributed worldwide, consisting of over 200 species. Plants belonging to the
Epilobium genus are erect perennial herbs, often flowering in the first year. Two monophyletic sister genera within
Epilobium-Chamerion are characterized and the authentication requires a combination of morphological analysis (raphides and trichomes) and TLC [
1,
2]. Due to frequent interspecific hybridization and similarities between species, taxonomic classification of species belonging to the
Epilobium genus is considered difficult [
2]. Two of the main macroscopic morphological criteria for identification of
Epilobium species are the height of the stem and the flower symmetry: actinomorphic for species with medium-sized flowers and stems up to 200 cm, as for
E. hirsutum L., or small flowers with shorter stems, such as
E. parviflorum Schreb. (stems up to 75 cm) and
E. palustre L. (stems 5–70 cm), and weakly zygomorphic for species such as
E. angustifolium L. (stems up to 250 cm) and
E. dodonaei Vill. (stems 20–110 cm) [
3].
Epilobium species provide in phytotherapy the product
Epilobii herba. In 2016, supported by the safe use for at least 30 years, the European Medicines Agency (EMA) released a public document “Herbal medicine: summary for the public” in which it was concluded that the use of willow herb by patients with benign prostatic hyperplasia (BPH) is with the purpose of relieving lower urinary tract symptoms, such as frequent need to urinate or difficulty starting urination [
4,
5,
6,
7,
8,
9]. Willow herb is the common name for the aerial parts of
E. parviflorum Schreb. and/or
E. angustifolium L. (syn.
Chamaenerion angustifolium (L.) Scop.), harvested before or during flowering time [
9]. Several
Epilobium products are commercially available in each EU member state, and they are increasingly applied in the complementary therapy of BPH [
7,
9,
10,
11].
Up to date, two clinical studies investigated the effect of herbal preparations containing
Epilobium species for the management of BPH symptoms. Coulson et al. (2013) investigated the effects of a mixture of extracts also containing
E. parviflorum in a short-term phase II, randomized, double-blind, placebo-controlled clinical trial. The results showed a significant reduction of symptoms in the active group [
12]. Esposito et al. (2021) conducted a monocentric, randomized, double-blind, placebo-controlled clinical trial to investigate the effect of
E. angustifolium on BPH. The study was conducted in 128 adult men who were randomly assigned to the control group (placebo) or test group (
E. angustifolium extract food supplement) and their findings support the use of this medicinal herb to improve the quality of life for patients as extracts of this species significantly decreased nocturia [
7].
Moreover,
Epilobium species demonstrated prominent effects in treating different skin and mucosa diseases and significant anti-diarrheal activity [
13,
14,
15,
16,
17,
18].
Plant materials from
Epilobium sp. are rich sources of secondary metabolites and, lately, a growing interest in the phytochemistry of
Epilobium sp. has been observed. Bioactive compounds with therapeutic importance were identified in species of this genus, such as phenolic acids and derivatives, flavonoids (flavonol derivatives of quercetin, kaempferol, and myricetin), tannins and related compounds, triterpenes, and steroids, but also other constituents such as fatty acids and amino acids [
1,
19,
20]. As it is found in high concentrations in
Epilobium sp., the cyclic dimeric ellagitannin oenothein B was concluded to be the major constituent and was claimed to be responsible for many bioactivities of extracts [
7,
19,
21]. Regarding the extraction techniques, mainly maceration (from 1 to 21 days) was used to obtain extracts of
Epilobium sp. [
21,
22]. Various solvents were also investigated with relation to extraction yield of bioactive compounds: ethyl acetate, isopropyl alcohol, methanol, methanol/water mixed in various proportions, and water [
4,
13,
16,
21].
In Romania, 17 species of
Epilobium grow in spontaneous flora. Some of them are used in traditional medicine as anti-inflammatory, to treat BPH and associated symptoms, but there are few data on their chemical composition. Up to date, no data were reported for endemic species regarding their content of valuable secondary metabolites such as sterols or the major constituent, oenothein B. This aspect represents a drawback considering that the composition of natural products depends considerably on their geographic origin, even if they are isolated from the same plant species [
1,
23]. Therefore, one of the aims of this study was the phytochemical characterization of five indigenous
Epilobium species (
E. hirsutum L.,
E. parviflorum Schreb.
, E. palustre L.,
E. angustifolium L., and
E. dodonaei Vill.), with a focus on polyhenolic content, and secondly on sterolic and tocopherolic compounds. Furthermore, some modern extraction techniques were investigated (ultra-turrax-assisted extraction and ultrasonic-assisted extraction) to find the optimal extraction conditions for extracts rich in polyphenols. Another goal was to assess the differences in the phytochemical composition and biological activities of various plant matrix (roots, where available and sufficient; aerial parts; and leaves, respectively). In addition, the optimized extracts obtained from distinct plant parts were evaluated in various in vitro assays to describe their biological effects.
2. Materials and Methods
2.1. Chemical and Reagents
The following reagents were used in this study and were purchased from Sigma Aldrich (Sigma Aldrich Chemie GmbH, Schnelldorf, Germany): sodium carbonate, ferric chloride, resazurin, 6-hydroxy-2,5,7,8-tetramethylchromane-2-carboxylic acid (Trolox), 2,2’-azino-bis (3-ethylbenzothiazoline-6-sulfonate (ABTS), dimethyl sulfoxide (DMSO), and phosphate buffer. From Merck (Darmstadt, Germany) were purchased Folin–Ciocâlteu reagent, ethanol, acetonitrile, and methanol. From Carl Roth (Karlsruhe, Germany) was purchased aluminum chloride. All solvents were of LC grade and each of the used reagent was of analytical grade. The water was of Milli-Q-quality.
For spectrophotometric assays and liquid chromatography tandem mass spectrometry (LC-MS/MS) analysis, the following standards were acquired from Sigma Aldrich (Sigma Aldrich Chemie GmbH, Schnelldorf, Germany): apigenin, brassicasterol, caffeic acid, 4-O-caffeoylquinic acid, (+)-catechin, caftaric acid, campesterol, chlorogenic acid, p-coumaric acid, ergosterol, (−)-epicatechin, fisetin, gentisic acid, hyperoside (quercetin 3-D-galactoside), isoquercitrin (quercetin 3-β-D-glucoside), kaempferitrin, kaempferol, kaempferol-3-rhamnoside, luteolin, myricetin, oenothein B, patuletin, protocatechuic acid, quercetin, quercitrin (quercetin 3-rhamnoside), rutoside (quercetin-3-O-rutinoside), stigmasterol, syringic acid, (±)-α-tocopherol, (+)-γ-tocopherol, vanillic acid, vitexin (apigenin 8-C-glucoside), and vitexin 2-O-rhamnoside. From Carl Roth (Karlsruhe, Germany) were purchased beta-sitosterol and sinapic acid, while from Merck (Darmstadt, Germany) were acquired ferulic acid and gallic acid. From Supelco (Bellefonte, PA, USA) was purchased (+)-δ-tocopherol.
For in vitro assays, amoxicillin and miconazole were acquired from Merck KGaA, (Darmstadt, Germany). For cell line testing, Dulbecco’s modified Eagle medium (DMEM) was purchased from Gibco (Paisley, UK), while fetal bovine serum (FBS) and RPMI 1640 (Roswell Park Memorial Institute Medium) were purchased from Sigma Aldrich (Steinheim, Germany).
2.2. Plant Material and Preparation for Extraction
Five indigenous
Epilobium species were harvested from Romanian flora. More precisely,
E. hirsutum L.,
E. parviflorum Schreb., and
E. palustre L. were harvested during flowering stage from wild populations near Suceava.
E. angustifolium L. (formerly known as
Chamaenerion angustifolium (L.) Scop.) and
E. dodonaei Vill. (previously known as
Chamaenerion dodonaei (L.) Scop.) were harvested during flowering stage from higher altitude, from wild populations in Rarău-Giumalău mountains. The exact location and GPS position of the harvesting places are given in
Table 1.
The plant species were authenticated by botany Prof. Gianina Crișan and botany Prof. Mircea Tămaș from the Department of Pharmaceutical Botany, Faculty of Pharmacy, Iuliu Hațieganu University of Medicine and Pharmacy, Cluj-Napoca, and voucher specimens were deposited for each species in the Herbarium of this department (voucher numbers 07/2022 to 11/2022).
After harvesting, the impurities were removed by washing the plant material with tap water, and then it was conditioned into different organ products, where possible and sufficient (roots, leaves, and aerial parts), and was further air-dried for 5 days, at room temperature (25 °C), safe from sunlight.
2.3. Investigation of Optimum Experimental Conditions to Obtain Epilobium sp. Extracts Rich in Phytochemicals
In order to maximize the extraction yield of bioactive compounds, a rational design of experiments was approached. Thus, in the screening step, Modde software v11.0 (Sartorius Stedim Data Analytics AB, Umeå, Sweden) was used to develop a D-optimal experimental design with 3 factors and 3 variables based on which several extracts from the leaves of
E. hirsutum were obtained (screening step). The following factors with possible influence on the extraction yield were considered: extraction method (qualitative variable), amount of alcohol (ethanol%) in the extraction solvent (quantitative variable), and extraction time (quantitative factor). The responses (output variables) were total polyphenolic content (TPC), total flavonoid content (TFC), and total antioxidant activity (TAA, assessed by the TEAC assay) (
Table 2). The
E. hirsutum leaves extracts had a concentration of 10% (2 g plant material/ 20 mL solvent).
The plant material was ground in a coffee grinder (Bosch TSM6A013B, 75 g, 180 W, Stuttgart, Germany) for 5 min and, next, the powder was sifted through a 200 µm Retsch sieve (Retsch GmbH, Haan, Germany). Vegetal powder (2 g) from E. hirsutum leaves was weighed and, next, mixed with the extraction solvent (20 mL) in Falcon tubes. Extraction by ultra-turrax (UTE) was performed by using the Ultra-Turrax homogenizer at 4000 rpm (model T 18, IKA Labortechnik, Staufen, Germany), and ultrasonic-assisted extraction (USE) was carried out with an ultrasonic bath (Sonorex Super RK 100 H, Bandelin Electronic GmbH & Co. KG, Berlin, Germany). The extraction time varied in the range 2–8 min, according to the experimental design. After extraction, the samples were centrifuged for 5 min at 10,000 rpm (SIGMA 3-30KS refrigerated centrifuge, Sigma Laborzentrifugen GmbH, Osterode am Harz, Germany) and the obtained supernatant was recovered and used for spectrophotometric analysis of TPC, TFC, and TAA, and phytochemical analysis by LC-MS/MS.
After validating the experimental plan, optimum extraction conditions were used to obtain vegetal extracts from the five Epilobium sp. from distinct plant parts (roots, leaves, and aerial parts). The optimum extracts were 10% concentration (mass/volume). After centrifugation, the resulting supernatant was recovered and divided in two equal fractions. The first fraction was used to determine the total phenolic content, total flavonoid content, antioxidant activity through TEAC and DPPH assays, phytochemical analysis by LC-MS/MS, and biological activity (antibacterial and antifungal potential). The second fraction was weighed and placed in amber glass vial for lyophilization. The ethanol was evaporated by using a rotary evaporator coupled with vacuum pump (HEI-VAP Advantage Rotary evaporator HL/G1 coupled with Rotavac valve control, Heidolph, Germany). The optimized plant extracts were freezed at −55 °C for 24 h. Then, the samples were lyophilized at pressure 200 mTorr and the temperature was set to −25 °C for another 48 h (SP Scientific Virtis AdVantage 2.0 BenchTop Freeze Dryer/Lyophilizer, Model Advantage Plus EL-85, American Laboratory Trading Inc., East Lyme, CT, USA). The lyophilisates were later used for cell line testing on a normal cell line and a cancerous one.
2.4. Quantitative Determinations of Total Bioactive Compounds and Antioxidant Activity
Total Phenolic Content (TPC)
The following spectrophotometric method was used to determine the total polyphenolic content (TPC): 60 µL of plant extract (diluted 1:50) were mixed in Eppendorf tubes with 270 µL of Folin–Ciocâlteu reagent (diluted with distilled water 1:10) and 270 µL of Na
2CO
3 (6%
w/v) [
24]. After incubation at room temperature for 30 min in the dark, the absorbances were recorded at 760 nm (control/solvent blank sample = distilled water) using a Specord
® 200 Plus Double-beam Spectrophotometer from Analytik Jena GmbH, Germany. A calibration curve was performed using gallic acid (concentration range for calibration solutions 10–100 µg/mL, R
2 = 0.9901). The results were expressed as mg gallic acid equivalents (GAE)/mL of plant extract.
Total Flavonoid Content (TFC)
To determine the total flavonoid content (TFC), it was proceeded as previously described: 200 µL plant extract (diluted 1:20) was mixed with 400 µL solution of AlCl
3 20 mg/mL in 5% acetic acid in ethanol, prepared according to a ratio of 3:1 (
v/v) [
25]. The absorbance was immediately measured at 420 nm against a solvent blank, with a Specord
® 200 Plus Double-beam Spectrophotometer from Analytik Jena GmbH, Germany. The calibration curve was prepared with quercetin and the solutions’ concentrations were in the range 20–150 µM (R
2 = 0.9894). The results were expressed as mM quercetin equivalents (QAE) per mL of plant extract.
DPPH Radical Scavenging Activity
The antioxidant activity for the optimized extracts of
Epilobium sp. was evaluated according to a spectrophotometric method previously described [
26]. The 2,2-diphenyl-1-picrylhydrazyl (DPPH) assay was employed for this step of the study. The DPPH reagent was dissolved in methanol to reach a concentration of 1 mg/mL. The solution was diluted to 40 pg/mL. Then, 0.8 mL of DPPH solution was mixed with 0.2 mL of plant extract (diluted 1:200) and allowed to incubate in a thermostatic bath at 40 °C for 30 min in the dark. The absorbance change was measured at 517 nm and DPPH reduction capacities were calculated relative to that of the stock solution (40 µg/mL) (A = A
stock solution − A
sample, where A
stock solution is the absorbance of DPPH radical + methanol and A
sample is the absorbance of DPPH radical + plant extract). The samples’ absorbances were read against a solvent blank by using a Specord
® 200 Plus Double-beam Spectrophotometer (Analytik Jena GmbH, Germany). The calibration solutions were prepared in the range 1.22–122 µg/mL, R
2 = 0.995. Quercetin was used as a reference standard; therefore, the results were expressed as mg quercetin equivalent/mL of plant extract.
Trolox Equivalent Antioxidant Capacity (TEAC) Assay
The determination of total antioxidant activity (TAA) during the screening step of the experimental plan was performed according to the ABTS
•+ method (2,2’-azino-bis (3-ethylbenzothiazoline-6-sulfonate)) [
25]. The spectrophotometric assay is based on the ability of a compound to decolorize the ABTS radical solution (deep green), according to their antioxidant potential and concentration. Reagent 1 (R1) consisted of 0.4 M acetate buffer (pH = 5.8), while reagent 2 (R2) was the 10 mM ABTS
•+ solution in 30 mM acetate buffer (pH = 3.6). In brief, 12.5 µL of plant extract (diluted 1:200) was mixed with 500 µL R1 and 50 µL R2. The samples were incubated at room temperature for 5 min in the dark before measuring the absorbance at 660 nm against solvent blank (500 µL R1 + 50 µL R2) with a Specord
® 200 Plus Double-beam Spectrophotometer from Analytik Jena GmbH, Jena, Germany. The calibration curve was performed with serial dilutions of a water-soluble analogue of vitamin E (Trolox) in the range 0.05–1 mM, dissolved in acetate buffer solution (20 mM, pH = 7.4) (R
2 = 0.9972). Total antioxidant activity was expressed as mM Trolox equivalent (TE)/L plant extract.
2.5. Phytochemical Analysis by LC-MS/MS
Identification and Quantification of Polyphenolic Compounds
The phytochemical profile of the optimized
Epilobium sp. extracts was assessed by liquid chromatography tandem mass spectrometry (LC-MS/MS) with two distinct analytical methods which were previously validated [
27,
28]. The following equipment was used: Agilent Technologies 1100 HPLC Series system (Agilent, Santa Clara, CA, USA) equipped with auto sampler, column thermostat, binary gradient pump, degasser, and UV detector. This system was coupled with a mass spectrometer from Agilent, model with Ion Trap 1100 SL (LC/MSD Ion Trap VL, Agilent, Santa Clara, CA, USA).
The first analytical method which was used was slightly modified (5 new compound standards were added) and was applied to identify 23 polyphenols in optimized
Epilobium sp. extracts. Briefly, chromatographic separation was performed on a reverse phase analytical column (Zorbax SB-C18, 100 mm × 3.0 mm i.d., 3.5 μm, Agilent Technologies, Santa Clara, CA, USA) with a mobile phase consisting in a mixture of methanol: acetic acid 0.1% (
v/v) and a binary gradient. Elution began with a linear gradient, initially with 5% methanol and ending with 42% methanol at 35 min. For the next 3 min, isocratic elution followed with 42% methanol. Further, the column was rebalanced with 5% methanol for the following 7 min. The flow rate was set at 1 mL/min, the column temperature was maintained at 48 °C and the injection volume of each sample was 5 µL. Afterwards, the bioactive compounds were detected in both UV and MS mode. Firstly, to detect the polyphenolic acids, the UV detector was set at 330 nm for up to 17 min. Secondly, for detection of the flavonoids and their aglycones, the UV detector was switched to 370 nm wavelength for up to 38 min. The MS system operated using an electrospray ionization source (ESI) in negative mode (capillary +3000 V, nebulizer 60 psi (nitrogen), nitrogen dry gas at 12 L/min, and temperature of 360 °C) [
29,
30].
The second LC-MS validated analytical method was used to identify other 6 polyphenols from optimized
Epilobium sp. extracts, namely epicatechin, catechin, syringic acid, gallic acid, protocatechuic acid, and vanillic acid, as previously described [
31,
32]. Chromatographic separation was performed using the same equipment and on the same analytical column mentioned above with the mobile phase a mixture of methanol: acetic acid 0.1% (
v/v) and a binary gradient as follows: at start—3% methanol; then, at 3 min—8% methanol; next, at 8.5 min—20% methanol, then 20% methanol for up to 10 min, followed by rebalancing of the column with 3% methanol. The flow rate was set at 1 mL/min and the injection volume for each sample was 5 µL. The detection of the bioactive compounds from optimized
Epilobium sp. extracts was performed in MS mode and the MS system operated using an electrospray ionization source (ESI) in negative mode, according to the technical specifications mentioned in the first analytical method [
31,
32].
For identification of each bioactive compound from the analyzed plant extracts, the MS spectra/traces were compared with spectra from library. After MS detection, the UV trace was further used for quantification of compounds. For the identified compounds, the calibration curve of their corresponding standards was considered for quantification of their peak areas.
DataAnalysis (v5.3) and ChemStation (vB01.03) software from Agilent (Santa Clara, CA, USA) were employed for chromatographic data acquisition and interpretation. Results were expressed as micrograms of bioactive compound per gram of dry weight (d.w.) plant sample.
Identification and Quantification of Phytosterols
The phytosterols from optimized
Epilobium sp. extracts were determined according to a previously validated LC-UV-MS/MS method [
33,
34,
35]. The equipment and the chromatographic analytical column used were the same, but the elution of the compounds was performed in an isocratic manner, with mobile phase acetonitrile: methanol (90:10,
v/v), a flow rate of 1 mL/min at 45 °C, and 10 μL injection volume. For the detection of compounds in positive ionization, the same mass spectrometer was used, equipped with ion trap and APCI source. The working conditions (nitrogen gas temperature 325 °C, flow rate 7 L/min, nebulizer pressure 60 psi, capillary voltage 4000 V) were carefully adjusted to reach maximum sensitivity. Complete identification of the compounds was performed by comparing retention times and mass spectra with five external standards, namely ergosterol, brassicasterol, stigmasterol, campesterol, and beta-sitosterol. Multiple-reaction monitoring mode (MRM) was used for detection and to avoid or reduce interference [
25]. The Agilent ChemStation (vB01.03) software was used for the acquisition of data and the DataAnalysis (v5.3) software was used for the investigation of chromatographic data. The identified phytosterols were further quantified considering the intensity of major daughter ions in the mass spectra. The results were expressed as nanograms phytosterol per gram of dry weight (d.w.) plant sample.
Identification and Quantification of Tocopherols
The tocopherol content (alpha, gamma, delta) for the optimized
Epilobium sp. extracts was investigated using a previously validated LC-MS/MS analytical method [
36]. The same HPLC system was used, coupled with a Brucker Ion Trap SL (Brucker Daltonics GmbH, Leipzig, Germany) and a Zorbax SB-C18 chromatographic column (100 mm × 3.0 mm i.d., 3.5 µm; Agilent Technologies, Santa Clara, CA, USA). Separation was carried out using a mobile phase of water/methanol (7:93;
v/v) and isocratic elution. The injection volume was 10 µL for the standard solution as well as plant extracts. The thermostat was set at 40 °C and the flow rate was of 1 mL/min. The MS detection was performed in negative ionization, using a source of chemical ionization under atmospheric pressure (APCI) and in multiple-reaction monitoring mode (MRM). The standard solutions of tocopherols (1 mg/mL) were prepared in methanol and the working solutions were obtained by dilution in water / acetone (50:50,
v/v) [
37]. The Agilent ChemStation (vB01.03) and DataAnalysis (v5.3) software were employed for evaluation of chromatographic data. The results were expressed as nanograms tocopherol per gram of dry weight (d.w.) plant sample.
Identification and Quantification of Oenothein B
For the quantification of oenothein B from optimized extracts, a new LC-MS analytical method was developed. An oenothein B standard was used for quantitative determination (manufacturer Sigma-Aldrich, product code 102328214, lot # BCCD7964, CAS 104987-36-2). The equipment used was an Agilent 1100 HPLC Series (with binary pump, autosampler, thermostat, and UV detector), coupled with mass spectrometer (Agilent Ion Trap 1100 SL). A reverse phase analytical column was used (Zorbax SB-C18, 100 mm × 3.0 mm i.d., 3.5 μm, Agilent Technologies, Santa Clara, CA, USA). The mobile phase consisted of a mixture of 0.1% (v/v) acetic acid and acetonitrile solution, eluting in gradient after the following program: 92% acetic acid, 0.1% in water (v/v), and 8% acetonitrile, then 12% acetonitrile at 2.4 min. The flow rate was 0.8 mL/min, the column temperature was set at 40 °C, the injection volume was 5 µL, and the retention time was 2.4 min. An electrospray ionization source (ESI) was used, with negative ionization mode, nitrogen gas temperature 350 °C, flow rate 12 L/min, nebulizer pressure 60 psi, and capillary potential 5500 V. The analysis mode was SIM (simultaneous ion monitoring); due to the relatively high molecular weight (1596 u.a.m.), the molecule loses two protons, resulting in an ion with two negative charges and m/z 783. The calibration curve was obtained from standard solutions at various concentration levels, representative of the concentration range in the samples. Regression analysis of concentrations for standard solutions (1.3–26 μg/mL) proved good correlation coefficients for the calibration curve. Oenothein B analysis was performed only for optimized extracts and the data was interpreted with Agilent ChemStation (vB01.03) and DataAnalysis (v5.3) software. The results were expressed as milligrams oenothein B per gram of dry weight (d.w.) plant sample.
The validation data (calibration curve, LOD, LOQ, type of MS analysis, retention time, and specific ions for identification) for determination of components in optimized extracts (polyphenols, sterols, and tocopherols) were previously presented [
24,
26,
27,
28,
29,
30,
31,
32,
35].
2.6. Principal Component Analysis
Principal component analysis (PCA) was applied to provide an initial overview of the data. Variables describing phytochemical composition and extract properties were scaled to unit variance and principal components were computed to capture a significant amount of input variability.
For identifying the differences between the investigated observations, hierarchical cluster analysis was performed, having as an input the score vectors of the PCA model. The obtained dendrogram was used to group the observations for the upcoming discriminant analysis, by OPLS-DA modelling (Orthogonal Projections to Latent Structures–Discriminant Analysis).
The X dataset, represented by extract properties, and the Y dataset, represented by the dummy variable matrix (assigning group membership), were scaled to unit variance. OPLS-DA model performance was evaluated by considering the explained variability for both X and Y (R2X, R2Y) and through the predictive capacity parameter (Q2), determined by full cross-validation. For model interpretation, score and loading plots were generated. All steps were performed with Simca 13 software (Sartorius Stedim Biotech, Göttingen, Germany).
2.7. Antimicrobial and Antifungal Activity of the Optimized Epilobium sp. Extracts
Initial in vitro Qualitative Study (Screening)
The antimicrobial potential of the optimized extracts was evaluated in two steps. The initial method was represented by the disk diffusion test, used as a screening method, designed to identify the extracts with increased antimicrobial potential. For this purpose, standard strains of Gram-positive, Gram-negative, and yeasts were selected. Gram-positive bacteria were represented by: Staphylococcus aureus ATCC 6538P, Enterococcus faecalis ATCC 29212, Listeria monocytogenes ATCC 13932, and Bacillus cereus ATCC 11778. Gram-negative bacteria used were represented by: Escherichia coli ATCC 10536, Salmonella enteritidis ATCC 13076, and Pseudomonas aeruginosa ATCC 27853, while the yeast strain was Candida albicans ATCC 10231. Amoxicillin and Miconazole were used as standard antibacterial and antifungal controls, respectively.
European Committee on Antimicrobial Susceptibility Testing (EUCAST) standard method was used for the screening test, by an adapted disk diffusion technique [
38,
39]. Microbial colonies, grown on Mueller–Hinton (MH) agar for bacteria and Sabouraud dextrose agar (SDA) for yeast, were suspended in saline to prepare a density of 0.5 on McFarland scale using Densichek device (BioMérieux, Craponne, France). Plastic Petri dishes containing MH agar for bacteria and SDA agar for yeast (8.5 cm diameter) were flooded with the microbial suspension. The excess fluid was removed, and the agar surface allowed to dry. Filter paper discs with 5 mm diameter were placed in a radial model and 20 µL from each extract was placed on the paper disk. The plates were then incubated at 35 ± 2 °C for 18 h for bacteria and at 28 °C for 48 h for the fungal strain [
40]. Antimicrobial activity was evaluated as the diameter of the growth inhibition area, measured in mm.
In vitro Quantitative Evaluation
The minimum inhibitory concentration (MIC) method was used for the quantitative assessment and included four Gram-positive standard microbial strains:
Staphylococcus aureus ATCC 6538P,
Enterococcus faecalis ATCC 29212,
Listeria monocytogenes ATCC 13932, and
Bacillus cereus ATCC 11778. The evaluation was performed according to the adapted EUCAST protocols [
40]. Liquid MH medium was used to dilute the extracts in a two-fold serial system, in ten consecutive wells, from the initial (stock = 1/1) to the dilution of 1/512, in 96-wells titer plates. The total broth volume was adjusted to 200 µL/well, with 180 µL from the vegetal extract and 20 µL from the microbial suspension. Positive (broth and microbial inoculum) and negative (30% and 50% ethanol) controls were also used. The plates were incubated at 37 °C for 24 h for bacteria and at 28 °C for 48 h for
Candida albicans. The MIC values were represented by the lowest concentration of the extract able to inhibit the growth of the microbial cultures (with the same optical density -OD- as the negative control), compared to the positive control, determined by a decreased value of absorbance at 450 nm (HiPo MPP-96, Biosan, Latvia). The MIC
50 was represented by the MIC value at which ≥50% of the bacterial/yeast cells’ growth was inhibited, determined as the well with the OD value similar to the average of positive and negative control.
2.8. In Vitro Biological Activity on Cell Lines
Cell Culture
For the evaluation of the biological activities of the optimized plant extracts, normal human foreskin fibroblasts (BJ) and the LNCaP prostate cancerous cells from ATCC (Manassas, United States of America) were used. The normal cell phenotype was maintained in DMEM (Dulbecco’s modified Eagle’s medium) with low glucose (1 g/L), while the LNCaP cells were cultured in RPMI (Roswell Park Memorial Institute) 1640 with high glucose (5 g/L). Both media were supplemented with 10% FBS (fetal bovine serum). Cells were maintained in a humidified incubator with 5% CO2 addition at 37 °C and the media were replaced every other day. At confluency of 70–80%, cells were either subcultured or used in experiments.
Preparation of Extract Solutions
A 100 mg/mL stock solution in dimethyl sulfoxide (DMSO) was obtained by dissolving the lyophilized extracts. The working solutions were prepared by further diluting the stock solution with DMSO. These working solutions were utilized to achieve the necessary concentrations in the cell culture medium, which ranged from 10 to 400 µg/mL.
2.8.1. Anticancer Activity
A number of 30.000 LNCaP cells and 7.500 normal (BJ) cells were seeded in 100 µL in 96-well plates to reach a confluency of 70–80% after 24 h. Dead and unattached cells were removed with phosphate-buffered saline solution (PBS) while the remaining attached cells were exposed for 24 h at a concentration ranging from 10 to 400 µg/mL of extracts. Post-exposure, the cells were washed with PBS and the viability was measured using Alamar Blue (AB) assay, as previously described [
31,
34,
41,
42]. AB assay was used to evaluate the metabolic ability of cells to metabolically convert resazurin, a non-fluorescent compound, to resorufin, a fluorescent product. Briefly, cells were incubated for 4 h with a 200 µM resazurin solution, and the fluorescence was measured at λ
excitation = 530/25; λ
emission = 590/35, using Synergy 2 Multi-Mode Microplate Reader. The experiment was done using three biological replicates, each one including 6 technical replicates. Cells exposed to culture medium containing 0.2% DMSO were used as negative control (NC). The results were calculated as relative values compared to the NC (100%). IC
50 values were calculated for both cell lines from the dose–effect curves obtained by fitting the data with a 4-parameter logistic curve.
2.8.2. Antioxidant Activities
The ability of the optimized extracts to protect against oxidative stress was evaluated on the normal BJ cell phenotype using the 2,7 dichloro-fluorescein diacetate (DCFH-DA) assay, as presented in previous studies [
36,
43]. After cellular incorporation, the non-fluorescent DCFH-DA dye is hydrolyzed by intracellular esterases to dichlorodihydrofluorescein (DCFH) which remains confined in the cellular compartment. In the presence of intracellular ROS, DCFH is oxidized to a fluorescent compound that is directly proportional to ROS concentration. Briefly, cells were exposed for 24 h to 3 non-cytotoxic concentrations of the vegetal extracts and further loaded for 2 h with 50 µM DCFH-DA dissolved in Hanks’ balanced salt solution (HBSS). Post-incubation, non-internalized DCFH-DA was washed with PBS 2 and the cells were either exposed to HBSS or 250 µM H
2O
2 for 2 h to quantify ROS in non-stimulated and stimulated conditions. The fluorescence was measured using Synergy 2 Multi-Mode Microplate Reader at λ
excitation = 485/20 and λ
emission = 528/20. The antioxidant potency of vegetal extracts was compared to N-Acetyl Cysteine (NAC) treatment (20 mM solution). Three biological replicates, each with six technical replicates, were used in the experiments. Results were presented as relative values in comparison to the negative control (100%).
2.8.3. Anti-Inflammatory Activities
The anti-inflammatory potentials of the optimized extracts were evaluated by measuring the levels of two pro-inflammatory cytokines, namely IL-6 and IL-8 in the cell culture supernatant using ELISA assays. Normal BJ cells were concomitantly exposed to 100 ng/mL of Lipopolysaccharides (LPS) from
Escherichia coli and to three non-cytotoxic concentrations of the vegetal extracts (10, 25, and 50 µg/mL) for 24 h, as detailed in former studies [
31,
43,
44]. Following the exposure, cell culture supernatants were aliquoted and stored at –80 °C until the analysis was performed. The concentrations of IL-6 and IL-8 in the cellular supernatants were measured using ELISA kits. A standard curve for each cytokine was included in the experiments, and the cytokine levels were calculated from a 4-parameter logistic curve as recommended in the manufacturer’s instructions.
2.8.4. Statistical Analysis
All data are expressed as mean value ± standard deviations (SD) of three replicates. For the in vitro biological activity on cell lines, experimental data are presented as mean values ± standard deviations (SD) of three biological replicates. Data were statistically analyzed using a One-Way Analysis of Variance (ANOVA) with a Holm–Sidak post hoc test. Graphical representation and data analysis were performed using the SigmaPlot 11.0 software (Systat, Software Inc., Chicago, IL, USA). Results were considered statistically different if p values were lower than 0.05.
3. Results and Discussions
3.1. Fitting the Experimental Data with the Models
The matrix of the experimental design which consisted of 19 vegetal extracts of
E. hirsutum leaves was generated by the Modde software. In
Table 3 are summarized the outcomes after performing the experimental runs.
3.2. The Influence of Experimental Conditions on TPC, TFC, and TAA
The experimental design was fitted with the obtained data by the partial least squares regression (PLS) method in the screening step. The fitting parameters for the output variables (TPC, TFC, and TAA) are shown in
Table 4. For all evaluated variables, a good fit was obtained (R
2 between 0.848 and 0.962); in addition, adequate model validity and good reproducibility were also observed. The statistical parameter that overestimates the goodness of fit is R
2; more precisely, it describes the percent of response’s variation which is explained by the chosen model, and for a good model it should be close to a value of 1. On the other hand, Q
2 indicates the percent of response’s variation that is predicted by the model according to cross-validation. High values for these two statistical parameters and a difference of 0.2–0.3 between them indicates a high predictive power for an adequate model. For the chosen model, even though the difference between these two statistical parameters was higher than 0.3, a good reproducibility was obtained, and a good model validity. For TAA, the model validity was lower because it was noticed in spectrophotometric assays that for the
E. hirsutum leaves extracts, both polyphenols and flavonoids display good antioxidant activity; therefore, it is a synergistic mechanism of action. On the other hand, it was observed that polyphenols and flavonoids exhibit high extraction yields under different working conditions, and for the optimization step, it was decided to determine the optimum extraction conditions which assure a maximum recovery yield for polyphenols, as it was proved by other authors that these are the most prominent bioactive compounds responsible for the biological activity of
Epilobium sp. [
45]. However, for comparison reasons, an
E. hirsutum leaves extract with EtOH 50% was also obtained and evaluated in the following biological assays, considering that, in this case, a good recovery was noticed for both polyphenols and flavonoids, and an adequate total antioxidant activity. This extract was obtained under the optimum extraction method as given by the Modde software after maximizing the TPC and TAA, namely ultra-turrax-assisted extraction (UTE) for 8 min.
As can be observed from
Table 3, the working conditions influence the extraction yield of bioactive compounds. The influence of working conditions on TPC, TFC, and TAA are shown in the form of diagrams with scaled and centered coefficients in
Figure 1.
From the figures given above, it can be noticed that the factor with the highest influence on the recovery of bioactive compounds is the percentage of alcohol (ethanol) in the extraction solvent (input variable X1). In the case of polyphenols, a good extraction yield was obtained when a hydroalcoholic mixture with 30% ethanol (EtOH) was used, and the extraction yield decreased as the percentage of ethanol in the solvent mixture increased (negative influence). Significant antioxidant activity was obtained in the case of extracts obtained in this solvent mixture (EtOH 30%), confirming that polyphenols are the main bioactive compounds that provide the antioxidant potential of E. hisutum leaves extracts. In the case of flavonoids, the extraction was favored in a hydroalcoholic mixture with 70% EtOH, thus having a positive influence on the extraction yield. However, no increased TAA was obtained for flavonoid-rich extracts; thus, for the optimization step, the maximization of TPC and TAA was chosen.
The extraction method displayed a positive influence upon the extraction yield; high values for TPC and TAA were observed when using UTE (samples N1, N9, N10, N17, and N19). The extraction time exhibited a positive influence upon all evaluated output variables, but it was more marked for TPC (samples N9 and N17).
3.3. Investigation of Optimum Experimental Conditions to Obtain Epilobium sp. Extracts Rich in Phytochemicals
In the optimization step, the goal was to maximize the extraction of polyphenols (TPC), which ensure a marked antioxidant activity (evaluated as TAA). Thus, the Modde software returned the optimal working parameters as following: ultra-turrax-assisted extraction (4000 rpm), for 8 min, in hydroalcoholic mixture of solvents with 30% ethanol. Under these conditions, the main bioactive compounds were extracted from the other harvested species, from various parts of the plants. In this stage, nine different extracts of 10% plant product concentration (mass/volume) were obtained, as follows: E. hirsutum leaves (50% EtOH—this extract was made in order to have one sample with higher flavonoid content in the series of optimal extracts, for the in vitro biological testing), E. hirsutum leaves (EtOH 30%), E. hirsutum aerial parts (EtOH 30%), E. hirsutum roots (EtOH 30%), E. parviflorum aerial parts (EtOH 30%), E. palustre aerial parts (EtOH 30%), E. dodonaei aerial parts (EtOH 30%), E. angustifolium leaves (EtOH 30%), and E. angustifolium aerial parts (EtOH 30%).
For the nine optimized Epilobium sp. extracts, the following determinations were performed: total polyphenol content (TPC), total flavonoid content (TFC), antioxidant activity by TEAC and DPPH assays, detailed phytochemical profile with identification, and quantification of polyphenols, tocopherols, and sterols (using previously validated LC-MS/MS analytical methods). Biological properties were also evaluated for the optimized extracts: antimicrobial activity on Gram-positive and Gram-negative bacteria, and antifungal potential. In addition, cytotoxic, antioxidant, and anti-inflammatory activity were determined in vitro in studies performed on a normal human fibroblast cell line and a human prostate carcinoma cell line.
3.4. Quantitative Determinations of Total Bioactive Compounds and Antioxidant Activity
Table 5 summarizes the results obtained for the spectrophotometric assays performed on the optimized vegetal extracts. The experiments were performed in triplicate (n = 3) and the results are given as mean value ± standard deviation (SD).
3.5. Phytochemical Analysis by LC-MS/MS
Table 6 presents the quantitative and qualitative determination for individual polyphenols, tocopherols, sterols, and the main component found in
Epilobium species, oenothein B, respectively. The corresponding UV chromatograms for individual polyphenolic compounds quantified by the first LC-MS method, the total ion chromatogram (TIC) for polyphenols analyzed with the second analytical method, and the TIC for tocopherols are provided in
Supplementary material (Figures S1–S9).
To the best of our knowledge, this is the first study to present the detailed phytochemical profile for
E. palustre and
E. dodonaei, and the first research to investigate the content of sterols and tocopherols in five distinct
Epilobium sp. Other scientific articles published recently which mentioned these two categories of bioactive compounds did not specify the exact amount determined in various plant parts of
Epilobium sp. For tocopherol analysis, a study mentioned the α-, γ-, and δ-tocopherol content determined in seed oil of
E. dodonaei,
E. hirsutum, and
E. parviflorum, but currently the seed oil of these species is not used for medicinal purpose, the aim of that study being the general screening of the phytocomplex [
46].
Concerning the polyphenols analysis, the results given in
Table 6 support previous findings, in which the main bioactive compounds of this category were hyperoside, myricetin, quercitrin, and kaempferol-3-rhamnoside [
47]. In addition to what was presented to date in the scientific literature, the present study determined in all five
Epilobium sp. harvested from Romanian flora and in all investigated plant parts (leaves, aerial parts, roots) high concentrations of caftaric acid (1002.29 ± 57.94 μg/g d.w. for
E. parviflorum aerial parts EtOh 30%—highest amount determined) and gallic acid (662.28 ± 42.46 μg/g d.w. in
E. dodonaei aerial parts EtOH 30%—highest concentration observed). Furthermore, the content of sterols was investigated, with beta-sitosterol found in highest concentrations (ranging from 1206.29 ± 80.12 ng/g d.w. for
E. hirsutum leaves EtOH 30% to 2694.80 ± 152.71 ng/g d.w. for
E. angustifolium aerial parts EtOH 30%). The analytical standards for tocopherol identification were α-, γ-, and δ-tocopherol, of which α- and δ-tocopherol were quantified in all extracts.
E. parviflorum aerial parts EtOH 30% contained the highest amount of alfa-tocopherol (9435.45 ± 398.51 ng/g d.w.) and delta-tocopherol (572.76 ± 33.14 ng/g d.w.).
From the investigated extracts,
E. hirsutum roots EtOH 30% displayed a modest phytocomplex, poor in bioactive compounds which, where present, were determined in low concentrations. It was also noticed that the main bioactive compound, oenothein B, was absent from this species plant part. Oenothein B is supposed to be involved in anti-inflammatory activity of
Epilobium sp. extracts, due to its urolithins metabolites formed by gut microbiota after oral administration of herbal supplements [
4]. On the other hand, Lin et al. (2022) assessed the anti-inflammatory activity of an ethanol fraction of
E. angustifolium from which oenothein B was removed and the activity was much stronger than that of oenothein B [
48]. This suggests a synergistic mechanism of action of the plant extract, which should possess a phytocomplex rather than a higher concentration in a certain bioactive compound. For these reasons, in further in vitro studies performed on cell lines, the
E. hirsutum roots EtOH 30% was not considered for evaluation. The highest amount of this ellagitannin was obtained in
E. dodonaei aerial parts EtOH 30% (106.82 ± 7.45 mg/g d.w.),
E. parviflorum aerial parts EtOH 30%) (98.84 ± 5.89 mg/g d.w.), and
E. hirsutum aerial parts EtOH 30% (73.49 ± 3.89 mg/g d.w.).
The influence of the extraction solvent mixture was observed when comparing the phytocomplex of E. hirsutum leaves EtOH 50% extract and E. hirsutum leaves EtOH 30%.
Although higher concentrations were obtained for certain polyphenols when EtOH 50% was used (p-coumaric acid, hyperoside, myricetin, quercitrin, quercetol, kaempferol-3-rhamnoside, epicatechin, catechin, and oenothein B), some bioactive compounds were absent and were quantified only in E. hirsutum leaves EtOH 30% extract (gentisic acid, beta-sitosterol, campesterol, and γ-tocopherol).
3.6. Principal Component Analysis
The PCA model, fitted on the dataset comprised of extract composition and properties, presented four principal components, explaining a total of 91.8% data variability. The obtained score vectors allowed the identification of four groups, as it can be observed from the dendrogram of the hierarchical clustering analysis (
Figure 2).
To compare the investigated observations, an OPLS-DA model was fitted to identify differences in extract composition and properties. The fitted model presented excellent performance, reflected by the large amount of variability from the X matrix that contributed to class discrimination (R
2X predictive—73.8%), combined with the high values of R
2Y (0.996) and Q
2 (0.902). The R
2Y parameter reveals the explained variability in the Y matrix, which contains class membership, whereas Q
2 reveals the predictive power of the model. Both parameters suggest that a good discrimination was achieved [
49,
50].
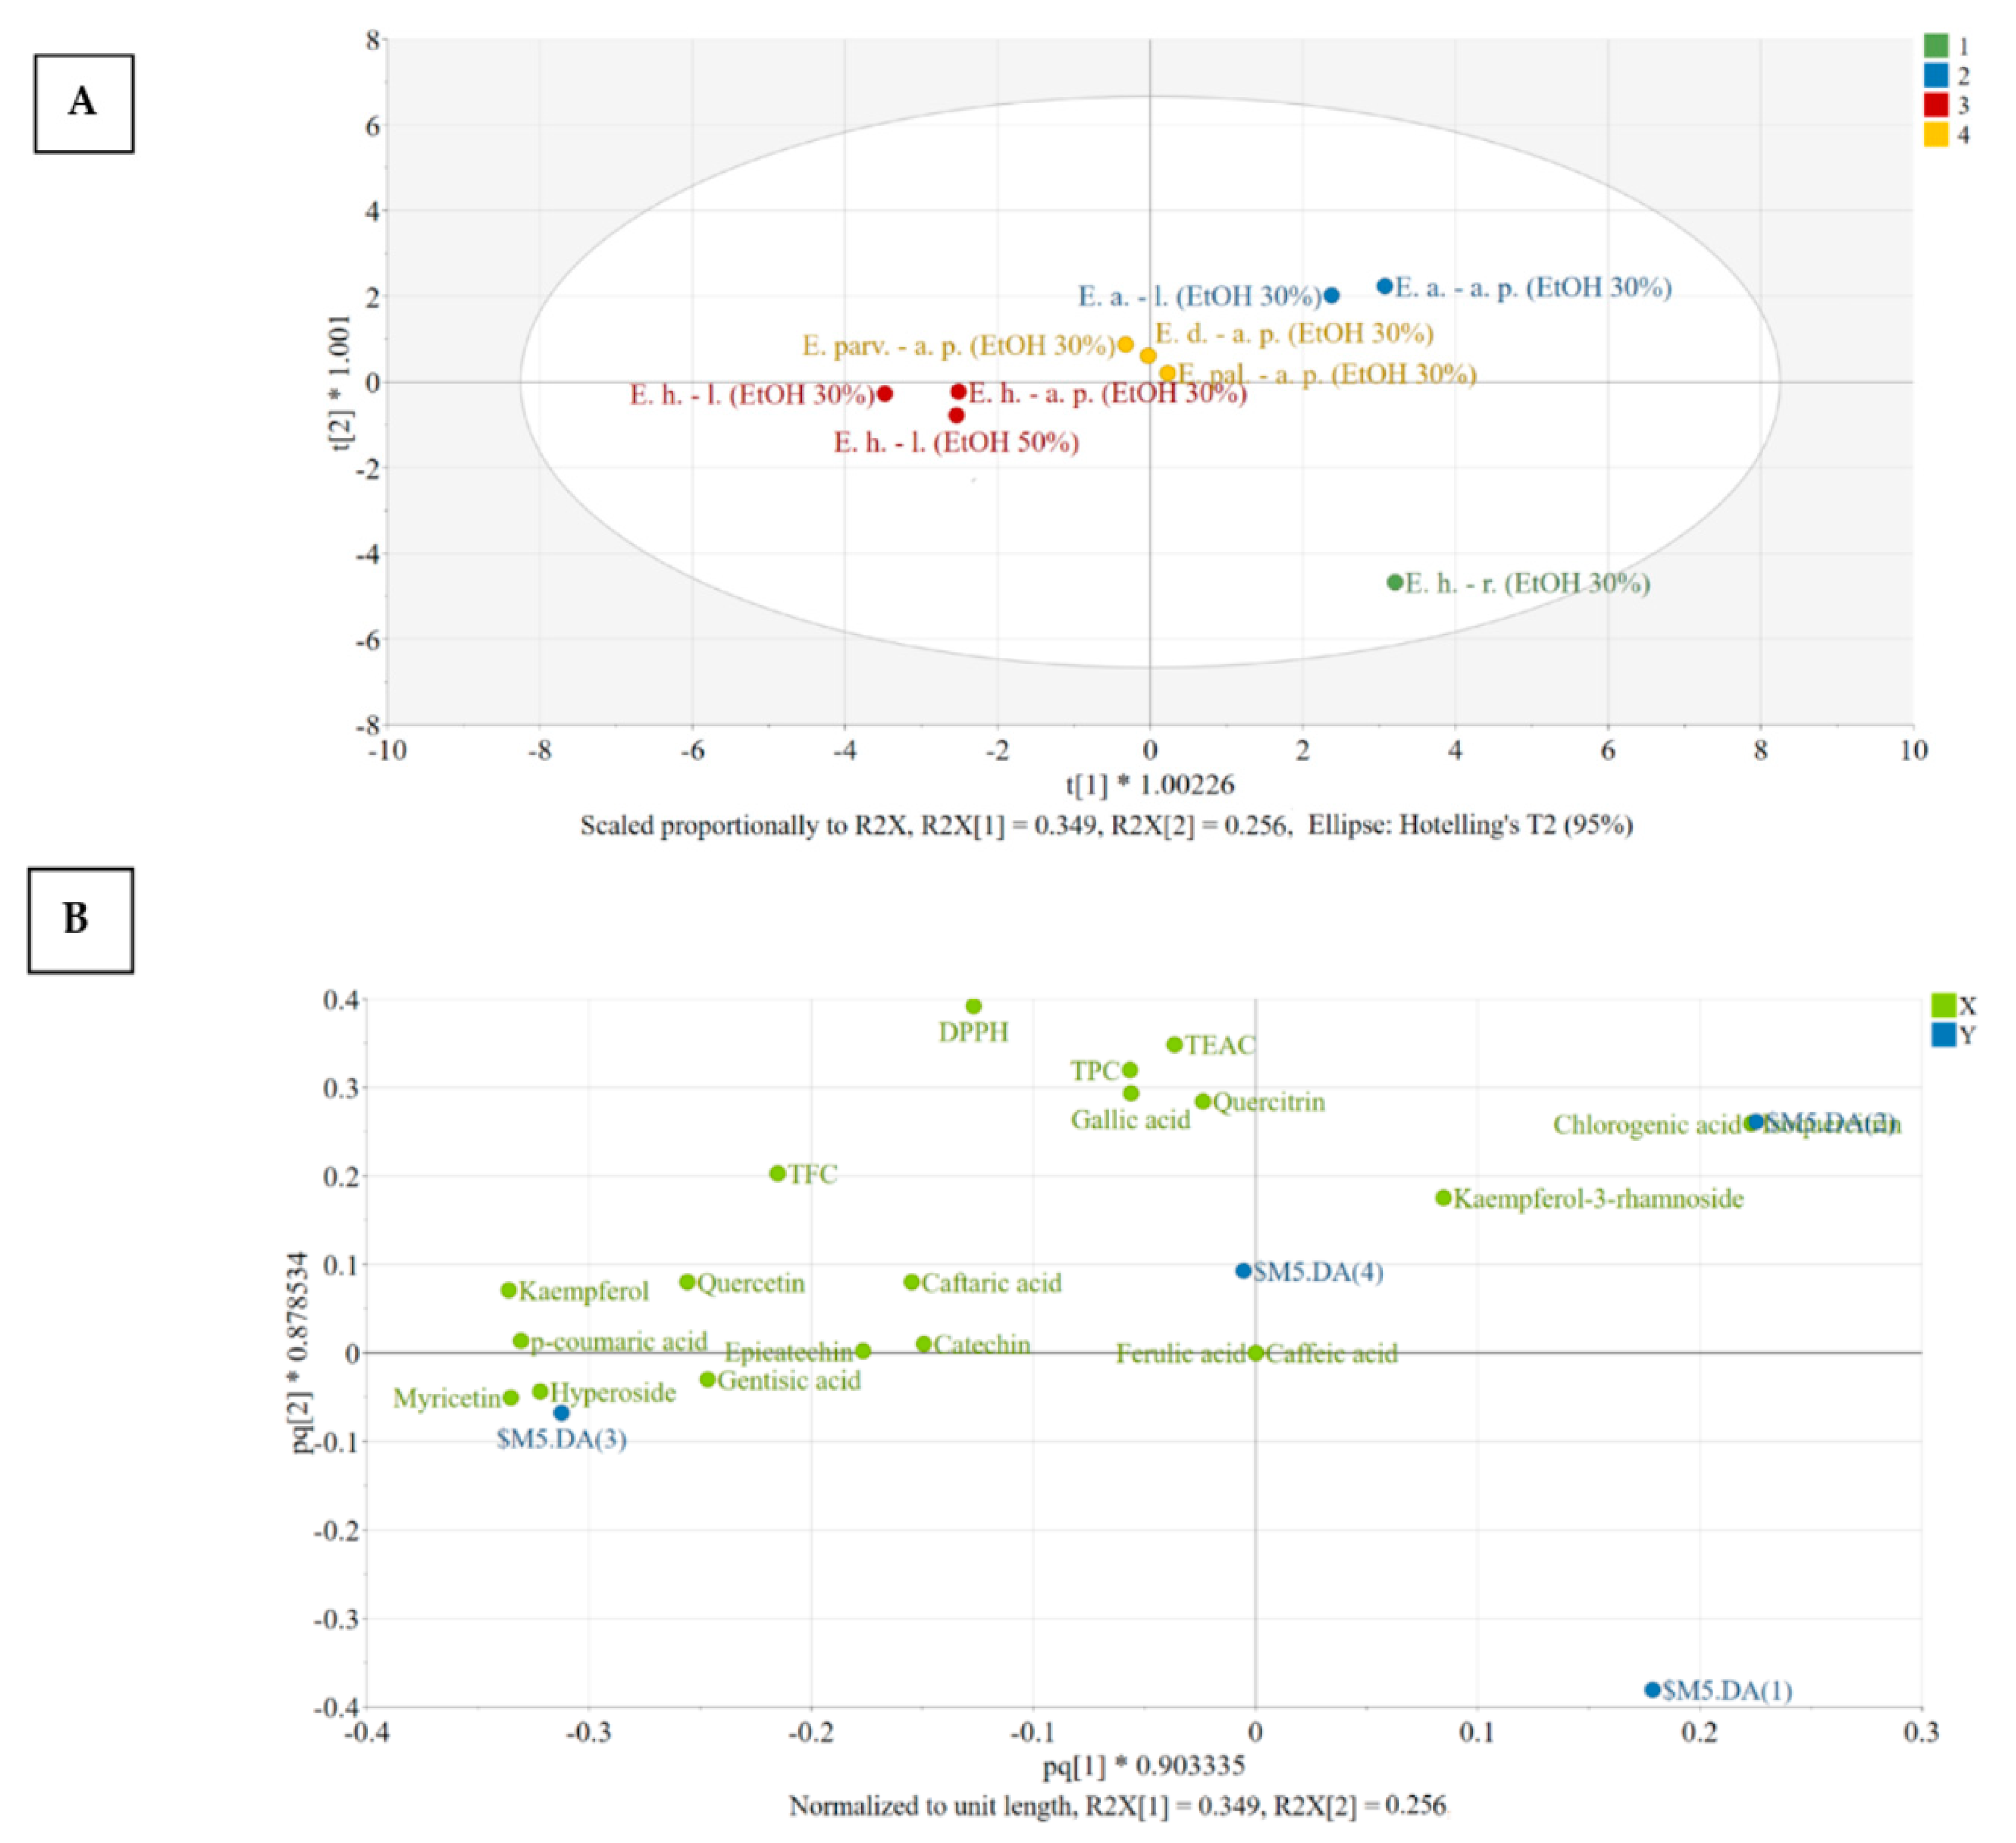
For interpretation purposes, the score and loading plots of the OPLS-DA model were generated (
Figure 3).
Figure 3A reveals the distribution of observations in the plane of the first two predictive score vectors of the model, whereas
Figure 3B explains the distribution found in the score plot. Extracts presenting a similar placement in the score plot have similar characteristics, whereas an increasing distance between points suggests increasing differences.
To understand the contribution of variables in class discrimination, the positioning of the X variables (green) in relation to each other and to the dummy variables (blue) was evaluated. A variable has a good discriminating power if it is positioned far from the origin and close to a certain dummy variable [
49,
50]. Clustering of different variables reveals a strong positive correlation. In this respect, chlorogenic acid and isoquercitrin correlated and are characteristic of the members of Class nr 2, both aerial parts and leaves of
E. angustifolium being characterized by large amounts of these constituents. Ferulic acid was absent from these extracts and caffeic acid could only be identified based on MS spectra, but not quantified (<LOQ), as they appear close to the origin of the loading plot.
Four distinct groups could be identified after PCA (
Figure 3A), namely:
Group 1: [E. hirsutum roots EtOH 30%]: the extract E. hirsutum roots has very low number of bioactive compounds and thus presents low activity, as can be seen from the positioning of the dummy variable ($M12.DA(1)). The dummy variable of group number 1 is found in the lower right quadrant of the loading scatter plot, having no other variables displaced in this region.
Group 2: [E. angustifolium aerial parts EtOH 30%; E. angustifolium leaves EtOH 30%]: the members of group 2 have large amounts of chlorogenic acid and isoquercitrin, above average amount of quercitrin, and antioxidant activity evaluated by TEAC and DPPH assays. In addition, this group presents lower than average amounts of the variables found in the opposite side of the plot, in the direction of the horizontal axis, namely: caftaric acid, gentisic acid, p-coumaric acid, hyperoside, and kaempferol.
Group 3: [E. hirsutum leaves EtOH 50%/EtOH 30%; E. hirsutum aerial parts EtOH 30%]: the members of group 3 have larger amounts of the variables found in the close region of $M12.DA(3) dummy variable, such as hyperoside, p-coumaric acid, kaempferol, quercetol, gentisic acid, and lower amount of kaempferol-3-rhamnoside.
Group 4: [E. dodonaei aerial parts EtOH 30%; E. parviflorum aerial parts EtOH 30%; E. palustre aerial parts EtOH 30%]: the members of group 4 have an above-average content of caftaric acid with variable content of quercitrin (E. dodonaei > E. parviflorum > E. palustre) and kaempferol-3-rhamnoside (E. dodonaei > E. parviflorum > E. palustre).
3.7. Antimicrobial and Antifungal Activity of the Optimized Epilobium sp. Extracts
Initial in vitro Qualitative Study (Screening)
Antimicrobial activity was evaluated using four Gram-positive bacterial strains, three Gram-negative, and one yeast strain. This initial step was designed to select the extracts with increased antimicrobial potential and the susceptibility of groups of micro-organisms. The antimicrobial activity against Gram-negative bacteria was absent and the evaluation further focused on Gram-positive and yeasts. An increased efficiency was observed against Gram-positive bacteria and yeasts, as observed in
Table 7. The potential against Gram-positive bacteria was moderate, with inhibition areas ranging from 8 to 15 mm, while for
Candida albicans, it was between 9.82 and 13.66 mm. The activity was increased against
Bacillus cereus strain, compared to the other Gram-positive strains and antibiotic positive control (amoxicillin).
In vitro Quantitative Evaluation
The initial screening demonstrated moderate antimicrobial potential against Gram-positive bacteria, and the quantitative antimicrobial potential using MIC method was tested in this second step. The MIC values ranged from 1/32 to 1/256, as observed in
Table 8, with good overall efficiency against
Bacillus cereus and
Enterococcus faecalis.
The presented results confirm the antimicrobial potential of
Epilobium species which was formerly investigated on various bacterial, fungal, and viral strains [
1,
19,
51]. Previous studies mainly focused on the antibacterial potential of
E. angustifolium extracts which proved to be efficient against Gram+ and Gram- bacteria; recent studies also confirmed the antimicrobial potential of
E. parviflorum and
E. hirsutum [
1,
16,
52,
53,
54].
E. angustifolium and
E. parviflorum extracts inhibited the growth of some fungi, including
Candida albicans. In addition to what was researched to date, the antimicrobial effect of
E. palustre and
E. dodonaei was evaluated, and for all five endemic
Epilobium species, this biological effect was assessed on ethanolic extracts (30%). For
E. hirsutum, the extracts of leaves with 30% and 50% ethanol in water were tested; the results were not significantly different except for the activity upon
Enterococcus fecalis, where
E. hirsutum leaves (EtOH 50%) displayed a higher inhibition diameter versus the EtOH 30% extract (9.65 mm vs. 6.62 mm).
3.8. In Vitro Biological Activity on Cell Lines
3.8.1. Anticancer Activity
The anticancer potential of the
Epilobium species extracts was evaluated on the LNCaP cancerous cells in parallel with normal human foreskin fibroblasts (BJ). This potential was firstly evaluated in a concentration range from 10 to 400 µg/mL in both cell types (
Figure 4). In general, a cytotoxic effect was observed starting from the dose of 25 µg/mL in both cell types; however, at higher doses, a large discrepancy was observed between the recorded viabilities of the cancerous and normal cell phenotypes. At the dose of 50 µg/mL, the recorded viabilities on the LNCaP cells varied from approximately 0 to 35%, while in the case of normal cells, the viability varied from 90 to 100% (
Figure 4). At the highest concentration tested of 400 µg/mL, the viability in the case of normal cells was between 25 and 45%, depending on the extract tested, with
E. dodonaei aerial parts (EtOH 30%) extract displaying the highest cytotoxicity. From the extracts tested,
E. dodonaei aerial parts (EtOH 30%) extract appeared to bear the highest cytotoxicity towards the cancerous cell phenotype, decreasing the cellular viability to approximately 20% at a dose of 25 µg/mL (
Figure 4 and
Figure 5).
For an easier comparison of biological potencies, IC
50 values were calculated for all extracts on both cell types (
Table 8). For the BJ cell line, the IC
50 was calculated based on the data obtained for the 10–400 µg/mL concentration range, while in the case of the LNCaP cells, the concentration range was adjusted to 2 to 80 µg/mL by further diluting the working solutions 1:5 in DMSO (
Figure 5). The values obtained indicate higher cytotoxicity for the cancerous cell line, the IC
50 for the cancerous cell line being 5 to 10 times lower than for their normal counterparts. In addition, the higher cytotoxic potency observed for
E. dodonaei aerial parts (EtOH 30%) extract was demonstrated, this extract having the IC
50 values of 18.38 µg/mL and 126.05 µg/mL for LNCaP and BJ cells, respectively (
Table 8). To evaluate if there is a statistical difference between the cytotoxic potencies of the extracts, an ANOVA 2-Way analysis was performed for each cell line, using as variables the type of the extract and the concentration tested and, as the response, the measured viability. Based on this analysis, the potency of the extracts was statistically different for almost all cases (no statistical difference for LNCaP cell line between
E. parviflorum aerial parts EtOH 30% vs.
E. angustifolium aerial parts EtOH 30% and
E. hirsutum leaves EtOH 30% vs
E. palustre aerial parts EtOH 30%; no statistically significant difference for BJ cell line between
E. hirsutum leaves EtOH 30% vs
E. hirsutum leaves EtOH 50%).
A selectively cytotoxic effect against cancerous cell phenotypes is mandatory for substances with possible antitumoral activity. In this regard, the ratios between the extrapolated IC
50 for cancerous and normal cells were calculated (
Table 9). Of the investigated extracts,
E. angustifolium aerial parts EtOH 30% had the highest selectivity toward killing cancerous cells, followed by
E. hirsutum aerial parts EtOH 30% extract. In the case of
E. angustifolium aerial parts EtOH 30%, the IC
50 obtained for normal cells was more than 10 times higher than the IC
50 obtained for LNCaP cells. Even though
E. dodonaei aerial parts EtOH 30% extract had the highest cytotoxicity toward both cell lines, the selectivity towards the cancerous cell phenotype was low.
The present findings are consistent with previous studies on this species, as
Epilobium preparations are traditionally recognized as a remedy for prostate impairment and numerous studies refer to this application [
7,
55]. The in vivo investigation of
E. parviflorum extracts on 5-α-reductase and aromatase activity showed that only the aqueous extract was active, and the following research led to the identification of oenothein B as active principle [
56,
57]. Nonetheless, in this study, a good antiproliferative effect was obtained for the ethanolic (30%) extract of
E. parviflorum (
Figure 4). Vitalone et al. (2003) observed a specific and significant anti-proliferative effect of
E. angustifolium,
E. hirsutum, and
E. tetragonum ethanolic extracts. However, the selectivity of the anti-proliferative effect on other tumor cells lines was investigated and its activity proved not to be prostate-specific [
58]. Stolarczyk et al. (2013) noticed a dose dependent inhibition of PSA secretion and arginase activity of aqueous extracts from
E. angustifolium,
E. parviflorum, and
E. hirsutum [
4]. On the other hand, the lack of information regarding oenothein B bioavailability makes it difficult to estimate its real role in the activity of extracts.
3.8.2. Antioxidant Activities
The antioxidant effects of the
Epilobium sp. extracts were evaluated on the normal fibroblast cells at three concentrations (10, 25, and 50 µg/mL) that did not induce significant toxicities after an exposure of 24 h. The antioxidant activities were evaluated in two conditions, namely H
2O
2-stimulated and non-stimulated conditions. In non-stimulated conditions, exposure to the extracts induced a statistical decrease in ROS that was in almost all cases dose-dependent (
Figure 6). In comparison with the positive control (NAC), the antioxidant properties of the extracts were more modest; no extract, independent of the dose tested, displayed a capacity to neutralize ROS such as NAC. In stimulated conditions, exposure of BJ to H
2O
2 resulted in an approximately 2.5-times increase in the quantity of ROS, while pre-incubation with the antioxidant NAC partially mitigated this increase (1.5-times increase). Similar to the results obtained in non-stimulated conditions, the
Epilobium sp. extracts presented an antioxidant potential, and exposure to the extracts resulted in a dose-dependent decrease in ROS. From the extracts evaluated,
E. hirsutum leaves EtOH 30% and
E. hirsutum aerial parts EtOH 30% displayed the highest potency, decreasing ROS at 50 µg/mL in stimulated conditions at the level observed for the positive control.
To date, no data could be found in the scientific literature regarding the antioxidant potential of
E. palustre and
E. dodonaei, the current study being the first to report this biological activity for these species. Regarding
E. hirsutum,
E. parviflorum, and
E. angustifolium extracts activity, this study was the first to evaluate the antioxidant potential using the 2,7 dichloro-fluorescein diacetate (DCFH-DA) assay on the normal BJ cell phenotype. Merighi et al. (2021) reported that
E. parviflorum extract at 1 µg/µL and 0.1 µg/µL concentrations significantly decreased the H
2DCF-DA absorbance increased by LPS in RAW 264.7 macrophage murine cells, supporting the antioxidant property of this species [
22]. Previous studies confirmed various mechanisms for the antioxidant potential of
E. angustifolium extracts, such as its protective role on stress-induced fibroblast senescence after exposure to ultraviolet (UV) radiation, this effect having a major contribution in skin’s photoprotection [
13]. Karakurt et al. (2013) evaluated the antioxidant activity of
E. hirsutum in vivo in a preclinical study performed on rats and showed a statistically significant increase in the activity of antioxidant enzymes (NADPH quinine oxireductase 1 and glutathione peroxidase), but the lack of extract standardization hinders discussion of the results, since the correlation with active compounds is not well defined [
59]. So far, numerous studies determined the free radical scavenging activity in cell-free systems, but only a few took into consideration the effect of
Epilobium extracts on ROS production in cellular models; this fact highlights the importance of the obtained results. Previous studies on the antioxidant capacity of willow herb extracts were correlated with the total phenolic content determination, and in a few cases, the extracts were characterized phytochemically in detail [
1].
3.8.3. Anti-Inflammatory Potential
The anti-inflammatory effects of the
Epilobium sp. extracts were evaluated by measuring the levels of two pro-inflammatory cytokines (IL-6, and IL-8) in an LPS inflammation-induced cellular model. The inflammation was induced in BJ cells by exposing the cells to lipopolysaccharides (LPS) isolated from
E. coli. Exposure of BJ cells to 100 ng/mL LPS resulted in a robust pro-inflammatory response, the levels of IL-6 and IL-8 increasing approximately 7-times and 17-times, respectively (
Table 10 and
Table 11,
Figure 7 and
Figure 8, respectively). The anti-inflammatory activities of the eight extracts were further evaluated in this inflammation model by co-incubating for 24 h the cells with the extracts at non-cytotoxic doses and LPS.
All eight extracts displayed anti-inflammatory effects, effects that were in almost all cases dose-dependent. All extracts presented anti-inflammatory properties starting from the lowest dose of 10 µg/mL, decreasing the level of IL-6 and IL-8 by approximately 25%. This effect was accentuated by the exposure dose: at the highest tested dose, the extracts decreased the levels of the two cytokines by approximately 50% in the case of IL-6, and 75% in the case of IL-8. Besides the dose-dependency of this effect, we evaluated the difference between the extracts. A Two-Way ANOVA analysis with the dose and the extract type as variables and the levels of the two cytokines as the measurement outcome was performed. Data analysis indicated that there are differences between the potencies of the extracts (p < 0.001); however, pairwise comparisons indicated statistical differences only in half of the comparisons. Based on the IL-6 and IL-8 levels, E. dodonaei aerial parts EtOH 30% and E. angustifolium leaves EtOH 30% extracts displayed the highest anti-inflammatory potential.
Previous studies evaluated the capacity of
Epilobium sp. to ameliorate inflammatory response in various in vitro models. Kiss et al. (2011) investigated the role of oenothein B in relation to the antioxidant activity of
E. hirsutum,
E. parviflorum, and
E. angustifolium and concluded that extracts inhibited the activity of lipoxygenase (IC
50 around 25 mu g/mL) and inhibited the release of myeloperoxidase release from stimulated neutrophils [
45]. Jung et al. (2021) evaluated the potential of
E. pyrriocholophum hydroalcoholic extract to exert an anti-inflammatory effect in a chronic obstructive pulmonary disease model. The results showed that extracts of this species are capable of suppressing elevated IL-6 and IL-8 mRNA in a concentration-dependent manner [
60]. Gunes at al. (2021) investigated the effects of
E. hirsutum aerial parts and roots on human prostate cancer PC3 cell line. Their findings showed that extracts of this species decreased the gene expression of IL-8 and NF-κB but increased the gene expression of IL-6 [
21]. A possible explanation could be that this cytokine can display both anti-inflammatory and pro-inflammatory effects, depending on experimental condition and tissue [
61].
To the best of our knowledge, this was the first study to explore the anti-inflammatory effect of E. hirsutum, E. parviflorum, E. palustre, E. dodonaei, and E. angustifolium in an LPS inflammation-induced cellular model by direct measurement of IL-6 and IL-8 levels. The current results support the use of Epilobium species in BPH, prostatitis, bladder, kidney, and urinary tract diseases, pathologies which are commonly associated with inflammatory processes.


 ,
, 


