
The Relation between Physiological Parameters and Colour Modifications in Text Background and Overlay during Reading in Children with and without Dyslexia

 ,
,  , and
, and
Abstract
1. Introduction
2. Materials and Methods
2.1. Subjects
2.2. Experiment Setup
2.3. Experiment Design
2.3.1. Data Processing
2.3.2. Statistical Analysis
3. Results
3.1. White (Default) Background—Reading Performance Results
3.2. Modifications in Background and Overlay Colours—Reading Performance Results
4. Discussion
4.1. Summary
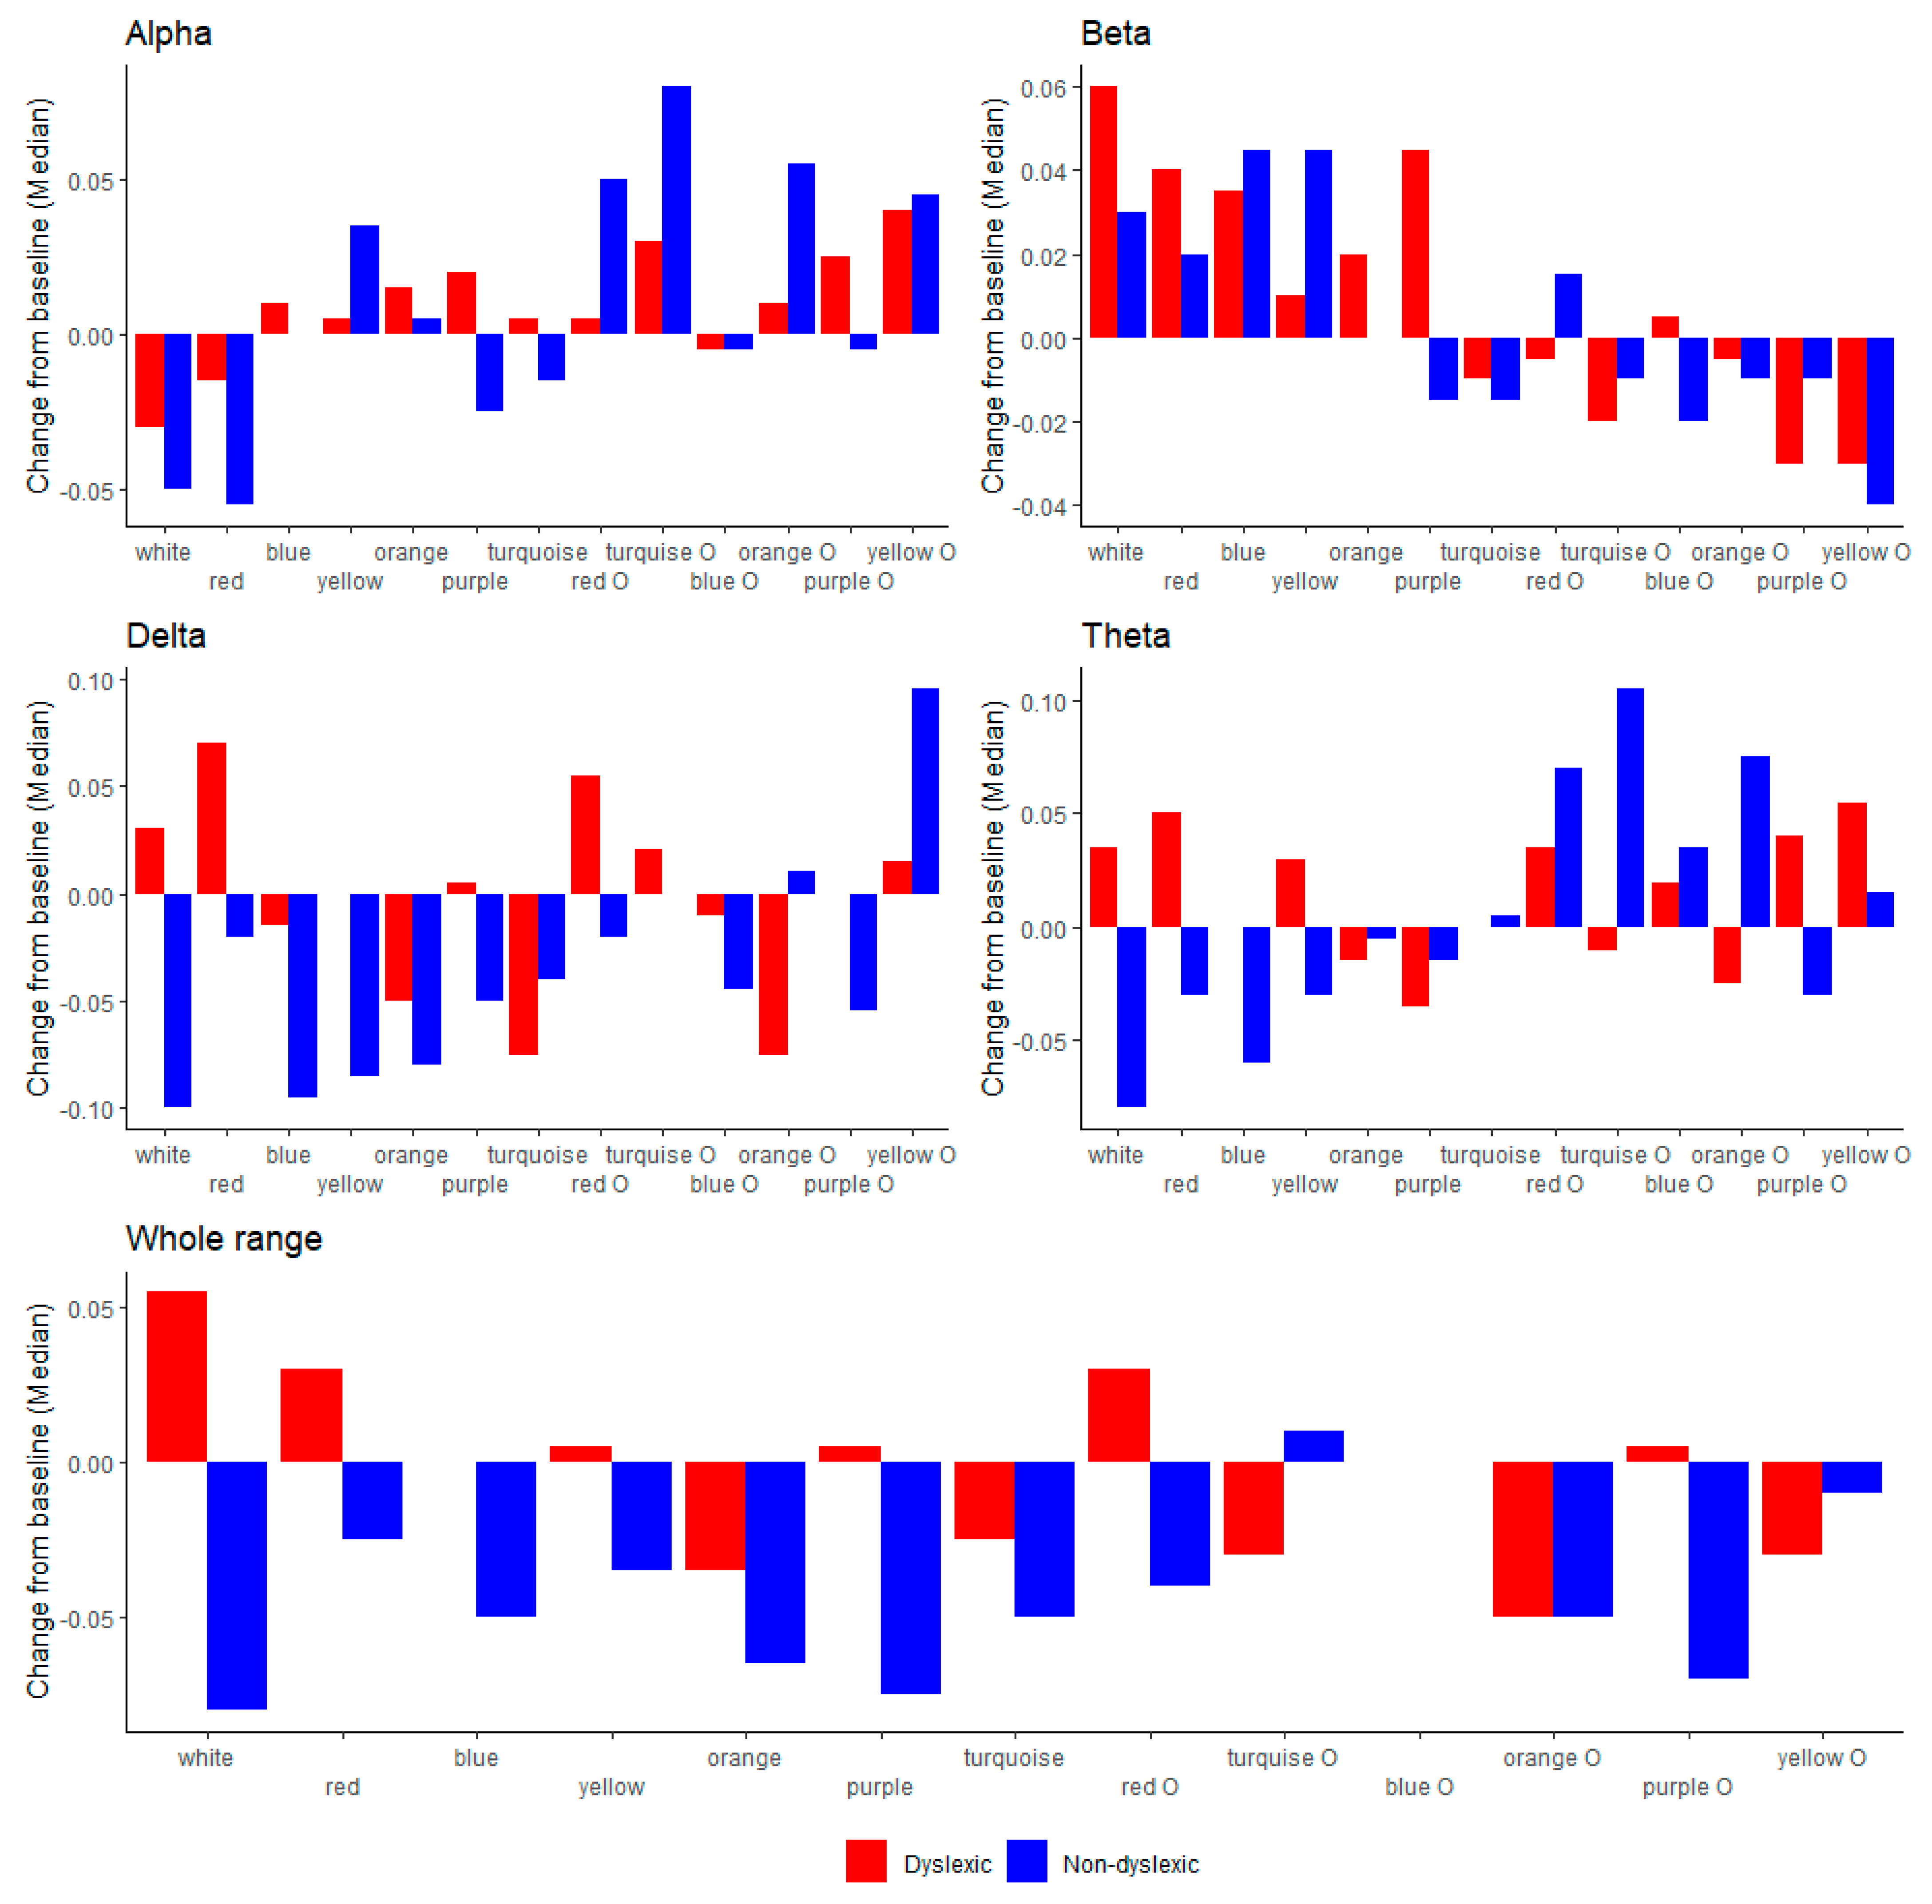
4.2. EEG Parameters
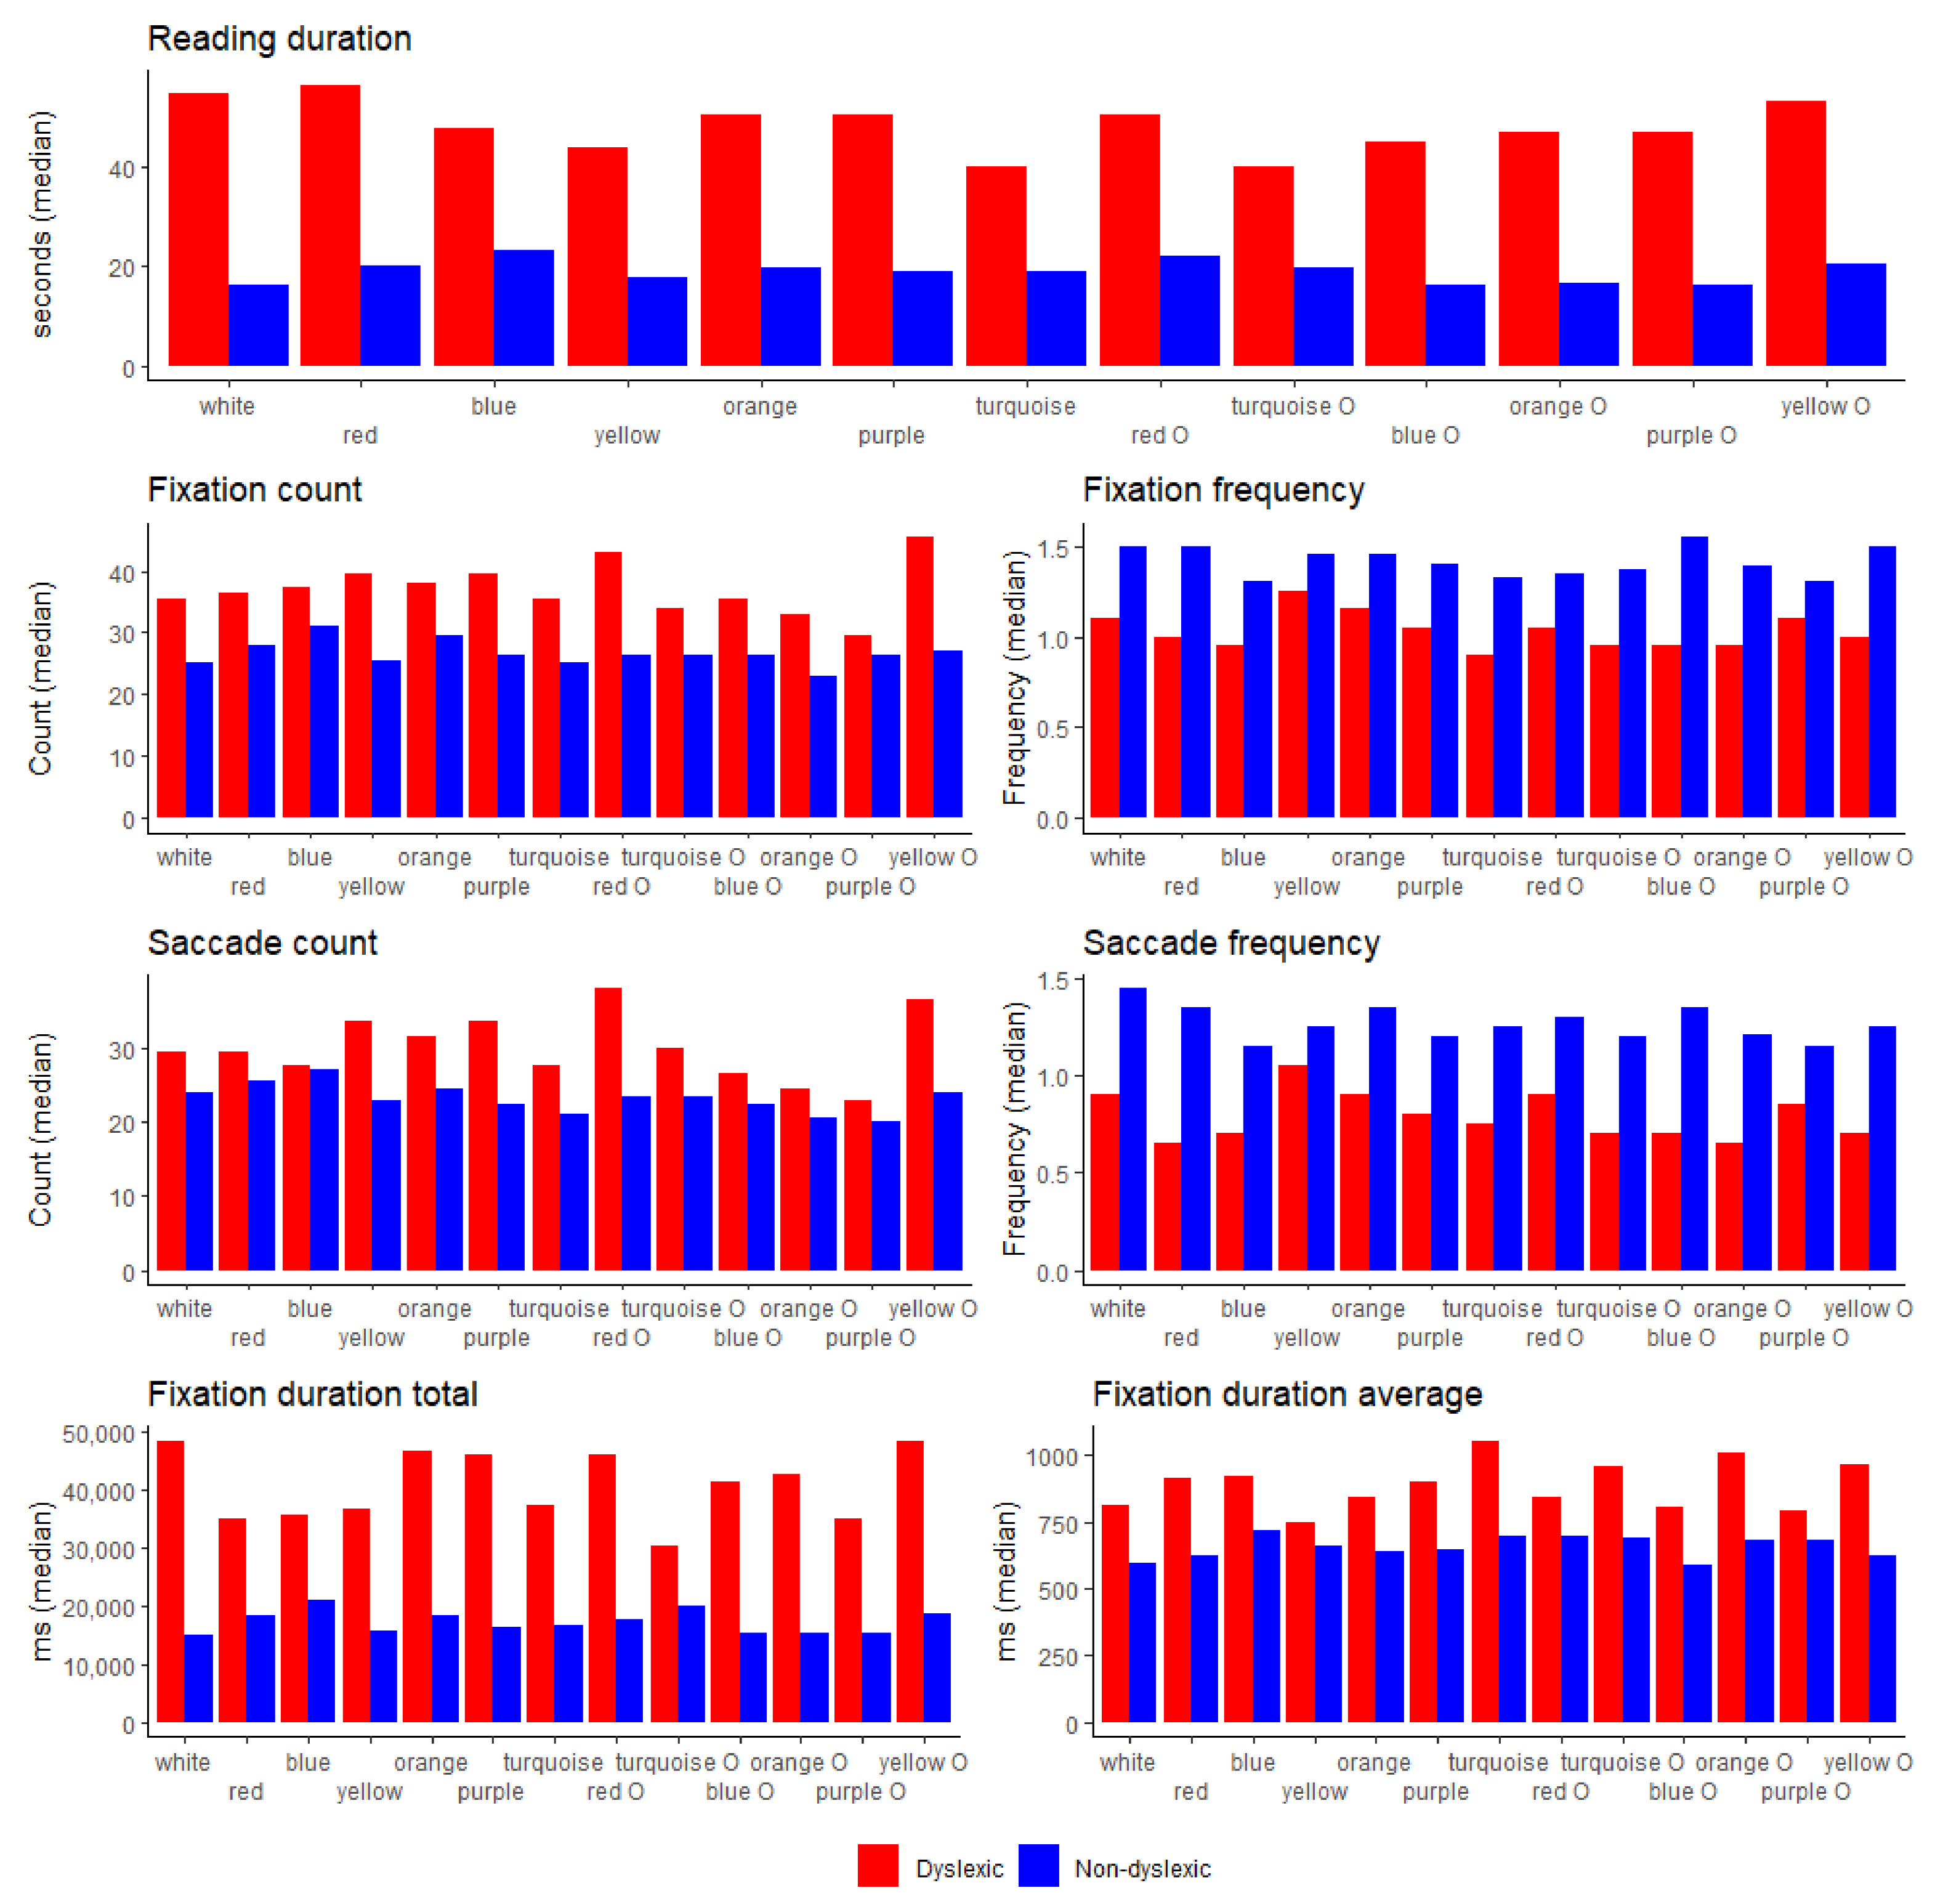
4.3. Eye-Tracking Parameters
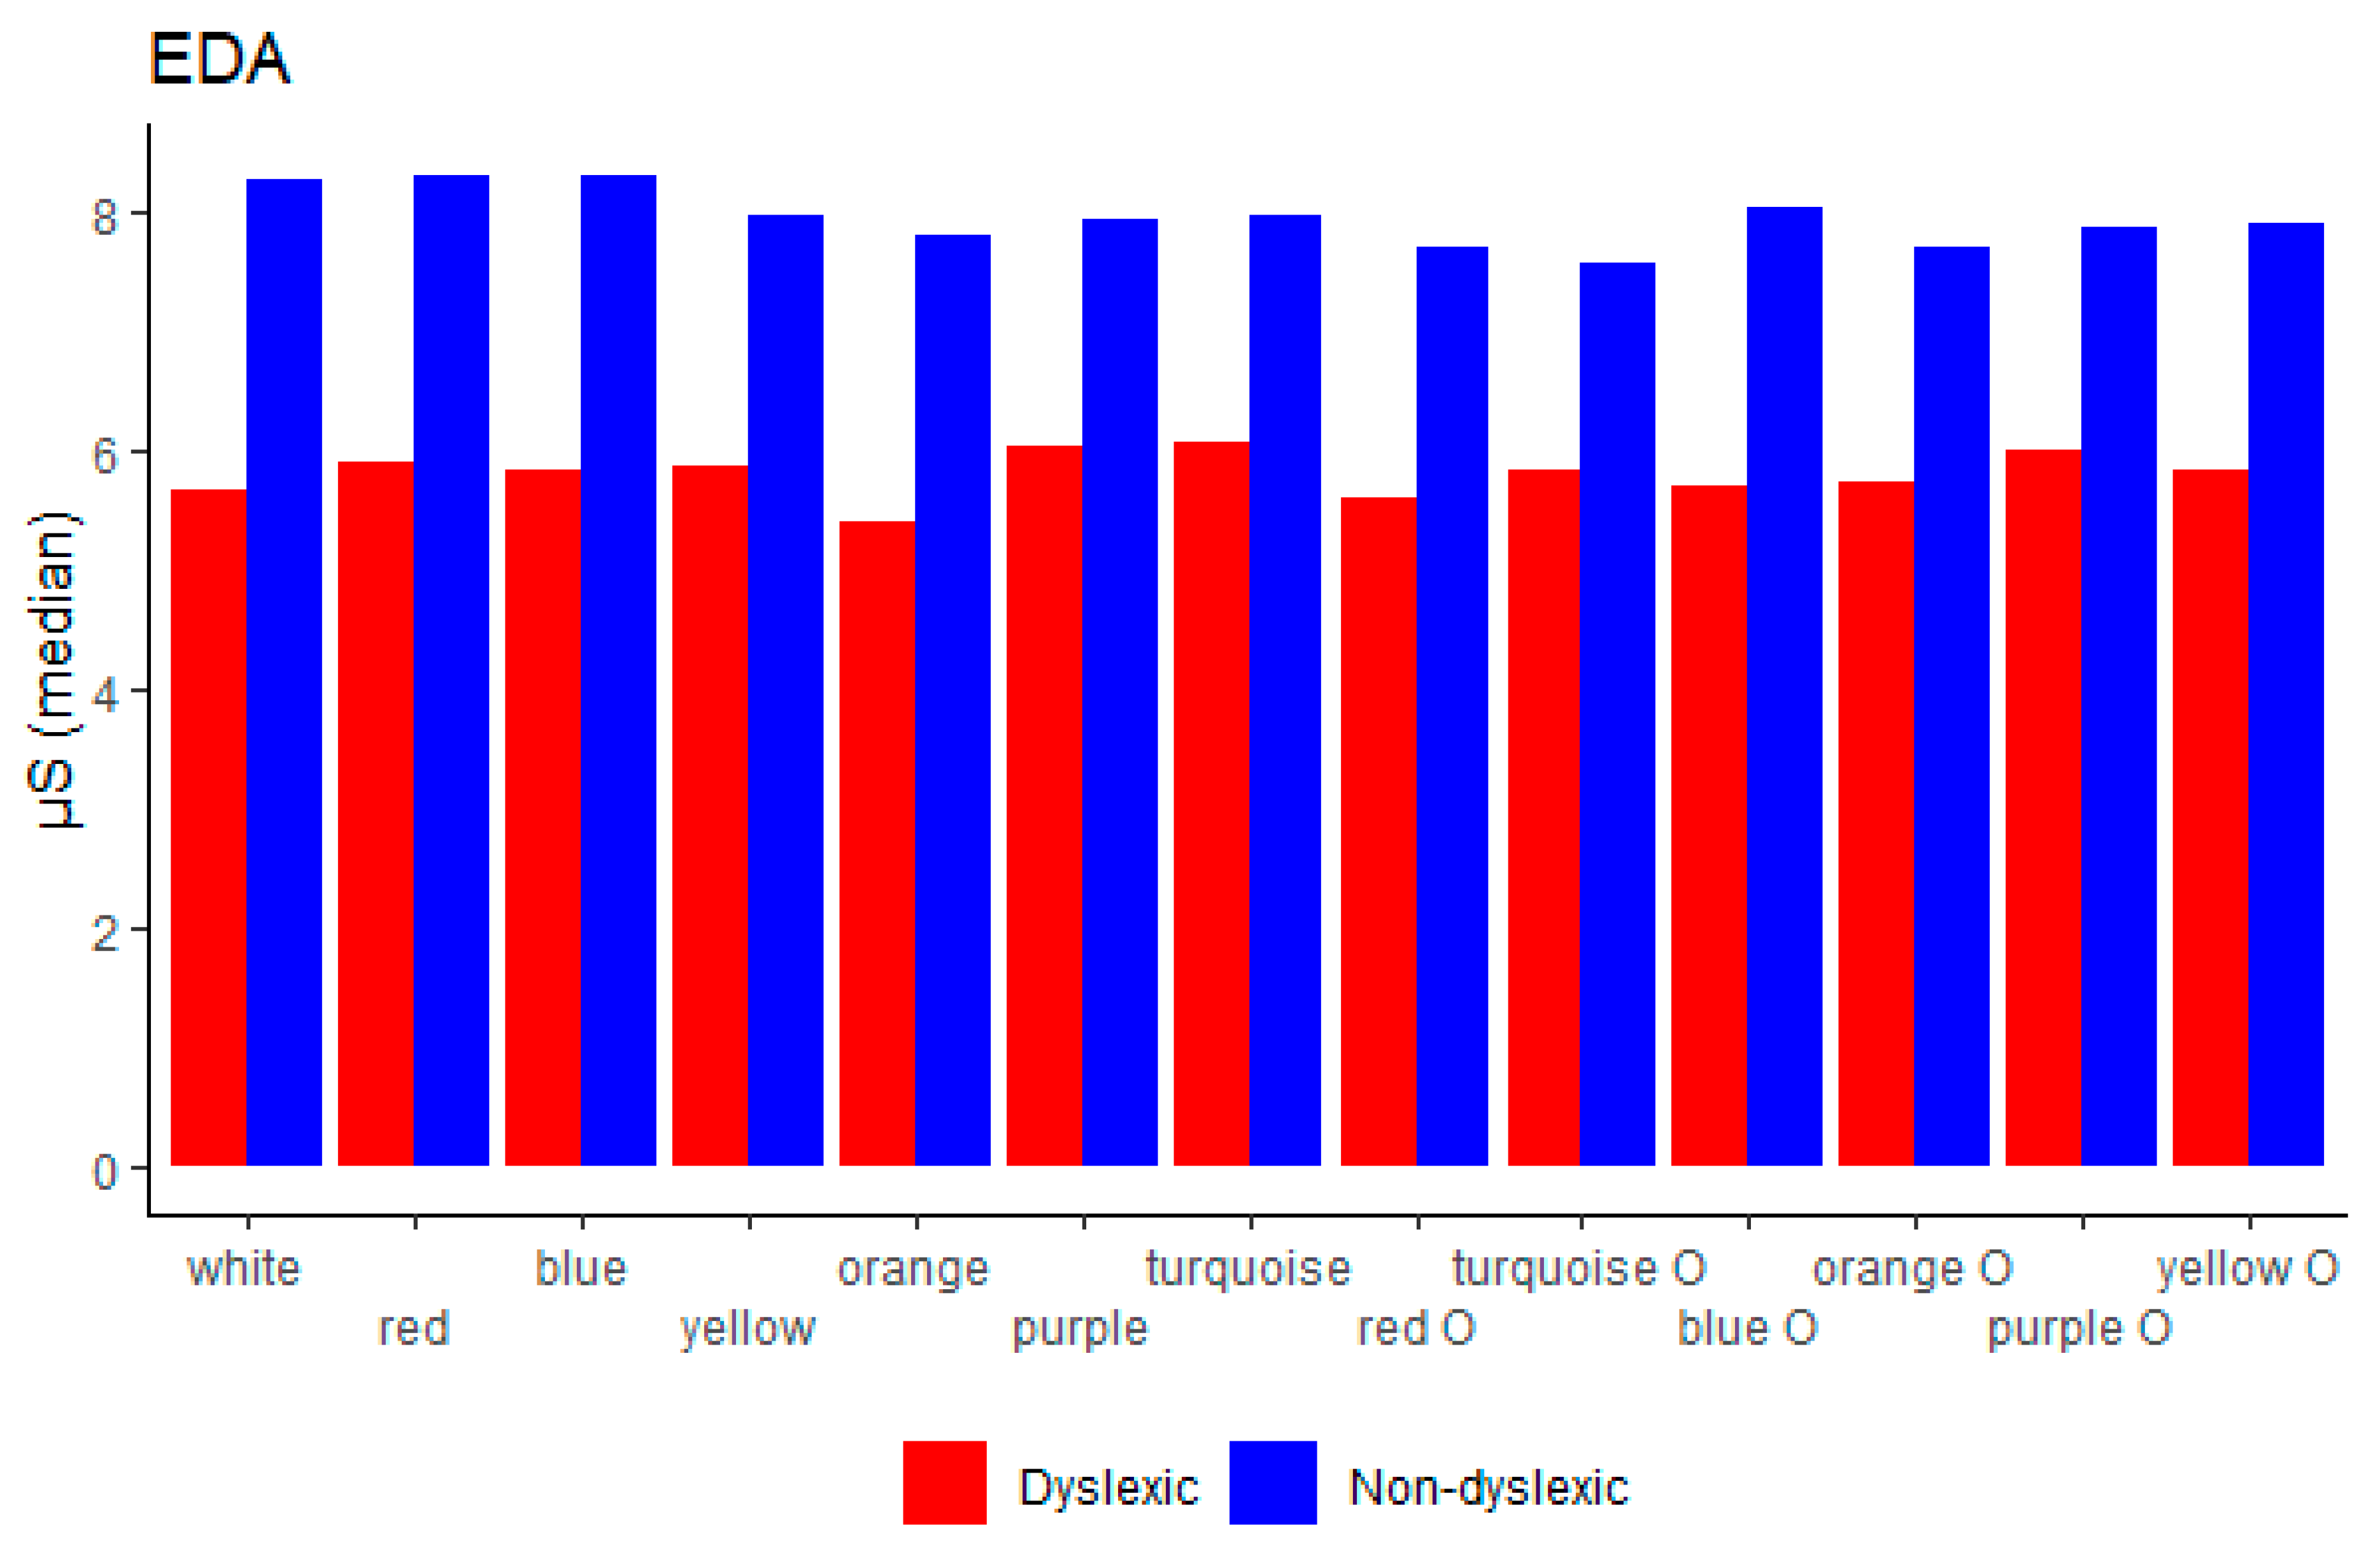
4.4. EDA
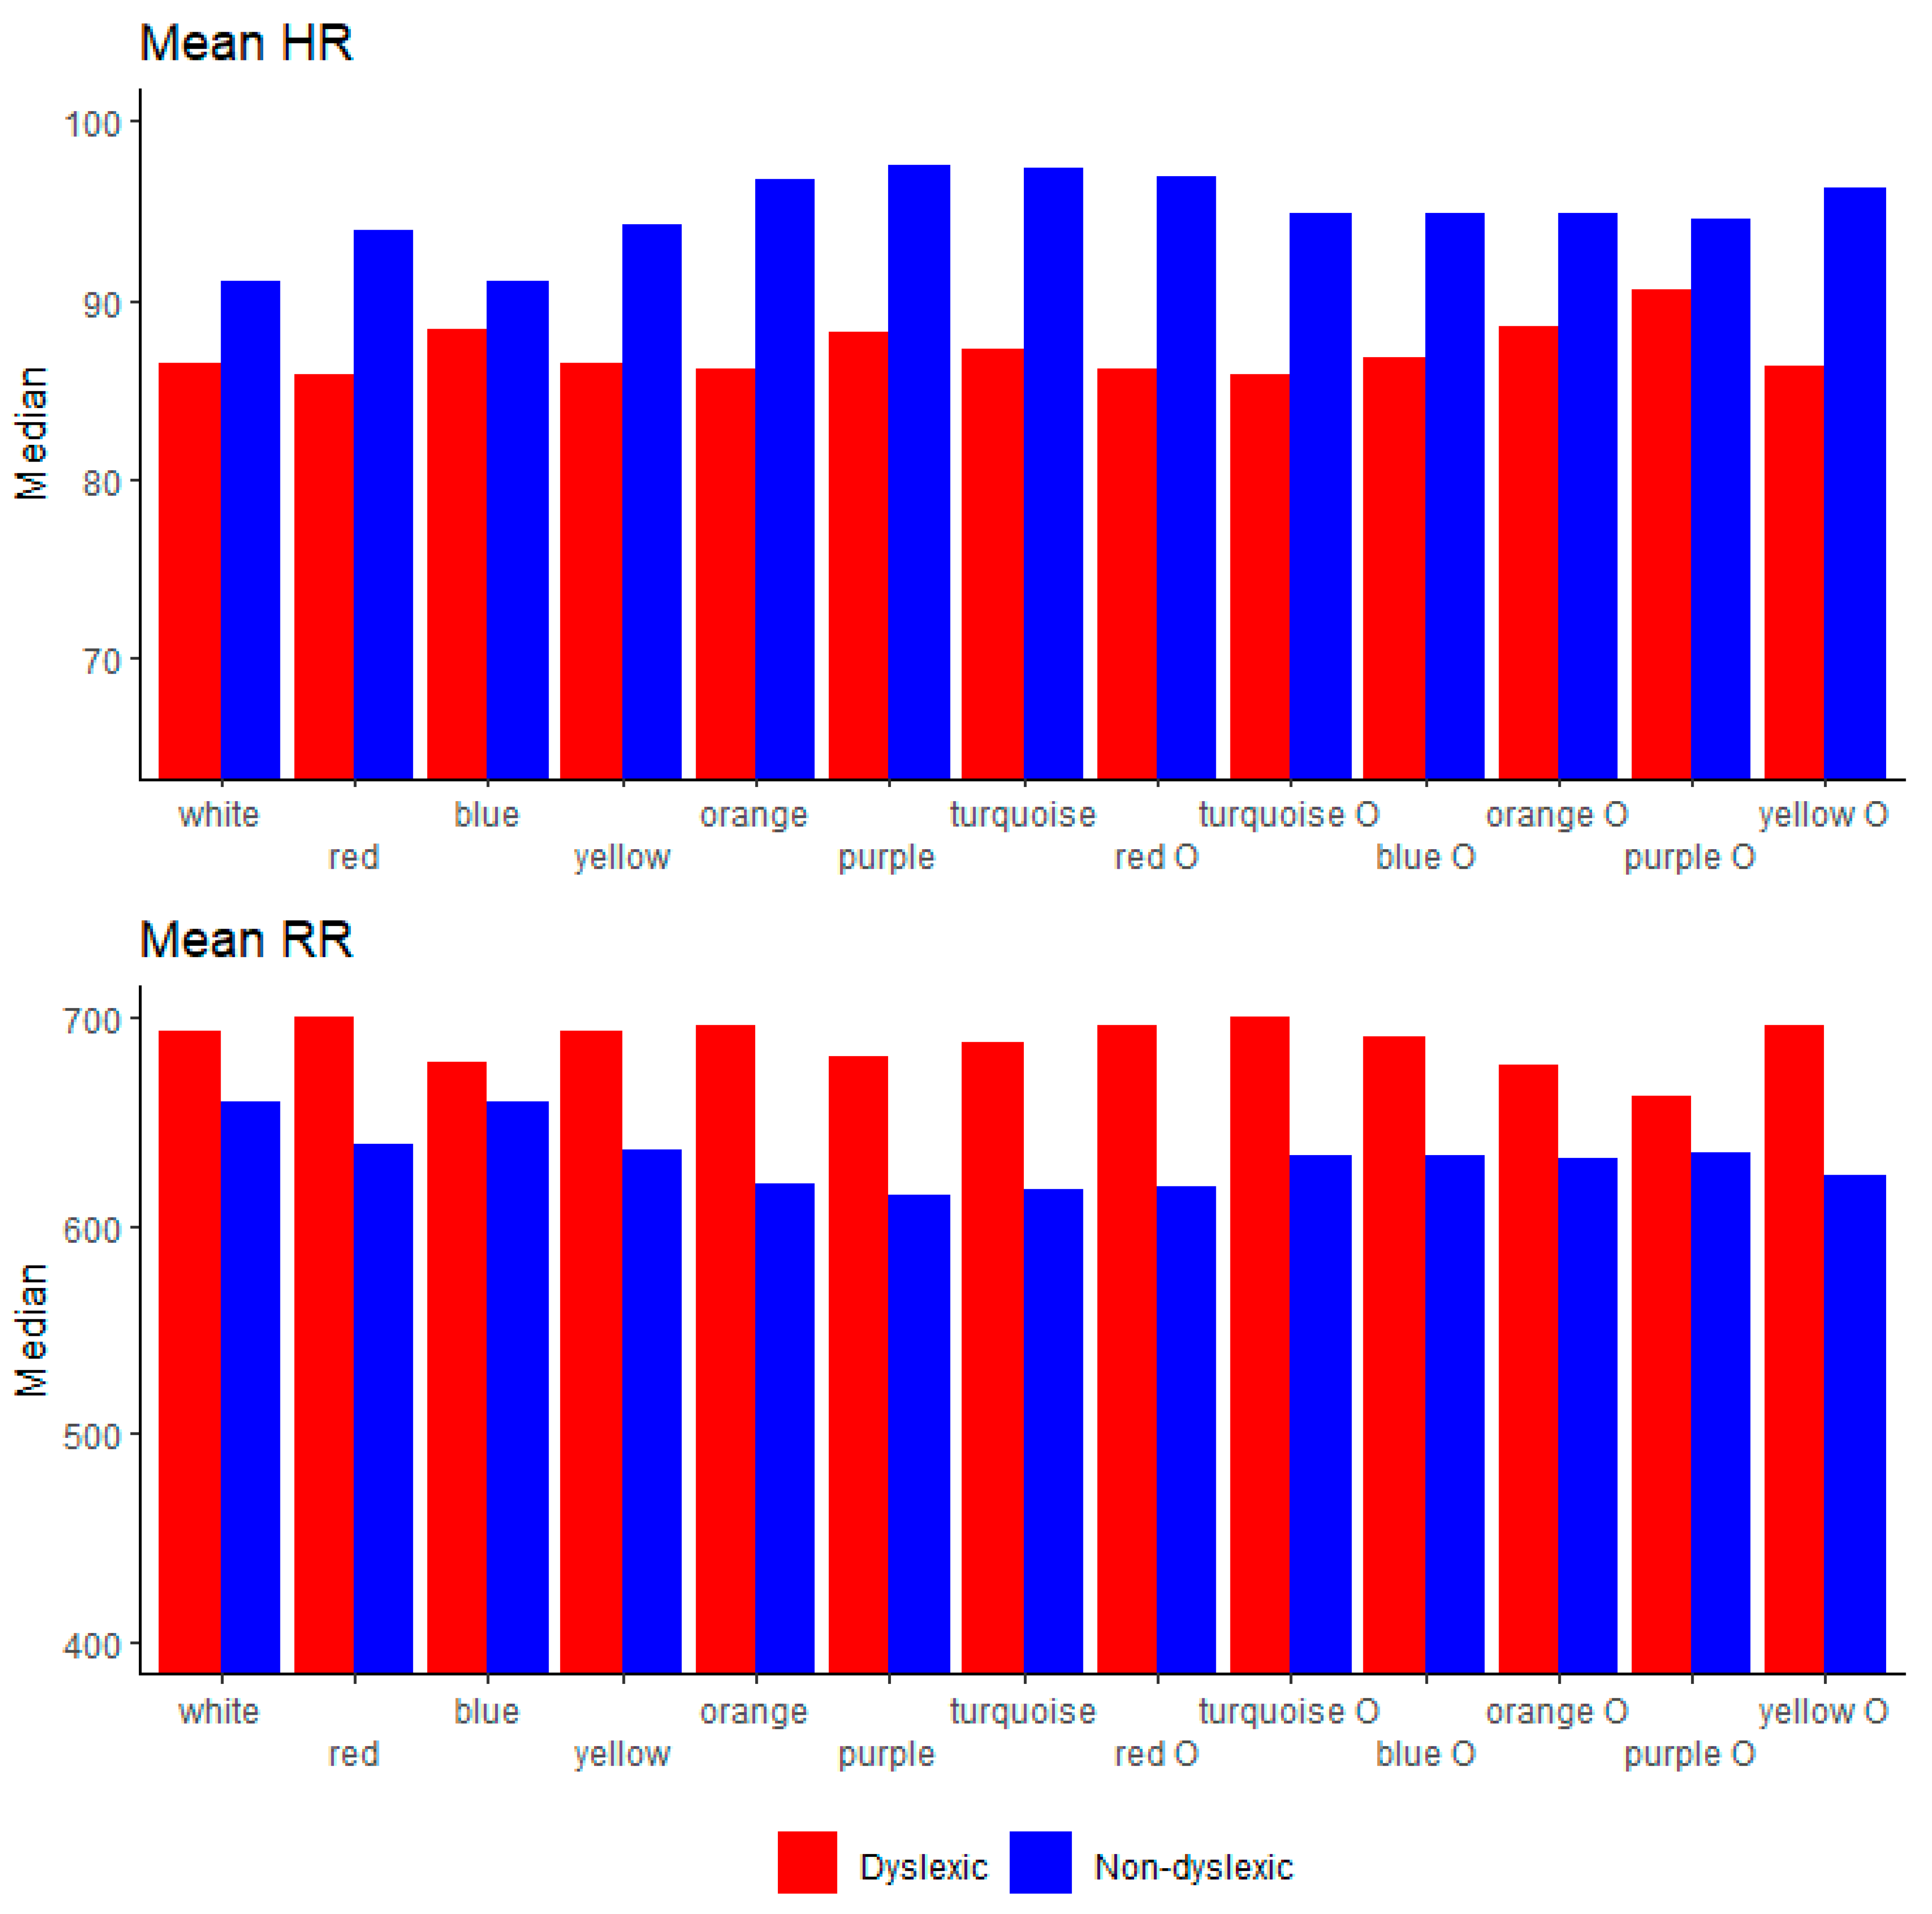
4.5. HRV Parameters
4.6. Colours Impact on Overall Measures
5. Conclusions
Supplementary Materials
Author Contributions
Funding
Institutional Review Board Statement
Informed Consent Statement
Data Availability Statement
Acknowledgments
Conflicts of Interest
References
- Dyslexia Information Page|National Institute of Neurological Disorders and Stroke. Available online: https://www.ninds.nih.gov/Disorders/All-Disorders/Dyslexia-Information-Page (accessed on 26 February 2021).
- Shaywitz, S.E.; Shaywitz, B.A. Paying Attention to Reading: The Neurobiology of Reading and Dyslexia. Dev. Psychopathol. 2008, 20, 1329–1349. [Google Scholar] [CrossRef]
- Shaywitz, S.E.; Shaywitz, B.A. Dyslexia (Specific Reading Disability). Biol. Psychiatry 2005, 1301–1309. [Google Scholar] [CrossRef]
- Benfatto, M.N.; Seimyr, G.Ö.; Ygge, J.; Pansell, T.; Rydberg, A.; Jacobson, C. Screening for Dyslexia Using Eye Tracking during Reading. PLoS ONE 2016, 11. [Google Scholar] [CrossRef]
- World Federation of Neurology (WFN). Report of Research Group on Dyslexia and World Illiteracy; WFN: Dallas, TX, USA, 1968. [Google Scholar]
- Peterson, R.L.; Pennington, B.F. Developmental Dyslexia. Lancet 2012, 379, 1997–2007. [Google Scholar] [CrossRef]
- Shaywitz, B.A.; Shaywitz, S.E.; Blachman, B.A.; Pugh, K.R.; Fulbright, R.K.; Skudlarski, P.; Mencl, W.E.; Constable, R.T.; Holahan, J.M.; Marchione, K.E.; et al. Development of Left Occipitotemporal Systems for Skilled Reading in Children after a Phonologically-Based Intervention. Biol. Psychiatry 2004, 55, 926–933. [Google Scholar] [CrossRef] [PubMed]
- Vaughn, S.; Cirino, P.T.; Wanzek, J.; Wexler, J.; Fletcher, J.M.; Denton, C.D.; Barth, A.; Romain, M.; Francis, D.J. Response to Intervention for Middle School Students with Reading Difficulties: Effects of a Primary and Secondary Intervention. School Psychology Review. Natl. Assoc. Sch. Psychol. 2010, 3–21. [Google Scholar] [CrossRef]
- Alexander-Passe, N. How Dyslexic Teenagers Cope: An Investigation of Self-Esteem, Coping and Depression. Dyslexia 2006, 12, 256–275. [Google Scholar] [CrossRef] [PubMed]
- Long, L.; Macblain, S.; Macblain, M. Supporting Students with Dyslexia at the Secondary Level: An Emotional Model of Literacy. J. Adolesc. Adult Lit. 2007, 51, 124–134. [Google Scholar] [CrossRef]
- Gabrieli, J.D.E. Dyslexia: A New Synergy between Education and Cognitive Neuroscience. Science 2009, 280–283. [Google Scholar] [CrossRef]
- Department of Education Northern Ireland. Code of Practice on the Identification and Assessment of Special Educational Needs; The Department of Education Northern Ireland: Bangor, UK, 1998. [Google Scholar]
- Department of Education Northern Ireland. The Special Educational Needs and Disability (North Ireland) Order 2005; The Stationery Office: Belfast, UK, 2005. [Google Scholar]
- Čolić, G.R. Early Dyslexia and Dysgraphia Indicators. Ph.D. Thesis, University of Belgrade, Belgrade, Serbia, 2018. [Google Scholar]
- Snowling, M.J. Early Identification and Interventions for Dyslexia: A Contemporary View. J. Res. Spec. Educ. Needs 2013, 13, 7–14. [Google Scholar] [CrossRef]
- Lyytinen, H.; Erskine, J.; Ahonen, T.; Aro, M.; Eklund, K.; Guttorm, T.; Hintikka, S.; Hamalainen, J.; Ketonen, R.; Laakso, M.L.; et al. Early Identification and Prevention of Dyslexia: Results from a Prospective Follow-up Study of Children at Familial Risk for Dyslexia. In The SAGE Handbook of Dyslexia; SAGE Publications, Inc.: Thousand Oaks, CA, USA, 2008; pp. 121–146. [Google Scholar] [CrossRef]
- Carroll, J.M.; Solity, J.; Shapiro, L.R. Predicting Dyslexia Using Prereading Skills: The Role of Sensorimotor and Cognitive Abilities. J. Child Psychol. Psychiatry Allied Discip. 2016, 57, 750–758. [Google Scholar] [CrossRef]
- Ferrer, E.; Shaywitz, B.A.; Holahan, J.M.; Marchione, K.; Shaywitz, S.E. Uncoupling of Reading and Iq over Time: Empirical Evidence for a Definition of Dyslexia. Psychol. Sci. 2010, 21, 93–101. [Google Scholar] [CrossRef]
- Habib, M. The Neurological Basis of Developmental Dyslexia. An Overview and Working Hypothesis. Brain 2000, 123, 2373–2399. [Google Scholar] [CrossRef] [PubMed]
- Sandak, R.; Mencl, W.E.; Frost, S.J.; Pugh, K.R. The Neurobiological Basis of Skilled and Impaired Reading: Recent Findings and New Directions. Sci. Stud. Read. 2004, 8, 273–292. [Google Scholar] [CrossRef]
- Jakovljević, T.; Janković, M.M.; Savić, A.M.; Soldatović, I.; Todorović, P.; Jere Jakulin, T.; Papa, G.; Ković, V. The Sensor Hub for Detecting the Developmental Characteristics in Reading in Children on a White vs. Colored Background/Colored Overlays. Sensors 2021, 21, 406. [Google Scholar] [CrossRef]
- Valdez, P.; Mehrabian, A. Effects of Color on Emotions. J. Exp. Psychol. Gen. 1994, 123, 394–409. [Google Scholar] [CrossRef] [PubMed]
- Wilkins, A. Reading Through Colour; John Wiley and Sons, Inc.: West Sussex, UK, 2003. [Google Scholar]
- Jansky, J.J. A Case of Severe Dyslexia with Aphasic-like Symptoms. Bull. Orton Soc. 1958, 8, 8–11. [Google Scholar] [CrossRef]
- Kruk, R.; Sumbler, K.; Willows, D. Visual Processing Characteristics of Children with Meares-Irlen Syndrome. Ophthalmic Physiol. Opt. 2008, 28, 35–46. [Google Scholar] [CrossRef] [PubMed]
- Johnson, S.P. How Infants Learn About the Visual World. Cogn. Sci. 2010, 34, 1158–1184. [Google Scholar] [CrossRef]
- Scott, L.; McWhinnie, H.; Taylor, L.; Stevenson, N.; Irons, P.; Lewis, E.; Evans, M.; Evans, B.; Wilkins, A. Coloured Overlays in Schools: Orthoptic and Optometric Findings. Ophthalmic Physiol. Opt. 2002, 22, 156–165. [Google Scholar] [CrossRef]
- Singleton, C.; Trotter, S. Visual Stress in Adults with and without Dyslexia. J. Res. Read. 2005, 28, 365–378. [Google Scholar] [CrossRef]
- Singleton, C.; Henderson, L.M. Computerized Screening for Visual Stress in Children with Dyslexia. Dyslexia 2007, 13, 130–151. [Google Scholar] [CrossRef] [PubMed]
- Henderson, L.M.; Tsogka, N.; Snowling, M.J. Questioning the Benefits That Coloured Overlays Can Have for Reading in Students with and without Dyslexia. J. Res. Spec. Educ. Needs 2013, 13, 57–65. [Google Scholar] [CrossRef]
- Ritchie, S.J.; della Sala, S.; McIntosh, R.D. Irlen Colored Overlays Do Not Alleviate Reading Difficulties. Pediatrics 2011, 128. [Google Scholar] [CrossRef] [PubMed]
- Galuschka, K.; Ise, E.; Krick, K.; Schulte-Körne, G. Effectiveness of Treatment Approaches for Children and Adolescents with Reading Disabilities: A Meta-Analysis of Randomized Controlled Trials. PLoS ONE 2014, 9, e89900. [Google Scholar] [CrossRef] [PubMed]
- Griffiths, P.G.; Taylor, R.H.; Henderson, L.M.; Barrett, B.T. The Effect of Coloured Overlays and Lenses on Reading: A Systematic Review of the Literature. Ophthalmic Physiol. Opt. 2016, 519–544. [Google Scholar] [CrossRef] [PubMed]
- Hlengwa, N.; Moonsamy, P.; Ngwane, F.; Nirghin, U.; Singh, S. The Effect of Color Overlays on the Reading Ability of Dyslexic Children. Indian J. Ophthalmol. 2017, 772–773. [Google Scholar] [CrossRef]
- Uccula, A.; Enna, M.; Mulatti, C. Colors, Colored Overlays, and Reading Skills. Front. Psychol. 2014, 5, 833. [Google Scholar] [CrossRef]
- Hoyt, C.S. Irlen Lenses and Reading Difficulties. J. Learn. Disabil. 1990, 624–626. [Google Scholar] [CrossRef]
- Wilkins, A. Coloured Overlays and Their Effects on Reading Speed: A Review. Ophthalmic Physiol. Opt. 2002, 22, 448–454. [Google Scholar] [CrossRef]
- Gregor, P.; Newell, A.F. An Empirical Investigation of Ways in which Some of the Problems Encountered by Some Dyslexics May Be Alleviated Using Computer Techniques. In Annual ACM Conference on Assistive Technologies, Proceedings; Association for Computing Machinery (ACM): New York, NY, USA, 2000; pp. 85–91. [Google Scholar] [CrossRef]
- Dickinson, A.; Gregor, P.; Newell, A.F. Ongoing Investigation of the Ways in which Some of the Problems Encountered by Some Dyslexics Can Be Alleviated Using Computer Techniques. In Annual ACM Conference on Assistive Technologies, Proceedings; Association for Computing Machinery (ACM): New York, NY, USA, 2002; pp. 97–103. [Google Scholar] [CrossRef]
- Kriss, I.; Evans, B.J.W. The Relationship between Dyslexia and Meares-Irlen Syndrome. J. Res. Read. 2005, 28, 350–364. [Google Scholar] [CrossRef]
- Lightstone, A.; Lightstone, T.; Wilkins, A. Both Coloured Overlays and Coloured Lenses Can Improve Reading Fluency, but Their Optimal Chromaticities Differ. Ophthalmic Physiol. Opt. 1999, 19, 279–285. [Google Scholar] [CrossRef]
- Jeanes, R.; Busby, A.; Martin, J.; Lewis, E.; Stevenson, N.; Pointon, D.; Wilkins, A. Prolonged Use of Coloured Overlays for Classroom Reading. Br. J. Psychol. 1997, 88, 541–548. [Google Scholar] [CrossRef]
- Gregor, P.; Dickinson, A.; Macaffer, A.; Andreasen, P. SeeWord—A Personal Word Processing Environment for Dyslexic Computer Users. Br. J. Educ. Technol. 2003, 34, 341–355. [Google Scholar] [CrossRef]
- Rello, L.; Bigham, J.P. Good Background Colors for Readers: A Study of People with and without Dyslexia. In Proceedings of the 19th International ACM SIGACCESS Conference on Computers and Accessibility, Baltimore, MD, USA, 29 October–1 November 2017. [Google Scholar] [CrossRef]
- Rello, L.; Baeza-Yates, R. How to Present More Readable Text for People with Dyslexia. Univers. Access Inf. Soc. 2017, 16, 29–49. [Google Scholar] [CrossRef]
- Pinna, B.; Deiana, K. New Conditions on the Role of Color in Perceptual Organization and an Extension to How Color Influences Reading. Psihologija 2014, 47, 319–351. [Google Scholar] [CrossRef]
- Pinna, B.; Deiana, K. On the Role of Color in Reading and Comprehension Tasks in Dyslexic Children and Adults. i-Perception 2018, 9, 1–22. [Google Scholar] [CrossRef]
- Hall, R.; Ray, N.; Harries, P.; Stein, J. A Comparison of Two-Coloured Filter Systems for Treating Visual Reading Difficulties. Disabil. Rehabil. 2013, 35, 2221–2226. [Google Scholar] [CrossRef]
- Kim, J.H.; Seo, H.J.; Ha, S.G.; Kim, S.H. Functional Magnetic Resonance Imaging Findings in Meares-Irlen Syndrome: A Pilot Sudy. Korean J. Ophthalmol. KJO 2015, 29, 121–125. [Google Scholar] [CrossRef]
- Ray, N.J.; Fowler, S.; Stein, J.F. Yellow Filters Can Improve Magnocellular Function: Motion Sensitivity, Convergence, Accommodation, and Reading. Ann. N. Y. Acad. Sci. 2005, 1039, 283–293. [Google Scholar] [CrossRef] [PubMed]
- Razuk, M.; Perrin-Fievez, F.; Gerard, C.L.; Peyre, H.; Barela, J.A.; Bucci, M.P. Effect of Colored Filters on Reading Capabilities in Dyslexic Children. Res. Dev. Disabil. 2018, 83, 1–7. [Google Scholar] [CrossRef] [PubMed]
- Stein, J. What Is Developmental Dyslexia? Brain Sci. 2018, 8, 26. [Google Scholar] [CrossRef]
- British Dyslexia Association. Dyslexia Style Guide. January 2012. Available online: http://www.bdadyslexia.org.uk/ (accessed on 23 April 2021).
- Lyon, G.R.; Shaywitz, S.E.; Shaywitz, B.A. A Definition of Dyslexia. Ann. Dyslexia 2003, 1–14. [Google Scholar] [CrossRef]
- Giagloglou, E.; Radenkovic, M.; Brankovic, S.; Antoniou, P.; Zivanovic-Macuzic, I. Pushing, pulling and manoeuvring an industrial cart: A psychophysiological study. Int. J. Occup. Saf. Ergon. 2019, 25, 296–304. [Google Scholar] [CrossRef] [PubMed]
- Rayner, K. The Role of Eye Movements in Learning to Read and Reading Disability. Remedial Spec. Educ. 1985, 6, 53–60. [Google Scholar] [CrossRef]
- Eden, G.F.; Stein, J.F.; Wood, H.M.; Wood, F.B. Differences in Eye Movements and Reading Problems in Dyslexic and Normal Children. Vis. Res. 1994, 34, 1345–1358. [Google Scholar] [CrossRef]
- Olson, R.K.; Kliegl, R.; Davidson, B.J. Dyslexic and Normal Readers’ Eye Movements. J. Exp. Psychol. Hum. Percept. Perform. 1983, 9, 816–825. [Google Scholar] [CrossRef]
- Martos, F.J.; Vila, J. Differences in Eye Movements Control among Dyslexic, Retarded and Normal Readers in the Spanish Population. Read. Writ. 1990, 2, 175–188. [Google Scholar] [CrossRef]
- Rayner, K. Eye Movements and the Perceptual Span in Beginning and Skilled Readers. J. Exp. Child Psychol. 1986, 41, 211–236. [Google Scholar] [CrossRef]
- Prado, C.; Dubois, M.; Valdois, S. The Eye Movements of Dyslexic Children during Reading and Visual Search: Impact of the Visual Attention Span. Vis. Res. 2007, 47, 2521–2530. [Google Scholar] [CrossRef]
- Ward, L.M.; Kapoula, Z. Differential diagnosis of vergence and saccade disorders in dyslexia. Sci. Rep. 2020, 10, 1–15. [Google Scholar] [CrossRef]
- Dürrwächter, U.; Sokolov, A.N.; Reinhard, J.; Klosinski, G.; Trauzettel-Klosinski, S. Word length and word frequency affect eye movements in dyslexic children reading in a regular (German) orthography. Ann. Dyslexia [Internet] 2010, 60, 86–101. [Google Scholar] [CrossRef]
- Rayner, K.; Yang, J.; Castelhano, M.S.; Liversedge, S.P. Eye Movements of Older and Younger Readers When Reading Disappearing Text. Psychol. Aging 2011, 26, 214–223. [Google Scholar] [CrossRef]
- Rayner, K.; Yang, J.; Schuett, S.; Slattery, T.J. Eye Movements of Older and Younger Readers When Reading Unspaced Text. Exp. Psychol. 2013, 60, 354–361. [Google Scholar] [CrossRef]
- Fraga González, G.; van der Molen, M.J.W.; Žarić, G.; Bonte, M.; Tijms, J.; Blomert, L.; Stam, C.J.; van der Molen, M.W. Graph Analysis of EEG Resting State Functional Networks in Dyslexic Readers. Clin. Neurophysiol. 2016, 127, 3165–3175. [Google Scholar] [CrossRef] [PubMed]
- Arns, M.; Peters, S.; Breteler, R.; Verhoeven, L. Different Brain Activation Patterns in Dyslexic Children: Evidence from Eeg Power and Coherence Patterns for the Double-Deficit Theory of Dyslexia. J. Integr. Neurosci. 2007, 6, 175–190. [Google Scholar] [CrossRef] [PubMed]
- Klimesch, W.; Doppelmayr, M.; Wimmer, H.; Gruber, W.; Röhm, D.; Schwaiger, J.; Hutzler, F. Alpha and Beta Band Power Changes in Normal and Dyslexic Children. Clin. Neurophysiol. 2001, 112, 1186–1195. [Google Scholar] [CrossRef]
- Lehongre, K.; Morillon, B.; Giraud, A.-L.; Ramus, F. Impaired Auditory Sampling in Dyslexia: Further Evidence from Combined FMRI and EEG. Front. Hum. Neurosci. 2013, 7, 454. [Google Scholar] [CrossRef] [PubMed]
- Hoeft, F.; McCandliss, B.D.; Black, J.M.; Gantman, A.; Zakerani, N.; Hulme, C.; Lyytinen, H.; Whitfield-Gabrieli, S.; Glover, G.H.; Reiss, A.L.; et al. Neural Systems Predicting Long-Term Outcome in Dyslexia. Proc. Natl. Acad. Sci. USA 2011, 108, 361–366. [Google Scholar] [CrossRef]
- Wilkinson, K.M.; O’Neill, T.; McIlvane, W.J. Eye-Tracking Measures Reveal How Changes in the Design of Aided AAC Displays Influence the Efficiency of Locating Symbols by School-Age Children without Disabilities. J. Speech Lang. Hear. Res. 2014, 57, 455–466. [Google Scholar] [CrossRef]
- Morrison, R. Effect of Color Overlays on Reading Efficiency. Ph.D. Thesis, University of Massachusetts, Amherst, MA, USA, 2011. [Google Scholar]
- Blaskey, P.; Scheiman, M.; Parisi, M.; Ciner, E.B.; Gallaway, M.; Selznick, R. The Effectiveness of Irlen Filters for Improving Reading Performance: A Pilot Study. J. Learn. Disabil. 1990, 23, 604–612. [Google Scholar] [CrossRef] [PubMed]
- Denton, T.F.; Meindl, J.N. The Effect of Colored Overlays on Reading Fluency in Individuals with Dyslexia. Behav. Anal. Pract. 2016, 9, 191–198. [Google Scholar] [CrossRef]
- Boucsein, W.; Boucsein, W. Principles of Electrodermal Phenomena. In Electrodermal Activity; Springer: New York, NY, USA, 2012; pp. 1–86. [Google Scholar] [CrossRef]
- Boucsein, W. Electrodermal Activity; Springer Science+Business Media, LLC: New York, NY, USA, 2012. [Google Scholar]
- Carlucci, L.; Watkins, M.W.; Sergi, M.R.; Cataldi, F.; Saggino, A.; Balsamo, M. Dimensions of Anxiety, Age, and Gender: Assessing Dimensionality and Measurement Invariance of the State-Trait for Cognitive and Somatic Anxiety (STICSA) in an Italian Sample. Front. Psychol. 2018, 9, 2345. [Google Scholar] [CrossRef] [PubMed]
- Hunter, E.J.; Johnson, L.C.; Keefe, F.B. Electrodermol and Cardiovascular Responses in Nonreaders. J. Learn. Disabil. 1972, 5, 187–197. [Google Scholar] [CrossRef]
- Tobia, V.; Bonifacci, P.; Ottaviani, C.; Borsato, T.; Marzocchi, G.M. Reading under the Skin: Physiological Activation during Reading in Children with Dyslexia and Typical Readers. Ann. Dyslexia 2016, 66, 171–186. [Google Scholar] [CrossRef]
- Uno, T.; Grings, W.W. Autonomic components of orienting behavior. Psychophysiology 1965, 1, 311–321. [Google Scholar] [CrossRef]
- Al-Ayash, A.; Kane, R.T.; Smith, D.; Green-Armytage, P. The Influence of Color on Student Emotion, Heart Rate, and Performance in Learning Environments. Color Res. Appl. 2016, 41, 196–205. [Google Scholar] [CrossRef]
- Mehta, R.; Zhu, R. Blue or Red? Exploring the Effect of Color on Cognitive Task Performances. Science 2009, 323, 1226–1229. [Google Scholar] [CrossRef]
- Fraga González, G.; Smit, D.J.A.; Molen, M.J.W.; Tijms, J.; Geus, E.J.C.; Molen, M.W. Probability Learning and Feedback Processing in Dyslexia: A Performance and Heart Rate Analysis. Psychophysiology 2019, 56, e13460. [Google Scholar] [CrossRef] [PubMed]
- Moharreri, S.; Dabanloo, N.J.; Parvaneh, S.; Nasrabadi, A.M. How to Interpret Psychology from Heart Rate Variability? In Proceedings of the 1st Middle East Conference on Biomedical Engineering, MECBME 2011, Sharjah, United Arab Emirates, 21–24 February 2011; IEEE: Piscataway, NJ, USA, 2011; pp. 296–299. [Google Scholar] [CrossRef]
- Drachen, A.; Yannakakis, G.; Nacke, L.E.; Pedersen, A.L. Correlation between Heart Rate, Electrodermal Activity and Player Experience in First-Person Shooter Games. In Sandbox 2010: 5th ACM SIGGRAPH Symposium on Video Games; ACM Press: New York, NY, USA, 2010; pp. 49–54. [Google Scholar] [CrossRef]
- Sprenger-Charolles, L. Dyslexia Subtypes in Languages Differing in Orthographic Transparency: English, French and Spanish. Escr. Psicol. Psychol. Writ. 2011, 4, 5–16. [Google Scholar] [CrossRef]
- Goswami, U.; Ziegler, J.C.; Dalton, L.; Schneider, W. Nonword Reading across Orthographies: How Flexible Is the Choice of Reading Units? Appl. Psycholinguist. 2003, 235–247. [Google Scholar] [CrossRef]
- Davies, R.; Cuetos, F.; Glez-Seijas, R.M. Reading Development and Dyslexia in a Transparent Orthography: A Survey of Spanish Children. Ann. Dyslexia 2007, 57, 179–198. [Google Scholar] [CrossRef] [PubMed]
- Goswami, U.; Wang, H.L.S.; Cruz, A.; Fosker, T.; Mead, N.; Huss, M. Language-Universal Sensory Deficits in Developmental Dyslexia: English, Spanish, and Chinese. J. Cogn. Neurosci. 2011, 23, 325–337. [Google Scholar] [CrossRef] [PubMed]


| Parameters | Reading | p Value * | |
|---|---|---|---|
| Non-Dyslexic (n = 18) | Dyslexic (n = 18) | ||
| Reading duration | |||
| RD (s) | 16.4 (11.9–23.5) | 54.6 (26.1–70.7) | 0.002 |
| EEG parameters (relative band-power) a | |||
| Alpha | −5 (−11 to +9) | −3 (−6 to +8) | 0.772 |
| Beta | 3 (−7 to +13) | 6 (−2 to +13) | 0.477 |
| Delta | −10 (−17 to +30) | 3 (−11 to+18) | 0.809 |
| Theta | −8 (−13 to +8) | 3 (−7 to +9) | 0.296 |
| Broadband | −8 (−14 to +26) | 5 (−13 to +17) | 0.851 |
| Eye-tracking parameters | |||
| Fixation count | 25 (23–30) | 35.5 (29–67) | <0.001 |
| Fixation frequency (count/s) | 1.5 (1.37–1.80) | 1.1 (0.6–1.6) | 0.036 |
| Fixation duration total (s) | 15.1 (10.8–21.6) | 48.3 (23.9–59.4) | 0.001 |
| Fixation duration average (ms) | 593.8 (518.2–696.5) | 809.7 (575.8–1586.9) | 0.071 |
| Saccade count | 24 (20–28) | 29.5 (25–42) | 0.003 |
| Saccade frequency (count/s) | 1.45 (1.28–1.60) | 0.90 (0.50–1.40) | 0.013 |
| Saccade duration total (ms) | 469.7 (434.1–538.2) | 736.5 (583.8–1509.7) | <0.001 |
| Saccade duration average (ms) | 20.1 (18.9–21.7) | 23.1 (21.0–33.0) | 0.004 |
| EDA value | |||
| EDA (μS) | 8.29 (6.04–12.01) | 5.67 (4.67–7.47) | 0.012 |
| HRV parameters | |||
| Mean RR (ms) | 659.4 (596.2–705.5) | 693.6 (645.4–759.4) | 0.092 |
| STD RR (ms) | 39.7 (22.2–57.3) | 42.6 (32.5–59.9) | 0.631 |
| Mean HR (beats/min) | 91.0 (84.4–100.6) | 86.5 (79.0–92.9) | 0.244 |
| STD HR (beats/min) | 6.28 (3.66–7.61) | 5.22 (4.47–6.78) | 0.988 |
| RMSSD (ms) | 50.9 (26.2–77.6) | 44.7 (33.5–76.2) | 0.527 |
| CVRR = SDRR/MeanRR (ms) | 0.08 (0.04–0.10) | 0.07 (0.06–0.09) | 0.828 |
| Colours | Red | Blue | Yellow | Orange | Purple | Turquoise | Red O | Turquoise O | Blue O | Orange O | Purple O | Yellow O |
|---|---|---|---|---|---|---|---|---|---|---|---|---|
| Reading duration (ms) | 0.002 | 0.008 | 0.004 | 0.001 | 0.002 | 0.002 | 0.001 | 0.002 | 0.002 | 0.001 | 0.002 | 0.001 |
| Fixation count | 0.001 | 0.002 | 0.046 | 0.001 | 0.010 | 0.001 | 0.015 | 0.024 | 0.001 | |||
| Fixation frequency (count/s) | 0.008 | 0.005 | 0.041 | 0.018 | 0.003 | 0.026 | 0.011 | 0.011 | 0.046 | 0.016 | 0.010 | |
| Fixation duration total (ms) | 0.002 | 0.016 | 0.004 | 0.001 | 0.002 | 0.002 | 0.001 | 0.031 | 0.003 | 0.002 | 0.005 | 0.001 |
| Fixation duration average (ms) | 0.058 | 0.043 | 0.043 | 0.005 | 0.050 | 0.058 | 0.050 | 0.025 | ||||
| Saccade count | 0.018 | 0.005 | 0.001 | 0.057 | 0.002 | 0.049 | 0.001 | |||||
| Saccade frequency (count/s) | 0.008 | 0.004 | 0.020 | 0.004 | 0.003 | 0.036 | 0.009 | 0.011 | 0.015 | 0.013 | 0.004 | |
| Saccade duration total (ms) | 0.001 | 0.003 | 0.058 | 0.001 | 0.025 | 0.001 | 0.010 | 0.023 | 0.056 | 0.001 | ||
| Saccade duration average (ms) | 0.020 | 0.015 | 0.021 | 0.052 | 0.001 | 0.034 | 0.031 | 0.040 | 0.004 | |||
| Alpha | ||||||||||||
| Beta | 0.010 | |||||||||||
| Delta | ||||||||||||
| Theta | 0.004 | 0.048 | ||||||||||
| Broadband | 0.012 | |||||||||||
| GSR (uS) | 0.029 | 0.053 | 0.038 | 0.022 | 0.057 | 0.041 | 0.049 | 0.053 | 0.035 | |||
| Mean RR (ms) | 0.047 | 0.040 | 0.027 | |||||||||
| STD RR (ms) | ||||||||||||
| Mean HR (beats/min) | 0.047 | 0.040 | 0.027 | |||||||||
| STD HR (beats/min) | ||||||||||||
| RMSSD (ms) | ||||||||||||
| CVRR=SDRR/MeanRR (ms) |
| Parameters | Reading | p Value * | |
|---|---|---|---|
| Non-Dyslexic (n = 18 × 13) | Dyslexic (n = 18 × 13) | ||
| Reading duration | |||
| RD (s) | 21.63 ± 15.30 | 49.20 ± 29.81 | <0.001 |
| EEG parameters (relative band power) | |||
| Alpha | 2.5 ± 12.2 | 1.8 ± 11.4 | 0.529 |
| Beta | −0.9 ± 16.5 | 5.1 ±27.5 | 0.005 |
| Delta | 5.9 ± 38.1 | 9.1± 47.5 | 0.415 |
| Theta | 2.7± 15.0 | 2.2± 16.4 | 0.735 |
| Broadband | 1.1 ± 29.1 | 6.2± 36.2 | 0.101 |
| Eye-tracking parameters | |||
| Fixation count | 27.20 ± 08.50 | 45.29 ± 29.59 | <0.001 |
| Fixation frequency (count/s) | 1.53 ± 0.54 | 1.15 ± 0.70 | <0.001 |
| Fixation duration total (s) | 20.16 ± 14.57 | 43.57 ± 27.02 | <0.001 |
| Fixation duration average (ms) | 697.20 ± 297.21 | 1108.41 ± 786.90 | <0.001 |
| Saccade count | 24.33 ± 7.85 | 35.63 ± 23.65 | <0.001 |
| Saccade frequency (count/s) | 1.37 ± 0.52 | 0.97 ± 0.69 | <0.001 |
| Saccade duration total (ms) | 517.22 ± 189.82 | 1122.51 ± 1514.83 | <0.001 |
| Saccade duration average (ms) | 21.34 ± 3.51 | 27.82 ± 12.11 | <0.001 |
| EDA value | |||
| EDA (μS) | 8.86± 3.77 | 6.30 ± 2.36 | <0.001 |
| HRV parameters | |||
| Mean RR (ms) | 652.47± 96.37 | 690.61 ± 75.06 | <0.001 |
| STD RR (ms) | 44.79 ± 37.31 | 47.49 ± 20.25 | 0.331 |
| Mean HR (beats/min) | 93.54 ± 11.94 | 87.89 ± 9.47 | <0.001 |
| STD HR (beats/min) | 5.70 ± 3.07 | 5.96 ± 2.09 | 0.283 |
| RMSSD (ms) | 54.21 ± 48.26 | 56.71 ± 31.06 | 0.001 |
| CVRR=SDRR/MeanRR (ms) | 0.07 ± 0.04 | 0.08 ± 0.02 | <0.001 |
Publisher’s Note: MDPI stays neutral with regard to jurisdictional claims in published maps and institutional affiliations. |
© 2021 by the authors. Licensee MDPI, Basel, Switzerland. This article is an open access article distributed under the terms and conditions of the Creative Commons Attribution (CC BY) license (https://creativecommons.org/licenses/by/4.0/).
Share and Cite
Jakovljević, T.; Janković, M.M.; Savić, A.M.; Soldatović, I.; Čolić, G.; Jakulin, T.J.; Papa, G.; Ković, V. The Relation between Physiological Parameters and Colour Modifications in Text Background and Overlay during Reading in Children with and without Dyslexia. Brain Sci. 2021, 11, 539. https://doi.org/10.3390/brainsci11050539
Jakovljević T, Janković MM, Savić AM, Soldatović I, Čolić G, Jakulin TJ, Papa G, Ković V. The Relation between Physiological Parameters and Colour Modifications in Text Background and Overlay during Reading in Children with and without Dyslexia. Brain Sciences. 2021; 11(5):539. https://doi.org/10.3390/brainsci11050539
Chicago/Turabian StyleJakovljević, Tamara, Milica M. Janković, Andrej M. Savić, Ivan Soldatović, Gordana Čolić, Tadeja Jere Jakulin, Gregor Papa, and Vanja Ković. 2021. "The Relation between Physiological Parameters and Colour Modifications in Text Background and Overlay during Reading in Children with and without Dyslexia" Brain Sciences 11, no. 5: 539. https://doi.org/10.3390/brainsci11050539
APA StyleJakovljević, T., Janković, M. M., Savić, A. M., Soldatović, I., Čolić, G., Jakulin, T. J., Papa, G., & Ković, V. (2021). The Relation between Physiological Parameters and Colour Modifications in Text Background and Overlay during Reading in Children with and without Dyslexia. Brain Sciences, 11(5), 539. https://doi.org/10.3390/brainsci11050539