Retrospective and Randomized Analysis of Influence and Correlation of Clinical and Molecular Prognostic Factors in a Mono-Operative Series of 122 Patients with Glioblastoma Treated with STR or GTR

 , ,
, , 
Abstract
1. Introduction
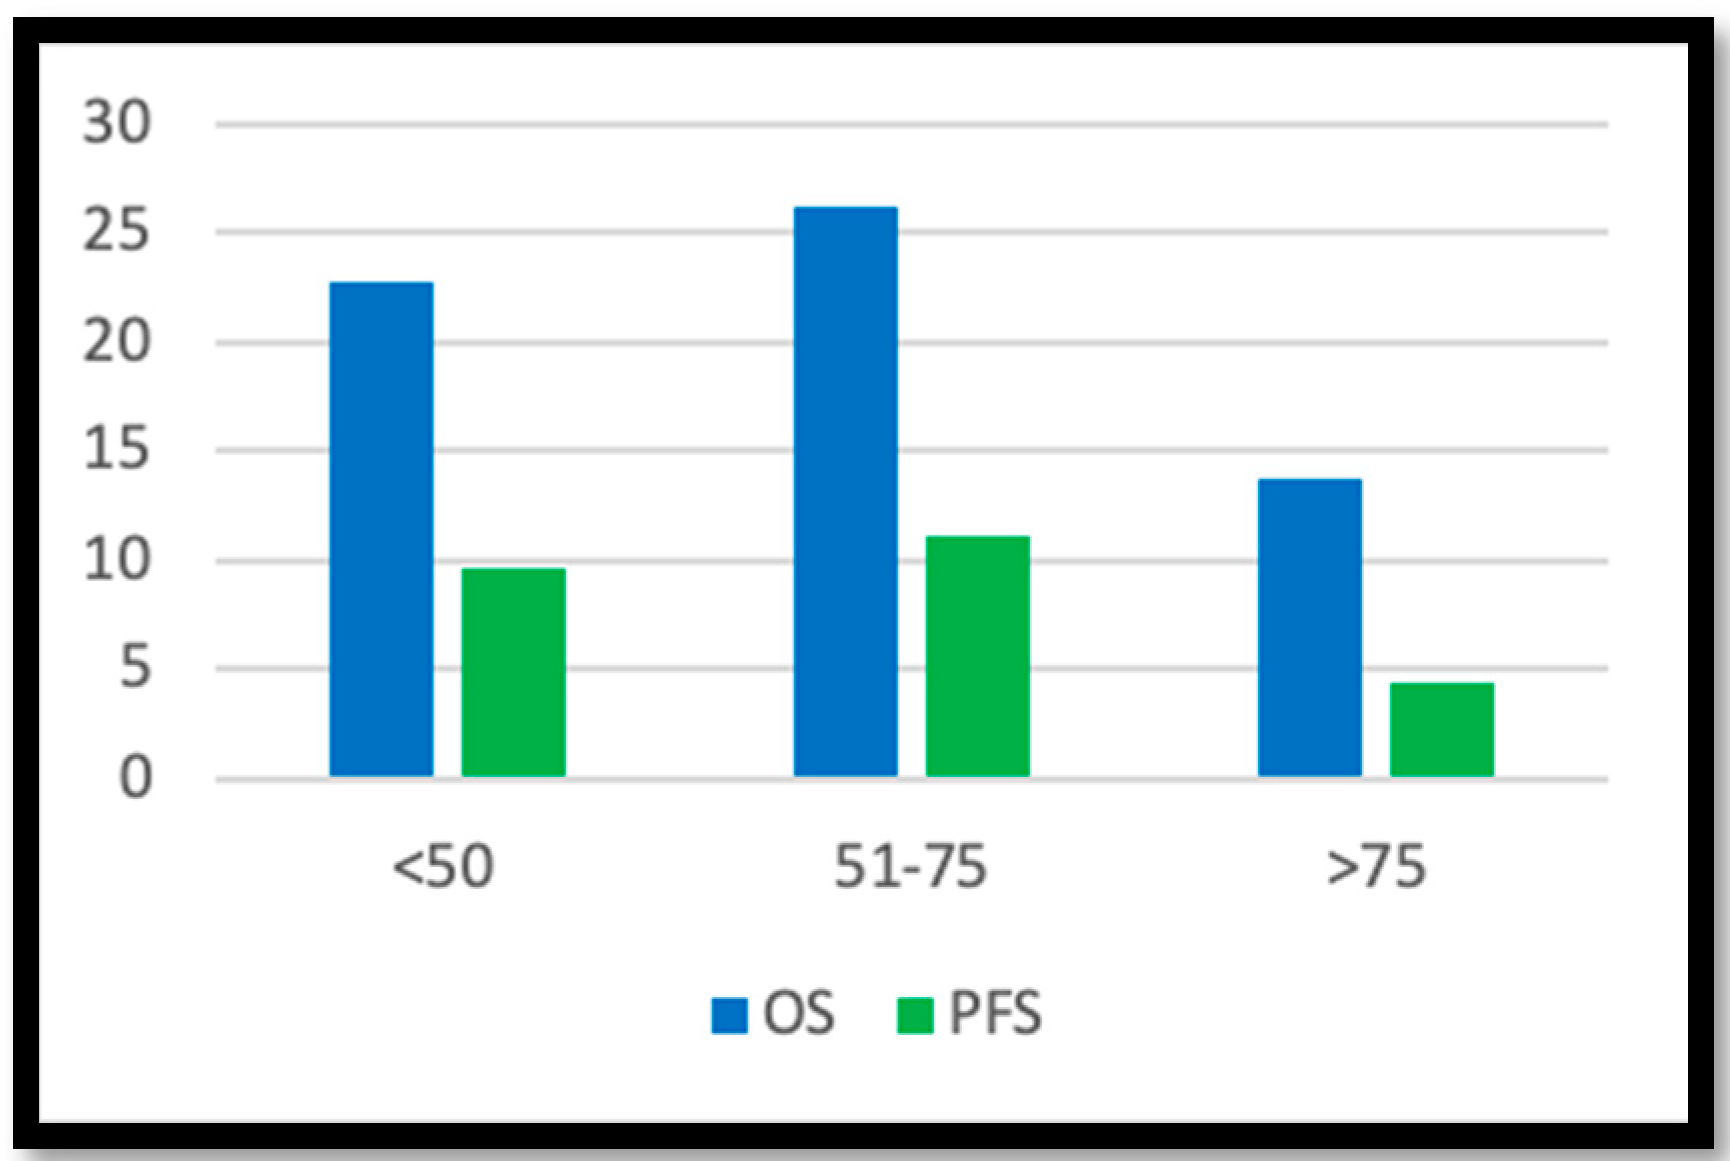
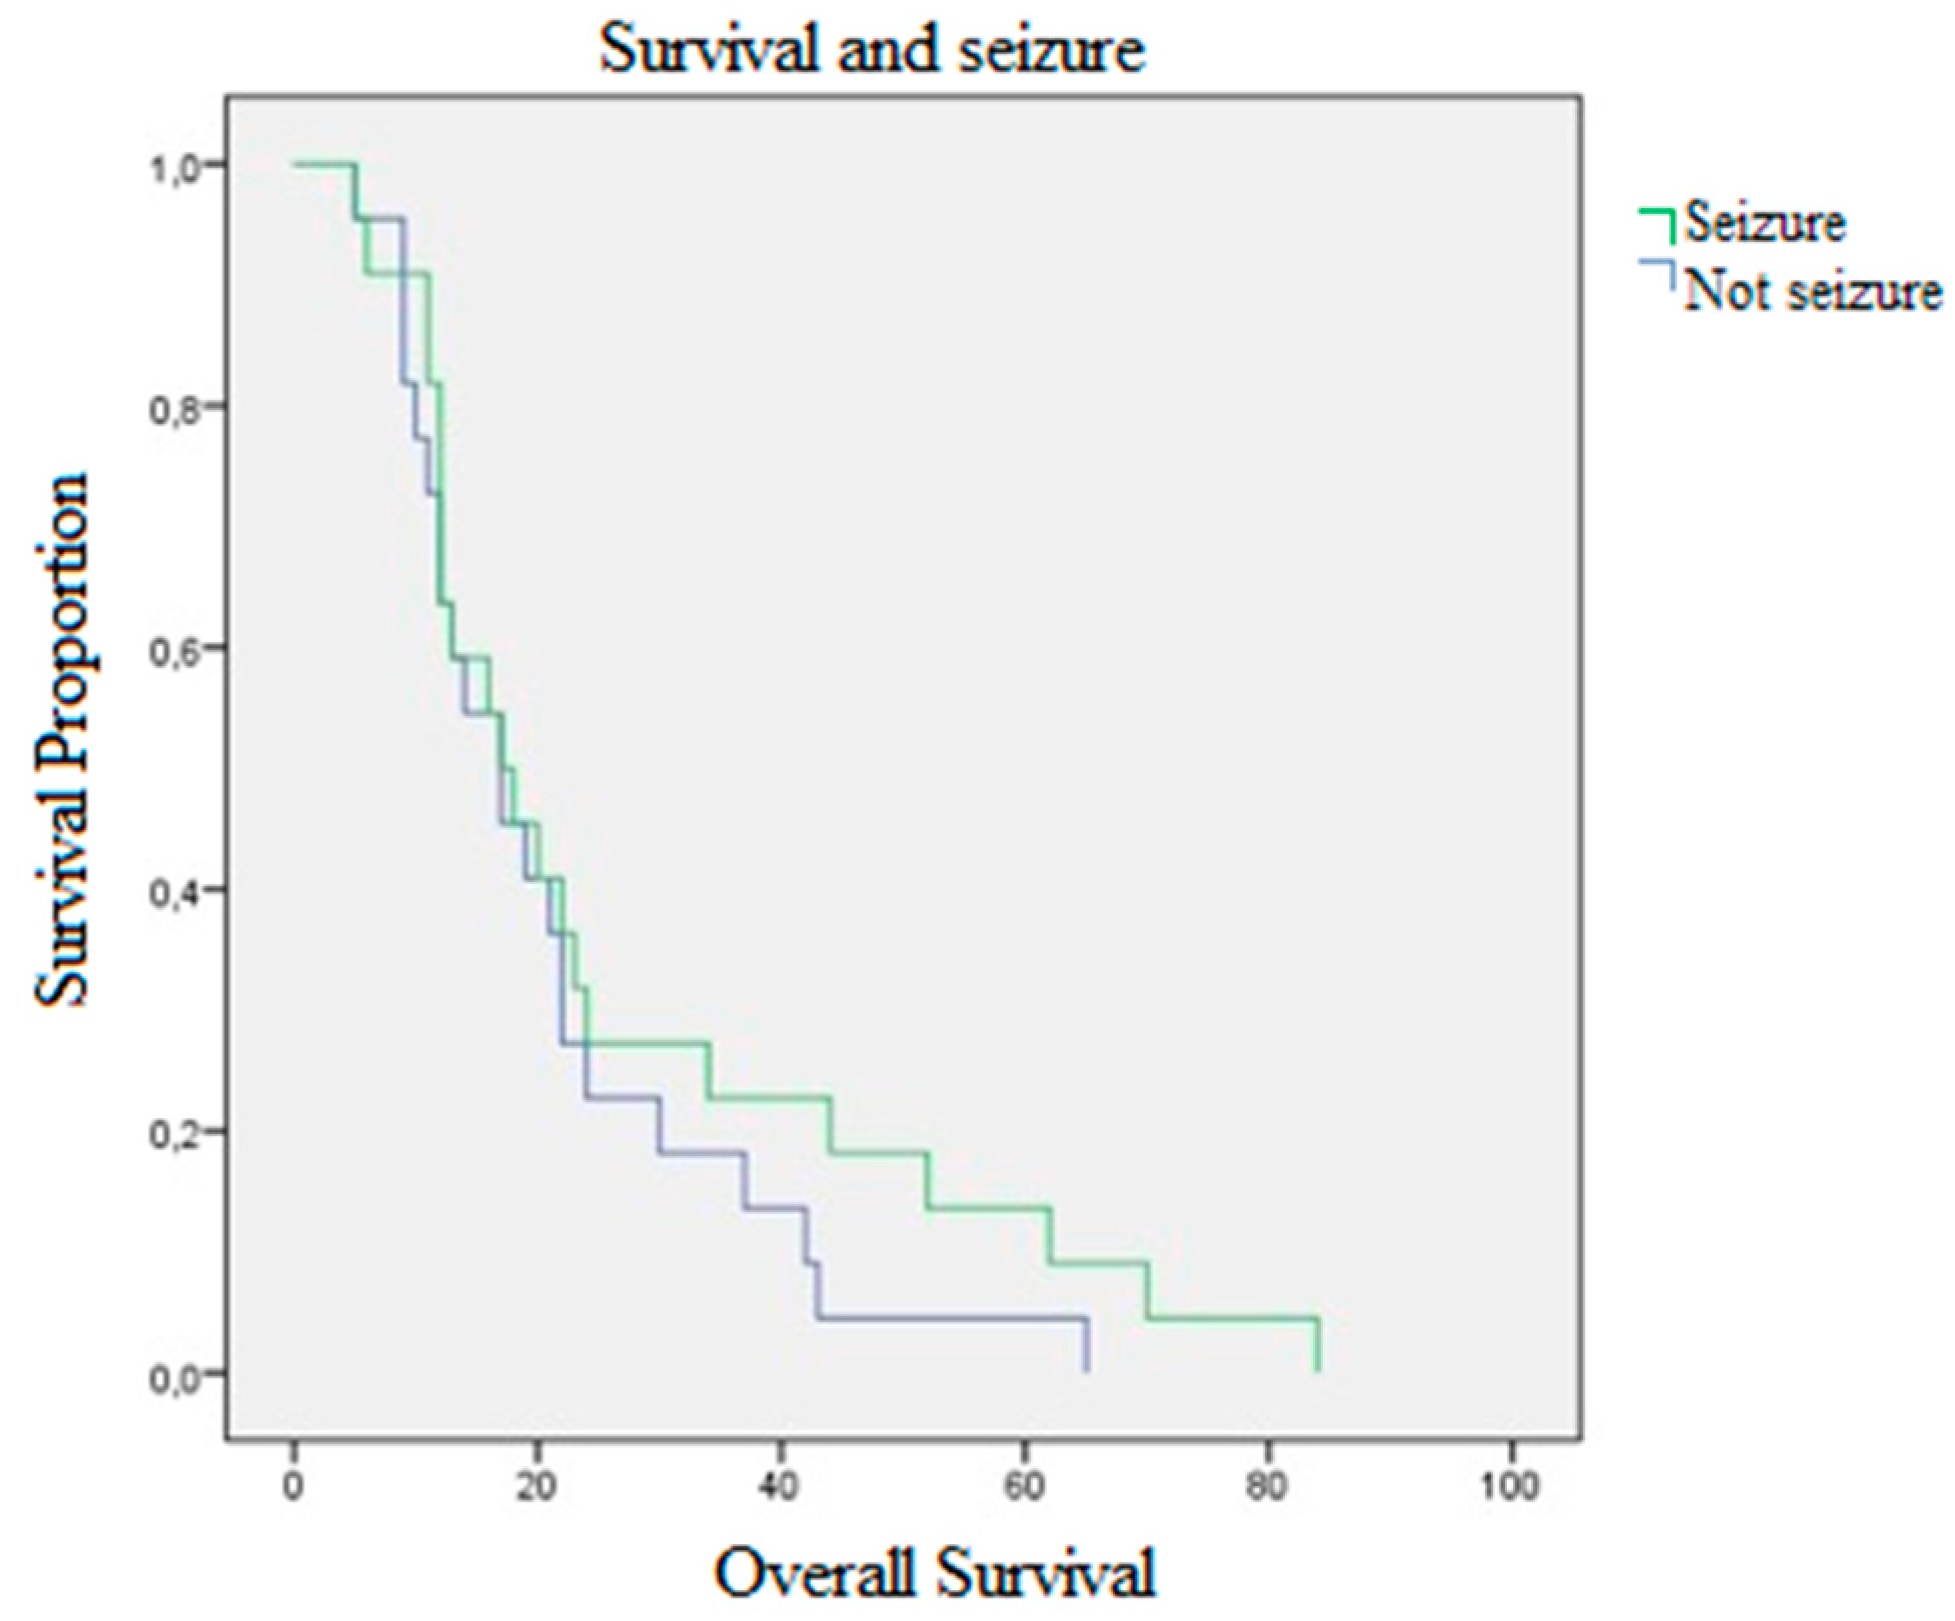
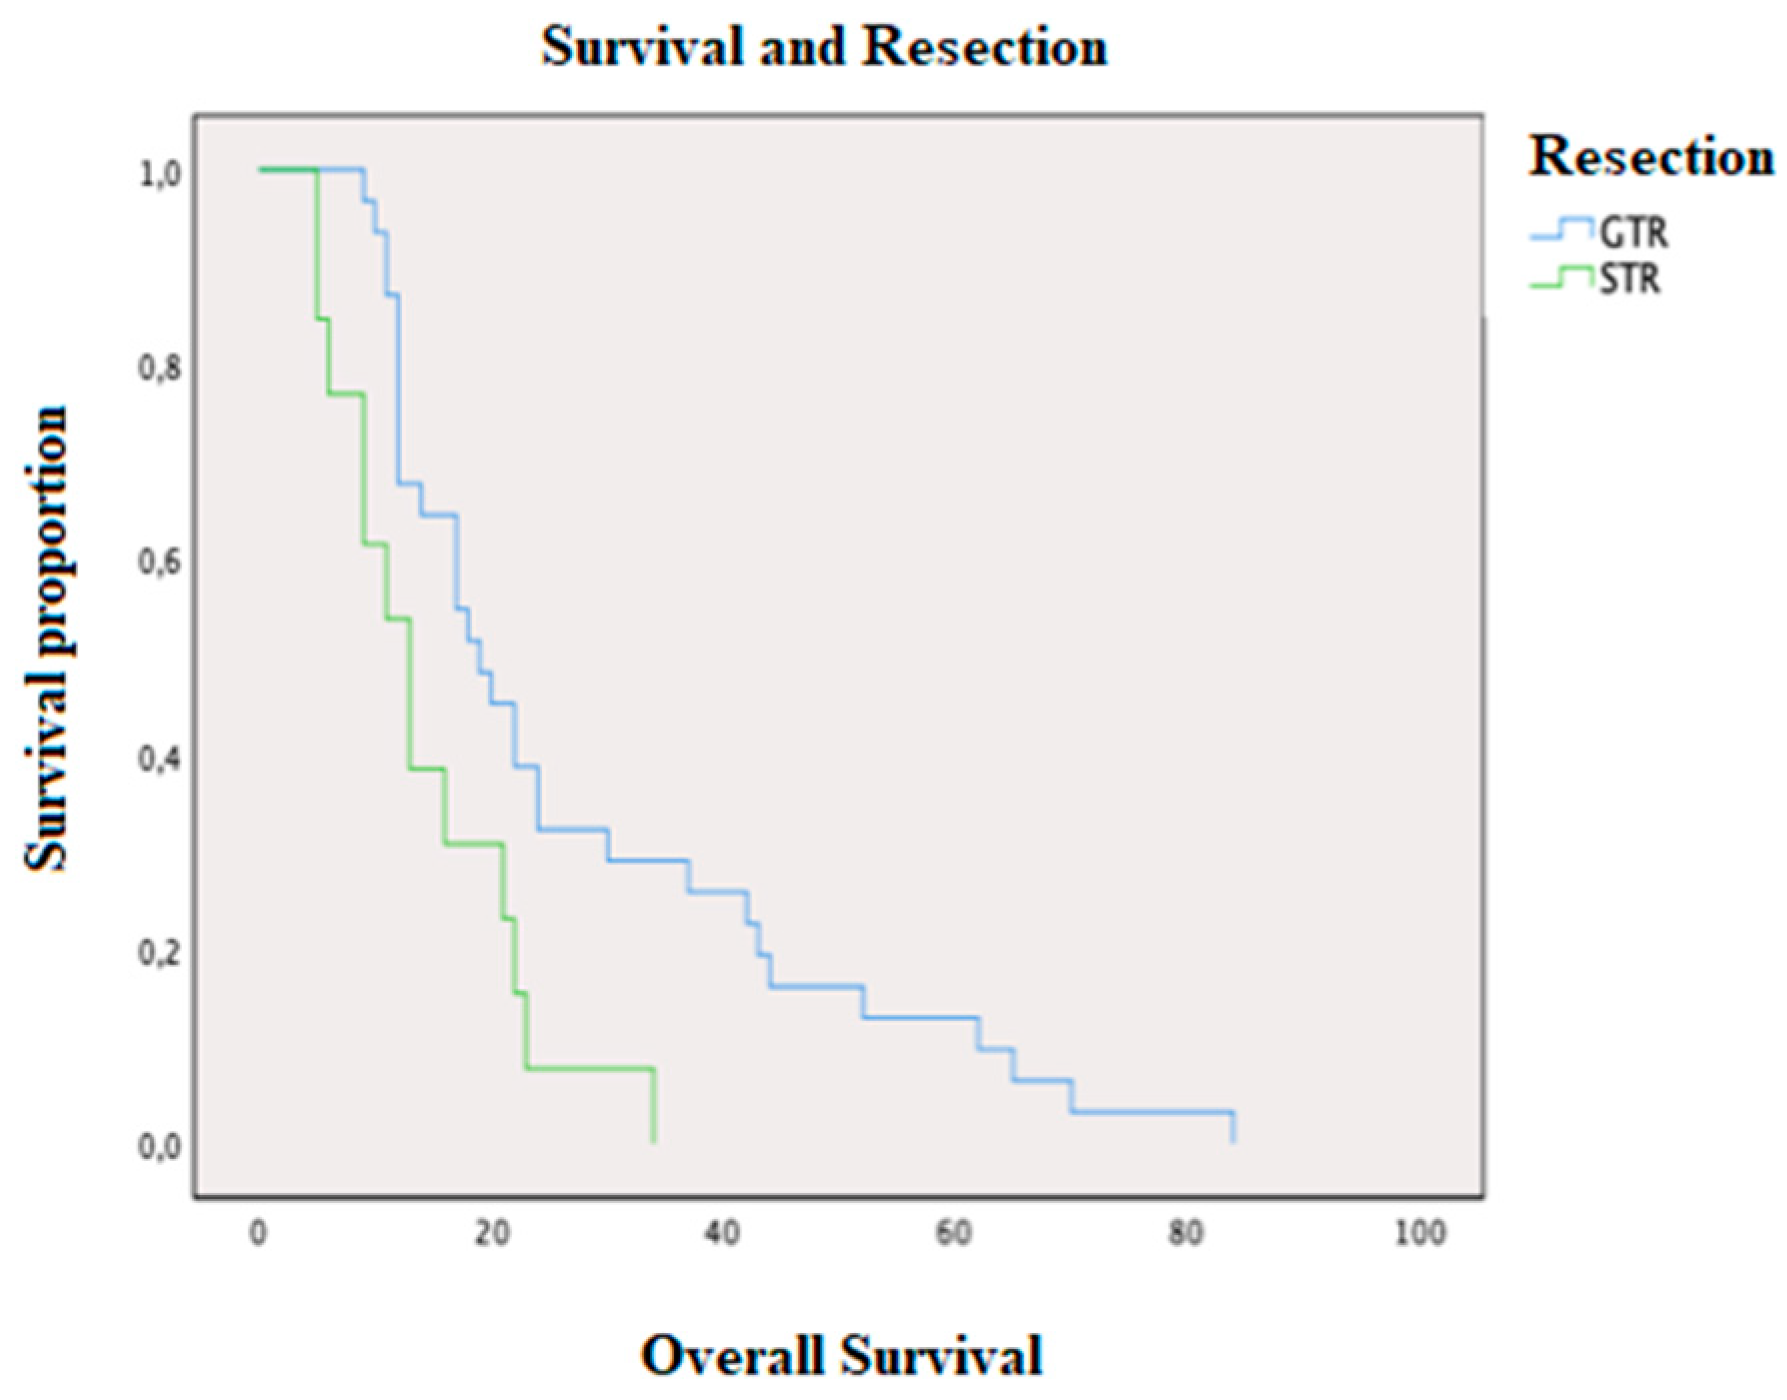
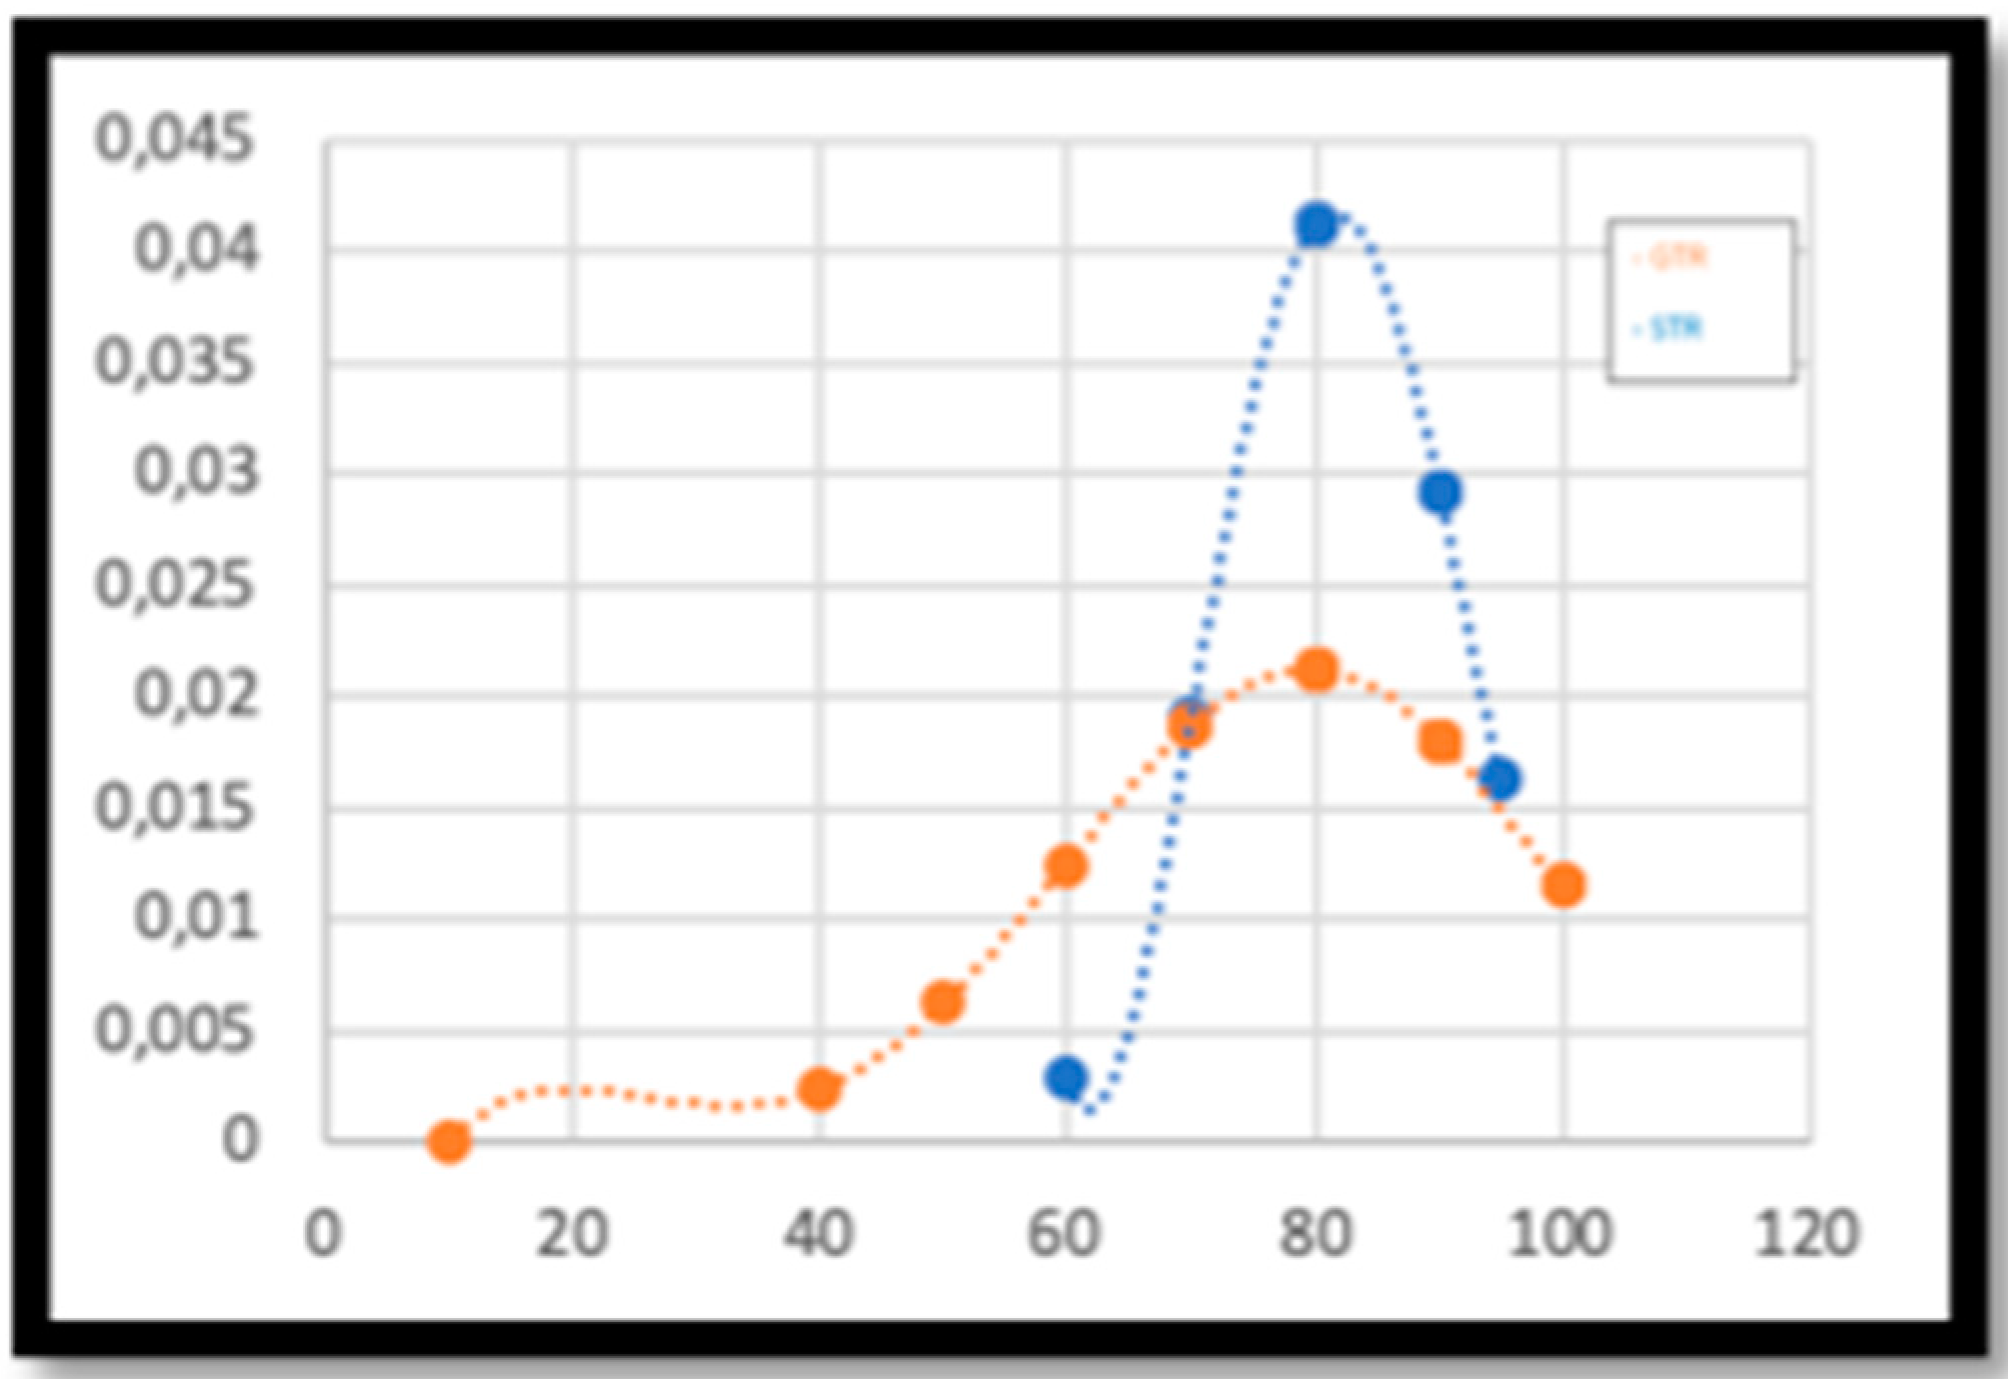
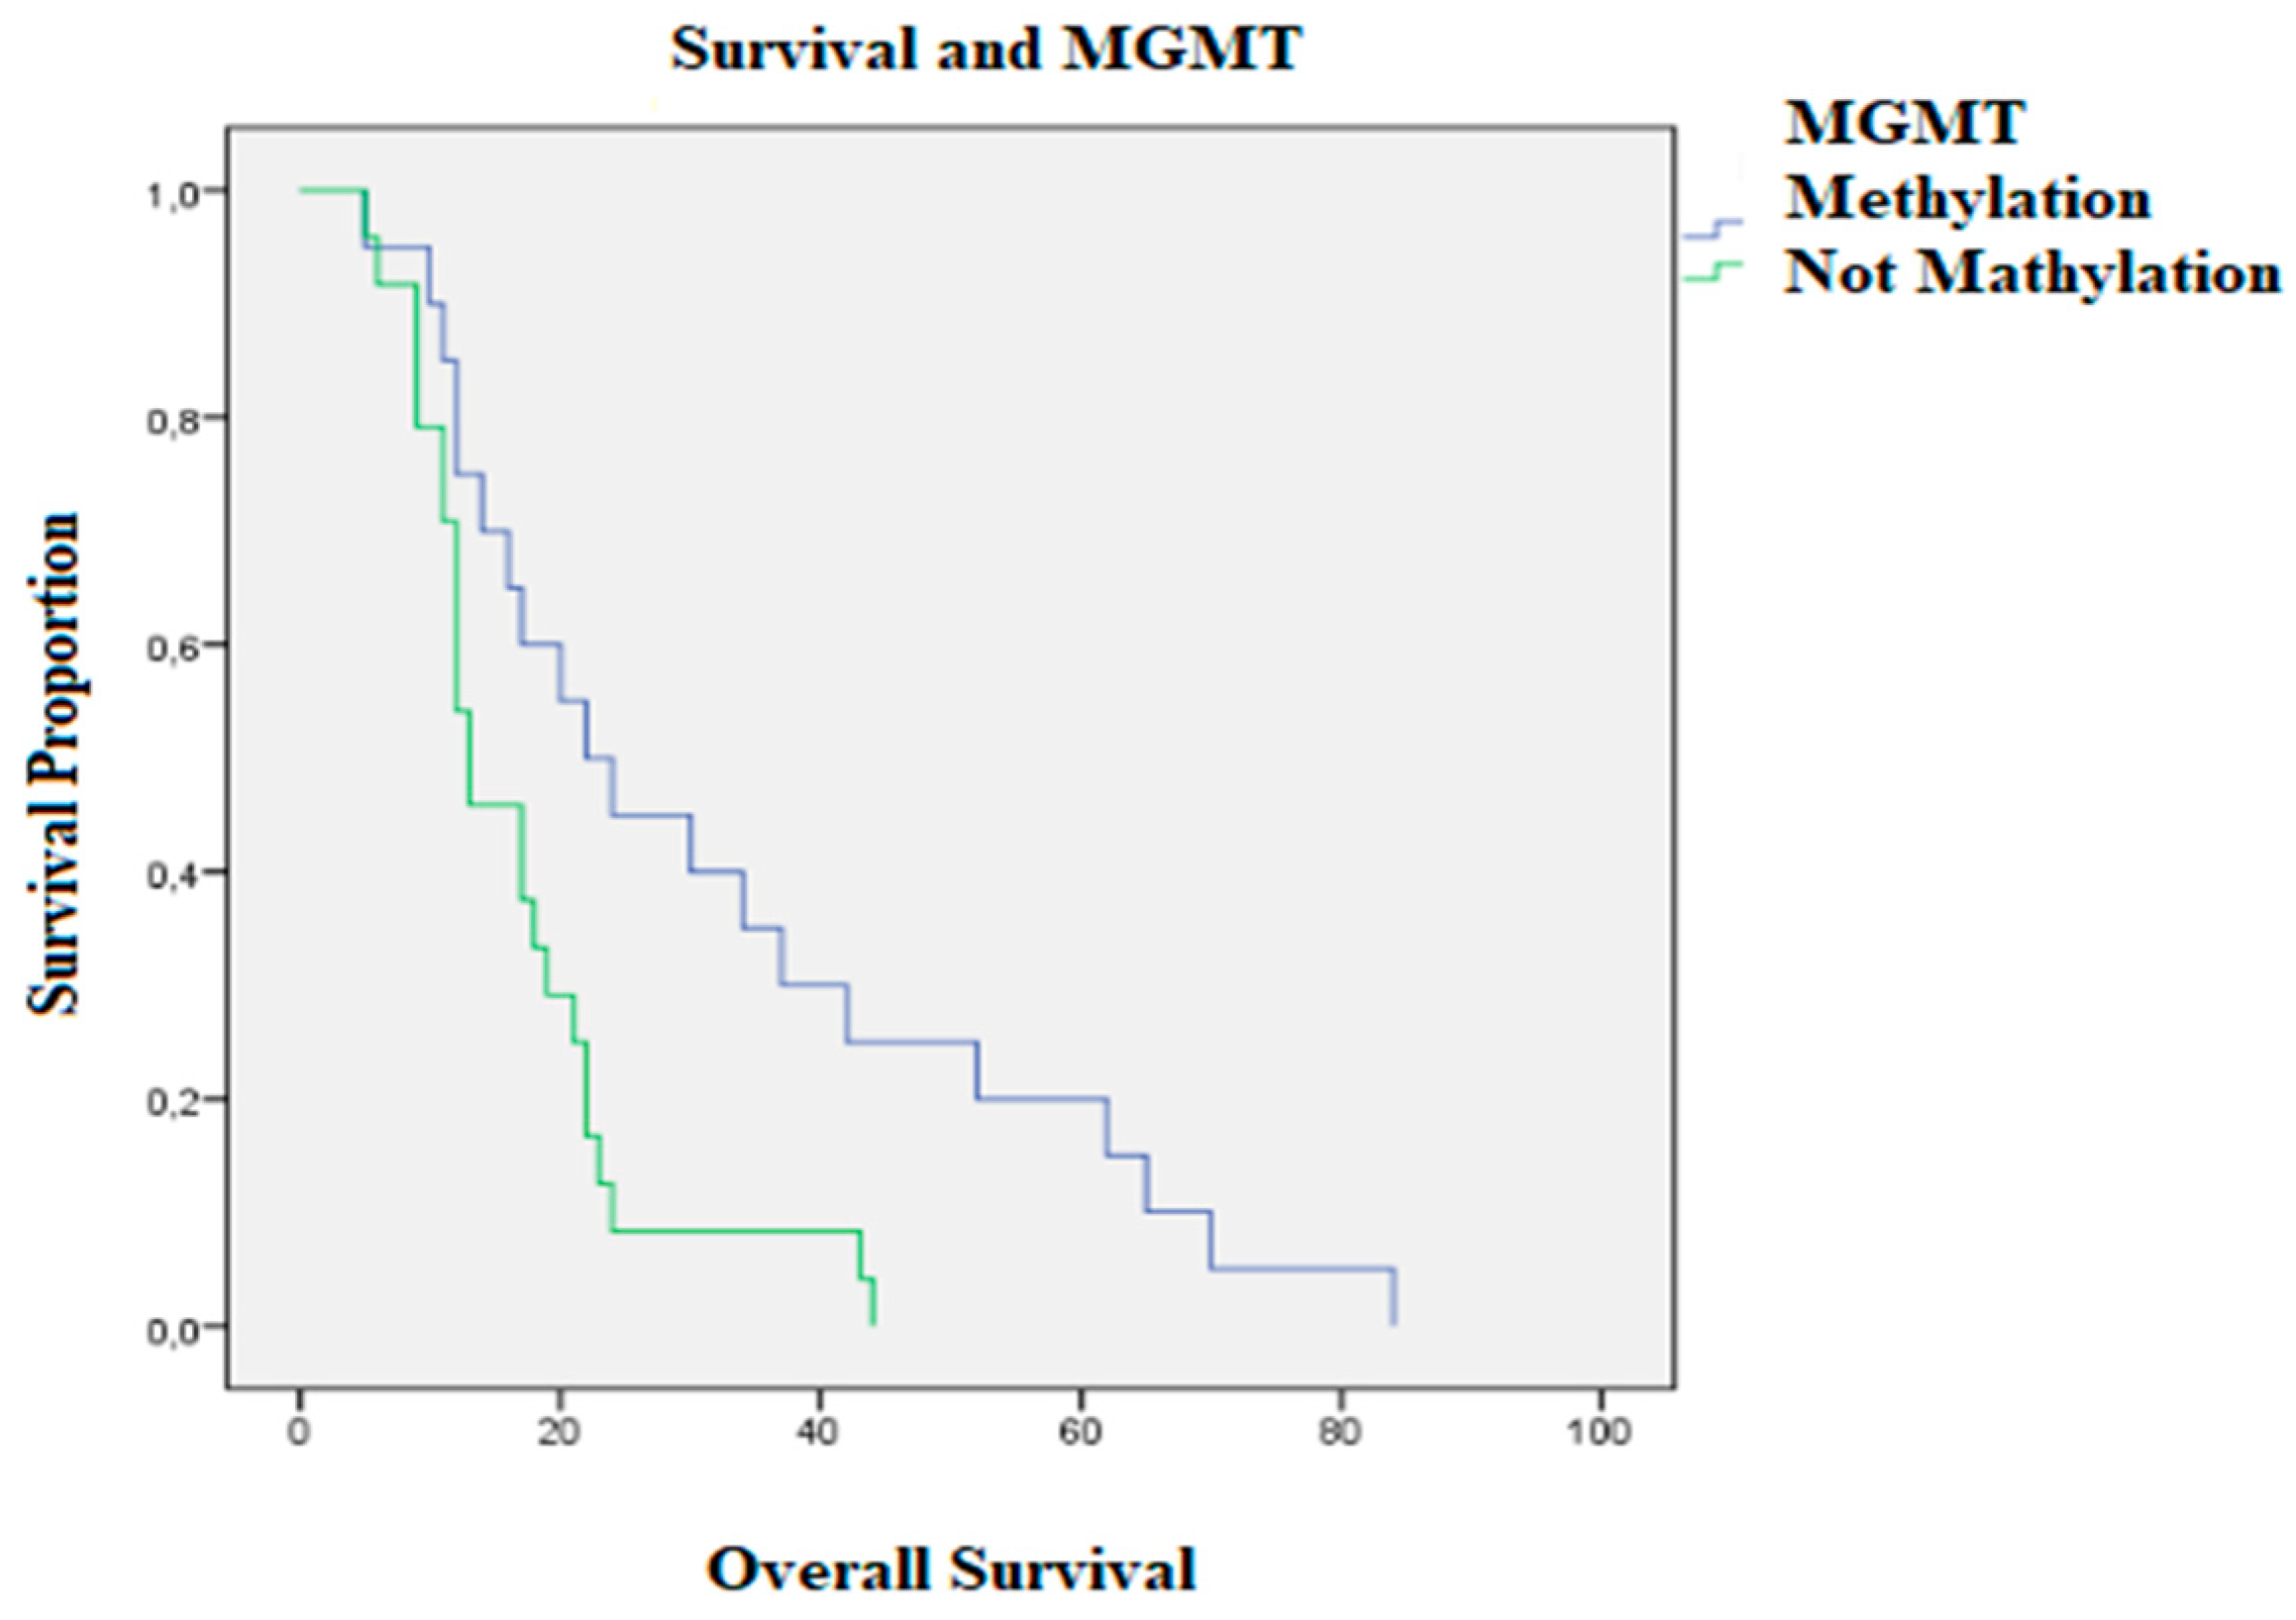
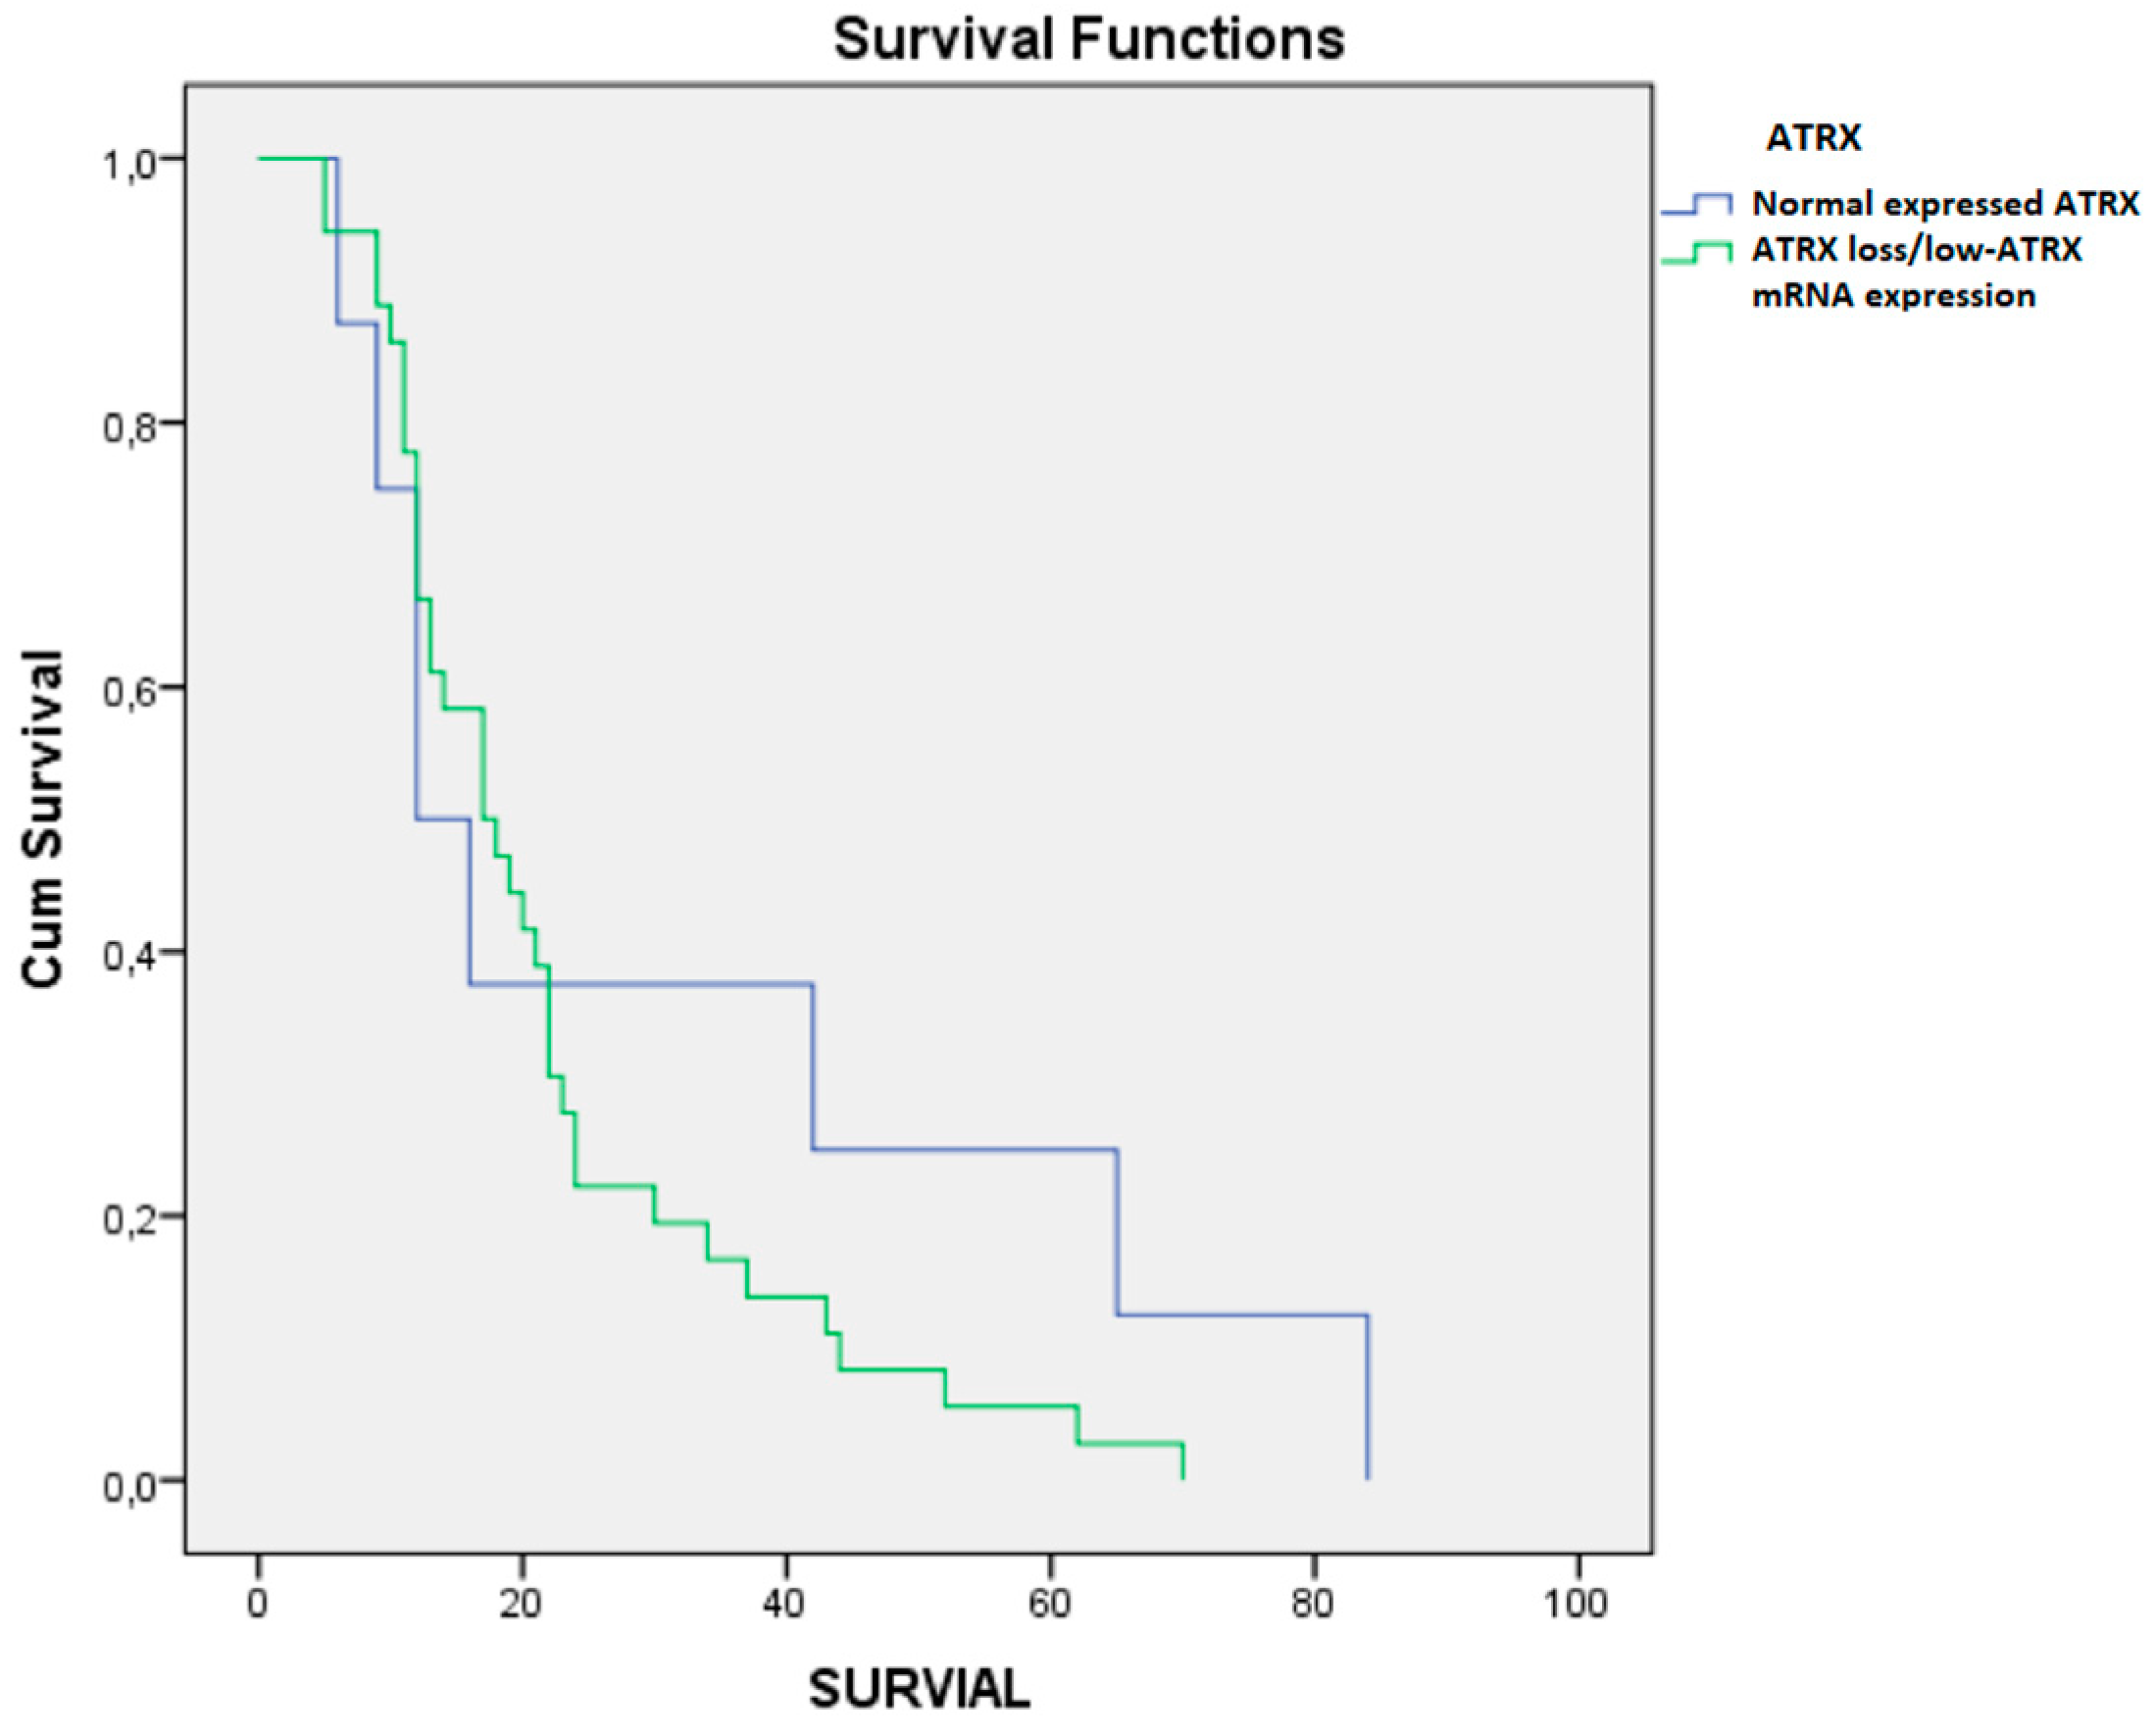
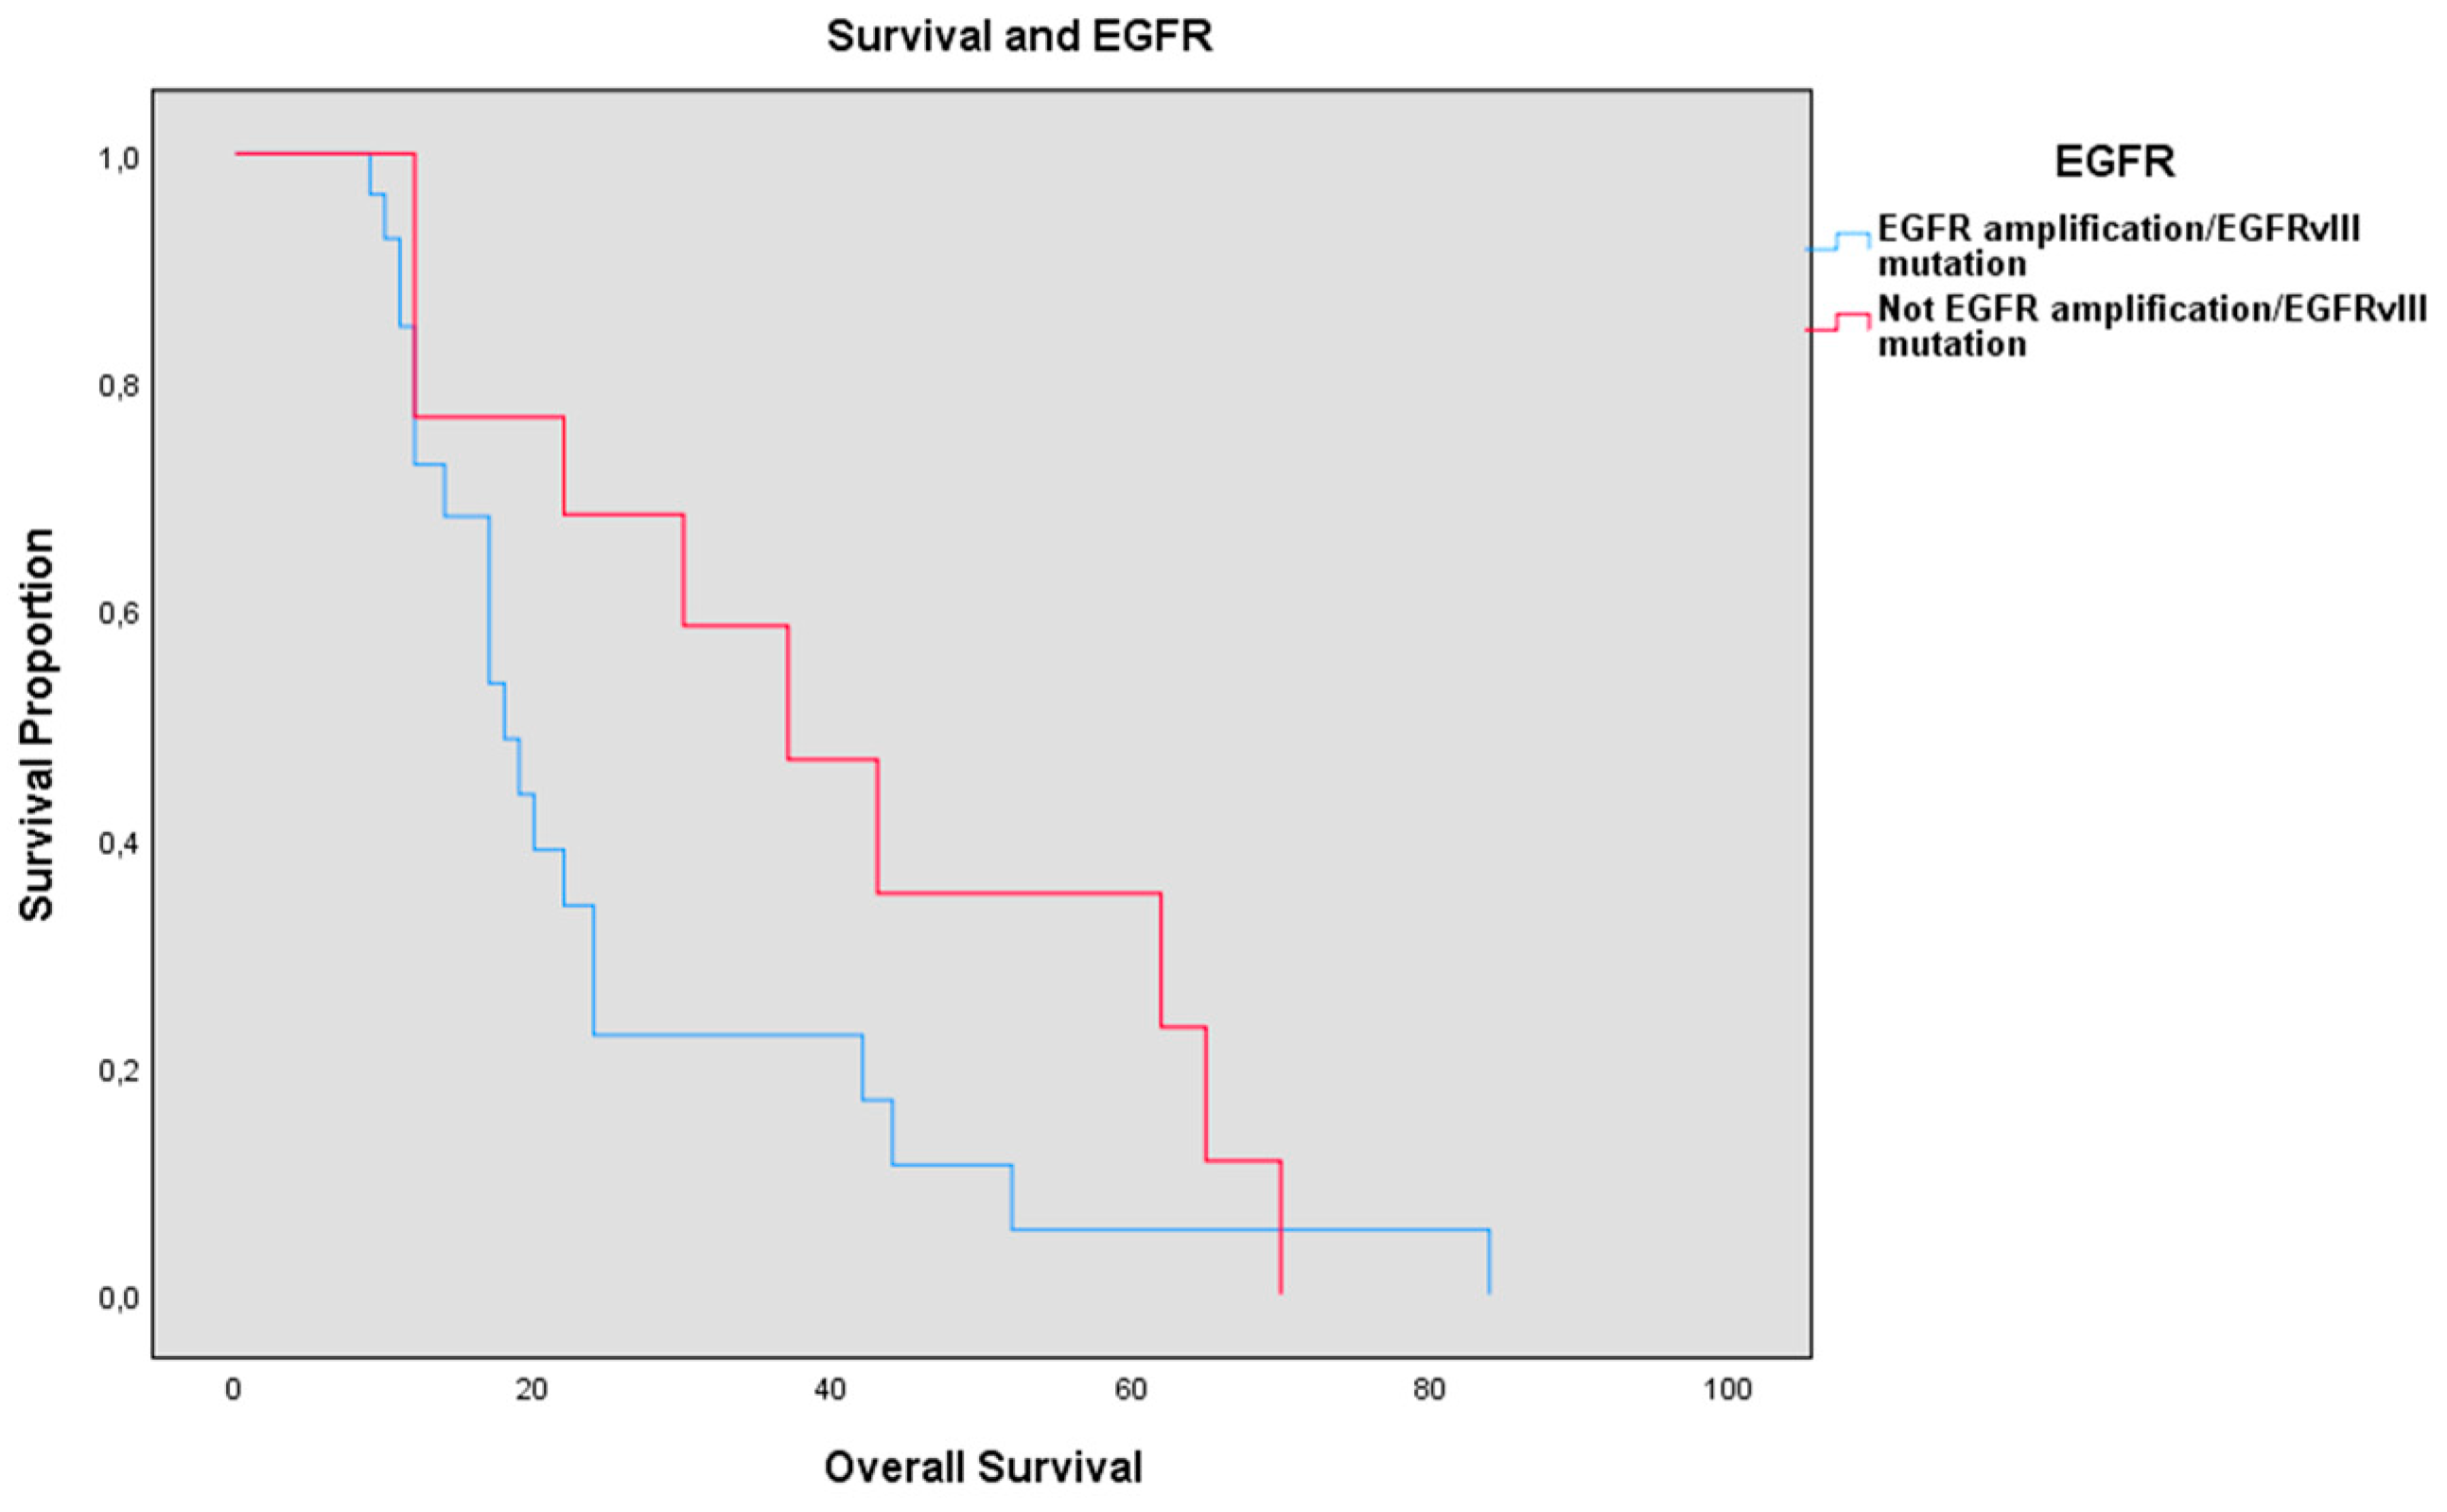
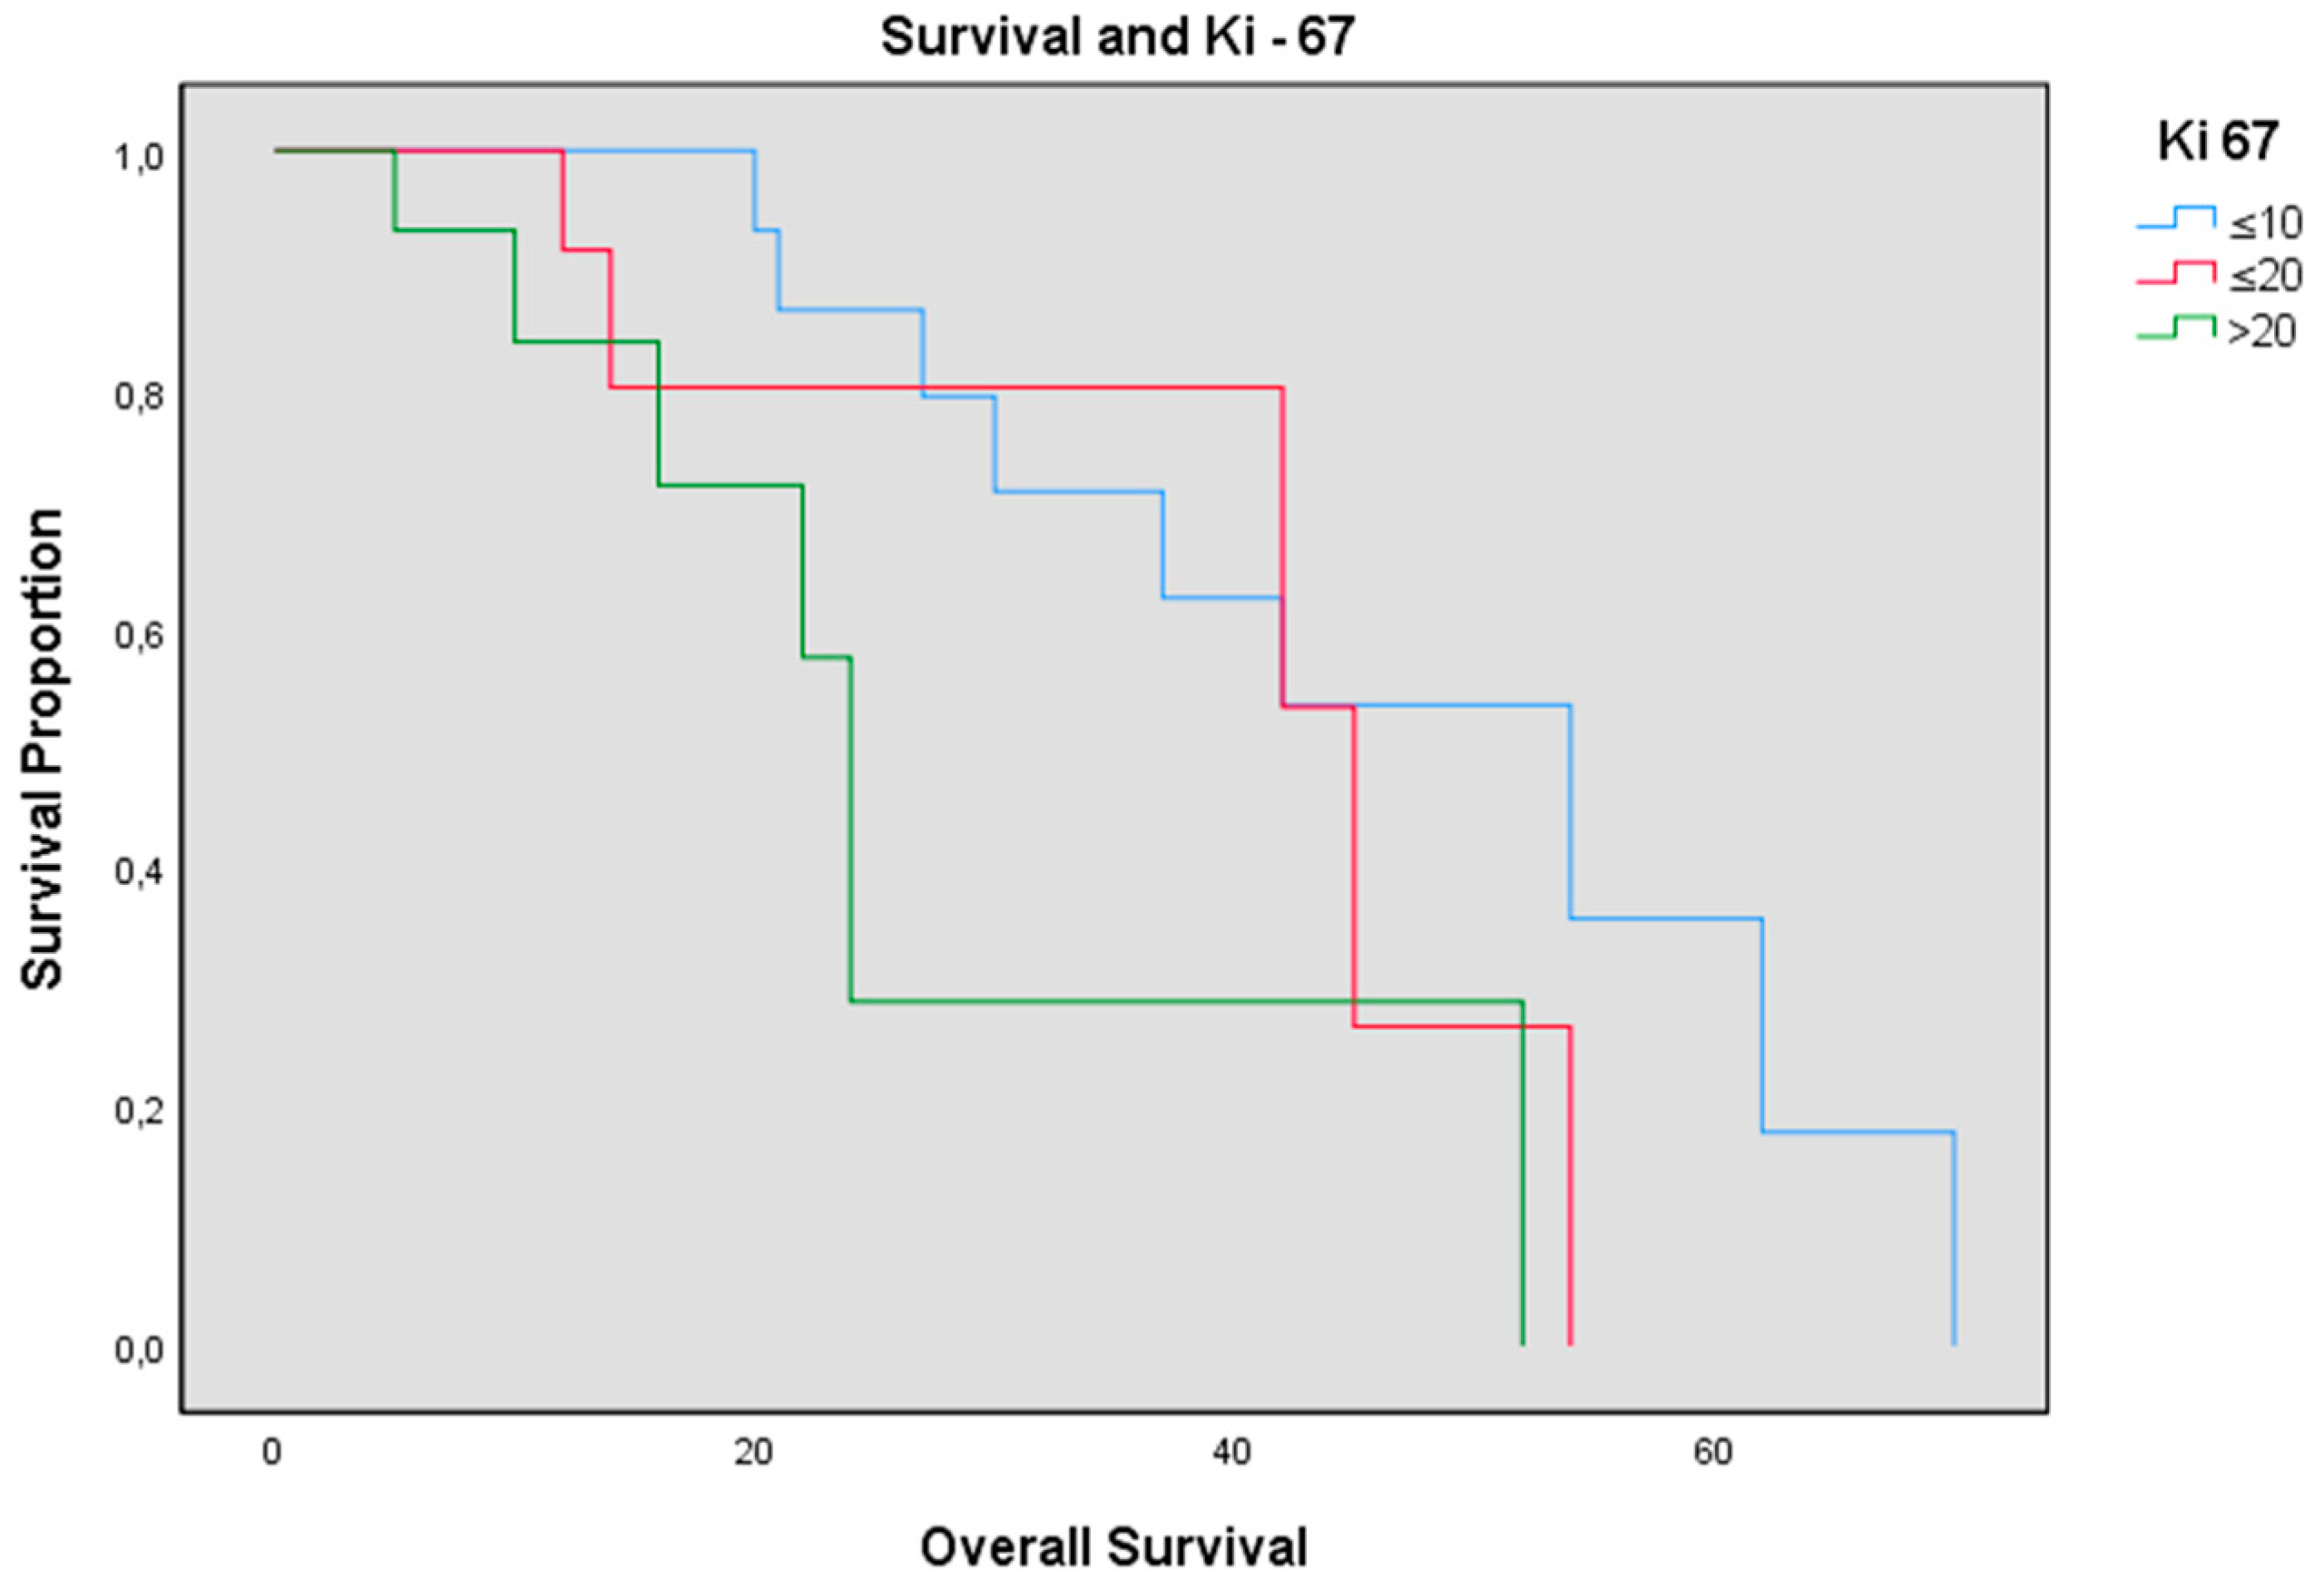
2. Results
3. Discussion
4. Materials and Methods
4.1. Characteristics of the Patients
4.2. Characteristics of the Tumors
4.3. Treatment Characteristics
4.4. Statistical Analysis
5. Conclusions
Author Contributions
Funding
Conflicts of Interest
Abbreviations
| ATRX | Adult thalassemia mental retardation x-linked |
| CBV | Cerebral blood volume |
| CSC | Cancer stem cell |
| DCS | Direct cortical stimulation |
| DWI | Diffusion-weighted imaging |
| EGFR | Epidermal growth factor receptor |
| EOR | Extent of resection |
| GF | Growth factor |
| GTR | Gross total resection |
| ICP | Intracranic pressure |
| IDH1 | Isocitrate dehydrogenase-1 |
| ITH | Intratumor heterogeneity |
| KPS | Karnofsky performance status |
| LEV | Levetiracetam |
| MGMT | O-6-methylguanine DNA methyltransferase |
| MTT | Mean transit time |
| NSC | Neural stem cell |
| OS | Overall Survival |
| PFS | Progression-free survival |
| PWI | Perfusion-weighted imaging |
| RTK | Receptor tyrosine kinases |
| STD | Standard error |
| STR | Subtotal resection |
| VPA | Valproic acid |
| TMZ | Temozolomide |
References
- Perry, A.; Wesseling, P. Histologic Classification of Gliomas. Handbook of Clinical Neurology; Elsevier: Amsterdam, The Netherlands, 2016; Volume 134. [Google Scholar]
- Ryskalin, L.; Gaglione, A.; Limanaqi, F.; Biagioni, F.; Familiari, P.; Frati, A.; Esposito, V.; Fornai, F. The autophagy status of cancer stem cells in gliobastoma multiforme: From cancer promotion to therapeutic strategies. Int. J. Mol. Sci. 2019, 20, 3824. [Google Scholar] [CrossRef] [PubMed]
- Louis, D.N.; Perry, A.; Reifenberger, G.; Von Deimling, A.; Figarella-Branger, D.; Cavenee, W.K.; Ohgaki, H.; Wiestler, O.D.; Kleihues, P.; Ellison, D.W. The 2016 World Health Organization Classification of Tumors of the Central Nervous System: A summary. Acta Neuropathol. 2016, 131, 803–820. [Google Scholar] [CrossRef] [PubMed]
- Ostrom, Q.T.; Gittleman, H.; Liao, P.; Rouse, C.; Chen, Y.; Dowling, J.; Wolinsky, Y.; Kruchko, C.; Barnholtz-Sloan, J. CBTRUS statistical report: Primary brain and central nervous system tumors diagnosed in the United States in 2007–2011. Neuro Oncol. 2014, 16, 1–63. [Google Scholar] [CrossRef] [PubMed]
- Gilbert, M.R.; Wang, M.; Aldape, K.D.; Stupp, R.; Hegi, M.E.; Jaeckle, K.A.; Armstrong, T.S.; Wefel, J.S.; Won, M.; Mahajan, A.; et al. Dose-dense temozolomide for newly diagnosed glioblastoma: A randomized phase III clinical trial. J. Clin. Oncol. 2013, 31, 4085–4091. [Google Scholar] [CrossRef] [PubMed]
- Stupp, R.; Mason, W.P.; Van Den Bent, M.J.; Weller, M.; Fisher, B.; Taphoorn, M.J.; Belanger, K.; Brandes, A.A.; Marosi, C.; Curschmann, J.; et al. Radiotherapy plus concomitant and adjuvant temozolomide for glioblastoma. N. Engl. J. Med. 2005, 352, 987–996. [Google Scholar] [CrossRef]
- Mansouri, A.; Karamchandani, J.; Das, S. Molecular Genetics of Secondary Glioblastoma. In Glioblastoma; De Vleeschouwer, S., Ed.; Codon Publications: Brisbane, Australia, 2017. [Google Scholar]
- Ohgaki, H.; Kleihues, P. Genetic pathways to primary and secondary glioblastoma. Am. J. Pathol. 2007, 170, 1445–1453. [Google Scholar] [CrossRef]
- Kerkhof, M.; Dielemans, J.C.; van Breemen, M.S.; Zwinkels, H.; Walchenbach, R.; Taphoorn, M.J.; Vecht, C.J. Effect of valproic acid on seizure control and on survival in patients with glioblastoma multiforme. Neuro Oncol. 2013, 15, 961–967. [Google Scholar] [CrossRef]
- Franceschi, E.; Tosoni, A.; Minichillo, S.; Depenni, R.; Paccapelo, A.; Bartolini, S.; Michiara, M.; Pavesi, G.; Urbini, B.; Cavallo, M.A.; et al. The Prognostic Roles of Gender and O6-Methylguanine-DNA Methyltransferase Methylation Status in Glioblastoma Patients: The Female Power. World Neurosurg. 2018, 112, e342–e347. [Google Scholar] [CrossRef]
- Vecht, C.J.; Kerkhof, M.; Duran-Pena, A. Seizure Prognosis in Brain Tumors: New Insights and Evidence-Based Management. Oncologist 2014, 19, 751–759. [Google Scholar] [CrossRef]
- Kim, Y.H.; Kim, T.; Joo, J.D.; Han, J.H.; Kim, Y.J.; Kim, I.A.; Yun, C.H.; Kim, C.Y. Survival benefit of levetiracetam in patients treated with concomitant chemoradiotherapy and adjuvant chemotherapy with temozolomide for glioblastoma multiforme. Cancer 2015, 121, 2926–2932. [Google Scholar] [CrossRef] [PubMed]
- Scicchitano, B.M.; Sorrentino, S.; Proietti, G.; Lama, G.; Dobrowolny, G.; Catizone, A.; Binda, E.; Larocca, L.M.; Sica, G. Levetiracetam enhances the temozolomide effect on glioblastoma stem cell proliferation and apoptosis. Cancer Cell Int. 2018, 18, 1–18. [Google Scholar] [CrossRef] [PubMed]
- Happold, C.; Gorlia, T.; Chinot, O.; Gilbert, M.R.; Nabors, L.B.; Wick, W.; Pugh, S.L.; Hegi, M.; Cloughesy, T.; Reardon, D.A.; et al. Does valproic acid or levetiracetam improve survival in glioblastoma? A pooled analysis of prospective clinical trials in newly diagnosed glioblastoma. J. Clin. Oncol. 2016, 34, 731–739. [Google Scholar] [CrossRef]
- Brown, T.J.; Brennan, M.C.; Li, M.; Church, E.W.; Brandmeir, N.J.; Rakszawski, K.L.; Patel, A.S.; Rizk, E.B.; Suki, D.; Glantz, M.; et al. Association of the extent of resection with survival in glioblastoma: A systematic review and meta-Analysis. JAMA Oncol. 2016, 2, 1460–1469. [Google Scholar] [CrossRef] [PubMed]
- Bloch, O.; Han, S.J.; Cha, S.; Sun, M.Z.; Aghi, M.K.; McDermott, M.W.; Berger, M.S.; Parsa, A.T. Impact of extent of resection for recurrent glioblastoma on overall survival: Clinical article. J. Neurosurg. 2012, 117, 1032–1038. [Google Scholar] [CrossRef]
- Li, Y.M.; Suki, D.; Hess, K.; Sawaya, R. The influence of maximum safe resection of glioblastoma on survival in 1229 patients: Can we do better than gross-total resection? J. Neurosurg. 2016, 124, 977–988. [Google Scholar] [CrossRef]
- Yong, R.L.; Wu, T.; Mihatov, N.; Shen, M.J.; Brown, M.A.; Zaghloul, K.A.; Park, G.E.; Park, J.K. Residual tumor volume and patient survival following reoperation for recurrent glioblastoma. J. Neurosurg. 2014, 121, 802–809. [Google Scholar] [CrossRef] [PubMed]
- Jiapaer, S.; Furuta, T.; Tanaka, S.; Kitabayashi, T.; Nakada, M. Potential Strategies Overcoming the Temozolomide Resistance for Glioblastoma. Neurol. Med. Chir. 2018, 58, 405–421. [Google Scholar] [CrossRef]
- Zhao, H.; Wang, S.; Song, C.; Zha, Y.; Li, L. The prognostic value of MGMT promoter status by pyrosequencing assay for glioblastoma patients’ survival: A meta-analysis. World J. Surg. Oncol. 2016, 14, 261. [Google Scholar] [CrossRef]
- Jiao, Y.; Killela, P.J.; Reitman, Z.J.; Rasheed, B.A.; Heaphy, C.M.; de Wilde, R.F.; Rodriguez, F.J.; Rosemberg, S.; Rosemberg, S.M.; Bettegowda, C.; et al. Frequent ATRX, CIC, FUBP1 and IDH1 mutations refine the classification of malignant gliomas. Oncotarget 2012, 3, 709–722. [Google Scholar] [CrossRef]
- Ramamoorthy, M.; Smith, S. Loss of ATRX suppresses resolution of telomere cohesion to control recombination in ALT cancer cells. Cancer Cell 2015, 28, 357–369. [Google Scholar] [CrossRef]
- Liu, N.; Wang, P.; Song, H.; Kong, L.; Yao, K.; Qi, X.; Li, S.W.; Yan, C.X.; Yu, C.J. Immunostaining of IDH-1 R132H and ATRX proteins in the classification of adult glioblastomas. Int. J. Clin. Exp. Pathol. 2016, 9, 12849–12854. [Google Scholar]
- Cai, J.; Chen, J.; Zhang, W.; Yang, P.; Zhang, C.; Li, M.; Yao, K.; Wang, H.; Li, Q.; Jiang, T.; et al. Loss of ATRX, associated with DNA methylation pattern of chromosome end, impacted biological behaviors of astrocytic tumors. Oncotarget 2015, 6, 18105–18115. [Google Scholar] [CrossRef] [PubMed][Green Version]
- Weller, M.; Butowski, N.; Tran, D.D.; Recht, L.D.; Lim, M.; Hirte, H.; Ashby, L.; Mechtler, L.; Goldlust, S.A.; Drappatz, J.; et al. Rindopepimut with temozolomide for patients with newly diagnosed, EGFRvIII-expressing glioblastoma (ACT IV): A randomised, double-blind, international phase 3 trial. Lancet Oncol. 2017, 18, 1373–1385. [Google Scholar] [CrossRef]
- Keller, S.; Schmidt, M.H.H. EGFR and EGFRvIII Promote Angiogenesis and Cell Invasion in Glioblastoma: Combination Therapies for an Effective Treatment. Int. J. Mol. Sci. 2017, 18, 1295. [Google Scholar] [CrossRef] [PubMed]
- Gan, H.K.; Reardon, D.A.; Lassman, A.B.; Merrell, R.; Van Den Bent, M.; Butowski, N.; Lwin, Z.; Wheeler, H.; Fichtel, L.; Gomez, E.J.; et al. Safety, pharmacokinetics, and antitumor response of depatuxizumab mafodotin as monotherapy or in combination with temozolomide in patients with glioblastoma. Neuro Oncol. 2018, 20, 838–847. [Google Scholar] [CrossRef] [PubMed]
- Reardon, D.A.; Lassman, A.B.; Van Den Bent, M.; Kumthekar, P.; Merrell, R.; Scott, A.M.; Lee, H.J. Efficacy and safety results of ABT-414 in combination with radiation and temozolomide in newly diagnosed glioblastoma. Neuro Oncol. 2017, 19, 965–975. [Google Scholar] [CrossRef] [PubMed]
- Wang, X.; Chen, J.X.; Liu, J.P.; You, C.; Liu, Y.H.; Mao, Q. Gain of function of mutant TP53 in glioblastoma: Prognosis and response to temozolomide. Ann. Surg. Oncol. 2014, 21, 1337–1344. [Google Scholar] [CrossRef]
- Alkhaibary, A.; Alassiri, A.H.; AlSufiani, F.; Alharbi, M.A. Ki-67 labeling index in glioblastoma; does it really matter? Hematol. Oncol. Stem Cell Ther. 2019, 12, 82–88. [Google Scholar] [CrossRef]
- Tabachnick, B.G.; Fidell, L.S. Using Multivariate Statistics, 6th ed.; Pearson Education: Boston, MA, USA, 2013; p. 983. [Google Scholar]


| Variable | % | |
|---|---|---|
| Sex | ||
| Male | 59.01 | |
| Female | 40.99 | |
| Age (years) | ||
| ≤50 | 29.54 | |
| 51–75 | 59.10 | |
| >75 | 11.36 | |
| Preop-KPS | ||
| ≤50 | 1.32 | |
| 50–79 | 18.18 | |
| >80 | 77.27 |
| Variable | % | |
|---|---|---|
| Wild type IDH 1 | 91.18 | |
| Mutated IDH 1 | 8.82 | |
| Methylated MGMT | 45.44 | |
| Nonmethylated MGMT | 54.56 | |
| ATRX loss | 36.01 | |
| Overexpressed EGFR | 59.08 | |
| TP53 loss | 36.36 | |
| Hyperexpressed TP53 | 27.20 | |
| Focally expressed TP53 | 13.60 | |
| Ki-67 | ||
| 0–10 | 2.54 | |
| 10–20 | 34.10 | |
| >20 | 36.36 |
© 2020 by the authors. Licensee MDPI, Basel, Switzerland. This article is an open access article distributed under the terms and conditions of the Creative Commons Attribution (CC BY) license (http://creativecommons.org/licenses/by/4.0/).
Share and Cite
Salvati, M.; Bruzzaniti, P.; Relucenti, M.; Nizzola, M.; Familiari, P.; Giugliano, M.; Scafa, A.K.; Galletta, S.; Li, X.; Chen, R.; et al. Retrospective and Randomized Analysis of Influence and Correlation of Clinical and Molecular Prognostic Factors in a Mono-Operative Series of 122 Patients with Glioblastoma Treated with STR or GTR. Brain Sci. 2020, 10, 91. https://doi.org/10.3390/brainsci10020091
Salvati M, Bruzzaniti P, Relucenti M, Nizzola M, Familiari P, Giugliano M, Scafa AK, Galletta S, Li X, Chen R, et al. Retrospective and Randomized Analysis of Influence and Correlation of Clinical and Molecular Prognostic Factors in a Mono-Operative Series of 122 Patients with Glioblastoma Treated with STR or GTR. Brain Sciences. 2020; 10(2):91. https://doi.org/10.3390/brainsci10020091
Chicago/Turabian StyleSalvati, Maurizio, Placido Bruzzaniti, Michela Relucenti, Mariagrazia Nizzola, Pietro Familiari, Marco Giugliano, Anthony Kevin Scafa, Santi Galletta, Xiaobo Li, Rui Chen, and et al. 2020. "Retrospective and Randomized Analysis of Influence and Correlation of Clinical and Molecular Prognostic Factors in a Mono-Operative Series of 122 Patients with Glioblastoma Treated with STR or GTR" Brain Sciences 10, no. 2: 91. https://doi.org/10.3390/brainsci10020091
APA StyleSalvati, M., Bruzzaniti, P., Relucenti, M., Nizzola, M., Familiari, P., Giugliano, M., Scafa, A. K., Galletta, S., Li, X., Chen, R., Barbaranelli, C., Frati, A., & Santoro, A. (2020). Retrospective and Randomized Analysis of Influence and Correlation of Clinical and Molecular Prognostic Factors in a Mono-Operative Series of 122 Patients with Glioblastoma Treated with STR or GTR. Brain Sciences, 10(2), 91. https://doi.org/10.3390/brainsci10020091