Effect of PVA/SiO2 NPs Additive on the Structural, Durability, and Fire Resistance Properties of Geopolymers


Abstract
1. Introduction
2. Materials and Methods
2.1. Materials
2.2. Specimens Preparation
2.3. Testing Methods
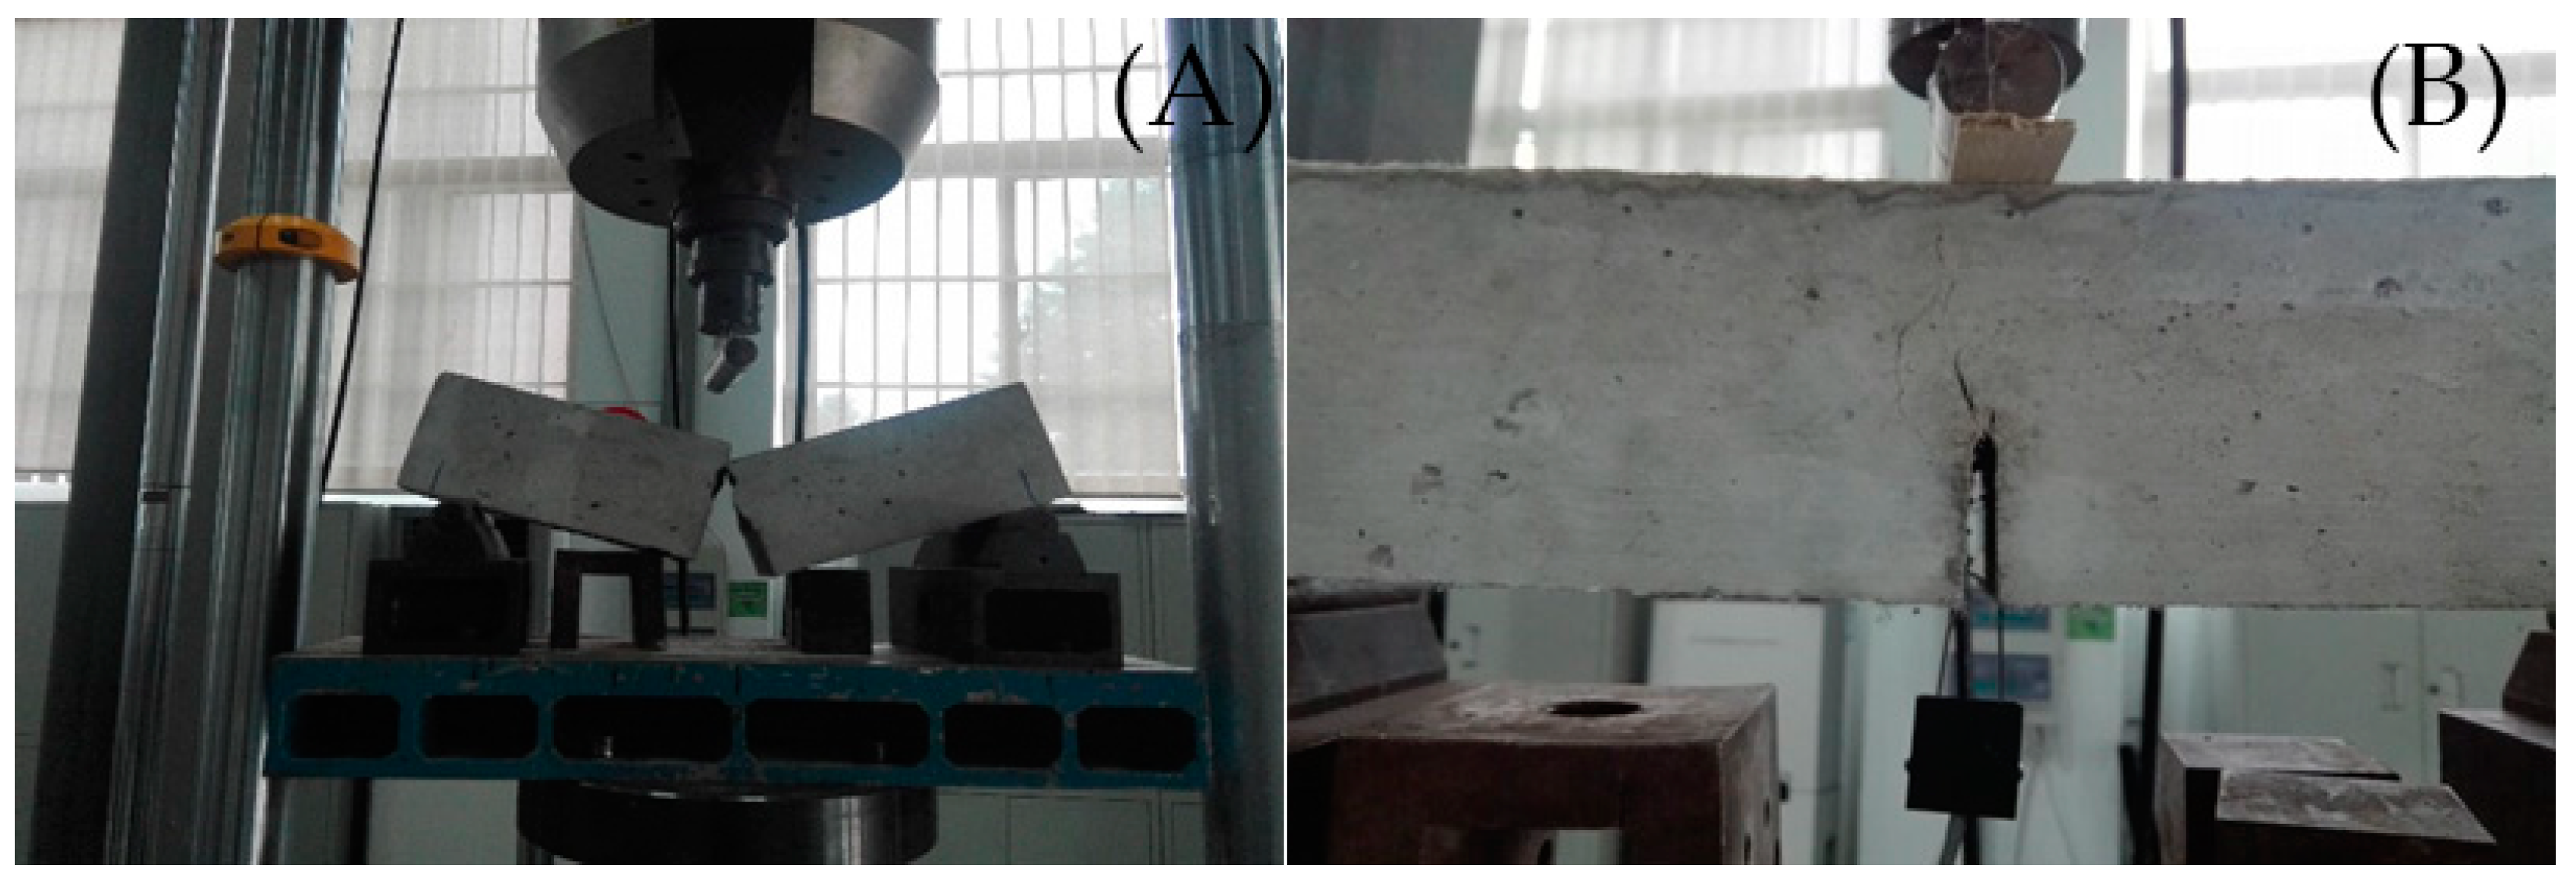
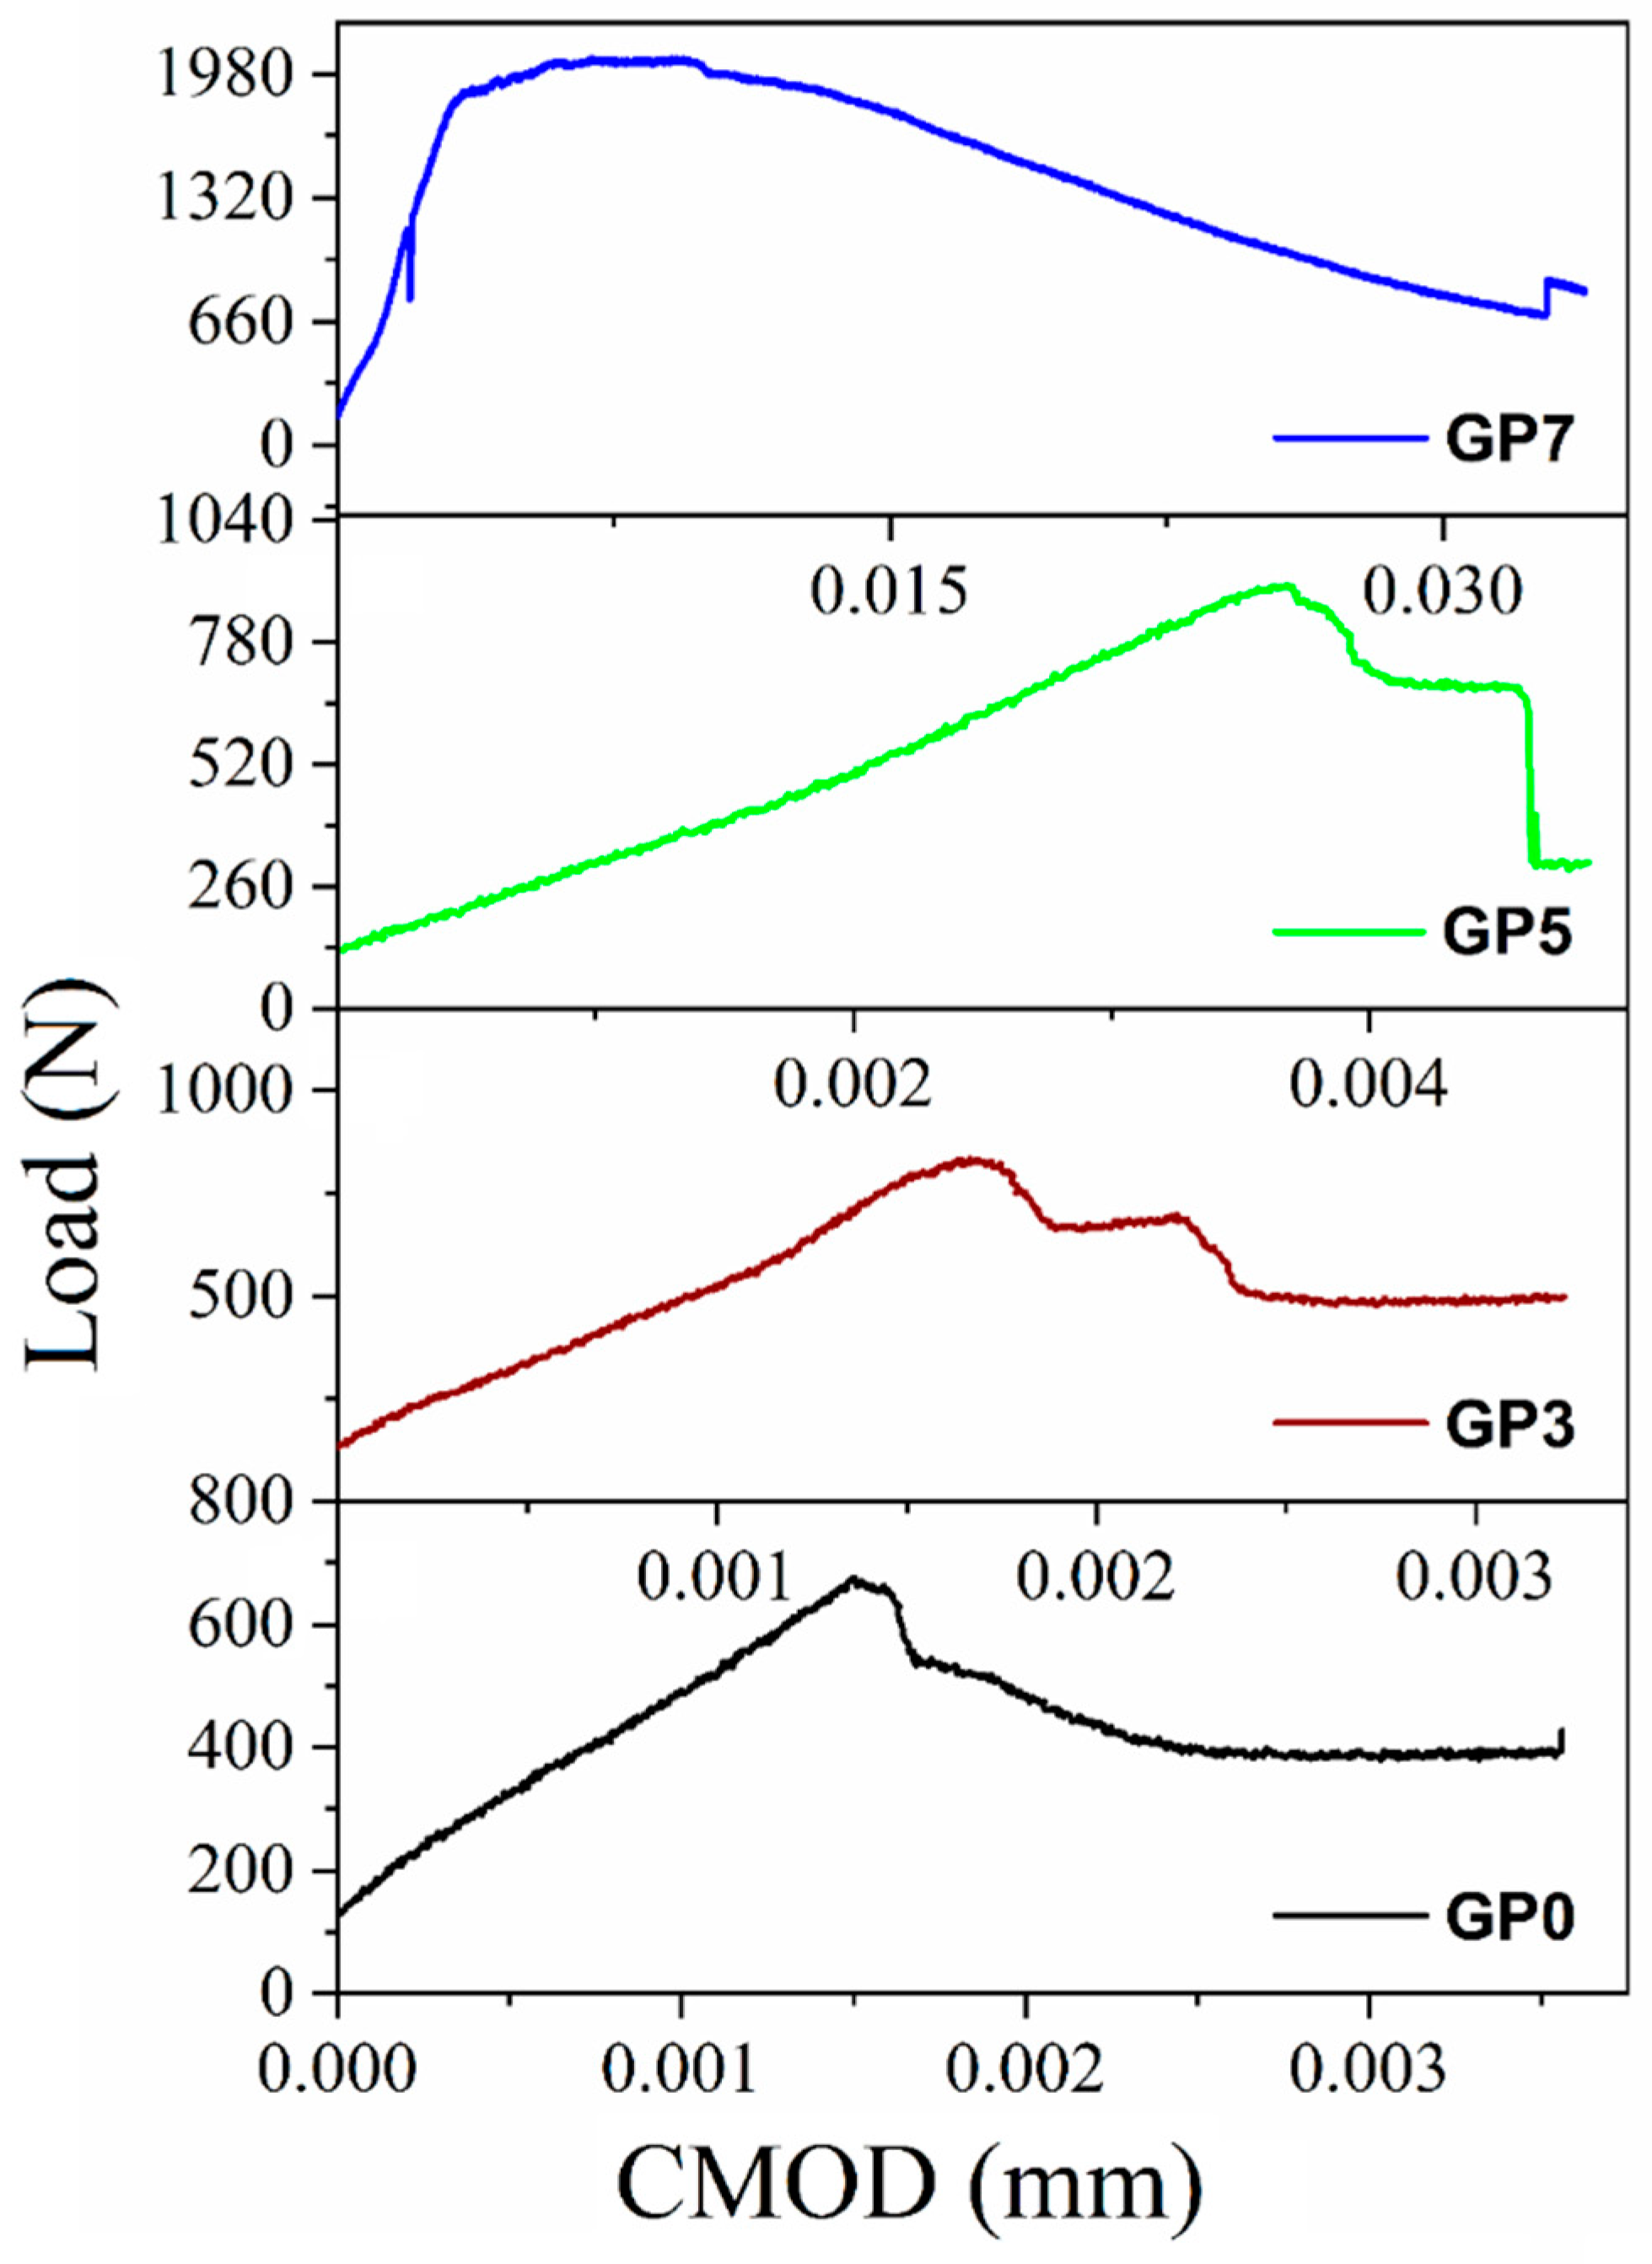
2.3.1. Fracture Test
2.3.2. Monotonic Compression Test
2.3.3. Cyclic Compression test
2.3.4. Fire Resistance
2.3.5. Freeze and Thaw Resistance
2.3.6. Pull Out Test
2.3.7. TGA-DTA Analysis
2.3.8. Microstructural Analysis
3. Results and Discussion
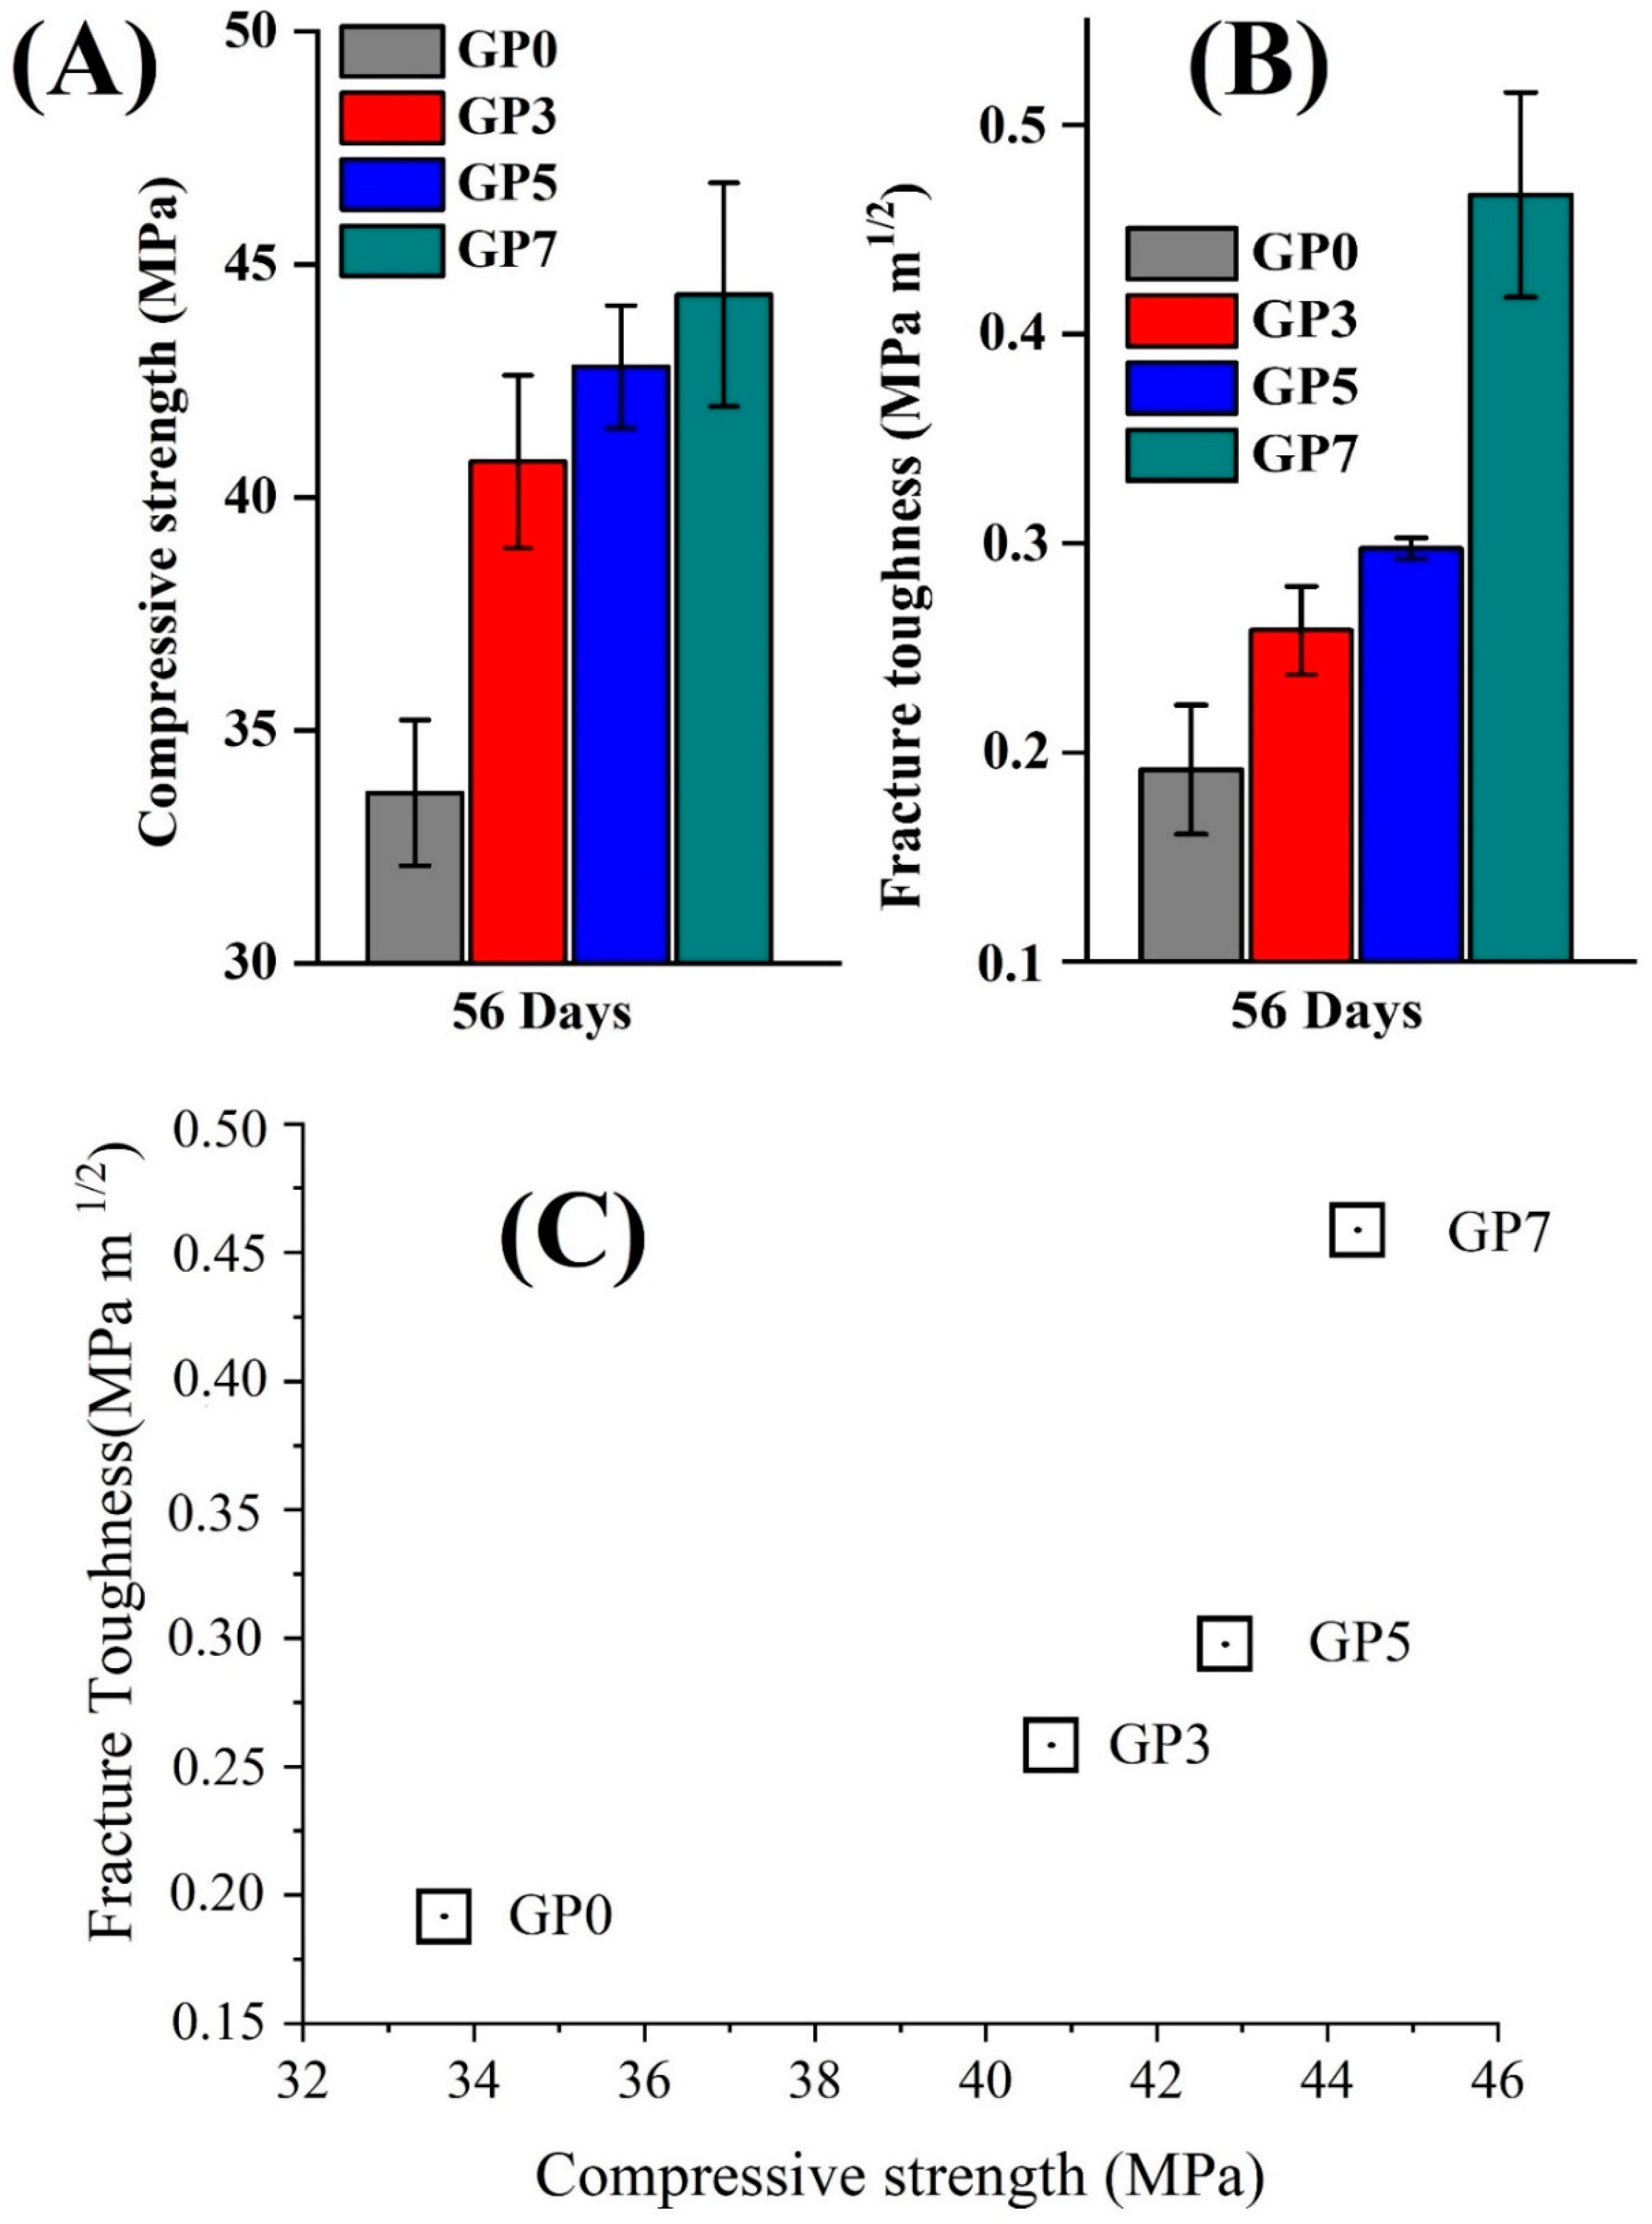
3.1. Compressive Strength
3.2. Fracture Toughness
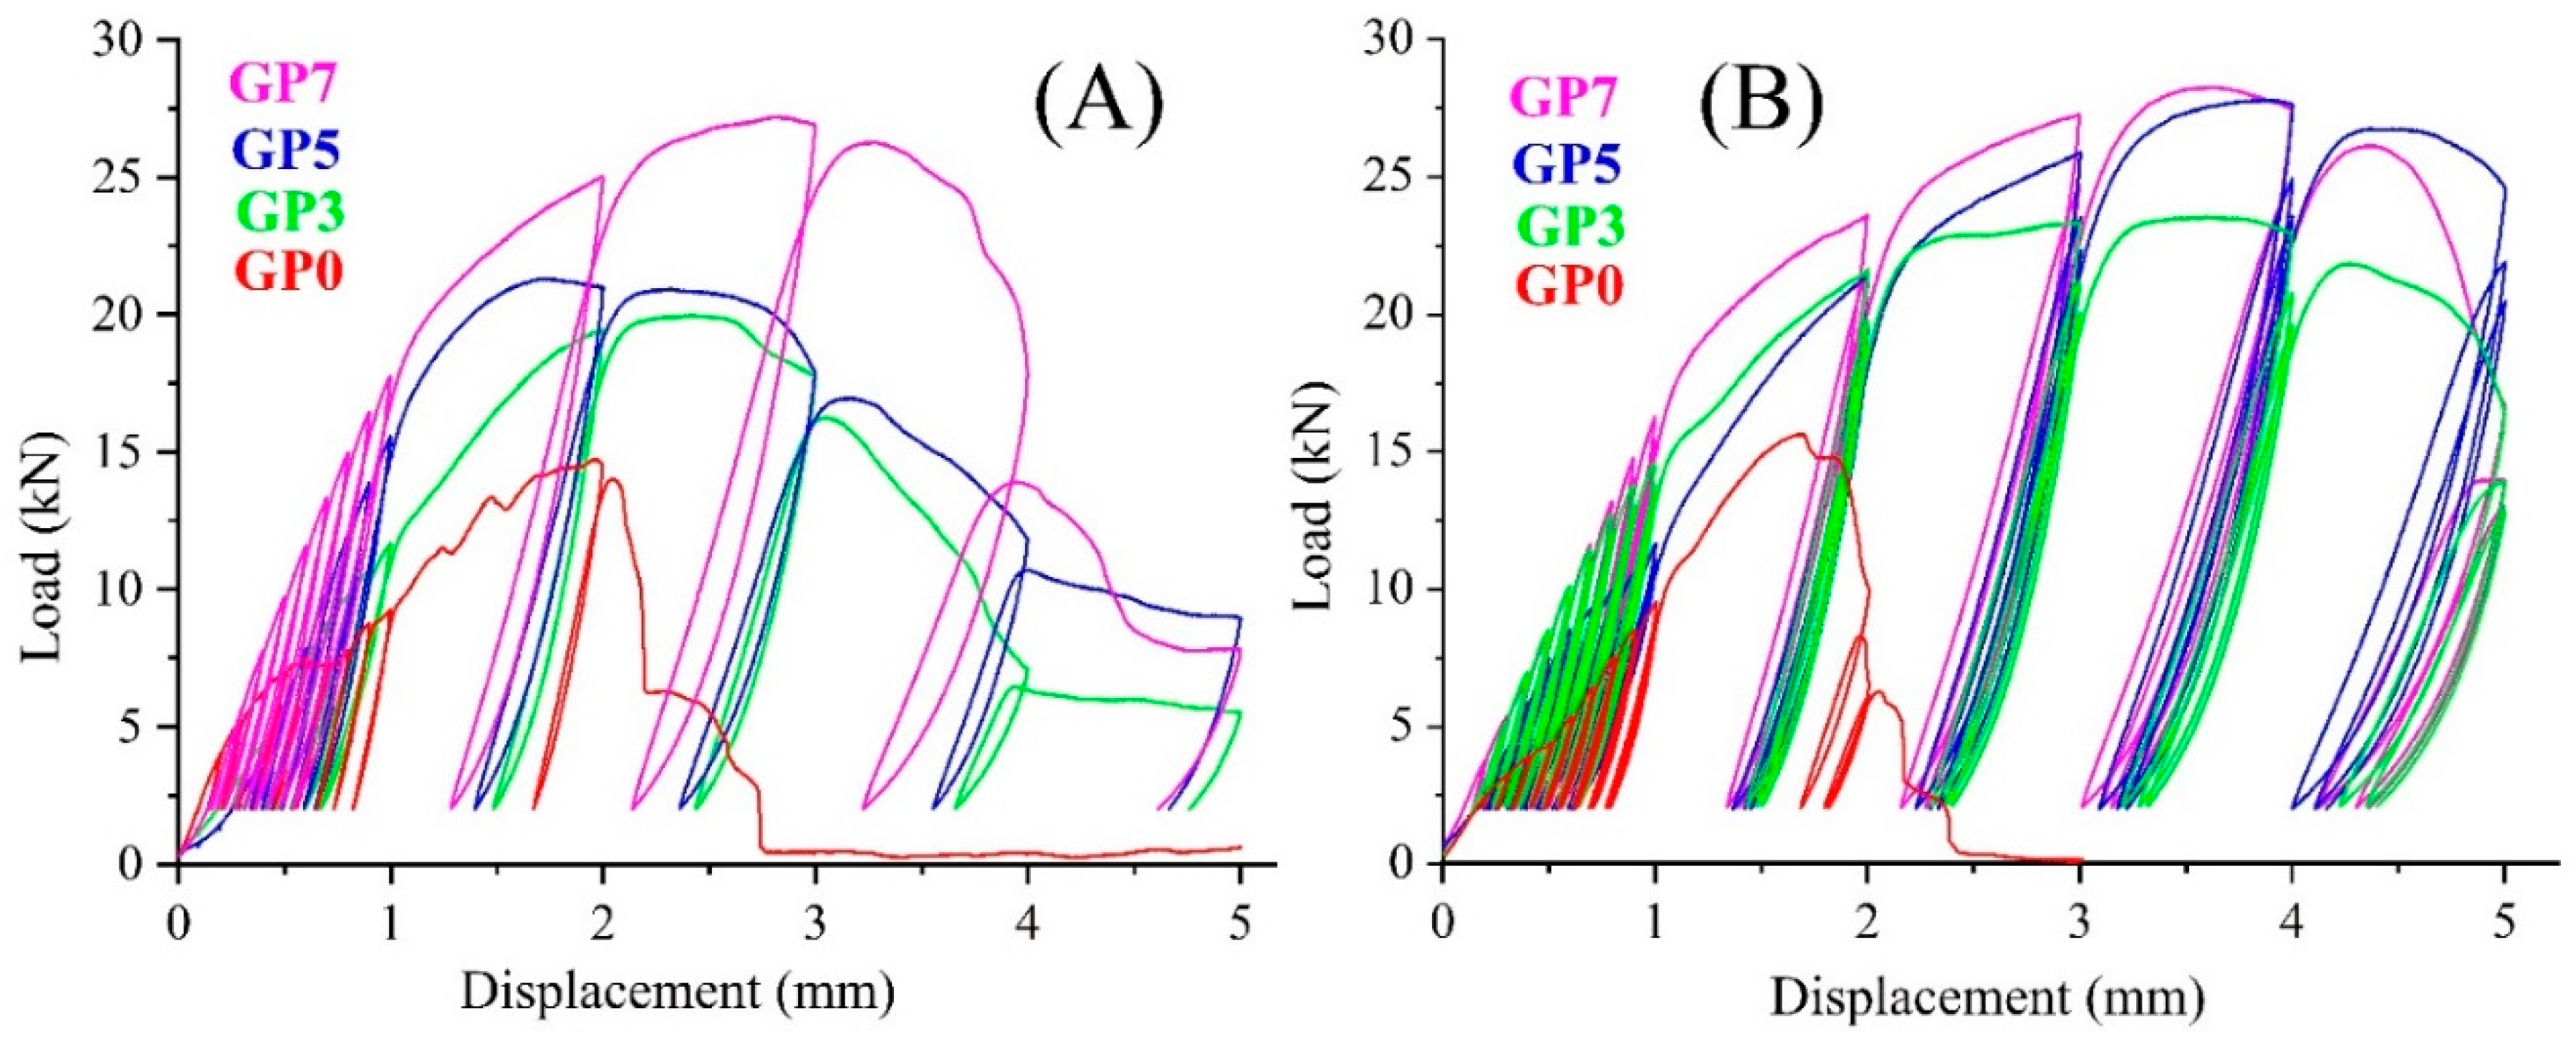
3.3. Cyclic Response
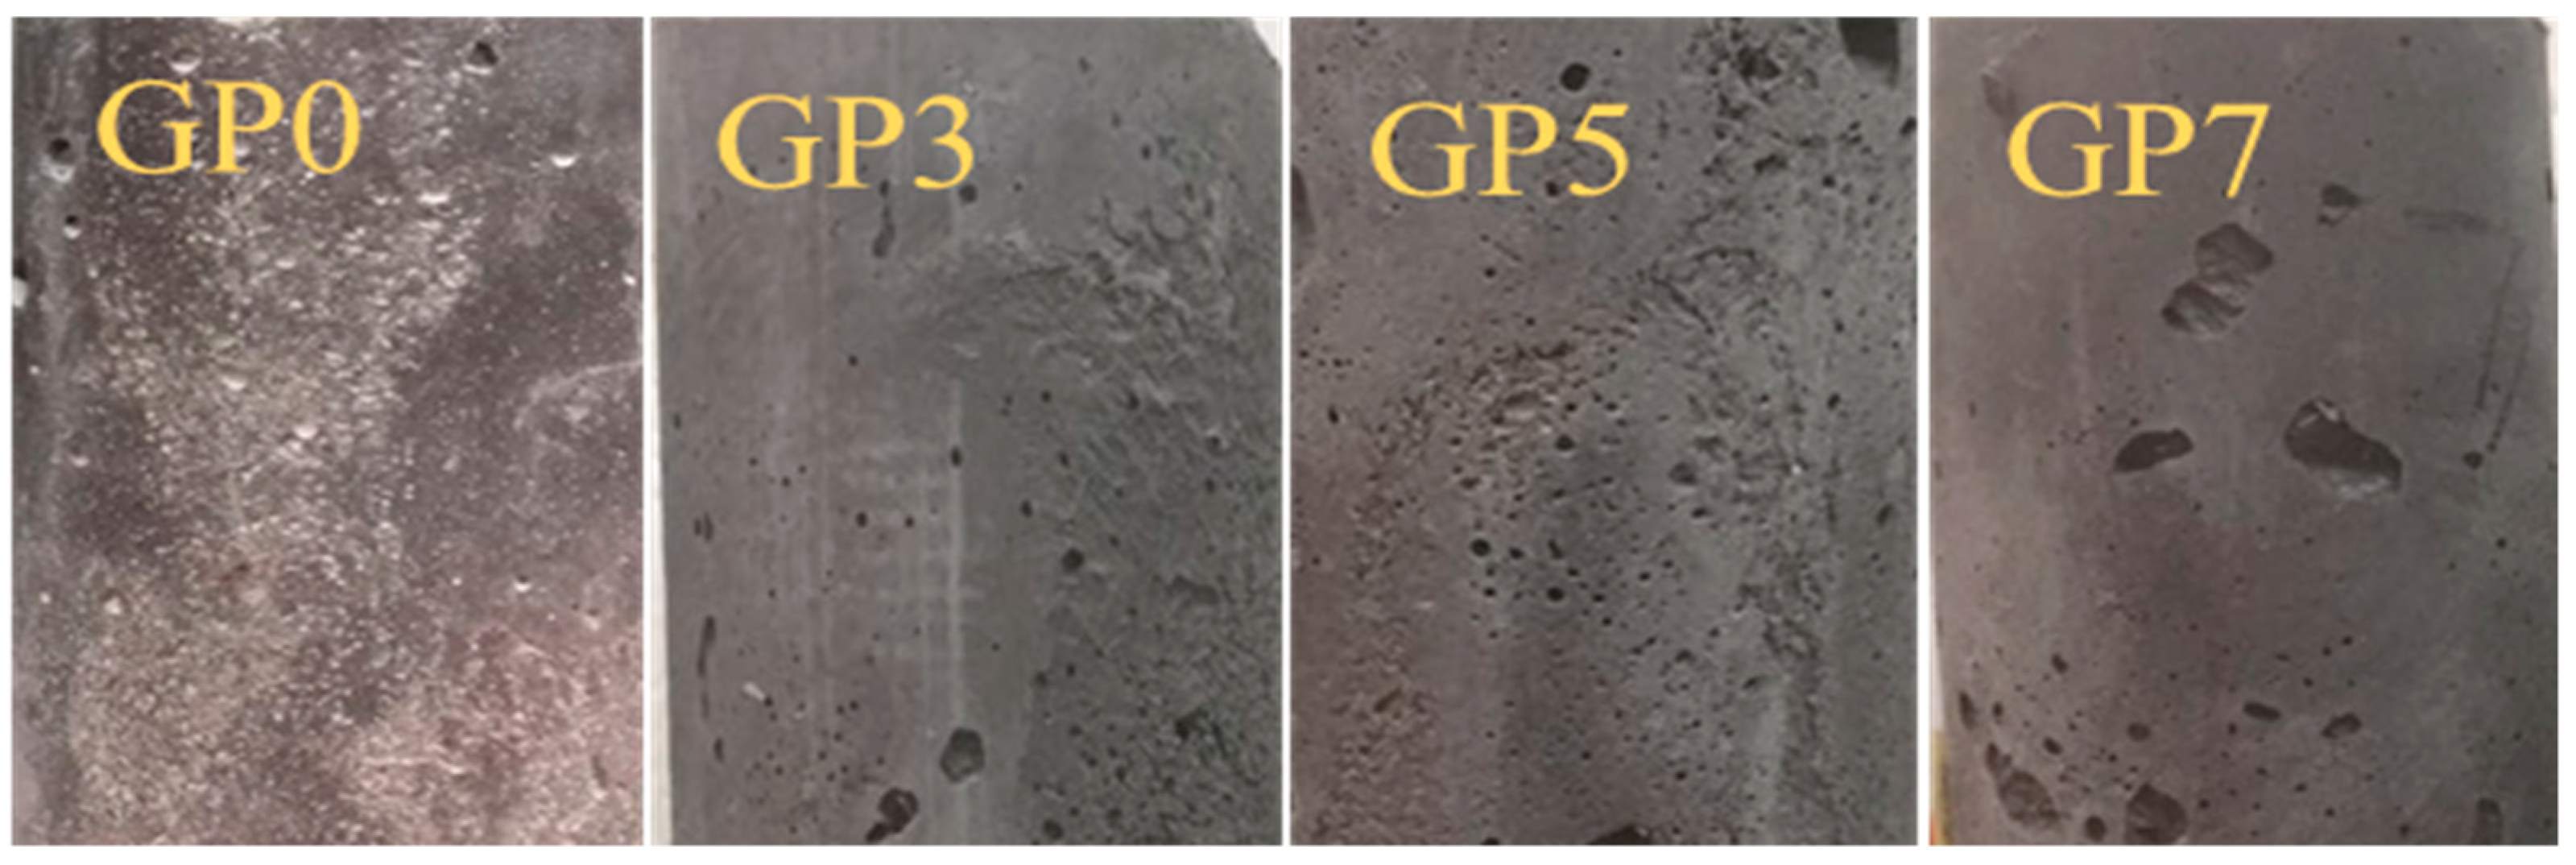
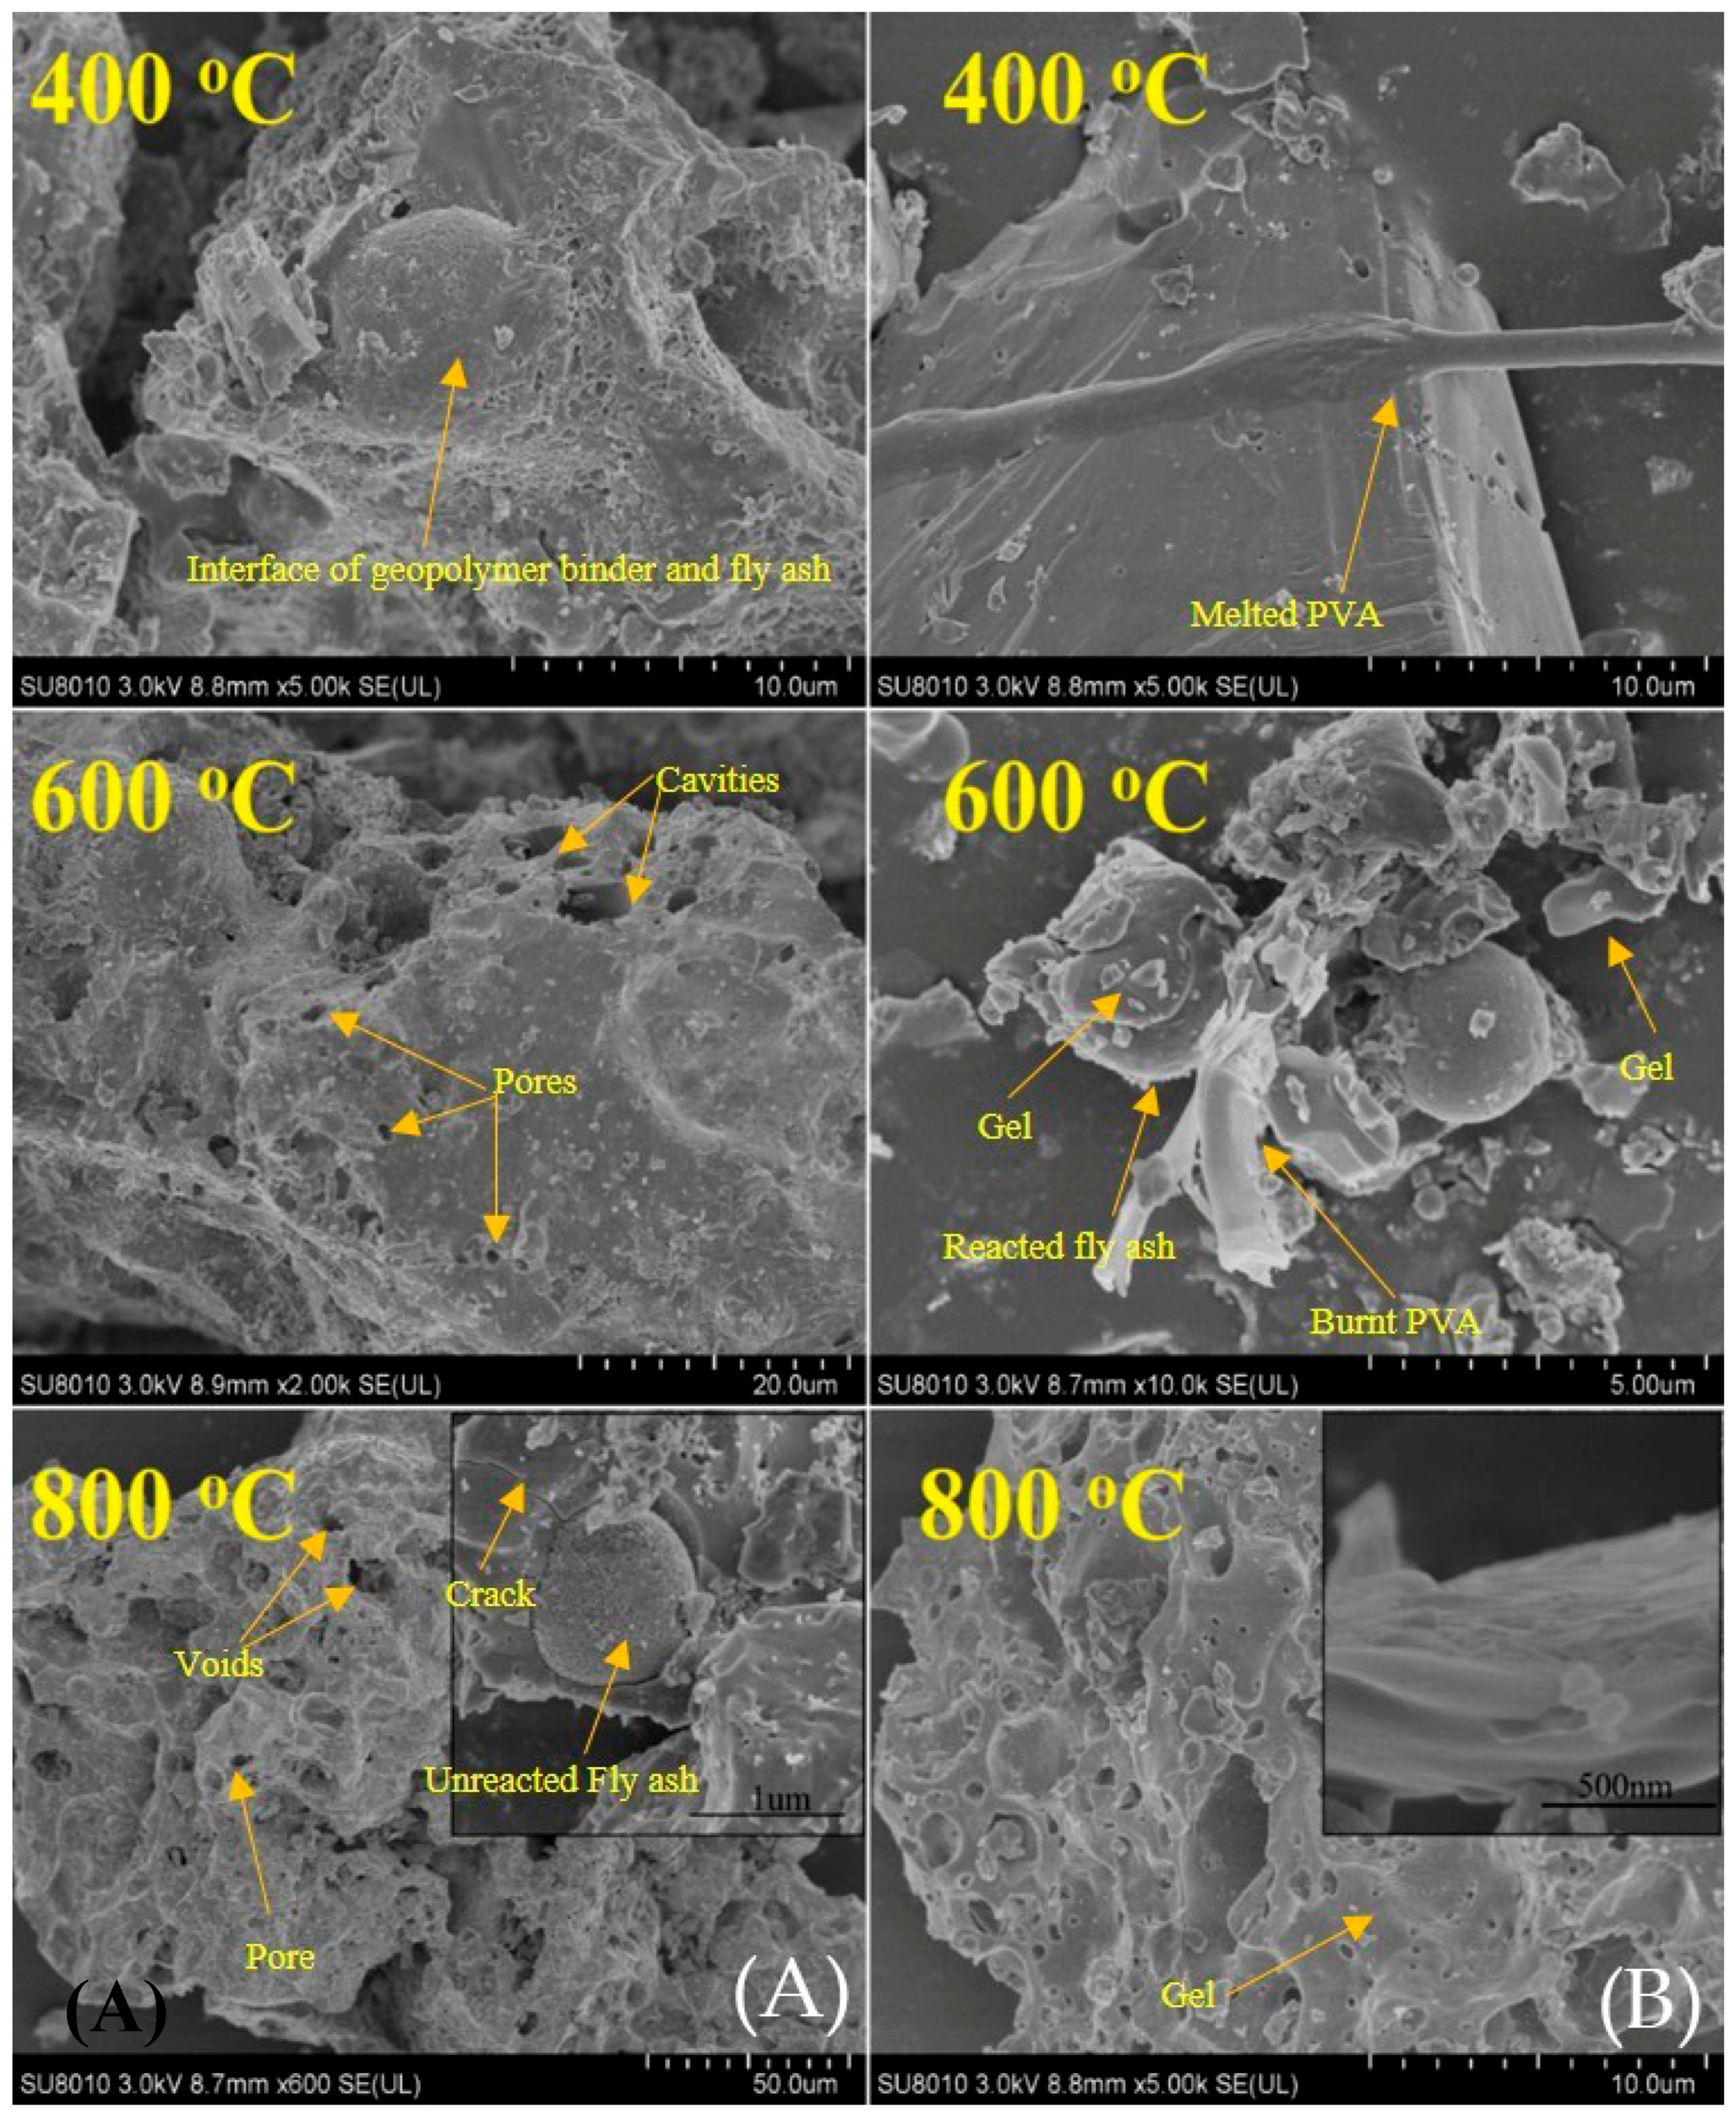
3.4. Fire Resistance
3.5. Freeze-Thaw Effect
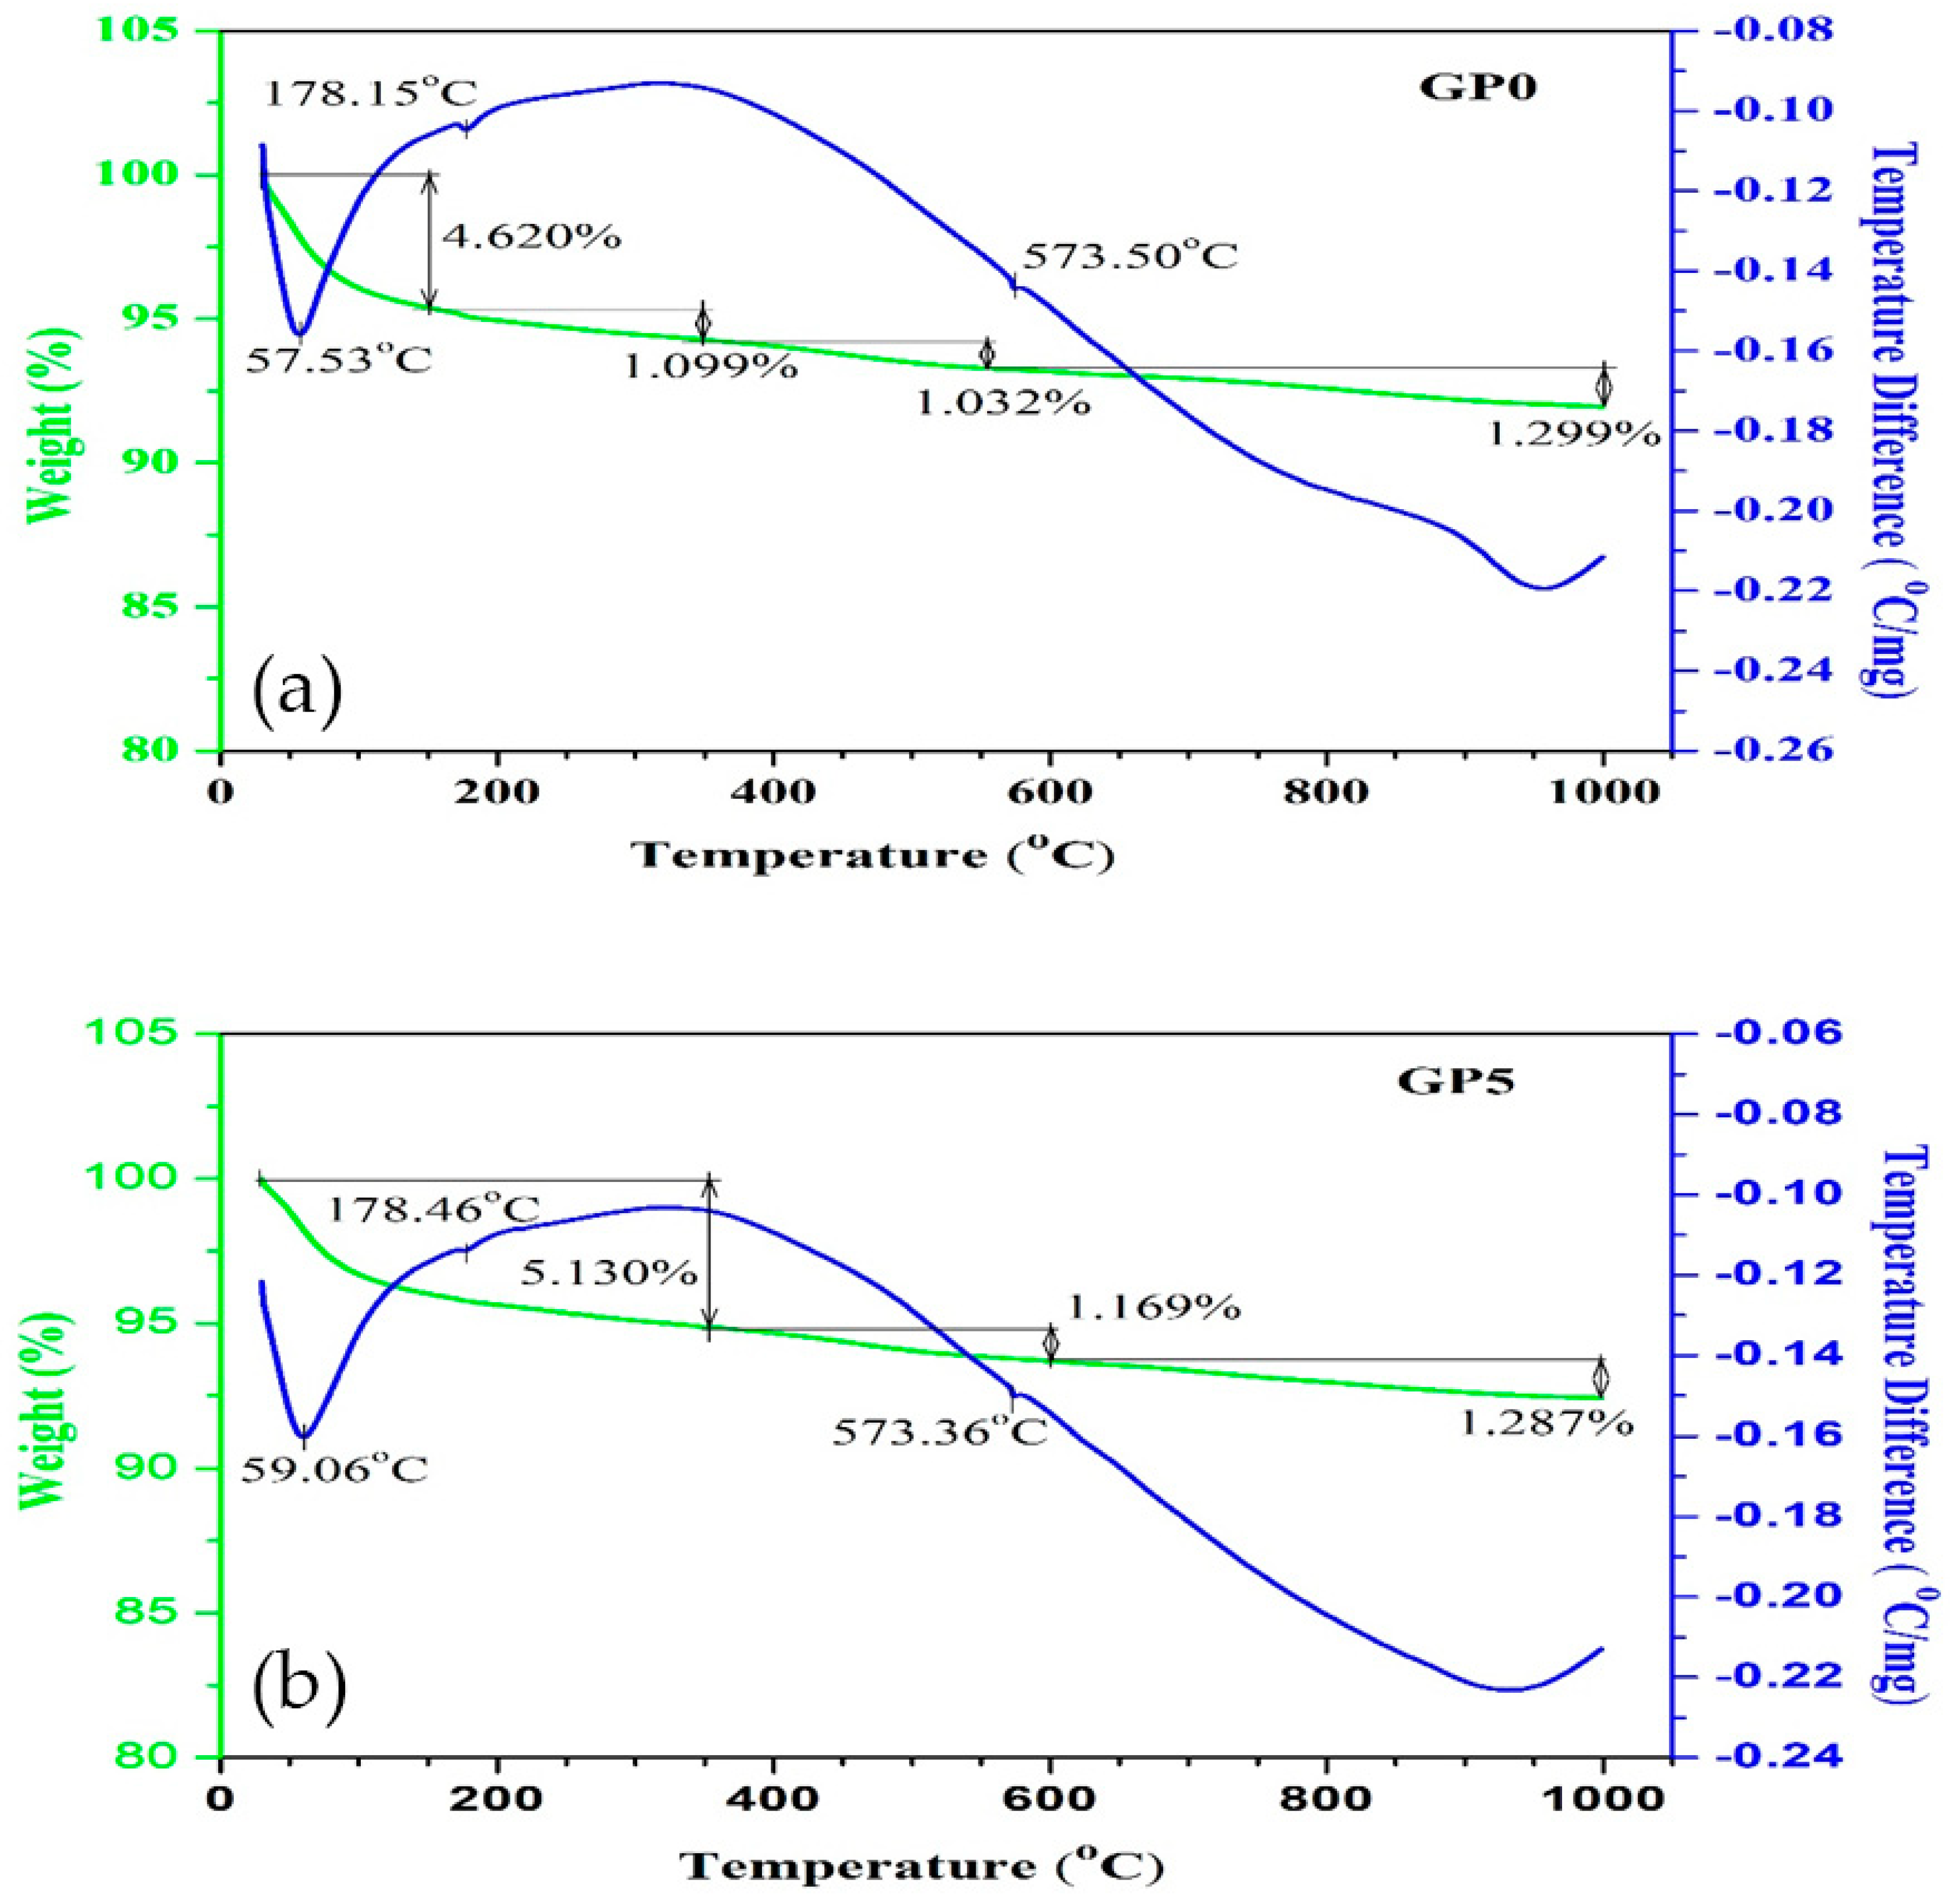
3.6. Thermal Analysis
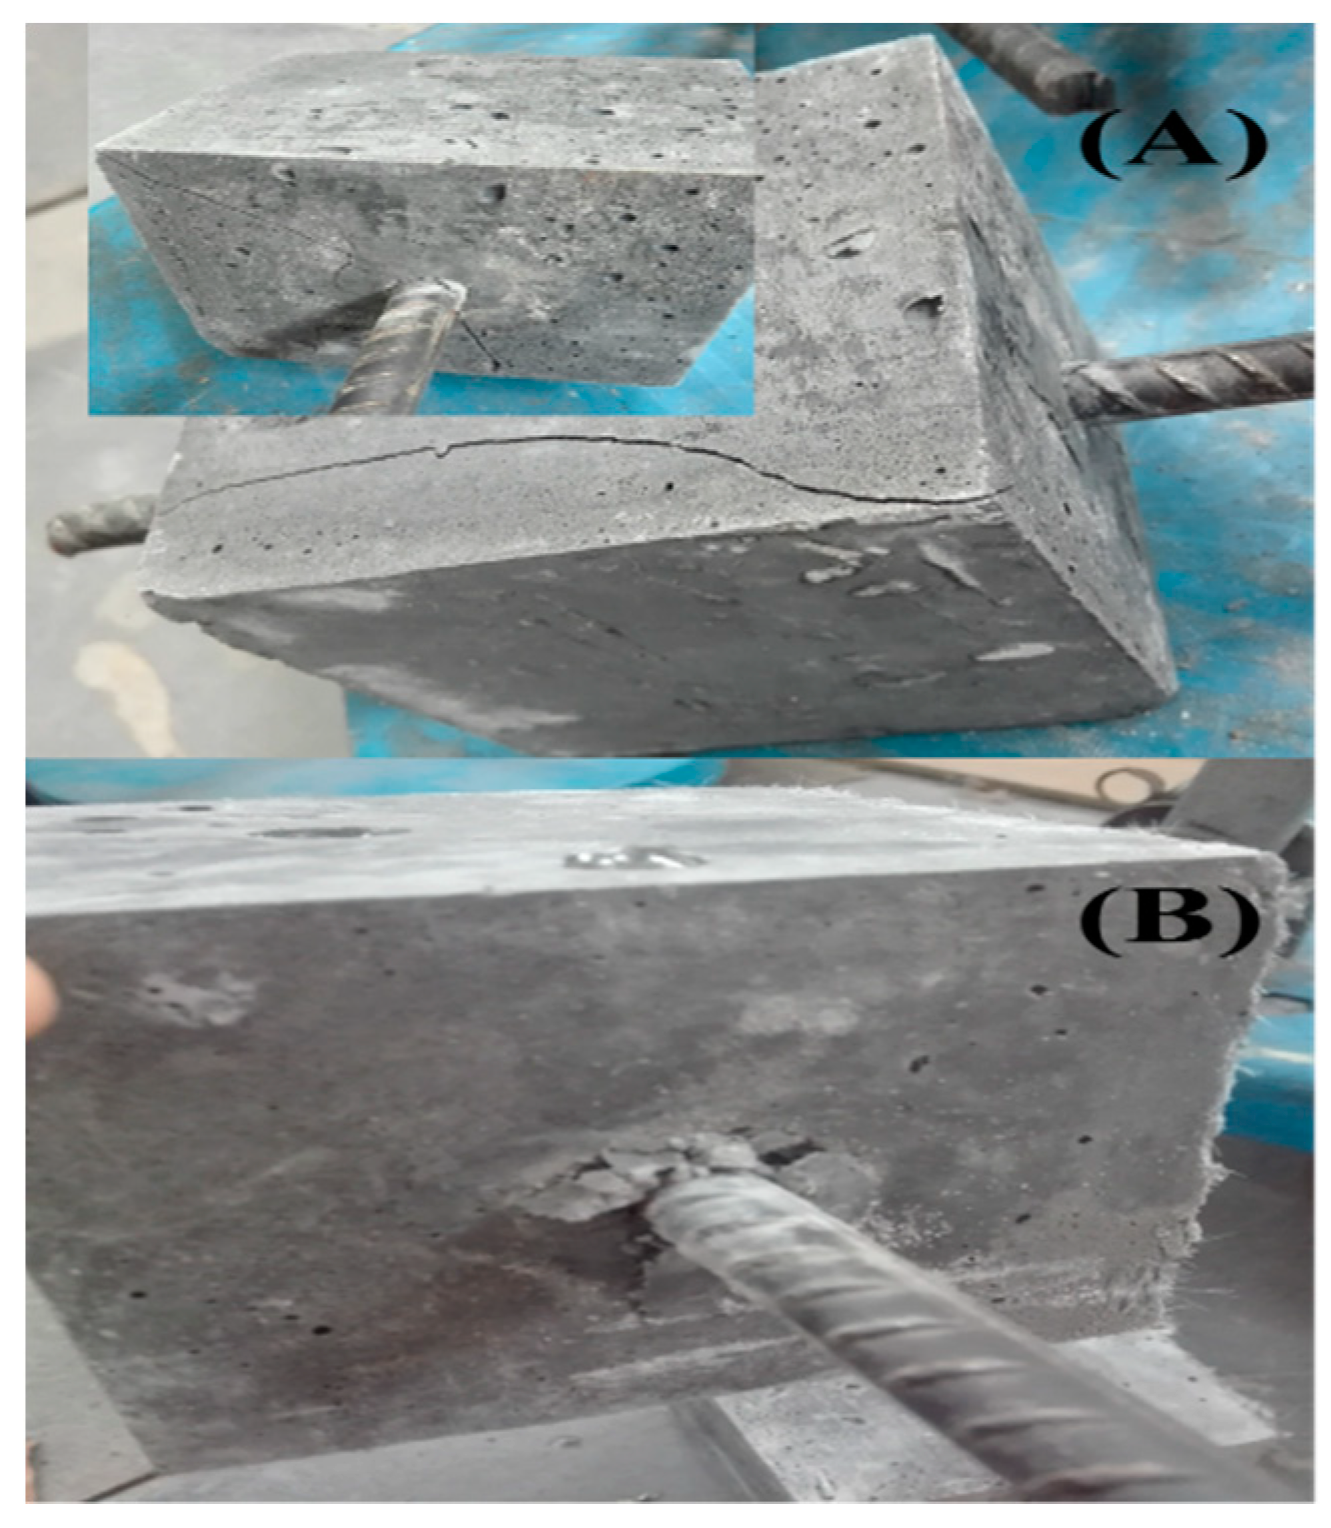
3.7. Pull out Test
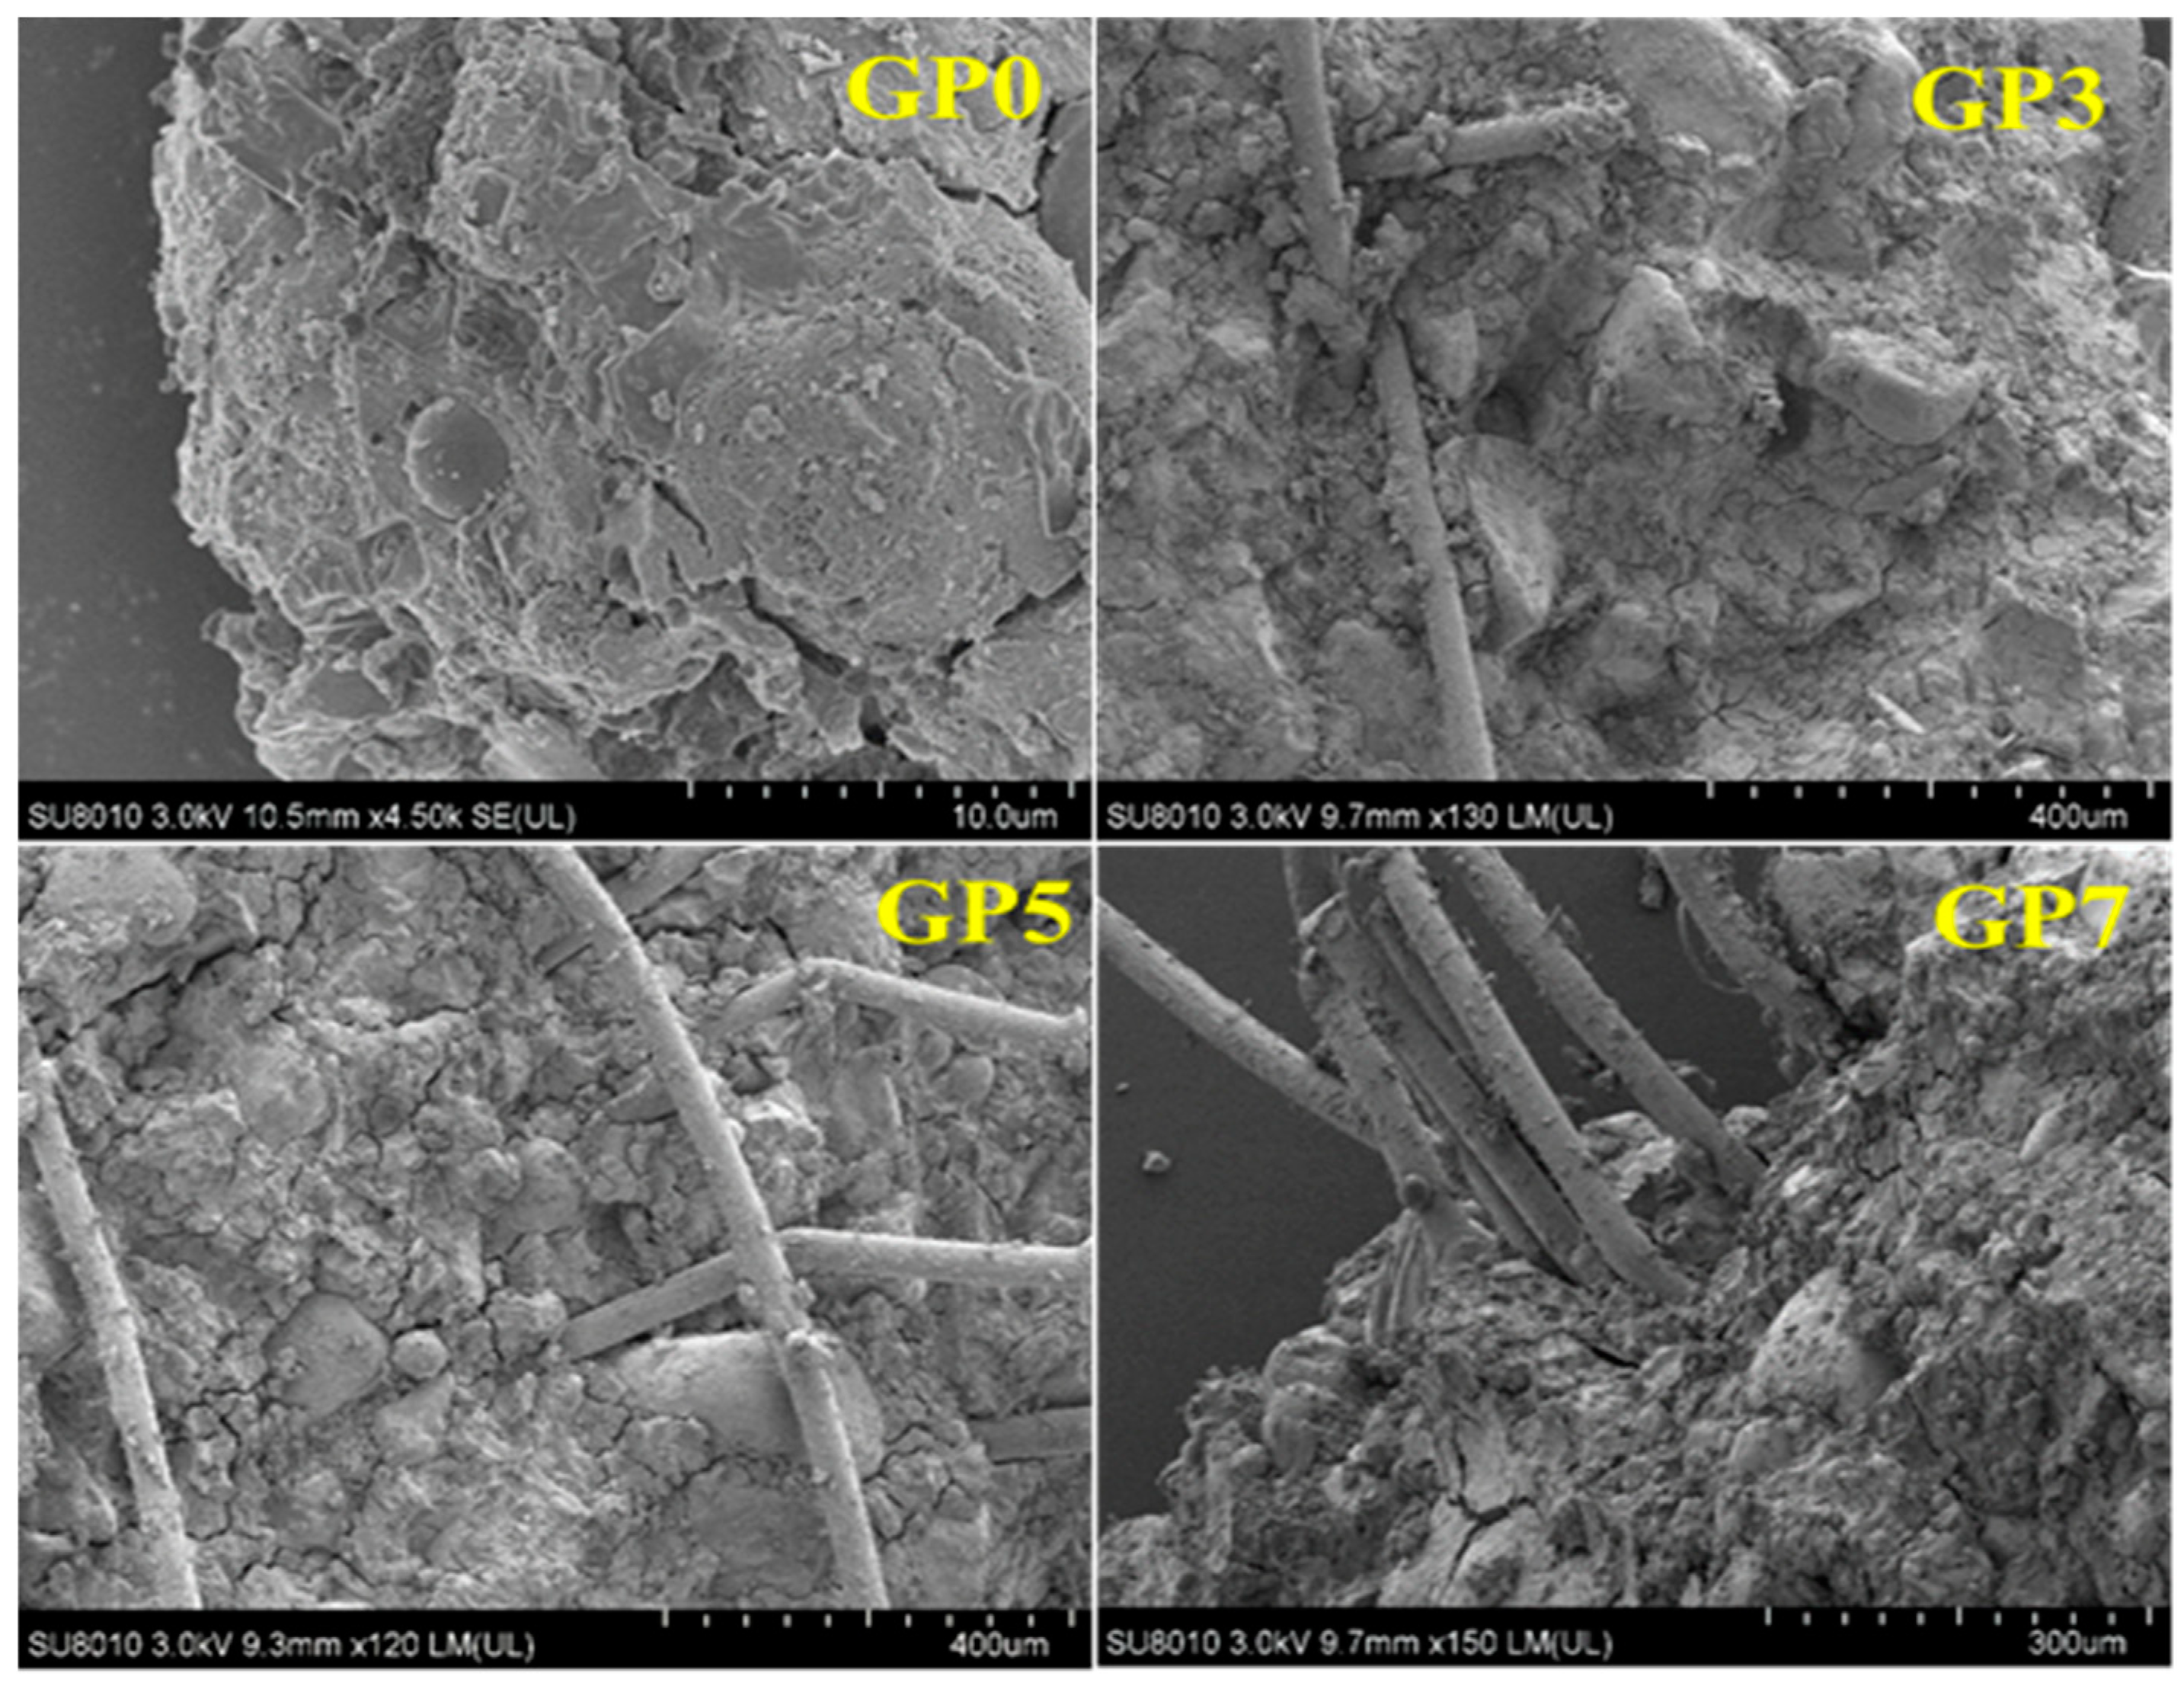
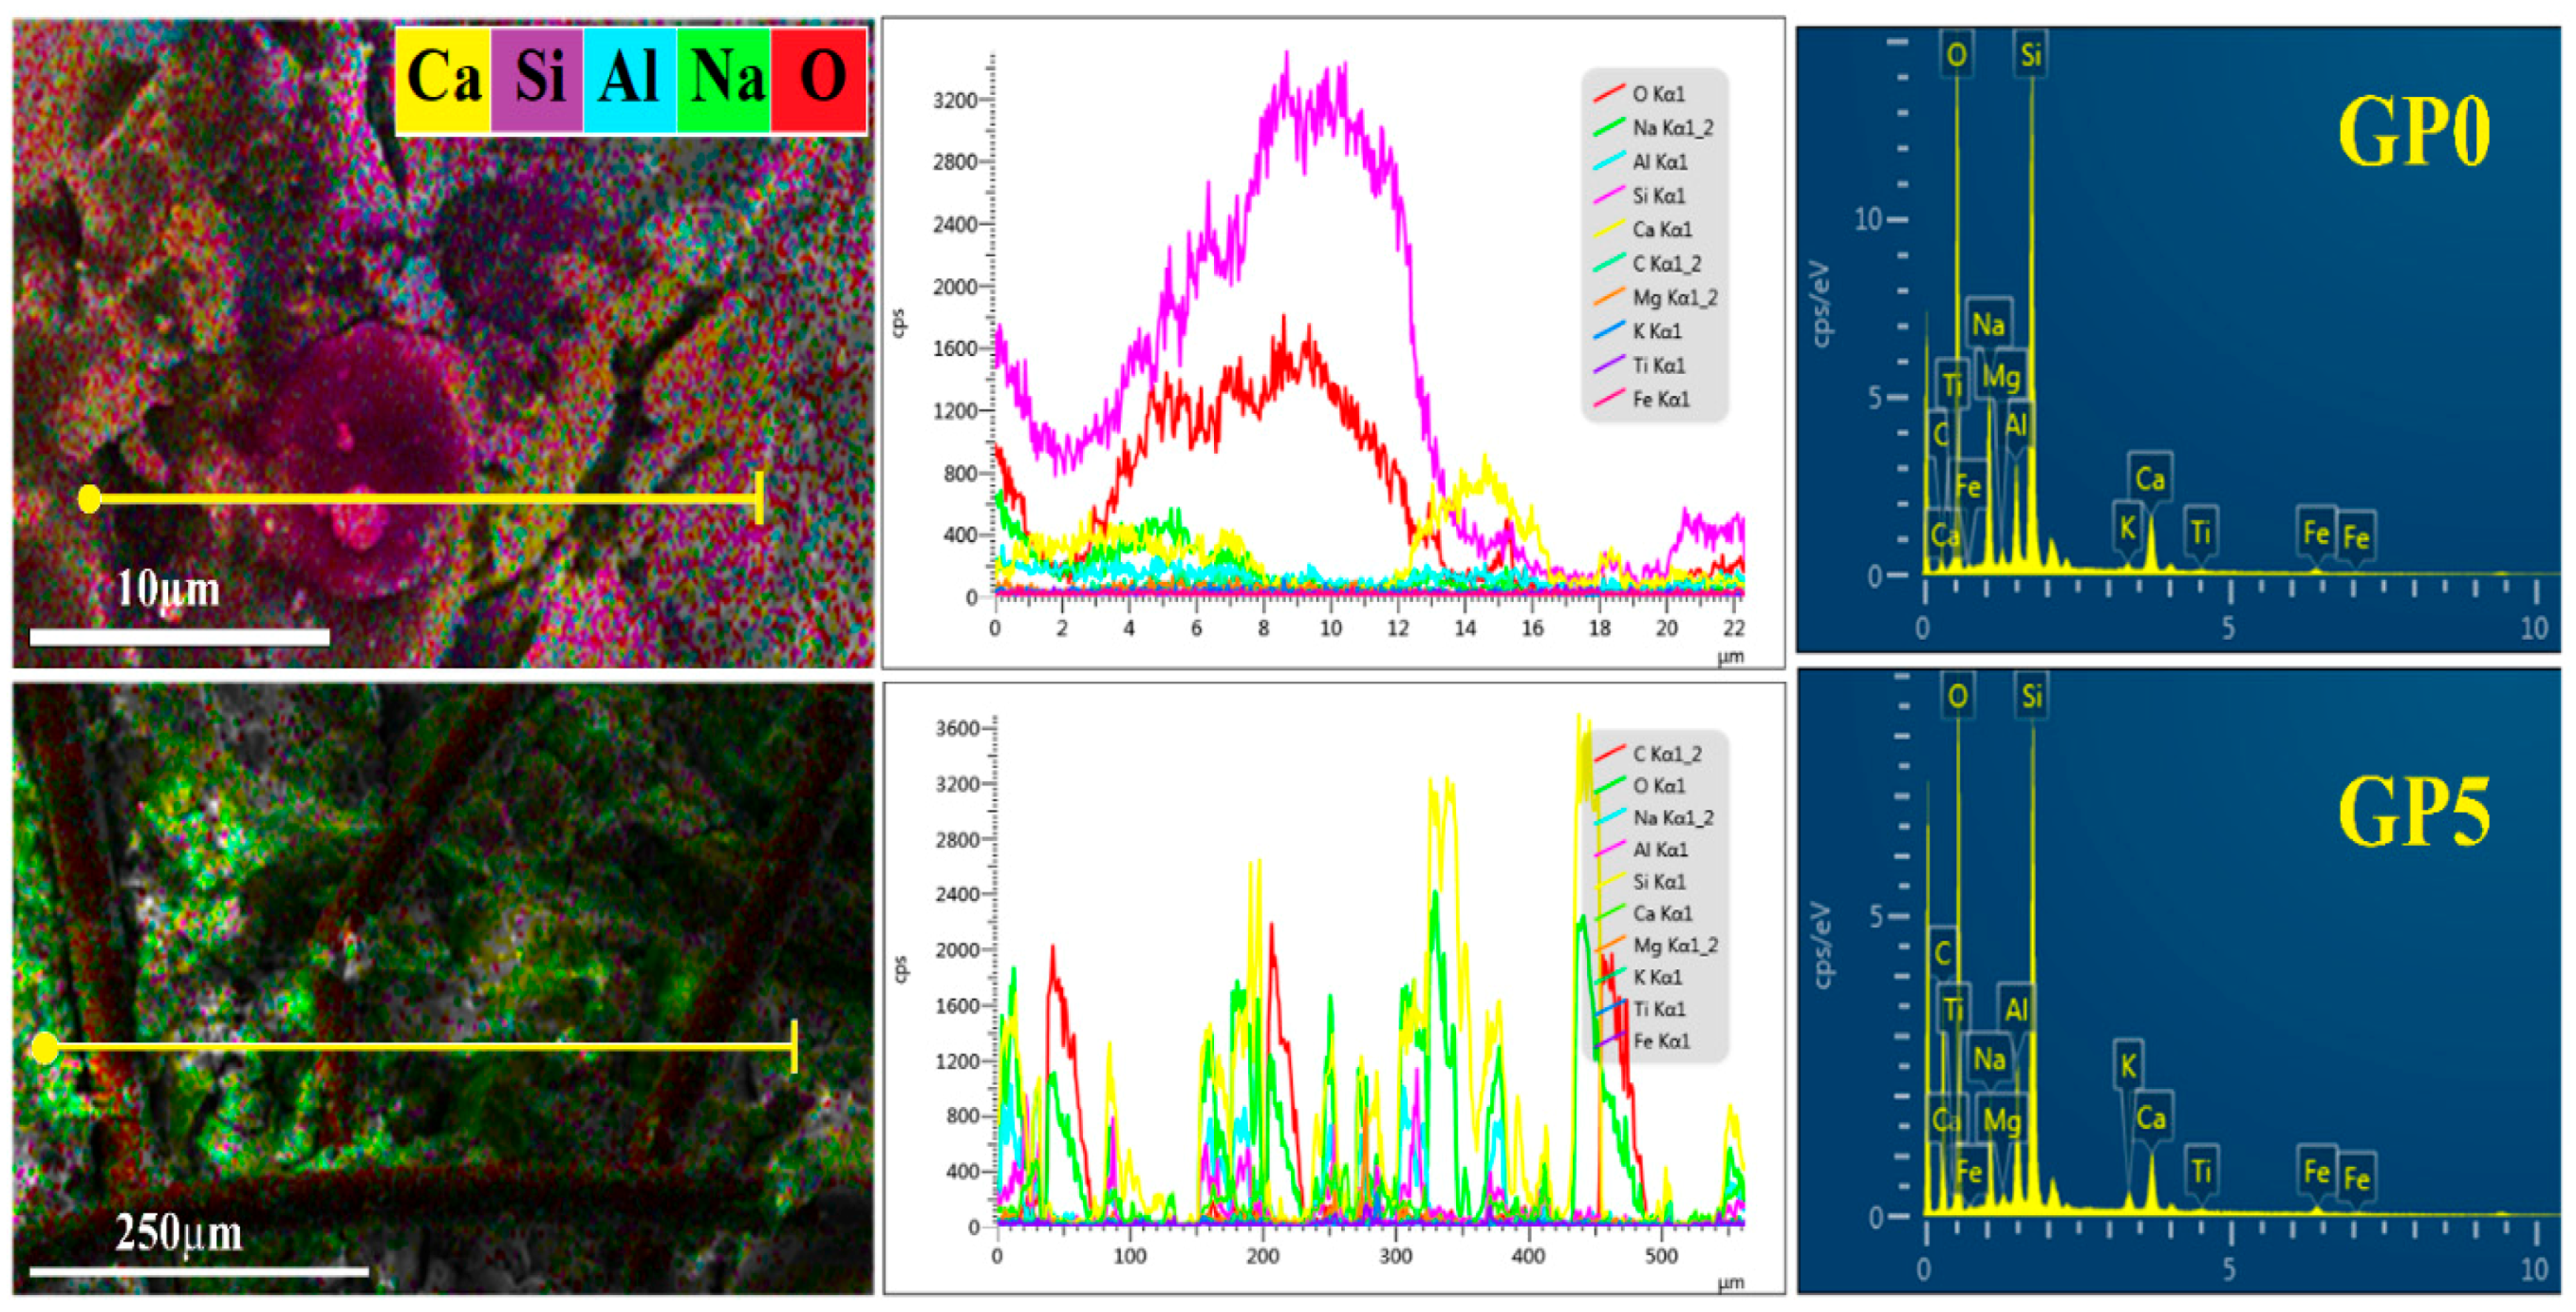
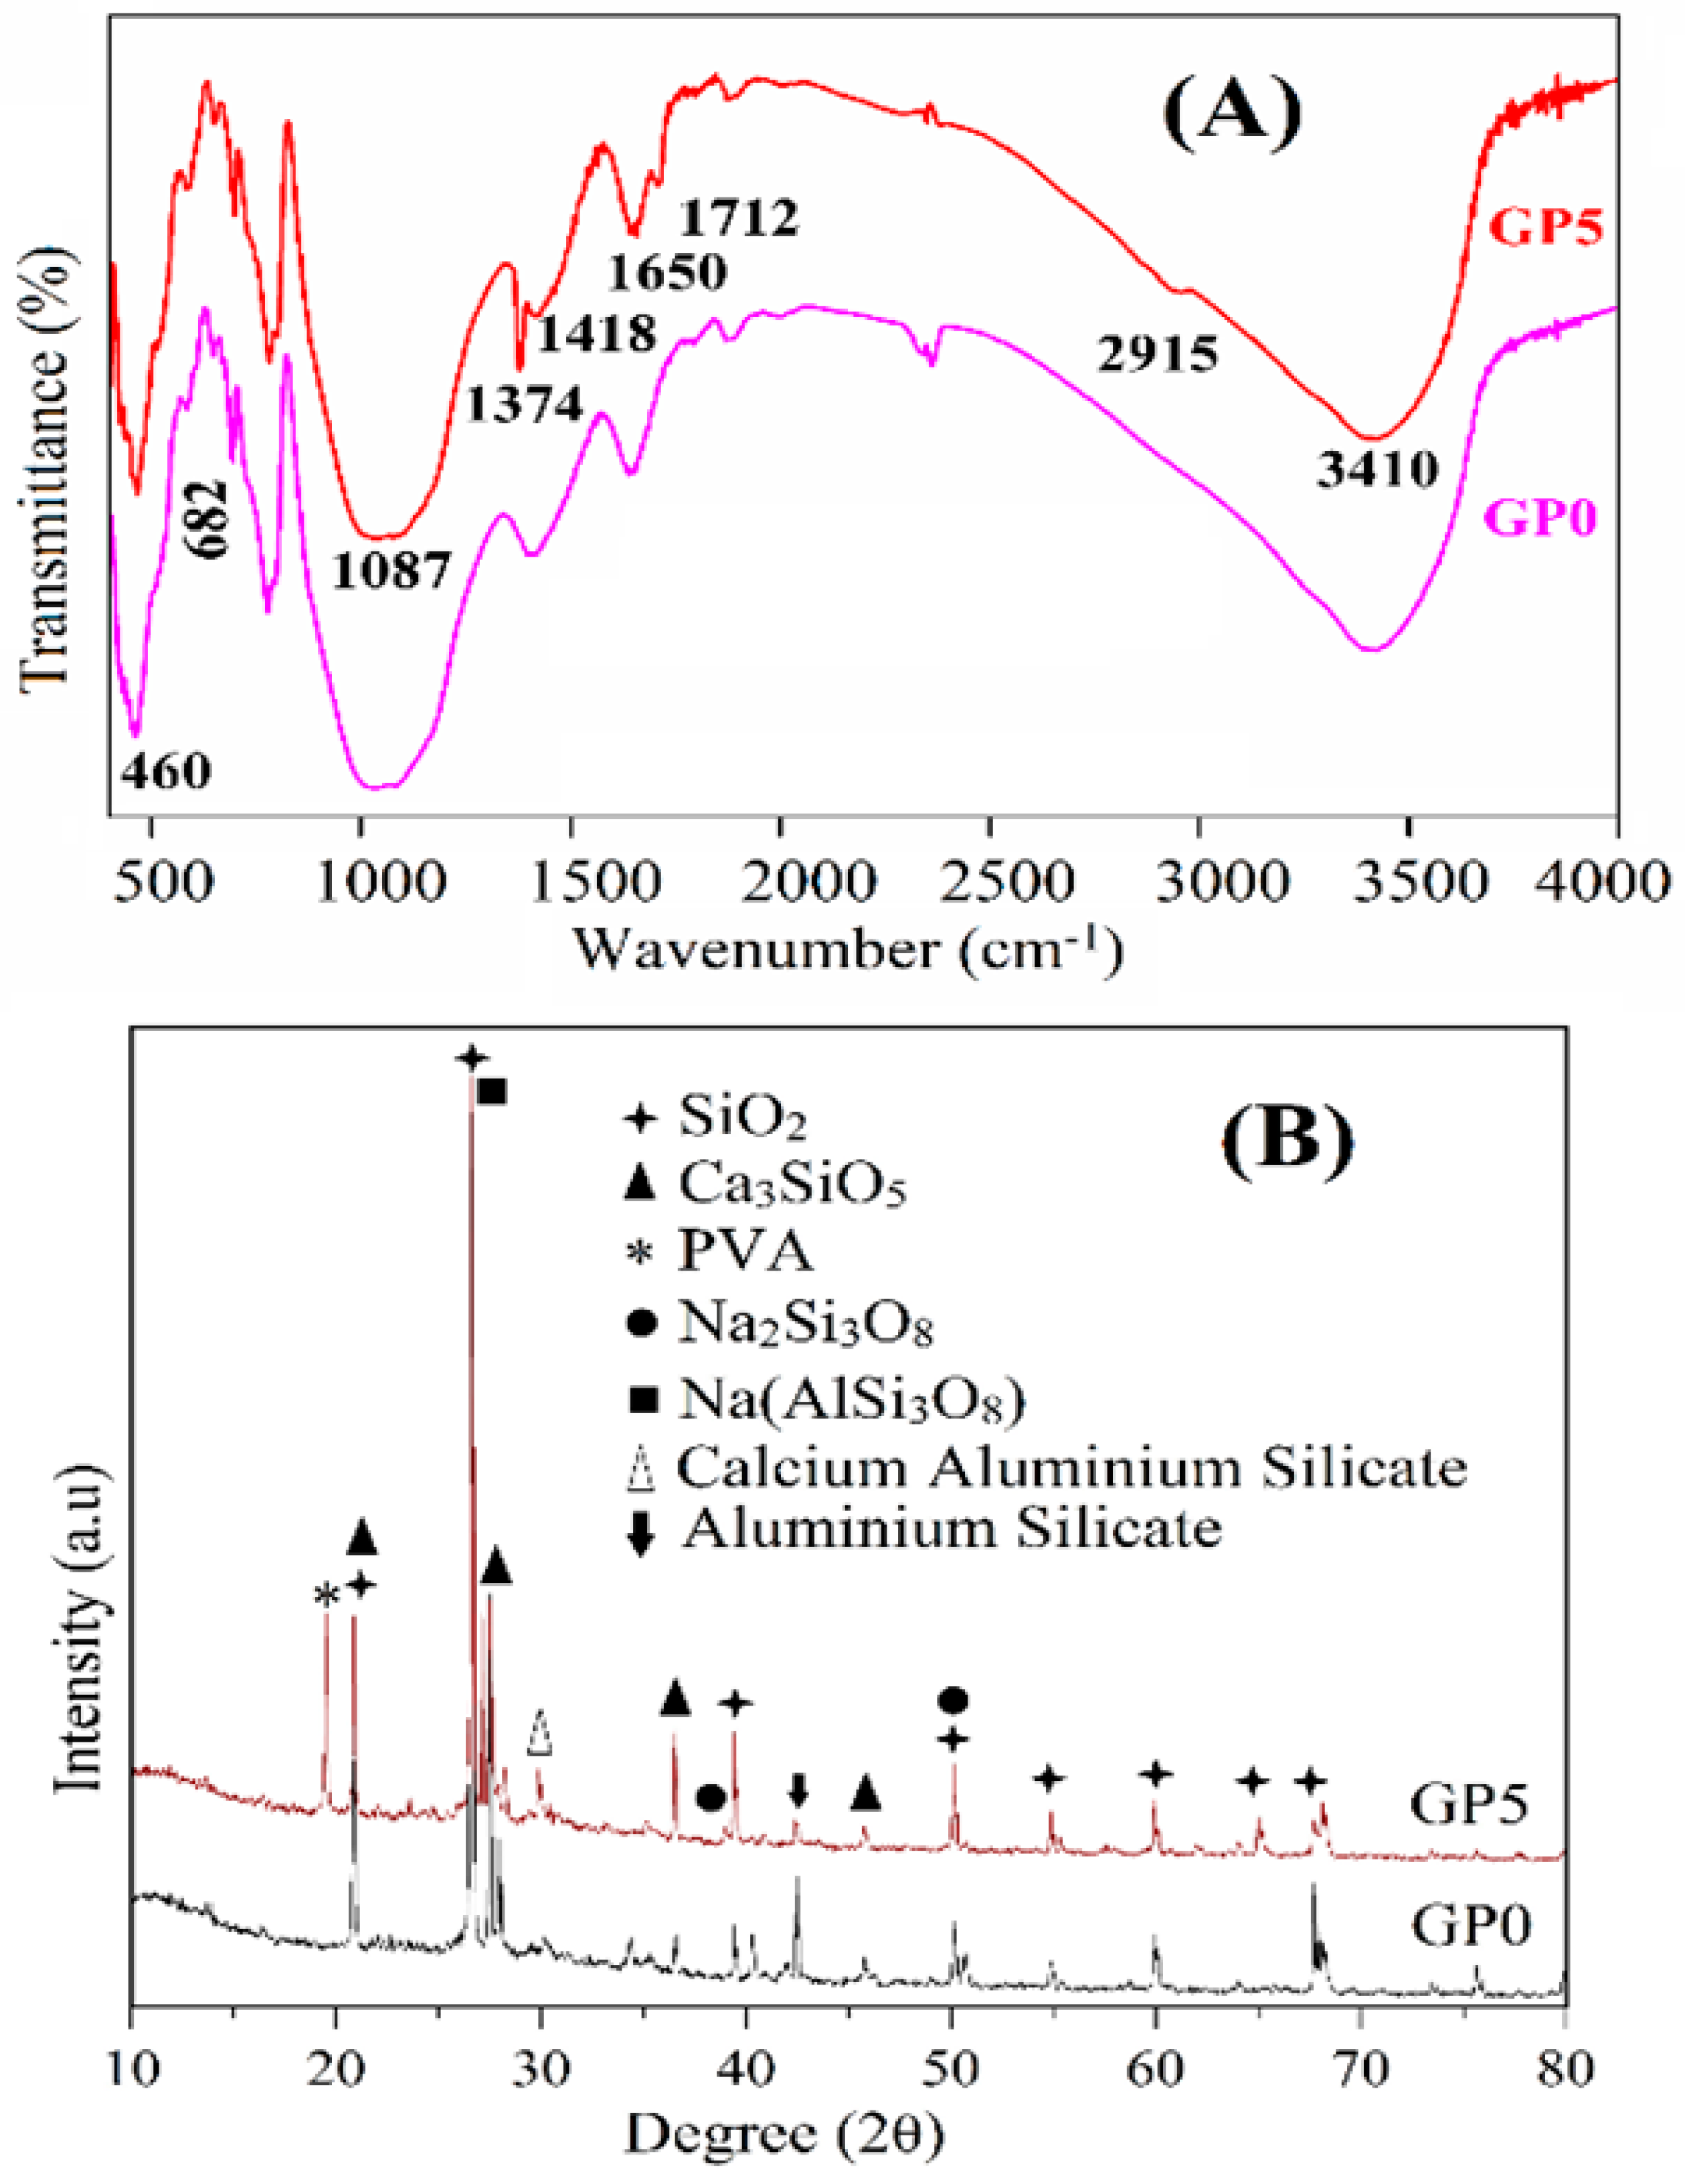
3.8. Microstructural Studies
4. Conclusions
- The fracture toughness KIc and CMOD values increased with the increasing amount of PVA fibers. The higher toughness value of 0.46 MPa m1/2 was observed for the GP7 specimen. The higher strength is due to the bridging effect of fibers with the matrix.
- The compressive strength increased considerably in all the geopolymer mortar specimens with the addition of PVA fibers.
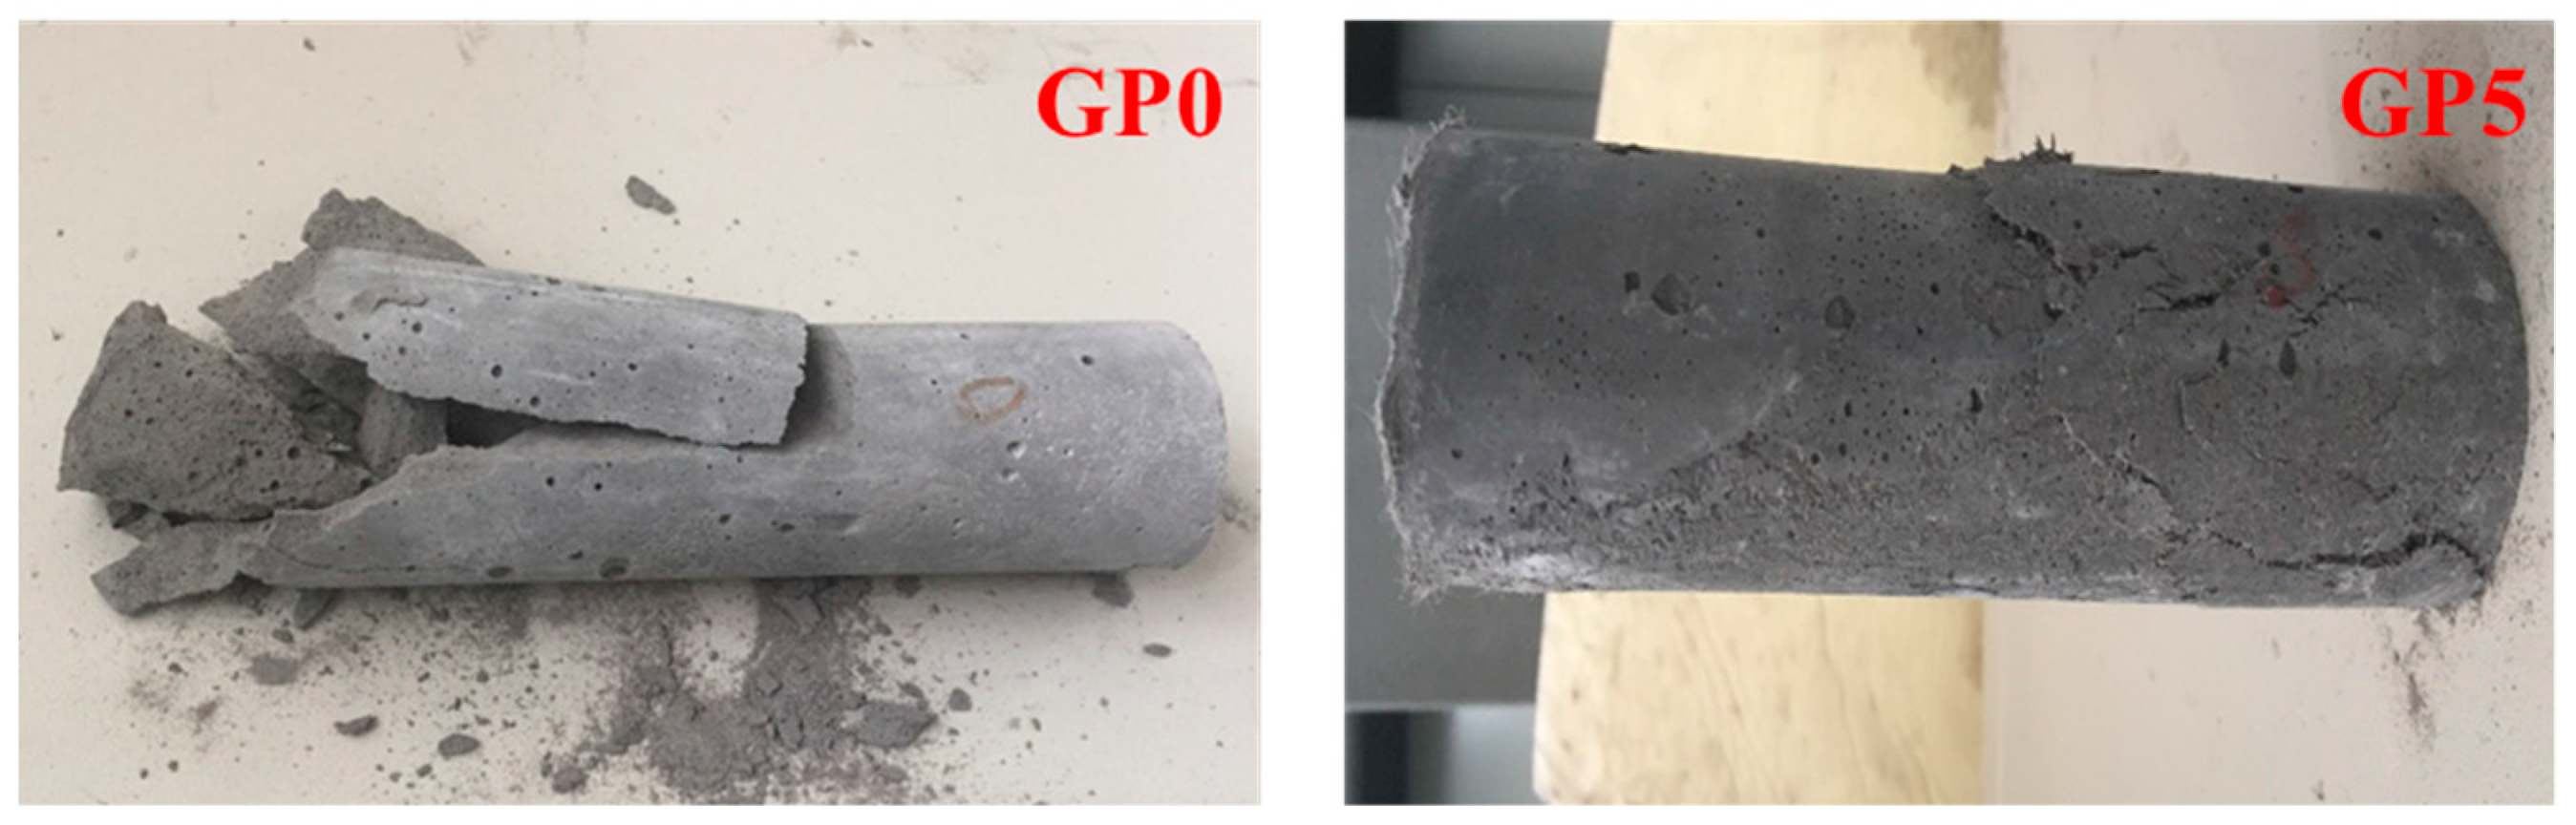
- The cyclic uniaxial compression response of the GP5 specimen showed better results for both single unloading/reloading and three unloading/reloading cycles. The 78.1% increase in peak load was noticed in relation to the GP0 specimen for the three unloading/reloading cycles scheme.
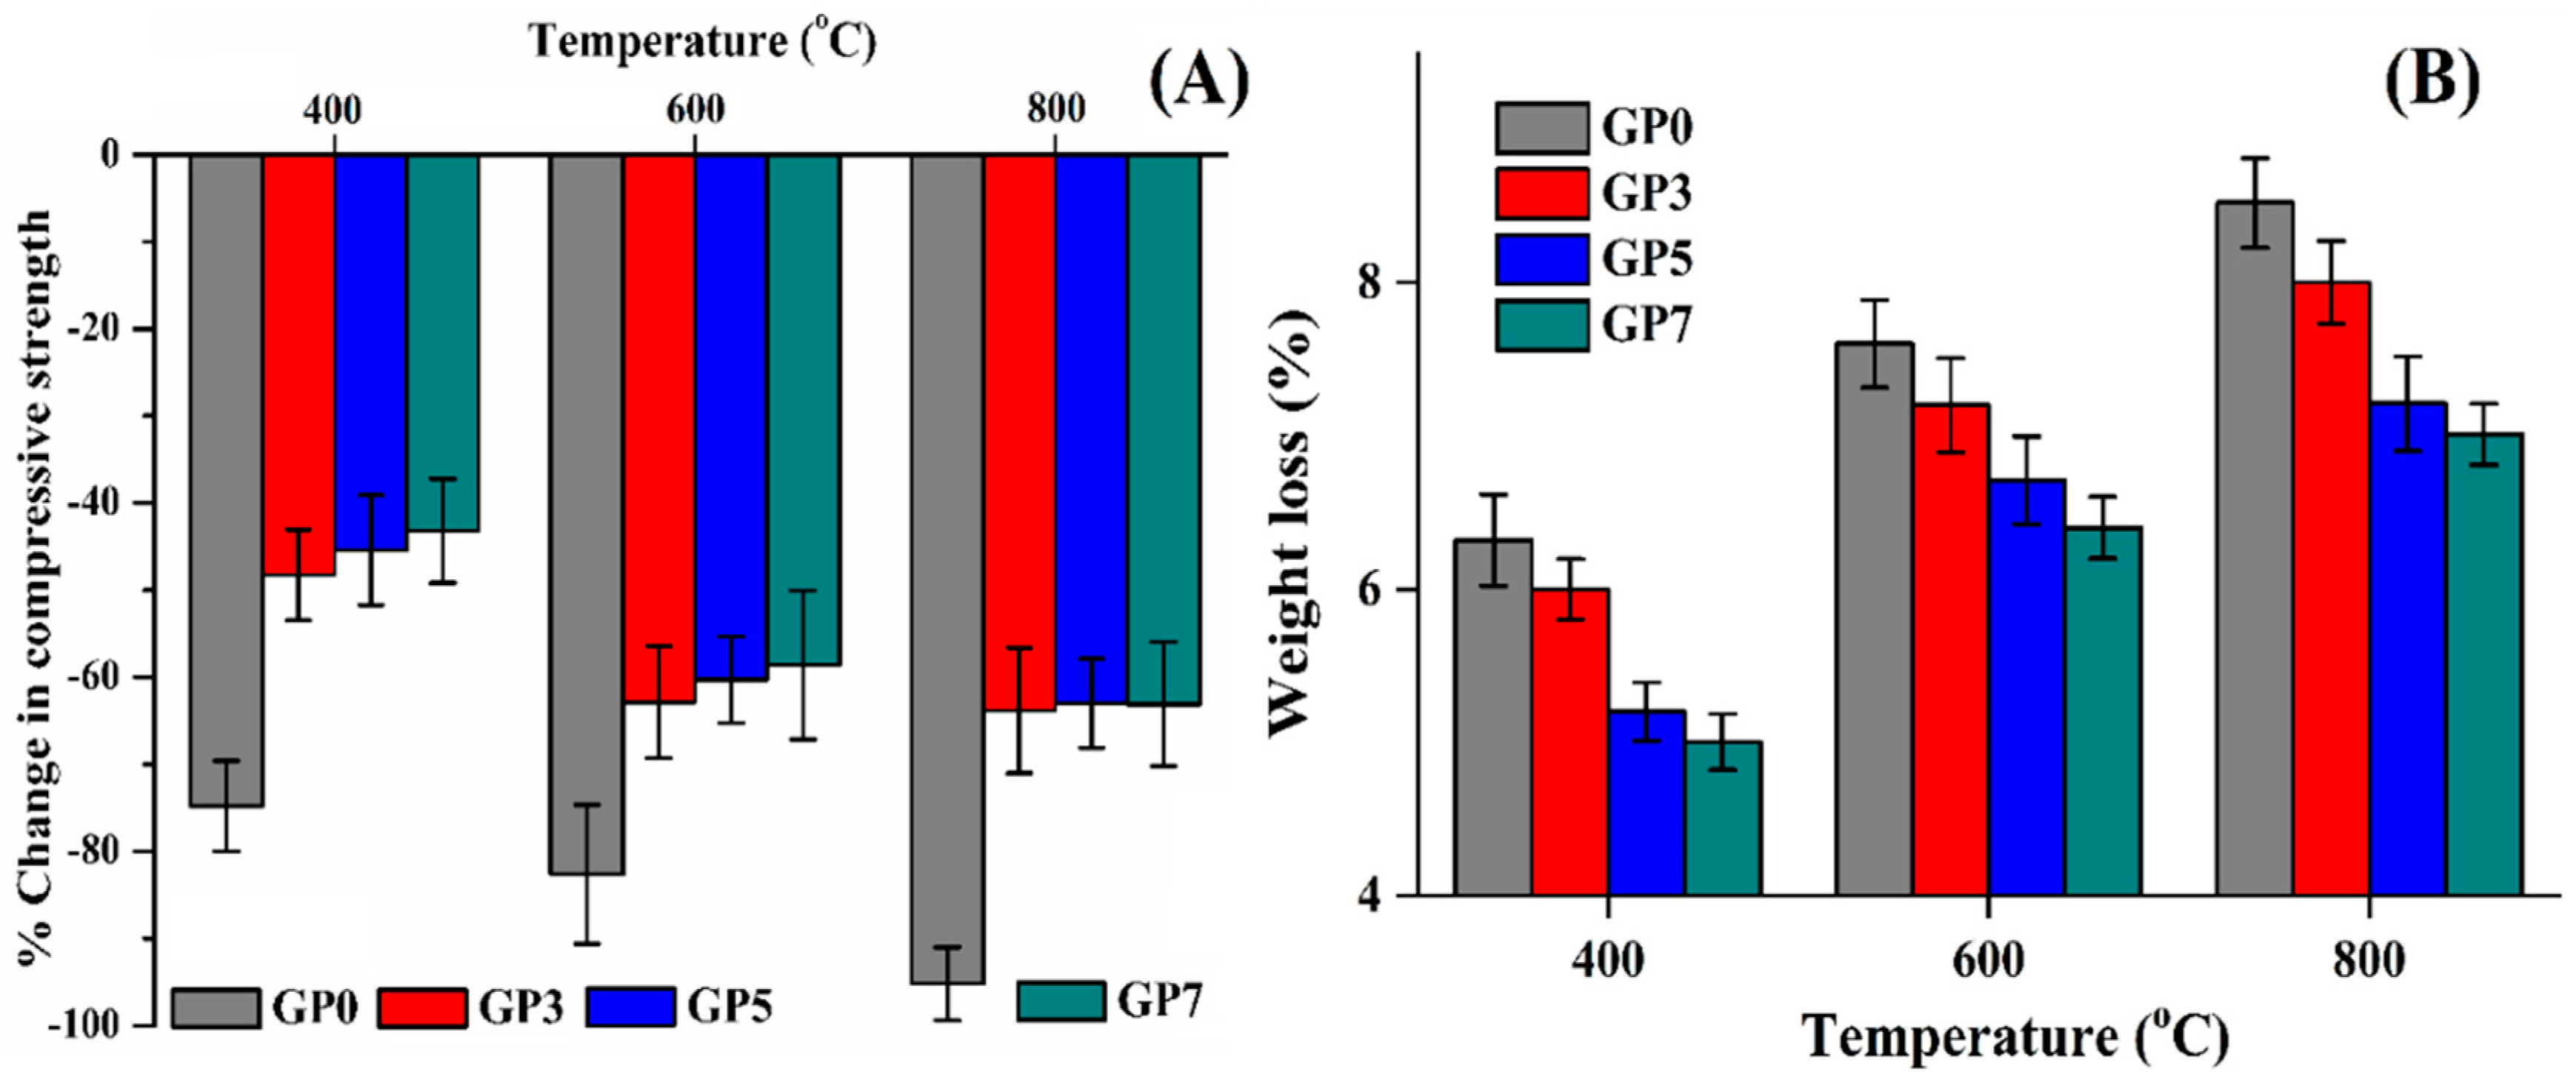
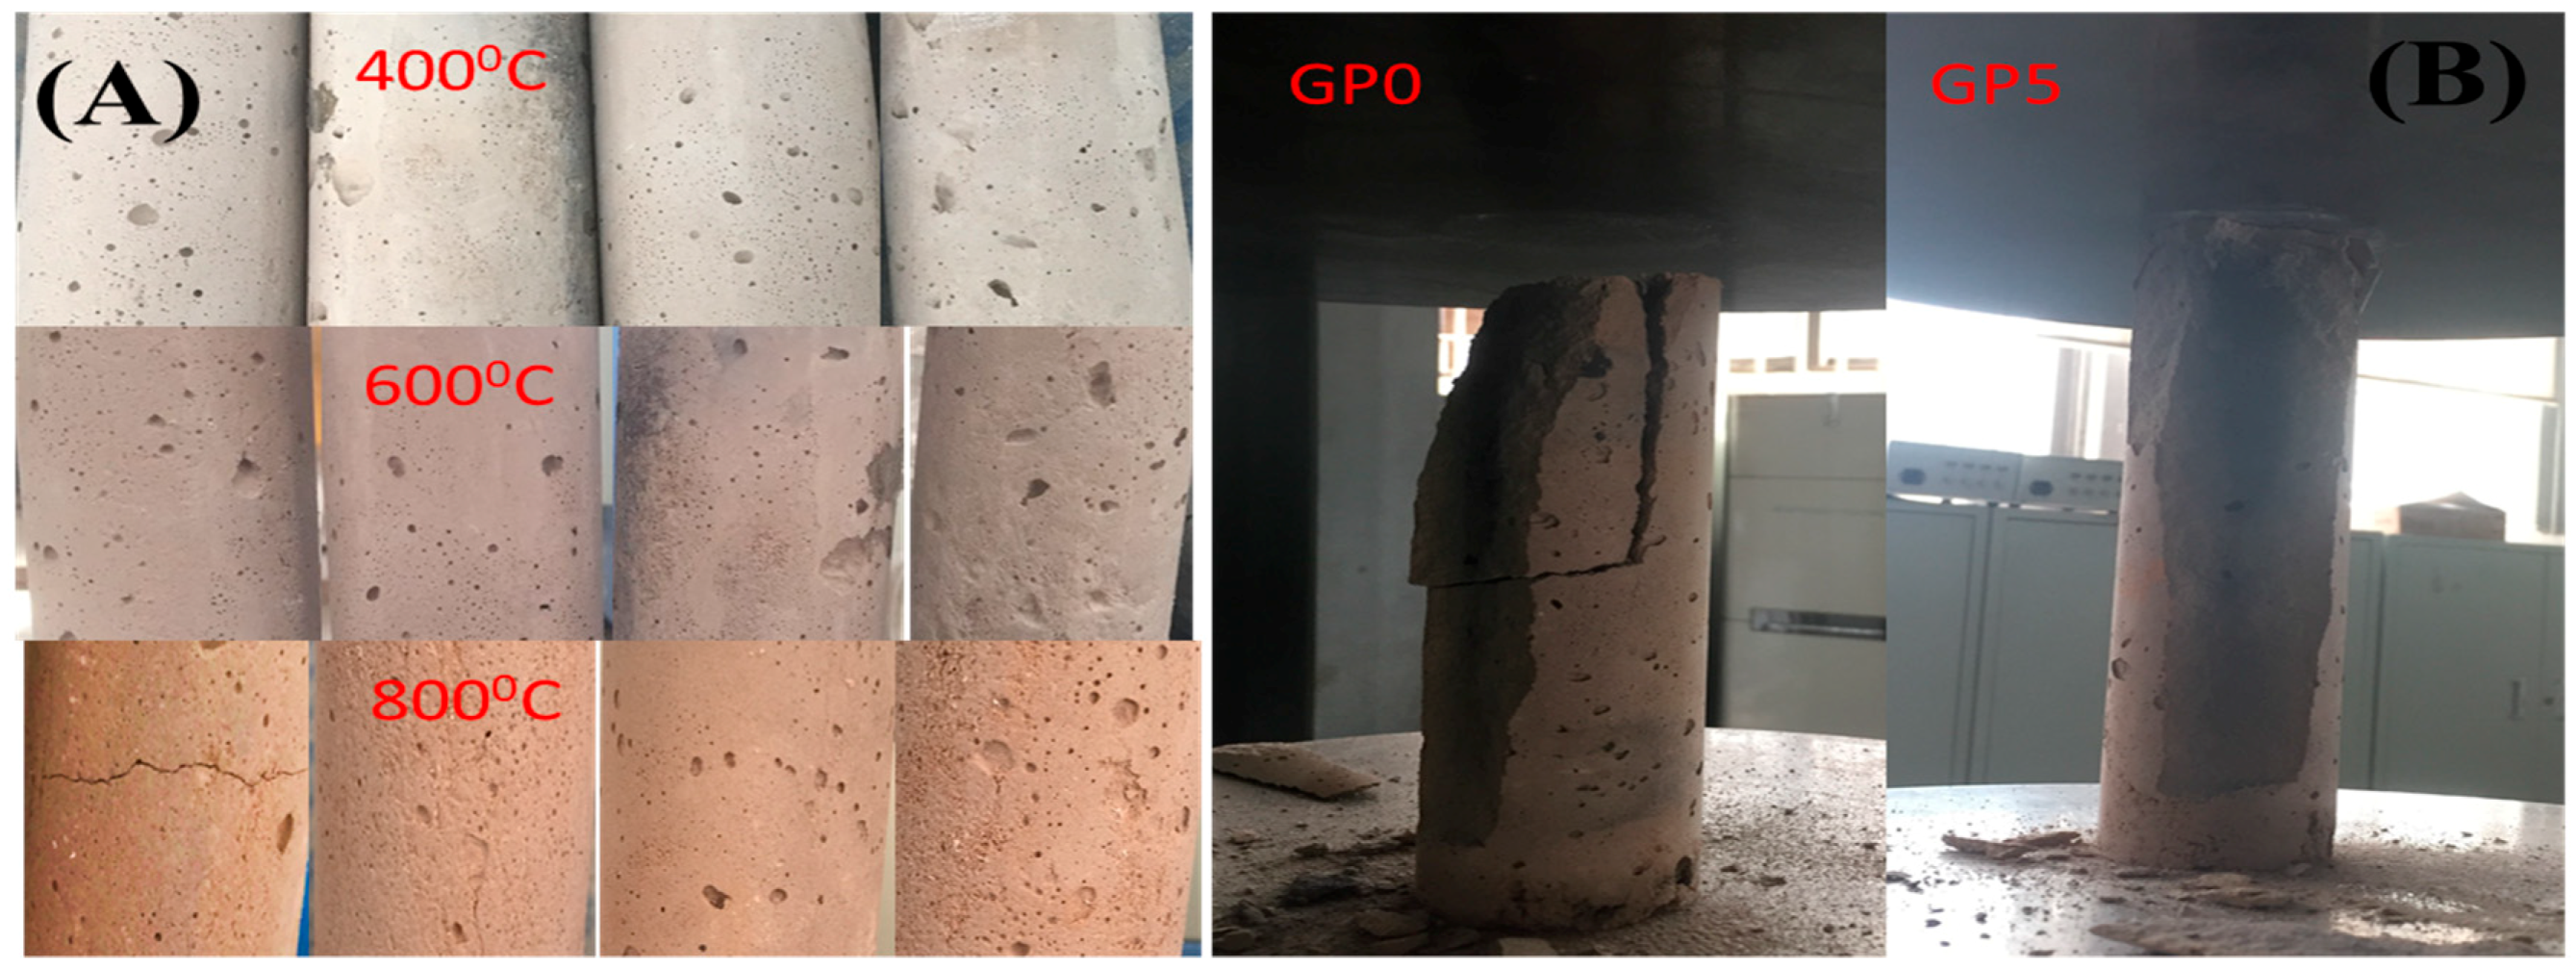
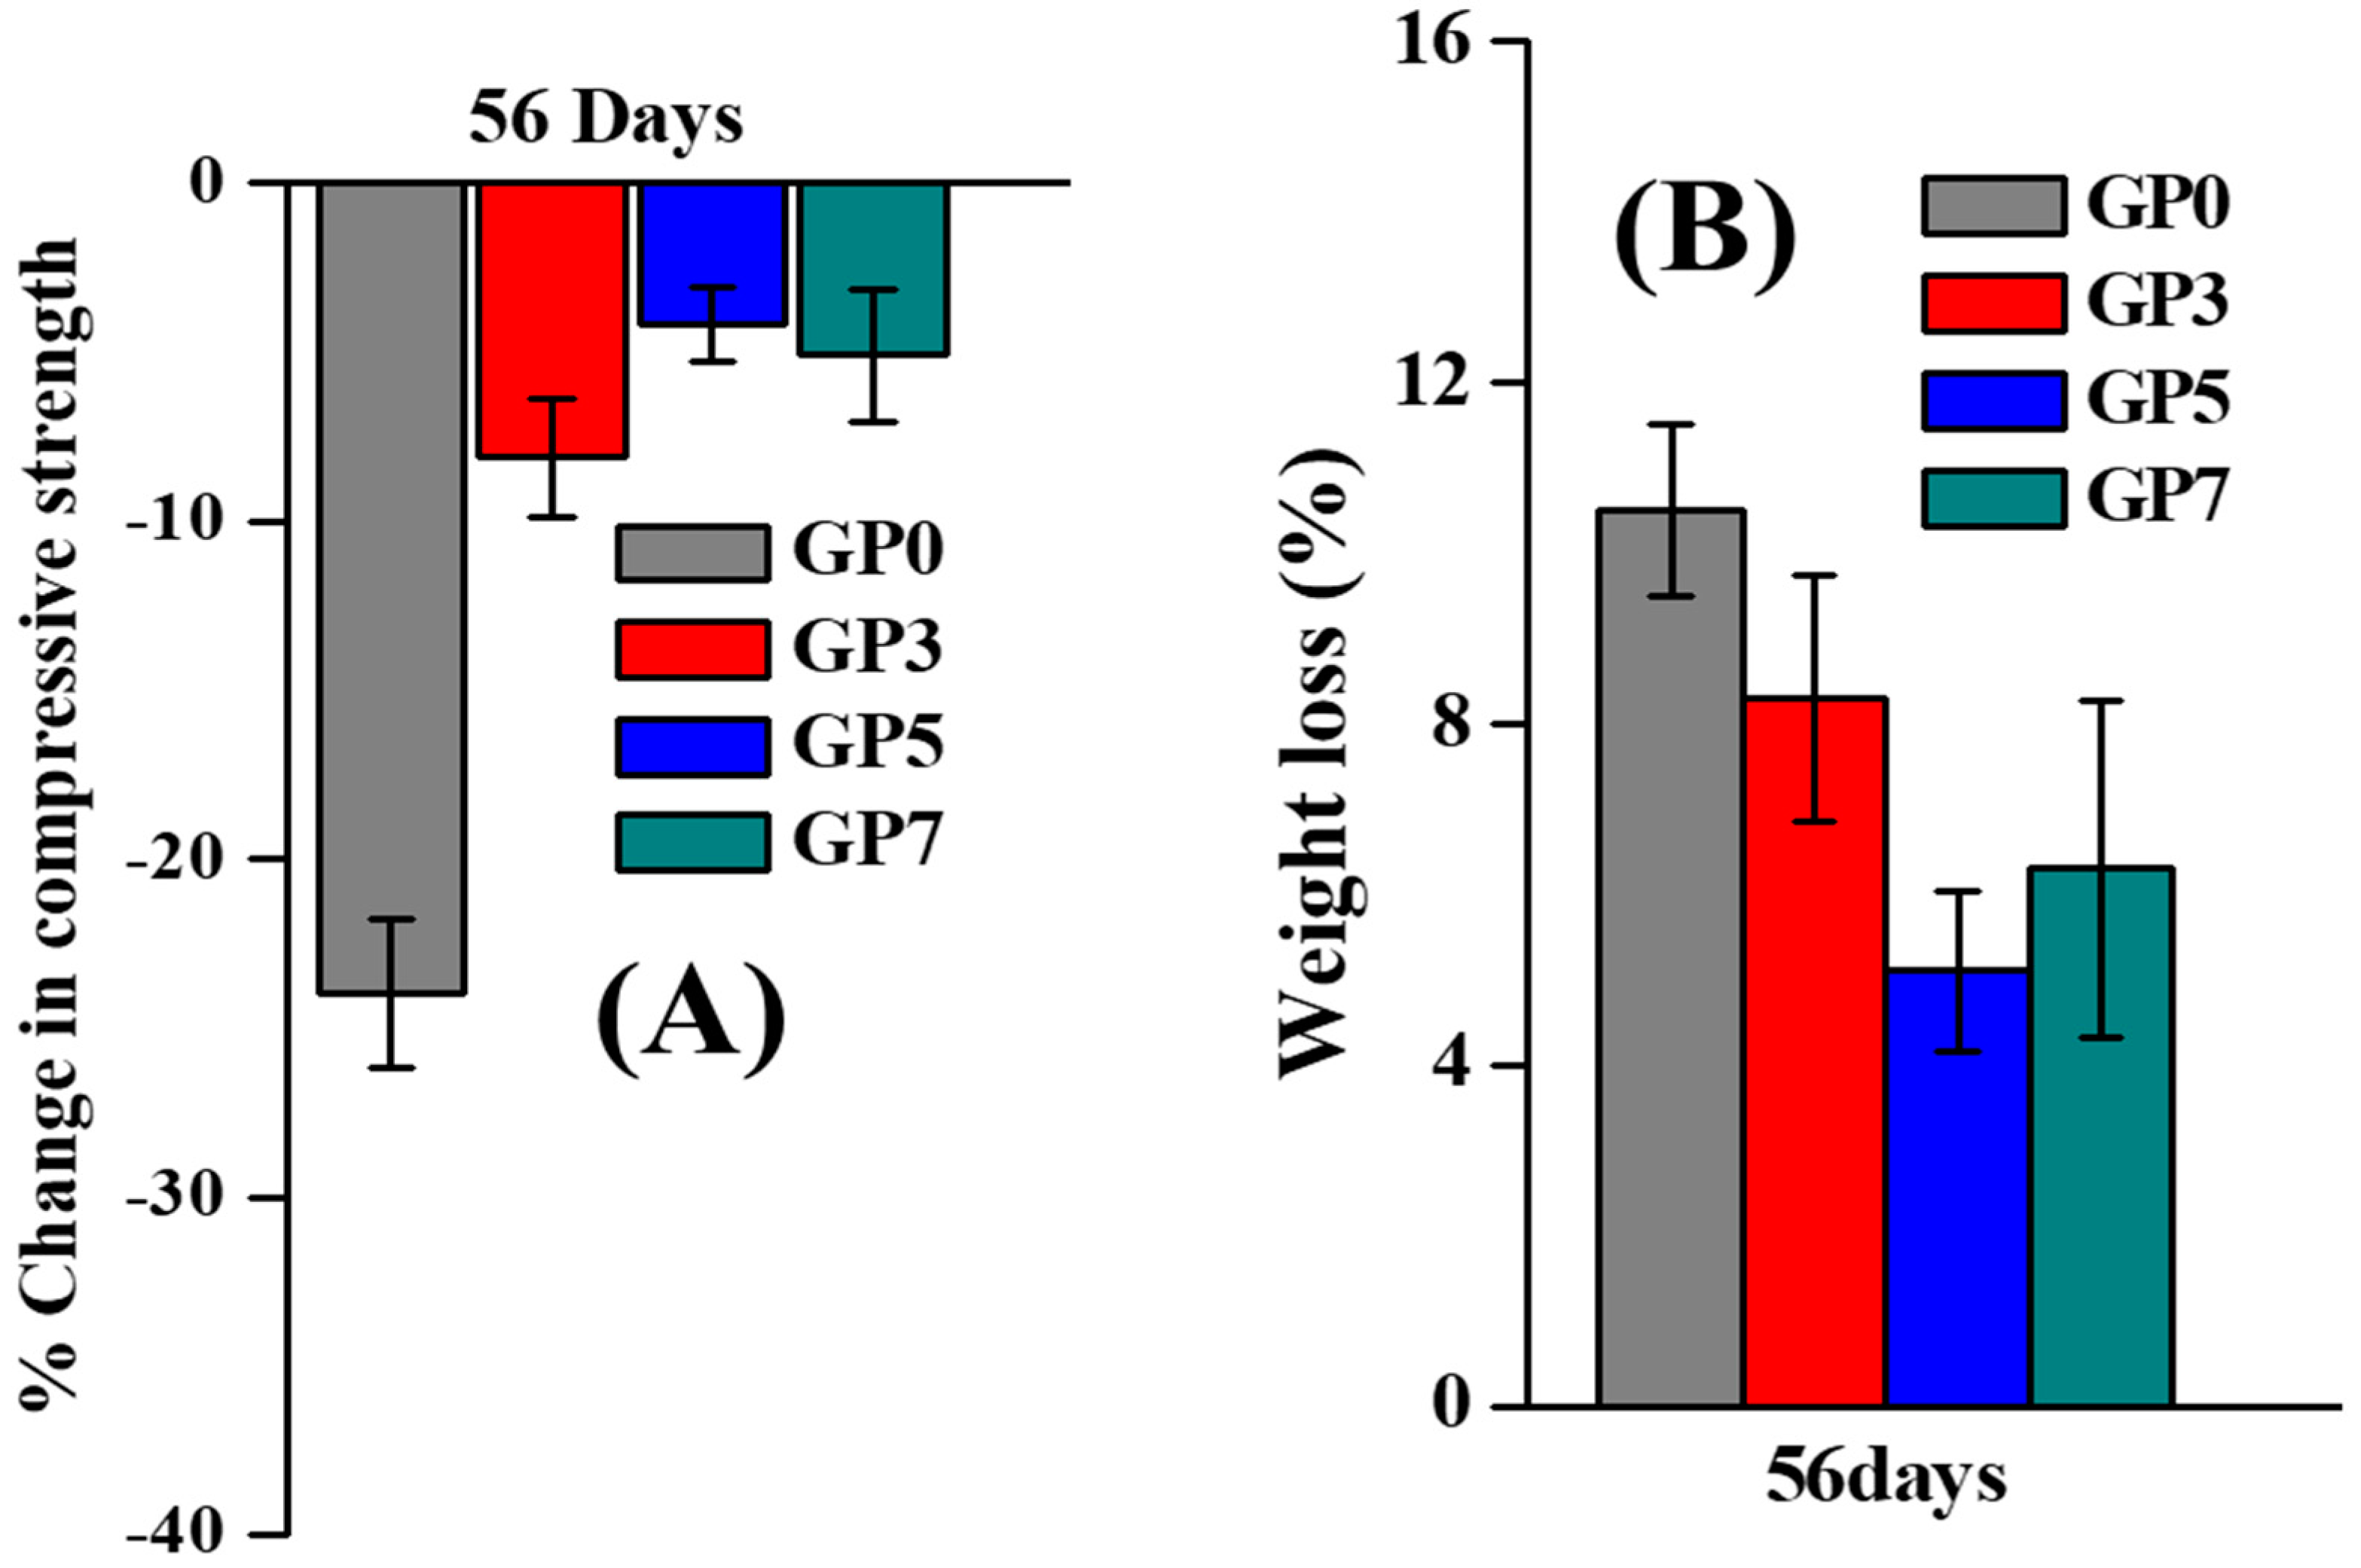
- The compressive strength degradation was observed in the geopolymer specimens when subjected to extreme temperatures. The greater the temperature, the greater the reduction in strength. Although at 800 °C, strength reduction in geopolymer specimens GP3, GP5, and GP7 was almost the same, but much lower than in GP0. For the freeze-thaw effect at a lower temperature (−25 °C) the GP5 and GP7 specimens dropped strength by 4.18% and 5.1%, respectively.
- Bond strength increased with the increase of PVA fiber contents. Higher values of bond strength, i.e., 1.92 MPa and 3.03 MPa, were noted in the GP5 and GP7 specimens, respectively.
- Microstructural analysis showed that the PVA fibers and nanosilica synergistically improved the dense and compact matrix structure.
Author Contributions
Funding
Acknowledgments
Conflicts of Interest
References
- Sarkar, M.; Maiti, M.; Malik, M.A.; Xu, S.; Li, Q.; Mandal, S. Influence of metal oxide (V2O5) in recycled waste materials for advanced durable construction technology. Constr. Build. Mater. 2018, 171, 770–778. [Google Scholar] [CrossRef]
- Dassekpo, J.-B.M.; Zha, X.; Zhan, J. Synthesis reaction and compressive strength behavior of loess-fly ash based geopolymers for the development of sustainable green materials. Constr. Build. Mater. 2017, 141, 491–500. [Google Scholar] [CrossRef]
- Duxson, P.; Fernández-Jiménez, A.; Provis, J.L.; Lukey, G.C.; Palomo, A.; van Deventer, J.S.J. Geopolymer technology: The current state of the art. J. Mater. Sci. 2007, 42, 2917–2933. [Google Scholar] [CrossRef]
- Maiti, M.; Sarkar, M.; Malik, M.A.; Xu, S.; Li, Q.; Mandal, S. Iron Oxide NPs Facilitated a Smart Building Composite for Heavy-Metal Removal and Dye Degradation. ACS Omega 2018, 3, 1081–1089. [Google Scholar] [CrossRef]
- Adak, D.; Sarkar, M.; Mandal, S. Effect of nano-silica on strength and durability of fly ash based geopolymer mortar. Constr. Build. Mater. 2014, 70, 453–459. [Google Scholar] [CrossRef]
- Yunsheng, Z.; Wei, S.; Zongjin, L.; Xiangming, Z.; Eddie; Chungkong, C. Impact properties of geopolymer based extrudates incorporated with fly ash and PVA short fiber. Constr. Build. Mater. 2008, 22, 370–383. [Google Scholar] [CrossRef]
- Nematollahi, B.; Sanjayan, J. Sustainable Fiber-Reinforced Strain-Hardening Composites Using Geopolymer as ‘Complete’ Replacement of Portland Cement. In Strain-Hardening Cement-Based Composites; SHCC 2017; RILEM Bookseries; Mechtcherine, V., Slowik, V., Kabele, P., Eds.; Springer: Dordrecht, The Netherlands, 2018; Volume 15, pp. 154–161. [Google Scholar]
- Ohno, M.; Li, V.C. A feasibility study of strain hardening fiber reinforced fly ash-based geopolymer composites. Constr. Build. Mater. 2014, 57, 163–168. [Google Scholar] [CrossRef]
- Novais, R.M.; Carvalheiras, J.; Seabra, M.P.; Pullar, R.C.; Labrincha, J.A. Effective mechanical reinforcement of inorganic polymers using glass fibre waste. J. Clean. Prod. 2017, 166, 343–349. [Google Scholar] [CrossRef]
- Nematollahi, B.; Sanjayan, J.; Shaikh, F.U.A. Comparative deflection hardening behavior of short fiber reinforced geopolymer composites. Constr. Build. Mater. 2014, 70, 54–64. [Google Scholar] [CrossRef]
- Li, W.; Xu, J. Mechanical properties of basalt fiber reinforced geopolymeric concrete under impact loading. Mater. Sci. Eng. A 2009, 505, 178–186. [Google Scholar] [CrossRef]
- Bhutta, A.; Borges, P.H.R.; Zanotti, C.; Farooq, M.; Banthia, N. Flexural behavior of geopolymer composites reinforced with steel and polypropylene macro fibers. Cem. Concr. Compos. 2017, 80, 31–40. [Google Scholar] [CrossRef]
- Latella, B.A.; Perera, D.S.; Durce, D.; Mehrtens, E.G.; Davis, J. Mechanical properties of metakaolin-based geopolymers with molar ratios of Si/Al ≈ 2 and Na/Al ≈ 1. J. Mater. Sci. 2008, 43, 2693–2699. [Google Scholar] [CrossRef]
- Xu, S.; Malik, M.A.; Li, Q.; Wu, Y. Determination of double-K fracture parameters using semi-circular bend test specimens. Eng. Fract. Mech. 2016, 152, 58–71. [Google Scholar] [CrossRef]
- Xu, S.; Reinhardt, H.W. Determination of double-K criterion for crack propagation in quasi-brittle fracture, Part II: Analytical evaluating and practical measuring methods for three-point bending notched beams. Int. J. Fracture 1999, 98, 151–177. [Google Scholar] [CrossRef]
- Nematollahi, B.; Sanjayan, J.; Shaikh, F.U.A. Tensile Strain Hardening Behavior of PVA Fiber-Reinforced Engineered Geopolymer Composite. J. Mater. Civ. Eng. 2015, 27, 04015001. [Google Scholar] [CrossRef]
- Kong, D.L.Y.; Sanjayan, J.G. Effect of elevated temperatures on geopolymer paste, mortar and concrete. Cem. Concr. Res. 2010, 40, 334–339. [Google Scholar] [CrossRef]
- Zhang, H.Y.; Kodur, V.; Qi, S.L.; Cao, L.; Wu, B. Development of metakaolin–fly ash based geopolymers for fire resistance applications. Constr. Build. Mater. 2014, 55, 38–45. [Google Scholar] [CrossRef]
- Abdulkareem, O.A.; Mustafa Al Bakri, A.M.; Kamarudin, H.; Khairul Nizar, I.; Saif, A.E.A. Effects of elevated temperatures on the thermal behavior and mechanical performance of fly ash geopolymer paste, mortar and lightweight concrete. Constr. Build. Mater. 2014, 50, 377–387. [Google Scholar] [CrossRef]
- Nazari, A.; Riahi, S. Microstructural, thermal, physical and mechanical behavior of the self compacting concrete containing SiO2 nanoparticles. Mater. Sci. Eng. A 2010, 527, 7663–7672. [Google Scholar] [CrossRef]
- Phoo-Ngernkham, T.; Chindaprasirt, P.; Sata, V.; Hanjitsuwan, S.; Hatanaka, S. The effect of adding nano-SiO2 and nano-Al2O3 on properties of high calcium fly ash geopolymer cured at ambient temperature. Mater. Des. 2014, 55, 58–65. [Google Scholar] [CrossRef]
- Shaikh, F.U.A.; Supit, S.W.M.; Sarker, P.K. A study on the effect of nano silica on compressive strength of high volume fly ash mortars and concretes. Mater. Des. 2014, 60, 433–442. [Google Scholar] [CrossRef]
- Deb, P.S.; Sarker, P.K.; Barbhuiya, S. Effects of nano-silica on the strength development of geopolymer cured at room temperature. Constr. Build. Mater. 2015, 101, 675–683. [Google Scholar] [CrossRef]
- Manfaluthy, M.; Ekaputri, J. The application of PVA fiber to improve the mechanical properties of geopolymer concrete. In Proceedings of the 6th International Conference of Euro Asia Civil Engineering Forum (EACEF), Seoul, Korea, 22–25 August 2017; Volume 138, p. 01020. [Google Scholar]
- Xu, S.; Malik, M.A.; Qi, Z.; Huang, B.; Li, Q.; Sarkar, M. Influence of the PVA fibers and SiO2 NPs on the structural properties of fly ash based sustainable geopolymer. Constr. Build. Mater. 2018, 164, 238–245. [Google Scholar] [CrossRef]
- Daniel, A.J.; Sivakamasundari, S.; Abhilash, D. Comparative Study on the Behaviour of Geopolymer Concrete with Hybrid Fibers under Static Cyclic Loading. Procedia Eng. 2017, 173, 417–423. [Google Scholar] [CrossRef]
- Laskar, S.M.; Mozumder, R.A.; Roy, B. Behaviour of Geopolymer Concrete under Static and Cyclic Loads; Springer: New Delhi, India, 2015. [Google Scholar]
- Keith, E.; Kesner, S.L.B.; Kyle, S.D. Cyclic Response of Highly Ductile Fiber-Reinforced Cement-Based Composites. ACI Mater. J. 2003, 100, 381–390. [Google Scholar]
- Standard Test Method for Compressive Strength of Hydraulic Cement Mortars (Using 2-in. or [50-mm] Cube Specimens); ASTM International: West Conshohocken, PA, USA, 2016.
- Tanyildizi, H.; Şahin, M. Application of Taguchi method for optimization of concrete strengthened with polymer after high temperature. Constr. Build. Mater. 2015, 79, 97–103. [Google Scholar] [CrossRef]
- Tanyildizi, H.; Coskun, A. Performance of lightweight concrete with silica fume after high temperature. Constr. Build. Mater. 2008, 22, 2124–2129. [Google Scholar] [CrossRef]
- Hua, X.U.; Deventer, V.; Jannie, S.J. The effect of alkali metals on the formation of geopolymeric gels from alkali-feldspars. Colloids Surf. A 2003, 216, 27–44. [Google Scholar]
- Sindhunata, J.S.J.; Lukey, G.C.; Xu, H. Effect of Curing Temperature and Silicate Concentration on Fly-Ash-Based Geopolymerization. Ind. Eng. Chem. Res. 2006, 45, 3559–3568. [Google Scholar] [CrossRef]
- Ekaputri, J.J.; Junaedi, S.; Wijaya. Effect of Curing Temperature and Fiber on Metakaolin-based Geopolymer. Procedia Eng. 2017, 171, 572–583. [Google Scholar] [CrossRef]
- Tanyildizi, H.; Yonar, Y. Mechanical properties of geopolymer concrete containing polyvinyl alcohol fiber exposed to high temperature. Constr. Build. Mater. 2016, 126, 381–387. [Google Scholar] [CrossRef]
- Xu, F.; Deng, X.; Peng, C.; Zhu, J.; Chen, J. Mix design and flexural toughness of PVA fiber reinforced fly ash-geopolymer composites. Constr. Build. Mater. 2017, 150, 179–189. [Google Scholar] [CrossRef]
- Lin, T.; Jia, D.; He, P.; Wang, M. In situ crack growth observation and fracture behavior of short carbon fiber reinforced geopolymer matrix composites. Mater. Sci. Eng. A 2010, 527, 2404–2407. [Google Scholar] [CrossRef]
- Sahmaran, M.; Lachemi, M.; Li, V.C. Assessing Mechanical Properties and Microstructure of Fire-Damaged Engineered Cementitious Composites. ACI Mater. J. 2010, 107, 297–304. [Google Scholar]
- Zuda, L.; Rovnaník, P.; Bayer, P.; Černý, R. Effect of High Temperatures on the Properties of Alkali Activated Aluminosilicate with Electrical Porcelain Filler. Int. J. Thermophys. 2008, 29, 693–705. [Google Scholar] [CrossRef]
- Leiva, C.; Vilches, L.F.; Vale, J.; Fernández-Pereira, C. Influence of the type of ash on the fire resistance characteristics of ash-enriched mortars. Fuel 2005, 84, 1433–1439. [Google Scholar] [CrossRef]
- Masi, G.; Rickard, W.D.A.; Bignozzi, M.C.; van Riessen, A. The effect of organic and inorganic fibres on the mechanical and thermal properties of aluminate activated geopolymers. Compos. Part B 2015, 76, 218–228. [Google Scholar] [CrossRef]
- Kim, G.-M. Fabrication of Bio-nanocomposite Nanofibers Mimicking the Mineralized Hard Tissues via Electrospinning Process; Intech Open Access Publisher: Rijeka, Croatia, 1 February 2010. [Google Scholar]
- Saavedra, W.G.V.; Gutiérrez, R.M.D. Performance of geopolymer concrete composed of fly ash after exposure to elevated temperatures. Constr. Build. Mater. 2017, 154, 229–235. [Google Scholar] [CrossRef]
- Zhang, P.; Li, Q.F. Effect of polypropylene fiber on durability of concrete composite containing fly ash and silica fume. Compos. Part B 2013, 45, 1587–1594. [Google Scholar] [CrossRef]
- Temuujin, J.; Minjigmaa, A.; Davaabal, B.; Bayarzul, U.; Ankhtuya, A.; Jadambaa, T.; MacKenzie, K.J.D. Utilization of radioactive high-calcium Mongolian flyash for the preparation of alkali-activated geopolymers for safe use as construction materials. Ceram. Int. 2014, 40, 16475–16483. [Google Scholar] [CrossRef]
- Bortnovsky, O.; Jiri, D.; Zdenka, T.; Zdenek, S.; Jan, S. Metal Ions as Probes for Characterization of Geopolymer Materials. J. Am. Ceram. Soc. 2010, 91, 3052–3057. [Google Scholar] [CrossRef]
- Duxson, P.; Lukey, G.C.; Deventer, J.S.J.V. Physical evolution of Na-geopolymer derived from metakaolin up to 1000 °C. J Mater. Sci. 2007, 42, 3044–3054. [Google Scholar] [CrossRef]
- Villaquirán-Caicedo, M.A.; Gutiérrez, R.M.D.; Sulekar, S.; Davis, C.; Nino, J.C. Thermal properties of novel binary geopolymers based on metakaolin and alternative silica sources. Appl. Clay Sci. 2015, 118, 276–282. [Google Scholar] [CrossRef]
- Shaikh, F.U.A.; Shafaei, Y.; Sarker, P.K. Effect of nano and micro-silica on bond behaviour of steel and polypropylene fibres in high volume fly ash mortar. Constr. Build. Mater. 2016, 115, 690–698. [Google Scholar] [CrossRef]
- Castel, A.; Foster, S.J. Bond strength between blended slag and Class F fly ash geopolymer concrete with steel reinforcement. Cem. Concr. Res. 2015, 72, 48–53. [Google Scholar] [CrossRef]
- Jianhe, X.; Junjie, W.; Rui, R.; Chonghao, W.; Chi, F. Effect of combined usage of GGBS and fly ash on workability and mechanical properties of alkali activated geopolymer concrete with recycled aggregate. Compos. Part B 2019, 164, 179–190. [Google Scholar]
- Mahdieh, K.; Hani, A.; Yong-Rak, K.; Gabriel, N.; Sussan, M. Effects of Na2O/SiO2 molar ratio on properties of aggregate-paste interphase in fly ash-based geopolymer mixtures through multiscale measurements. Constr. Build. Mater. 2018, 191, 564–574. [Google Scholar]
- Chindaprasirt, P.; Chai, J.; Chalee, W.; Rattanasak, U. Comparative study on the characteristics of fly ash and bottom ash geopolymers. Waste Manag. 2009, 29, 539–543. [Google Scholar] [CrossRef]
- Adak, D.; Sarkar, M.; Mandal, S. Structural performance of nano-silica modified fly-ash based geopolymer concrete. Constr. Build. Mater. 2017, 135, 430–439. [Google Scholar] [CrossRef]
- Tadokoro, H.; Seki, S.; Nitta, I. Some information on the infrared absorption spectrum of polyvinyl alcohol from deuteration and pleochroism. J. Polym. Sci. A 1956, 22, 563–566. [Google Scholar] [CrossRef]
- Bunn, C.W. Crystal Structure of Polyvinyl Alcohol. Nature 1950, 23, 929–930. [Google Scholar] [CrossRef]


| Chemical | Component (wt.%) |
|---|---|
| Al2O3 | 26.56 |
| SiO2 | 59.23 |
| CaO | 03.40 |
| Fe2O3 | 05.65 |
| K2O | 00.65 |
| MgO | 01.40 |
| Na2O | 00.72 |
| TiO2 | 01.30 |
| SO3 | 00.34 |
| Loss on ignition | 00.46 |
| Parameter | Value |
|---|---|
| Length (mm) | 8 |
| Diameter (µm) | 39 |
| Young’s modulus (GPa) | 41 |
| Elongation (%) | 6 |
| Density (g/cm3) | 1.3 |
| Strength (MPa) | 1600 |
© 2019 by the authors. Licensee MDPI, Basel, Switzerland. This article is an open access article distributed under the terms and conditions of the Creative Commons Attribution (CC BY) license (http://creativecommons.org/licenses/by/4.0/).
Share and Cite
Malik, M.A.; Sarkar, M.; Xu, S.; Li, Q. Effect of PVA/SiO2 NPs Additive on the Structural, Durability, and Fire Resistance Properties of Geopolymers. Appl. Sci. 2019, 9, 1953. https://doi.org/10.3390/app9091953
Malik MA, Sarkar M, Xu S, Li Q. Effect of PVA/SiO2 NPs Additive on the Structural, Durability, and Fire Resistance Properties of Geopolymers. Applied Sciences. 2019; 9(9):1953. https://doi.org/10.3390/app9091953
Chicago/Turabian StyleMalik, Muhammad Akbar, Manas Sarkar, Shilang Xu, and Qinghua Li. 2019. "Effect of PVA/SiO2 NPs Additive on the Structural, Durability, and Fire Resistance Properties of Geopolymers" Applied Sciences 9, no. 9: 1953. https://doi.org/10.3390/app9091953
APA StyleMalik, M. A., Sarkar, M., Xu, S., & Li, Q. (2019). Effect of PVA/SiO2 NPs Additive on the Structural, Durability, and Fire Resistance Properties of Geopolymers. Applied Sciences, 9(9), 1953. https://doi.org/10.3390/app9091953