Plant Disease Diagnosis for Smart Phone Applications with Extensible Set of Diseases


Abstract
:Featured Application
Abstract
1. Introduction
2. Materials and Methods
2.1. Image Processing Method and Feature Extraction
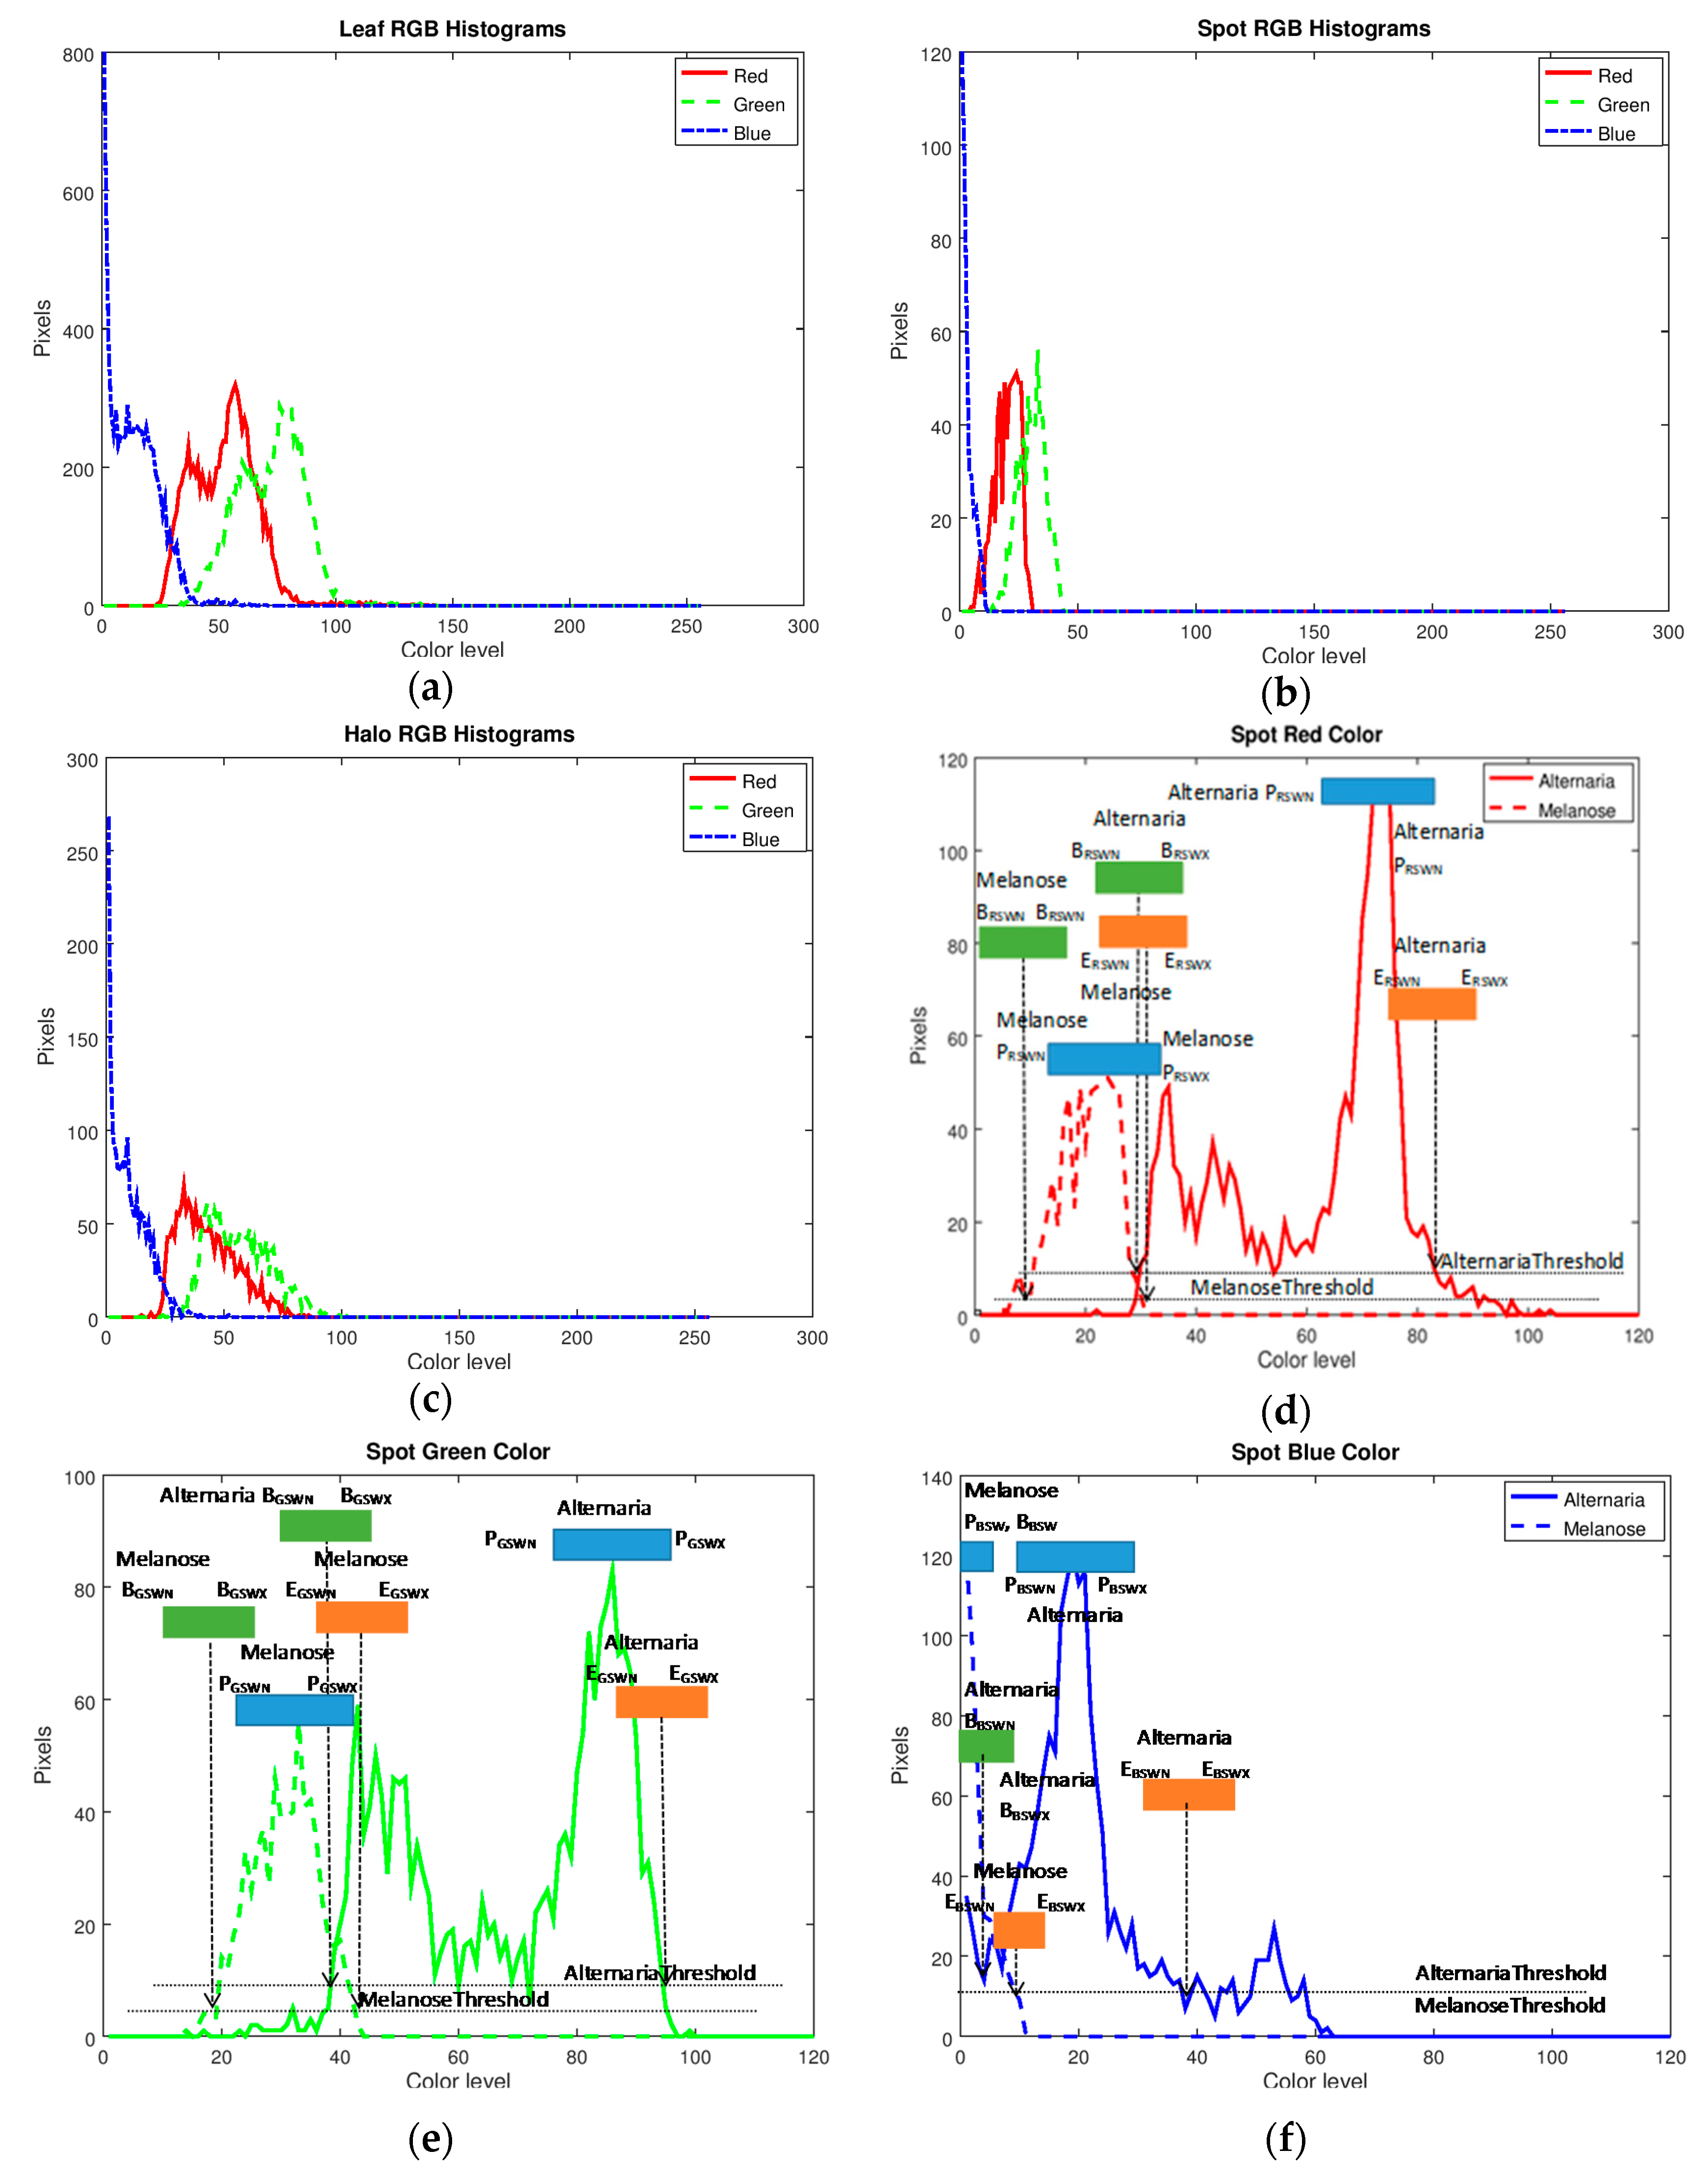
2.2. Plant Disease Signature Definition
2.3. Classification Method
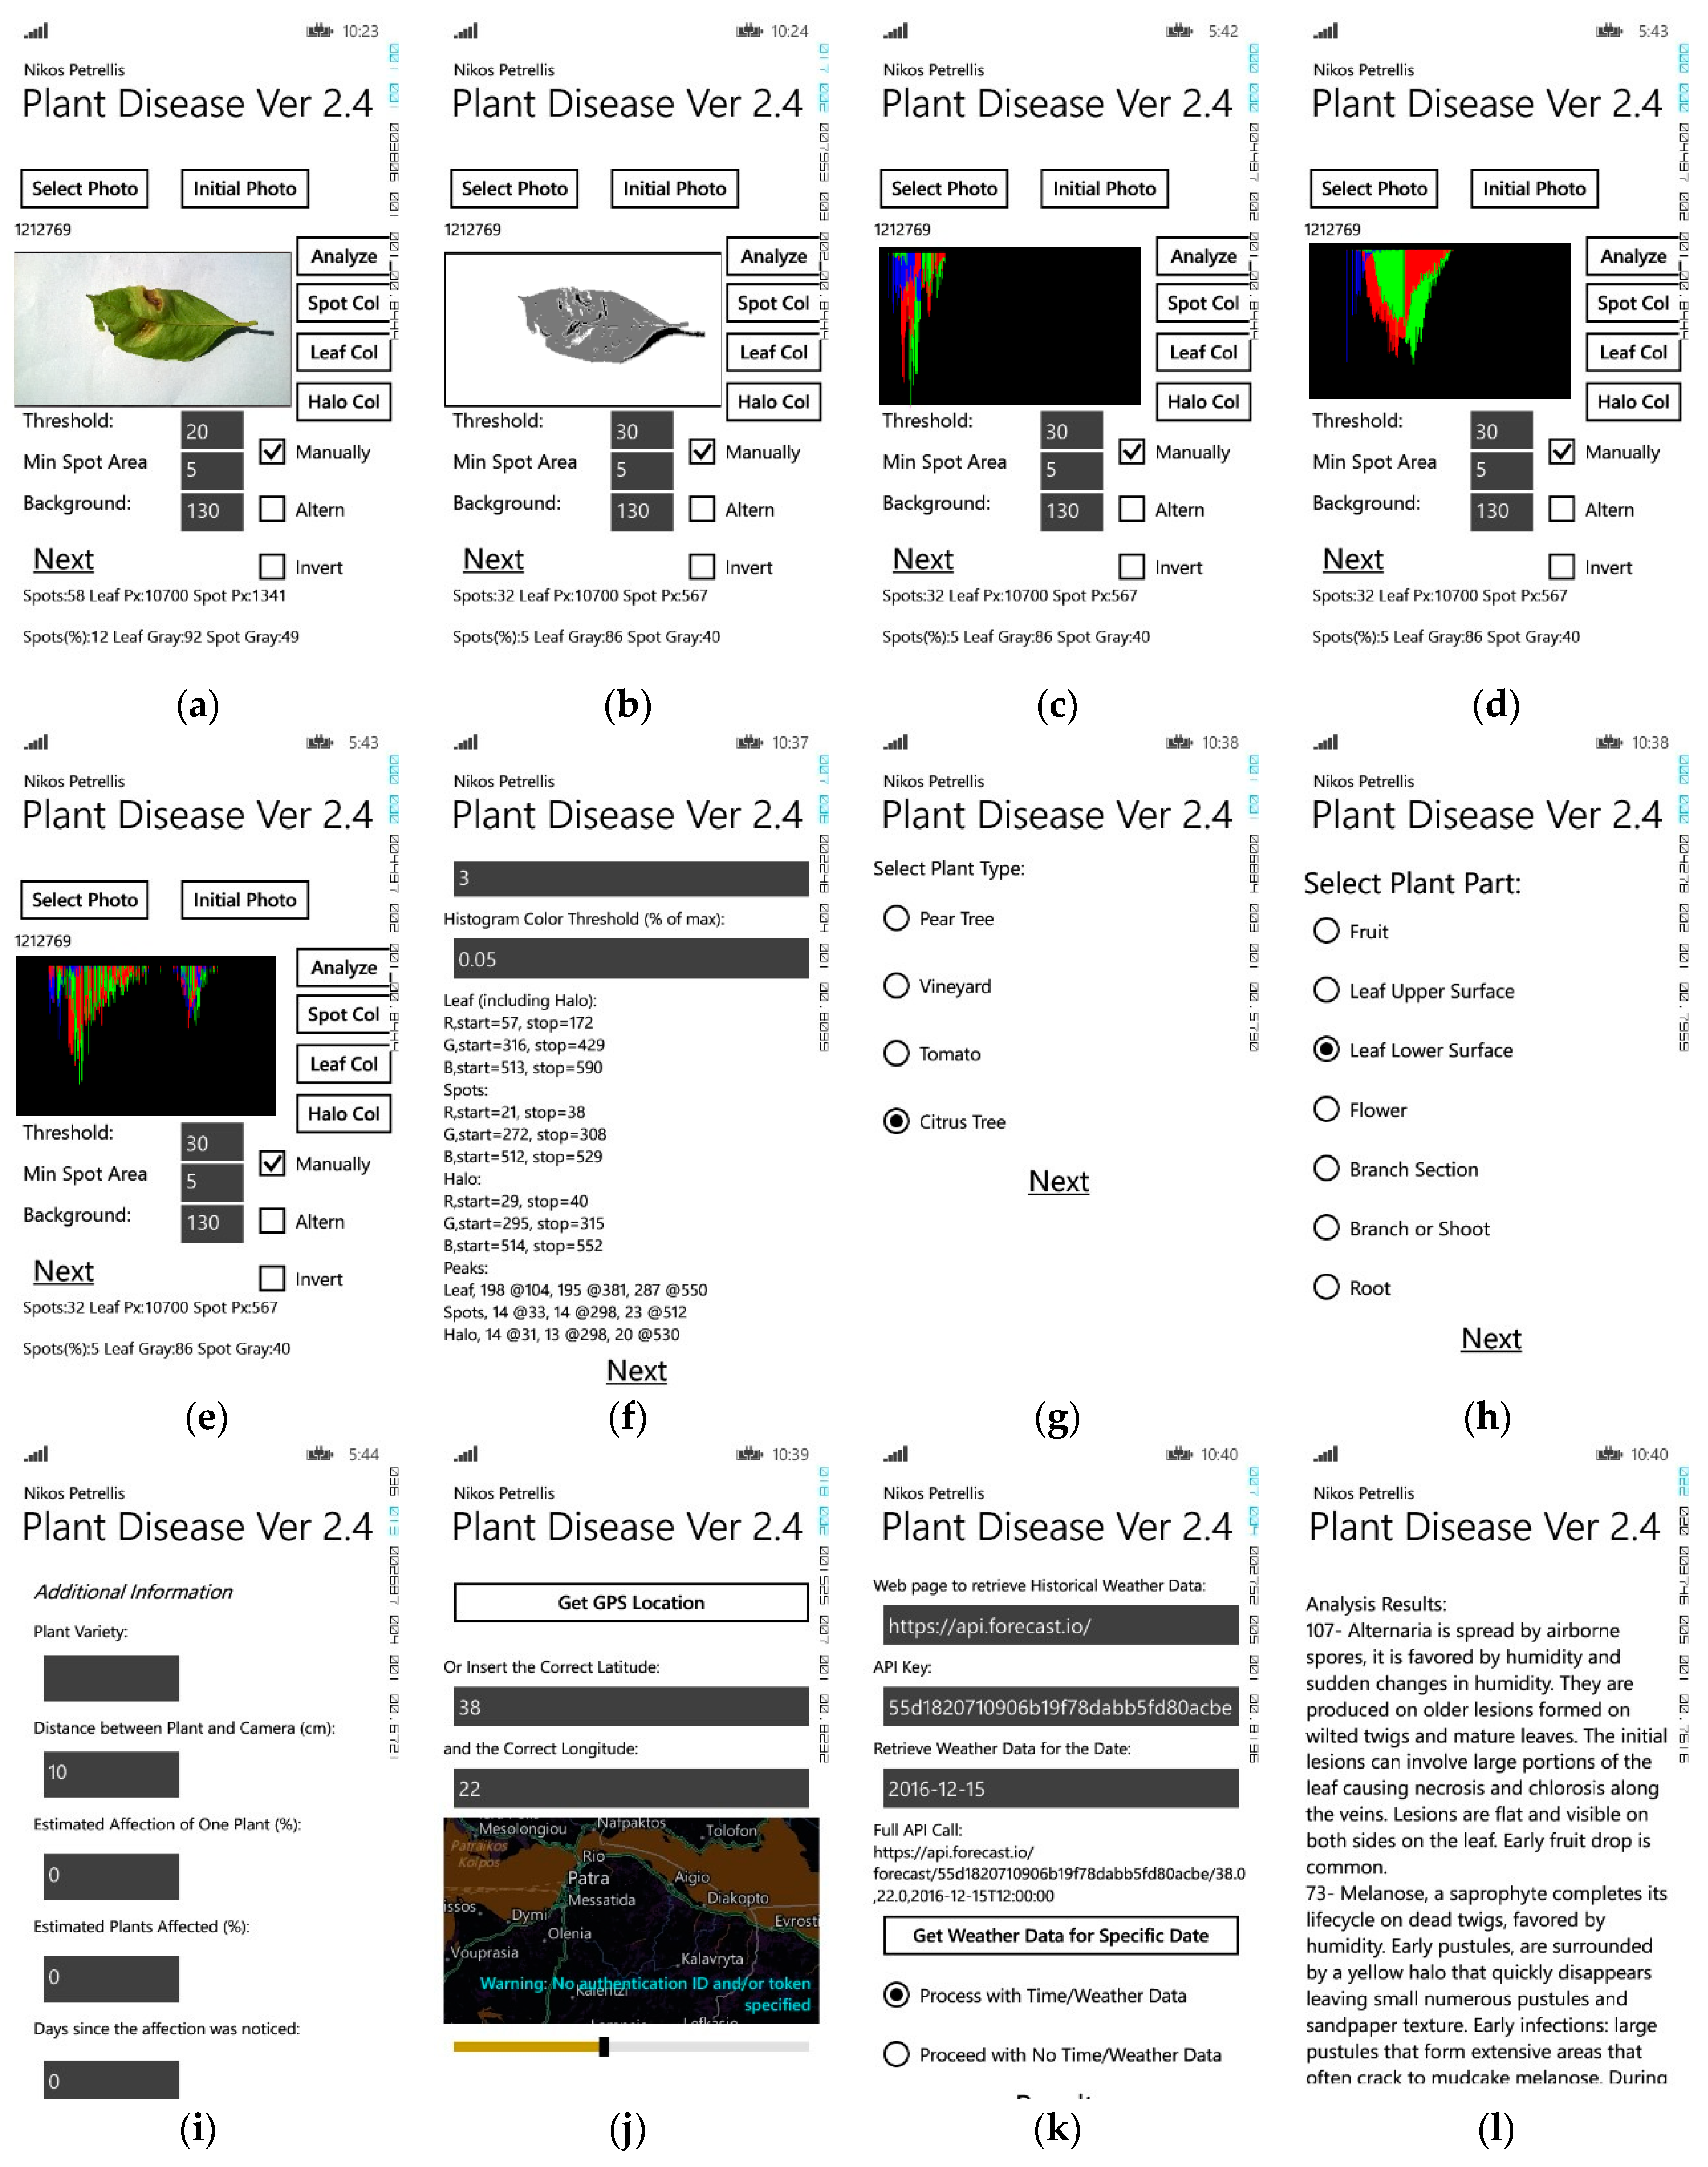
2.4. Smart Phone Application
3. Results
4. Discussion
5. Conclusions
6. Patents
Supplementary Materials
Author Contributions
Funding
Conflicts of Interest
References
- Liu, H.; Lee, S.-H.; Chahl, J.-S. A review of recent sensing technologies to detect invertebrates on crops. Precis. Agric. 2017, 18, 635–666. [Google Scholar] [CrossRef]
- Kurtulmus, F.; Lee, W.S.; Vardar, A. Immature peach detection in color images acquired in natural illumination conditions using statistical classifiers and neural network. Precis. Agric. 2014, 15, 57–79. [Google Scholar] [CrossRef]
- Cubero, S.; Lee, W.S.; Aleixos, N.; Albert, F.; Blasco, J. Automated Systems Based on Machine Vision for Inspecting Citrus Fruits from the Field to Postharvest—a Review. Food Bioprocess Technol. 2014, 9, 1623–1639. [Google Scholar] [CrossRef]
- Chaivivatrakul, S.; Dailey, M. Texture-based fruit detection. Precis. Agric. 2014, 15, 662–683. [Google Scholar] [CrossRef]
- Qureshi, W.S.; Payne, A.; Walsh, K.B.; Linker, R.; Cohen, O.; Dailey, M.N. Machine vision for counting fruit on mango tree canopies. Precis. Agric. 2014, 18, 224–244. [Google Scholar] [CrossRef]
- Liu, T.; Wu, W.; Chen, W.; Sun, C.; Zhu, X.; Guo, W. Automated image-processing for counting seedlings in a wheat field. Precis. Agric. 2016, 17, 392–406. [Google Scholar] [CrossRef]
- Behmann, J.; Mahlein, A.K.; Rumpf, T.; Romer, C.; Plumer, L. A review of advanced machine learning methods for the detection of biotic stress in precision crop protection. Precis. Agric. 2015, 16, 239–260. [Google Scholar] [CrossRef]
- Ballesteros, R.; Ortega, J.F.; Hernández, D.; Moreno, M.A. Applications of georeferenced high-resolution images obtained with unmanned aerial vehicles. Part I: Description of image acquisition and processing. Precis. Agric. 2014, 15, 579–592. [Google Scholar] [CrossRef]
- Calderón, R.; Montes-Borrego, M.; Landa, B.B.; Navas-Cortés, J.A.; Zarco-Tejada, P.J. Detection of downy mildew of opium poppy using high-resolution multi-spectral and thermal imagery acquired with an unmanned aerial vehicle. Precis. Agric. 2014, 15, 639–661. [Google Scholar] [CrossRef] [Green Version]
- Petrellis, N. A Review of Image Processing Techniques Common in Human and Plant Disease Diagnosis. Symmetry 2018, 10, 270. [Google Scholar] [CrossRef]
- Deng, X.-L.; Li, Z.; Hong, T.-S. Citrus disease recognition based on weighted scalable vocabulary tree. Precis. Agric. 2014, 16, 321–330. [Google Scholar] [CrossRef]
- Horst, R.K. Westcott’s Plant Disease Handbook, 6th ed.; Kluwer Academic Publishers: Boston, MA, USA, 2001. [Google Scholar]
- Barbedo, G.C.A. Digital image processing techniques for detecting quantifying and classifying plant diseases. Springer Plus 2013, 2, 660. [Google Scholar] [CrossRef]
- Patil, J.; Kumar, R. Advances in image processing for detection of plant diseases. J. Adv. Bioinform. Appl. Res. 2011, 2, 135–141. [Google Scholar]
- Kulkarni, A.; Patil, A. Applying Image Processing Technique to Detect Plant Diseases. Int. J. Mod. Eng. Res. 2012, 2, 3361–3364. [Google Scholar]
- Camargo, A.; Smith, J. Image pattern classification for the identification of disease causing agents in plants. Comput. Electron. Agric. 2009, 66, 121–125. [Google Scholar] [CrossRef]
- Mohanty, S.P.; Hughes, D.P.; Salathé, M. Using Deep Learning for Image-Based Plant Disease Detection. Front. Plant Sci. 2016, 7, 346. [Google Scholar] [CrossRef] [Green Version]
- Lai, J.-C.; Ming, B.; Li, S.-K.; Wang, K.-R.; Xie, R.-Z.; Gao, S.-J. An Image-Based Diagnostic Expert System for Corn Diseases. Agric. Sci. China 2010, 9, 1221–1229. [Google Scholar] [CrossRef]
- Schaad, N.W.; Frederick, R.D. Real-time PCR and its application for rapid plant disease diagnostics. Can. J. Plant Pathol. 2002, 24, 250–258. [Google Scholar] [CrossRef]
- Sankaran, S.; Mishra, A.; Ehsani, R.; Davis, C. A review of advanced techniques for detecting plant diseases. Comput. Electron. Agric. 2010, 72, 1–13. [Google Scholar] [CrossRef]
- Prasad, S.; Peddoju, S.; Ghosh, D. Multi-resolution mobile vision system for plant leaf disease diagnosis. Signal Image Video Process. 2016, 10, 379–388. [Google Scholar] [CrossRef]
- Johannes, A.; Picon, A.; Alvarez-Gila, A.; Echazarra, J.; Rodriguez-Vaamonde, S.; Navajas, A.D.; Ortiz-Barredo, A. Automatic plant disease diagnosis using mobile capture devices, applied on a wheat use case. Comput. Electron. Agric. 2017, 138, 200–209. [Google Scholar] [CrossRef]
- Abu-Naser, S.; Kashkash, K.; Fayyad, M. Developing an Expert System for Plant Disease Diagnosis. J. Artif. Intell. 2008, 1, 78–85. [Google Scholar] [CrossRef]
- Luke, E.; Beckerman, J.; Sadof, C.; Richmond, D.; McClure, D.; Hill, M.; Lu, Y. Purdue Plant Doctor App Suite. Purdue University. Available online: https://www.purdueplantdoctor.com/ (accessed on 16 February 2019).
- Strey, S.; Strey, R.; Burkert, S.; Knake, P.; Raetz, K.; Seyffarth, K.; et al. Plant Doctor app. Available online: https://plantix.net/ (accessed on 16 February 2019).
- Petrellis, N. A Smart Phone Image Processing Application for Plant Disease Diagnosis. In Proceedings of the 2017 6th International Conference on Modern Circuits and Systems Technologies (MOCAST), Thessaloniki, Greece, 4–6 May 2017. [Google Scholar]
- Petrellis, N. Mobile Application for Plant Disease Classification Based on Symptom Signatures. In Proceedings of the 21st Pan-Hellenic Conference on Informatics, Larissa, Greece, 28–30 September 2017; pp. 1–6. [Google Scholar]
- Petrellis, N. Plant Lesion Characterization for Disease Recognition- A windows phone application. In Proceedings of the 2nd International Conference on Frontiers of Signal Processing, Warsaw, Polland, 15–17 October 2016. [Google Scholar]
- OpenWeather. Available online: api.forecast.io (accessed on 16 February 2019).
- Quinlan, R. C4.5: Programs for Machine Learning; Morgan Kaufmann Publishers: San Mateo, CA, USA, 1993. [Google Scholar]
- Breiman, L. Random Forests. Mach. Learn. 2001, 45, 5–32. [Google Scholar] [CrossRef] [Green Version]
- John, G.; Langley, P. Estimating Continuous Distributions in Bayesian Classifiers. In Proceedings of the 11th Conference on Uncertainty in Artificial Intelligence, San Mateo, CA, USA, 18–20 August 1995; pp. 338–345. [Google Scholar]
- Sumner, M.; Frank, E.; Hall, M. Speeding Up Logistic Model Tree Induction. In Lecture Notes in Computer Science; Springe: Berlin, Germany, 2005; pp. 675–683. [Google Scholar]
- Landwehr, N.; Hall, M.; Frank, E. Logistic Model Trees. Mach. Learn. 2005, 95, 161–205. [Google Scholar] [CrossRef]
- Petrellis, Ν. Skin Disorder Diagnosis Assisted by Lesion Color Adaptation. In Proceedings of the 22nd Pan-Hellenic Conference on Informatics, Athens, Greece, 29 November–1 December 2018; pp. 208–212. [Google Scholar]
- Wadhawan, T.; Situ, N.; Lancaster, K.; Yuan, X.; Zouridakis, G. SkinScanc: A Portable Library for Melanoma Detection on Handheld Devices. In Proceedings of the 2011 IEEE International Symposium on Biomedical Imaging: From Nano to Macro, Chicago, IL, USA, 30 March–2 April 2011. [Google Scholar]


| Feature | Notes |
|---|---|
| Number of Spots (Ns) | Spots consisting of less than a predetermined number of pixels can be considered as noise and be ignored |
| Area of the Spots (As) | The ratio of the lesion spot pixels to the ones of the overall plant part |
| Spot grayness (Gs) | The average gray level of the pixels belonging to spots |
| Normal plant part grayness (Gl) | The average gray level of the pixels belonging to the normal plan part |
| Halo grayness (Gh) | The average gray level of the pixels belonging to the halo |
| Average Moisture (Md) | The average daily moisture estimated for a number of dates determined by the user |
| Average Minimum Temperature (Tn) | The average daily minimum temperatures estimated for a number of dates determined by the user |
| Average Maximum Temperature (Tx) | The average daily maximum temperatures estimated for a number of dates determined by the user |
| Beginning of a color histogram (Bcr) | The histogram position of the red (c = R), the rreen (c = G), or the blue (c = B) color of the spot (r = S), the normal plant part (r = L), or the halo (r = H) where the histogram curve crosses upwards the Tbe threshold (9 parameters) |
| Ending of a color histogram (Ecr) | The histogram position of the red (c = R), the green (c = G) or the blue (c = B) color of the spot (r = S), the normal plant part (r = L) or the halo (r = H) where the histogram curve crosses downwards the Tbe threshold (9 parameters) |
| Histogram Peak (Pcr) | The histogram peak position of the red (c = R), the green (c = G) or the blue (c = B) color of the spot (r = S), the normal plant part (r = L) or the Halo (r = H) (9 parameters) |
| SSM1 Optimal Th (Th,opt) (%) | SSM1 (Th,opt − 10) (%) | SSM1 (Th,opt + 10) (%) | SSM2 (%) | SSM3 (%) | |
|---|---|---|---|---|---|
| Alternaria (44/6) | 86/78/80 | 82/78/79 | 82/78/79 | 41/96/85 | 63/90/85 |
| Anthracnose (24/6) | 75/92/89 | 73/98/95 | 70/86/84 | 20/84/77 | 89/76/77 |
| CCDV (22/8) | 91/100/99 | 45/100/92 | 91/100/99 | 75/100/98 | 90/99/98 |
| Melanose (36/8) | 86/78/80 | 82/78/79 | 82/78/79 | 41/96/85 | 63/90/85 |
| Nutrient Deficiency (38/8) | 79/96/92 | 74/96/91 | 68/96/89 | 61/94/87 | 18/100/90 |
| SSM1 Optimal Th (Th,opt) (%) | SSM1 (Th,opt − 10) (%) | SSM1 (Th,opt + 10) (%) | SSM2 (%) | SSM3 (%) | |
|---|---|---|---|---|---|
| Alternaria (30/6) | 73/94/90 | 60/94/87 | 60/94/87 | 50/95/91 | 70/90/87 |
| Anthracnose (56/6) | 36/87/79 | 31/86/77 | 33/86/78 | 67/79/76 | 71/76/75 |
| CCDV (18/8) | 89/100/99 | 78/100/97 | 78/100/97 | 68/100/98 | 75/100/98 |
| Melanose (36/8) | 94/100/99 | 83/97/94 | 83/97/94 | 80/90/89 | 75/85/84 |
| Nutrient Deficiency (40/8) | 25/100/81 | 25/100/81 | 25/100/81 | 0/99/89 | 25/100/83 |
| SSM1 Optimal Th (Th,opt) (%) | SSM1 (Th,opt – 10) (%) | SSM1 (Th,opt + 10) (%) | SSM2 (%) | SSM3 (%) | |
|---|---|---|---|---|---|
| Melanose (26/8) | 100/86/92 | 92/86/88 | 92/86/88 | 92/100/96 | 100/93/96 |
| Rot (20/6) | 80/100/89 | 70/100/89 | 70/100/89 | 80/96/93 | 60/100/86 |
| Septoria (10/6) | 33/100/87 | 20/100/86 | 20/100/86 | 100/100/100 | 20/100/86 |
| Fruit Split (10/6) | 40/100/89 | 40/100/89 | 40/100/89 | 75/100/96 | 40/100/89 |
| Classification Method | Alternaria (%) | Anthracnose (%) | CCDV (%) | Nutrient Deficiency (%) | Melanose (%) |
|---|---|---|---|---|---|
| Multilayer Perceptron | 37/84/86 | 33/89/90 | 82/97/97 | 85/92/96 | 56/87/91 |
| J48 | 44/80/87 | 14/88/87 | 64/95/94 | 79/93/95 | 56/86/91 |
| Random Forest | 59/88/91 | 14/93/87 | 73/97/95 | 91/90/98 | 44/89/89 |
| Random Tree | 34/79/85 | 14/84/87 | 73/94/95 | 68/92/92 | 37/83/87 |
| Naïve Bayes | 6/99/78 | 19/91/87 | 59/96/93 | 91/88/98 | 67/63/93 |
| Simple Logistics | 34/86/85 | 14/89/87 | 91/96/97 | 91/93/98 | 70/88/94 |
| LMT | 34/85/85 | 19/86/87 | 82/96/97 | 88/92/97 | 59/89/92 |
| Proposed | 82/90/87 | 52/79/73 | 87/100/97 | 50/100/80 | 96/82/85 |
| Classification Method | Alternaria (%) | Anthracnose (%) | CCDV (%) | Nutrient Deficiency (%) | Melanose (%) |
|---|---|---|---|---|---|
| Multilayer Perceptron | 39/80/83 | 17/85/85 | 83/94/97 | 93/92/98 | 30/89/89 |
| J48 | 33/75/82 | 25/82/86 | 58/93/92 | 73/96/94 | 50/88/91 |
| Random Forest | 50/75/86 | 33/89/88 | 75/96/95 | 87/90/97 | 40/95/91 |
| Random Tree | 39/69/84 | 33/89/86 | 58/94/92 | 73/94/94 | 30/86/89 |
| Naïve Bayes | 11/92/76 | 25/89/86 | 75/94/95 | 93/92/98 | 50/70/92 |
| Simple Logistics | 44/90/85 | 50/87/91 | 83/91/97 | 80/88/95 | 40/93/91 |
| LMT | 44/90/85 | 50/87/91 | 83/93/97 | 87/88/97 | 40/93/91 |
| Proposed | 86/78/80 | 75/92/89 | 91/100/99 | 79/96/92 | 90/92/92 |
| Classification Method | Alternaria (%) | Anthracnose (%) | CCDV (%) | Nutrient Deficiency (%) | Melanose (%) |
|---|---|---|---|---|---|
| Multilayer Perceptron | 50/91/90 | 45/86/91 | 70/97/96 | 84/90/96 | 50/87/88 |
| J48 | 36 | 0/93/84 | 50/93/93 | 58/80/88 | 31/81/84 |
| Random Forest | 29/87/86 | 18/91/87 | 70/95/96 | 79/88/94 | 62/80/91 |
| Random Tree | 36/87/87 | 45/88/91 | 70/93/96 | 74/90/93 | 44/83/87 |
| Naïve Bayes | 7/89/81 | 54/86/93 | 50/90/93 | 68/88/91 | 44/78/87 |
| Simple Logistics | 50/87/90 | 27/86/88 | 70/97/96 | 84/90/96 | 50/87/88 |
| LMT | 43/86/88 | 27/86/88 | 60/97/94 | 84/84/96 | 37/87/86 |
| Proposed | 73/94/91 | 36/87/80 | 89/100/98 | 25/100/81 | 94/100/98 |
| Classification Method | RGB | HSV | HSL | CIE L*a*b |
|---|---|---|---|---|
| Fire Blight | 95.8% | 79.2% | 83.3% | 83.3% |
| Pear Scab | 74% | 98% | 98% | 91.6% |
| Mycosphaerella | 100% | 96% | 94% | 90% |
| Mildew | 100% | 88% | 100% | 98% |
| SSM | Group | Inaccurate | Moderately Accurate | Accurate |
|---|---|---|---|---|
| SSM2 | A (Direct Sunlight) | 1% | 36% | 63% |
| B (Canopy) | 2% | 35% | 63% | |
| C (Fruit) | 0% | 75% | 25% | |
| SSM3 | A (Direct Sunlight) | 19% | 44% | 37% |
| B (Canopy) | 23% | 49% | 28% | |
| C (Fruit) | 0% | 42% | 58% |
© 2019 by the author. Licensee MDPI, Basel, Switzerland. This article is an open access article distributed under the terms and conditions of the Creative Commons Attribution (CC BY) license (http://creativecommons.org/licenses/by/4.0/).
Share and Cite
Petrellis, N. Plant Disease Diagnosis for Smart Phone Applications with Extensible Set of Diseases. Appl. Sci. 2019, 9, 1952. https://doi.org/10.3390/app9091952
Petrellis N. Plant Disease Diagnosis for Smart Phone Applications with Extensible Set of Diseases. Applied Sciences. 2019; 9(9):1952. https://doi.org/10.3390/app9091952
Chicago/Turabian StylePetrellis, Nikos. 2019. "Plant Disease Diagnosis for Smart Phone Applications with Extensible Set of Diseases" Applied Sciences 9, no. 9: 1952. https://doi.org/10.3390/app9091952
APA StylePetrellis, N. (2019). Plant Disease Diagnosis for Smart Phone Applications with Extensible Set of Diseases. Applied Sciences, 9(9), 1952. https://doi.org/10.3390/app9091952