Nonlinear Blind Source Separation and Fault Feature Extraction Method for Mining Machine Diagnosis


1
College of Mechanical and Vehicle Engineering, Taiyuan University of Technology, Taiyuan 030024, China
2
Shanxi Key Laboratory of Fully Mechanized Coal Mining Equipment, Taiyuan 030024, China;
3
Department of Mechanical and Industrial Engineering, University of Massachusetts Amherst, Amherst, MA 01003, USA
*
Author to whom correspondence should be addressed.
Appl. Sci. 2019, 9(9), 1852; https://doi.org/10.3390/app9091852
Submission received: 30 January 2019
/
Revised: 17 April 2019
/
Accepted: 25 April 2019
/
Published: 6 May 2019
(This article belongs to the Special Issue Fault Diagnosis of Rotating Machine)
Abstract
:Featured Application
Mining Industry.
Abstract
Mining machines are strongly nonlinear systems, and their transmission vibration signals are nonlinear mixtures of different kinds of vibration sources. In addition, vibration signals measured by the accelerometer are contaminated by noise. As a result, it is inefficient and ineffective for the blind source separation (BSS) algorithm to separate the critical independent sources associated with the transmission fault vibrations. For this reason, a new method based on wavelet de-noising and nonlinear independent component analysis (ICA) is presented in this paper to tackle the nonlinear BSS problem with additive noise. The wavelet de-noising approach was first employed to eliminate the influence of the additive noise in the BSS procedure. Then, the radial basis function (RBF) neural network combined with the linear ICA was applied to the de-noised vibration signals. Vibration sources involved with the machine faults were separated. Subsequently, wavelet package decomposition (WPD) was used to extract distinct fault features from the source signals. Lastly, an RBF classifier was used to recognize the fault patterns. Field data acquired from a mining machine was used to evaluate and validate the proposed diagnostic method. The experimental analysis results show that critical fault vibration source component can be separated by the proposed method, and the fault detection rate is superior to the linear ICA based approaches.
1. Introduction
A mining machine is the most important piece of equipment for coal mining [1]. A simple failure of the machine will cause severe safety accidents and serious economic losses. Therefore, monitoring the health condition of mining machines is crucial to ensuring mining safety [2,3,4,5]. The vibration, noise, temperature and pressure of mining machines can be used to detect machine faults. According to the variation characteristics of these parameters, the fault location, type and severity can be identified. Vibration analysis is among the most widely used methods in the fault detection of mining machines, owing to its costless usage and easy installation [6]. Because distinct information for early fault signature can be captured by machine vibration, vibration analysis is suitable for fault detection in the early stages. If useful fault features can be identified from the vibration signals, the potential/undergoing failures in the mining machines will be effectively detected to ensure safe, stable and reliable operation of the machines [7]. However, it is always a challenging task to extract features that are useful for indicating the state change of a machine, due to strong background noise and disturbances.
In practice, the vibration signals acquired from mining machines are inevitably contaminated by heavy noise. In addition, the vibration source of a faulty part may mix with the vibration of normal machine parts, such as the vibration of a rotating shaft and meshing gears, which makes it difficult to identify useful fault vibration characteristics [8]. Consequently, it is crucial to separate the faulty vibration source from the sensory measurement of a mixture of various vibration sources before performing fault diagnosis. Different approaches for separating vibration sources have been discussed in the literature. Traditional methods attempt to arrange multiple sensors at different locations to collect the vibration signals of a machine, and then select a relatively optimal sensor for vibration analysis. However, such methods are limited by the subjective consciousness of experts. In order to solve this problem, information fusion and optimization algorithms have been developed to process multi-sensor signals. Pan et al. [9] proposed a blind separation technology to realize the fault feature extraction of aero-engine from multi-sensor vibration signals. Chen et al. [10] used a linear blind signal separation method to fuse the multi-sensor vibration signals of a rotating machine and extracted a useful feature for fault detection. Yang et al. [11] also used a linear blind source separation technology to filter out the Gaussian noise and modulation sources from multi-sensor observations to accurately recover a fault vibration component. Linear blind separation technology has been applied to the vibration source identification of engines and rotating machinery in countless papers [12]. Previous studies show that linear blind signal separation based on the independent component analysis (ICA) can produce good fault source separation performance. However, due to linear assumption of the sources, ICA based separation algorithms, such as FastICA [13], are limited to linear systems. When the nonlinearity of the mixed observation signals increases, ICA is not effective and, in some cases, even fails to identify the fault vibration source [14]. Consequently, the linear methods are not appropriate for complex nonlinear separation problems, such as in steam turbines, generators and mining machines [15]. Therefore, nonlinear blind separation has become a hot issue in fault vibration source separation. Li et al. [16] proposed a bounded component analysis for nonlinear source separation for a wind turbine. Fantinato et al. [17] developed a second-order statistics separator for nonlinear mixtures. Li et al. [18] presented a complex matrix joint diagonalization method for noncircular sources in typical nonlinear functions. He et al. [19] employed a single channel method to separate nonlinear dynamic sources based on an instantaneous model. Li et al. [20] introduced a separator for marine gearbox fault source extraction based on the Chaos algorithm. However, the main limitation of nonlinear blind source separation (BSS) methods is that their solution is not unique [15]. In view of the fact that the neural networks can effectively identify the uncertainty of a nonlinear system, it is possible to combine the neural network and ICA to separate the nonlinear mixtures. Pajunen et al. [21] used a self-organizing neural network (SOM) to extract the independent components of nonlinear mixed signals. Burel et al. [22] proposed a nonlinear blind separation model based on the probabilistic neural network (PNN). Tan et al. [14] introduced a post-linear blind separation model by combining radial basis function (RBF) network and ICA to eliminate the uncertainty of a nonlinear mixture. However, most of the existing nonlinear separation models have not considered additive noise in the mixture, which is not realistic, because in practical applications the mixture is always subject to various noise sources. For instance, the vibration signal collected by an accelerator is inevitably mixed with additive noise due to sensor noise. If the additive noise is neglected in the BSS processing, the separation performance may decrease. To our best knowledge, the nonlinear BSS considering additive noise has not been found in the fault detection of mining machines.
In order to bridge the aforementioned research gap in the fault detection of mining machines, this paper proposes a novel wavelet-based nonlinear ICA separator for fault vibration source extraction from mining machine vibration signals. The contribution of this work is a novel wavelet-nonlinear ICA model with consideration of additive noise. Experimental tests were carried out to verify the effectiveness of the proposed method. The analysis results demonstrate that the fault source can be separated from the nonlinear mixture using the proposed method with the unwanted source removed. Hence, the fault feature extraction efficiency is improved.
2. The Proposed Method
The proposed method for fault diagnosis of mining machines is shown in Figure 1. Table 1 describes the detailed implementation of the method.
2.1. Wavelet-Nonlinear ICA Model
The vibration signal of a mining machine collected by the accelerator is generally a nonlinear mixture of various vibration sources, such as machine base movement, gear meshing, shaft rotating and connector vibration sources. In addition, the fault source is submerged in strong background noise. Therefore, the fault feature extraction is significantly influenced by the noise and disturbance components, which may make incorrect fault identification. ICA is widely applied to information fusion of multi-channel sensor signals to extract the fault source [1]. However, the traditional ICA algorithm is based on the linear mixing assumption, which assumes a linear mixing processing of different source signals [13]. Equation (1) shows the traditional ICA model:
where, X = [x1, x2,…, xm]T denotes the measurements of m sensors, S = [s1, s2,…, sn]T denotes n unknown sources, and A is the mixing matrix. As can be seen, the unknown source matrix S is a linear transformation of the measurement matrix X via A. ICA aims to find the inverse matrix of A to recover the sources by S = WX, where W is the inverse of A. However, real vibration measurements do not satisfy the linear mixing assumption. In addition, Equation (1) does not consider the additive noise. The following nonlinear ICA model is developed to solve these issues:
where, is the additive noise, T is the observation matrix after the nonlinear mixing process, is the nonlinear mixing function, Z is the observation matrix after nonlinear de-mixing process is the nonlinear de-mixing function and Y is the separated source matrix. Unlike the linear ICA model in Equation (1), the nonlinear ICA model in Equation (2) aims to find ,, A and W. Since and A are unknown, one cannot directly find and W. In order to obtain the approximation of and A and their inverses, wavelet de-noising is used in this paper, and the maximum mutual information criterion based on the radial basis function neural network (RBFNN) is used to solve the de-mixing function and the separation matrix W. The separation process is shown in Figure 2.
X = AS,
The estimation of de-mixing function and the separation matrix based on RBFNN is briefly introduced. RBFNN consists of an input layer, a hidden layer and an output layer. The essence is to convert the input variables from one space to another, thus achieving an infinite approximation of the objective function. The mathematical model of RBFNN is [23]:
where y(t) is an estimated source with input observation t, B is the weight of the network output layer, is the hidden layer center parameters with center and width , K(t, p) is the kernel function vector. The Gaussian function is usually adopted as the kernel function:
where l = 1, 2, …, L and L is the number of the Gaussian function. Assume that wavelet de-noising can eliminate additive noise and the nonlinear mixing function is reversible, so there is always a set of RBF parameters that make any estimated source close to the true one.
where and are the optimized parameters by RBF. In order to get the optimal RBF parameters, the maximum mutual information criterion is employed in the RBF optimization:
where, is the expectation operator, py and pyi are the probability distribution functions. By adjusting the RBF parameters to minimize the mutual information, the source components in the mixture can be separated. The gradient descent learning algorithm is used to update the RBF parameters to get the optimal B, and :
where, is the network learning rate, , and are the adjustment increments of B, and , respectively.
y(t) = BK(t, p),
By performing wavelet de-noising and RBF learning, the additive noise and the unwanted vibration source components can be eliminated from the mixture, and hence, the fault characteristic information can be obtained using the wavelet-nonlinear ICA.
2.2. Fault Feaure Extraction and Identification
In this paper, wavelet packet decomposition (WPD) [24] is used to extract fault features from the separated fault vibration source. WPD is a powerful time-frequency domain analysis tool for studying non-stationary signals in recent years. The multi-resolution ability makes WPD able to not only reflect the overall characteristics of a signal but also the local information. It can locate the short-time high-frequency components in the signal and display the low-frequency components. A brief introduction of WPD is given below.
WPD can be regarded as an extension of the progressive partitioning of a function space. It divides the frequency band into multiple layers and adaptively selects the layers for characteristic analysis. WPD uses the following recursive formula for signal decomposition:
where hk is a high pass filter and gk is a low pass filter, k is the number of decomposition layers, is the decomposition via high pass filters, is the decomposition via low pass filters and j ∈ Z. It can be seen that a proper number of decomposition layers can produce required frequency band width and in each frequency band the noise and useless frequency characteristics can be removed. In this way, by reconstructing the decomposed signal in each frequency sub-band, the fault information can be amplified. Then, various statistical features can be calculated in each frequency sub-band. In this paper, three-layer WPD was performed and eight sub-band signals were reconstructed. Then, four statistics including the energy, variance, skewness and kurtosis of each sub-band signal was calculated, resulting in 32 elements in total as a feature vector.
In order to recognize the fault patterns, the RBFNN is employed as the fault classifier in this work. The feature vector is the input of the RBFNN classifier, and the fault pattern is the output.
3. Results
Experimental tests were carried out to evaluate the proposed method. The vibration datasets were measured from a gearbox in a mining machine with artificial failures on the gears. Four acceleration sensors were installed at two different locations of the transmission system (see Figure 3). Sensors were installed on each location to measure the vibration signals in horizontal and vertical directions. The measured datasets were obtained in the case of two faulty gears in the gear transmission system, and the fault frequency of gear 1 was fh = 19.5 Hz and the second gear fault frequency was fl = 13.4 Hz. Figure 4 shows the time waveforms of the vibration signals measured by the four sensors with a spalling failure in gear 1 and a broken gear tooth in gear 2. Figure 5 depicts the time waveforms of the signals after wavelet de-noising. Figure 6 shows the spectrum of the measured signal of sensor 3 before and after the wavelet de-noising.
As can be seen in Figure 4, Figure 5 and Figure 6, the original vibration signals of the mining machine were contaminated by strong background noise, which had a great influence on the amplitude impact of the time waveforms and the frequency distributions. After wavelet de-noising, the influence of noise was effectively suppressed in both the time domain and frequency domain. Comparing Figure 4 with Figure 5, it is noticed that the noise energy in the original signals has been significantly reduced, and the time interval between each two peaks in the de-noised signals is more observable than that in the original ones. The time interval could provide useful periodical information about the mechanical impact of the mining machine for discovering undergoing faults. In Figure 6, after wavelet de-noising the peak locating at 19.9 Hz (≈ 19.5 Hz) can be clearly observed as the spalling fault frequency. Useless frequency components have been filtered by wavelet processing. However, the broken tooth fault frequency 13.4 Hz is not observed. It is worth noting that the spectral peaks and sidebands of the fault frequencies are strong indicators for the existence of the faults [1]; however, as can be seen from Figure 6, due to different vibration sources (such as vibrations of gears, bearings and shafts) the characteristics of the broken tooth fault frequency is lost. Therefore, it is necessary to separate the spalling fault and the broken tooth fault sources from the measured vibration signals to accurately extract the fault characteristics of the two faults.
The proposed nonlinear ICA was then applied to the de-noised sensor measurements. Figure 7, Figure 8 and Figure 9 shows two independent component time-frequency waveforms separated by nonlinear ICA under different operation conditions of the gearbox.
It can be seen from Figure 7 that the separated source signals include the spalling and wear fault frequencies fh and fl, respectively, and their harmonics. Significant energy lines appear at these characteristic frequencies. The separation results show that different fault vibration sources of the two gears can be extracted from the mixed observation signals.
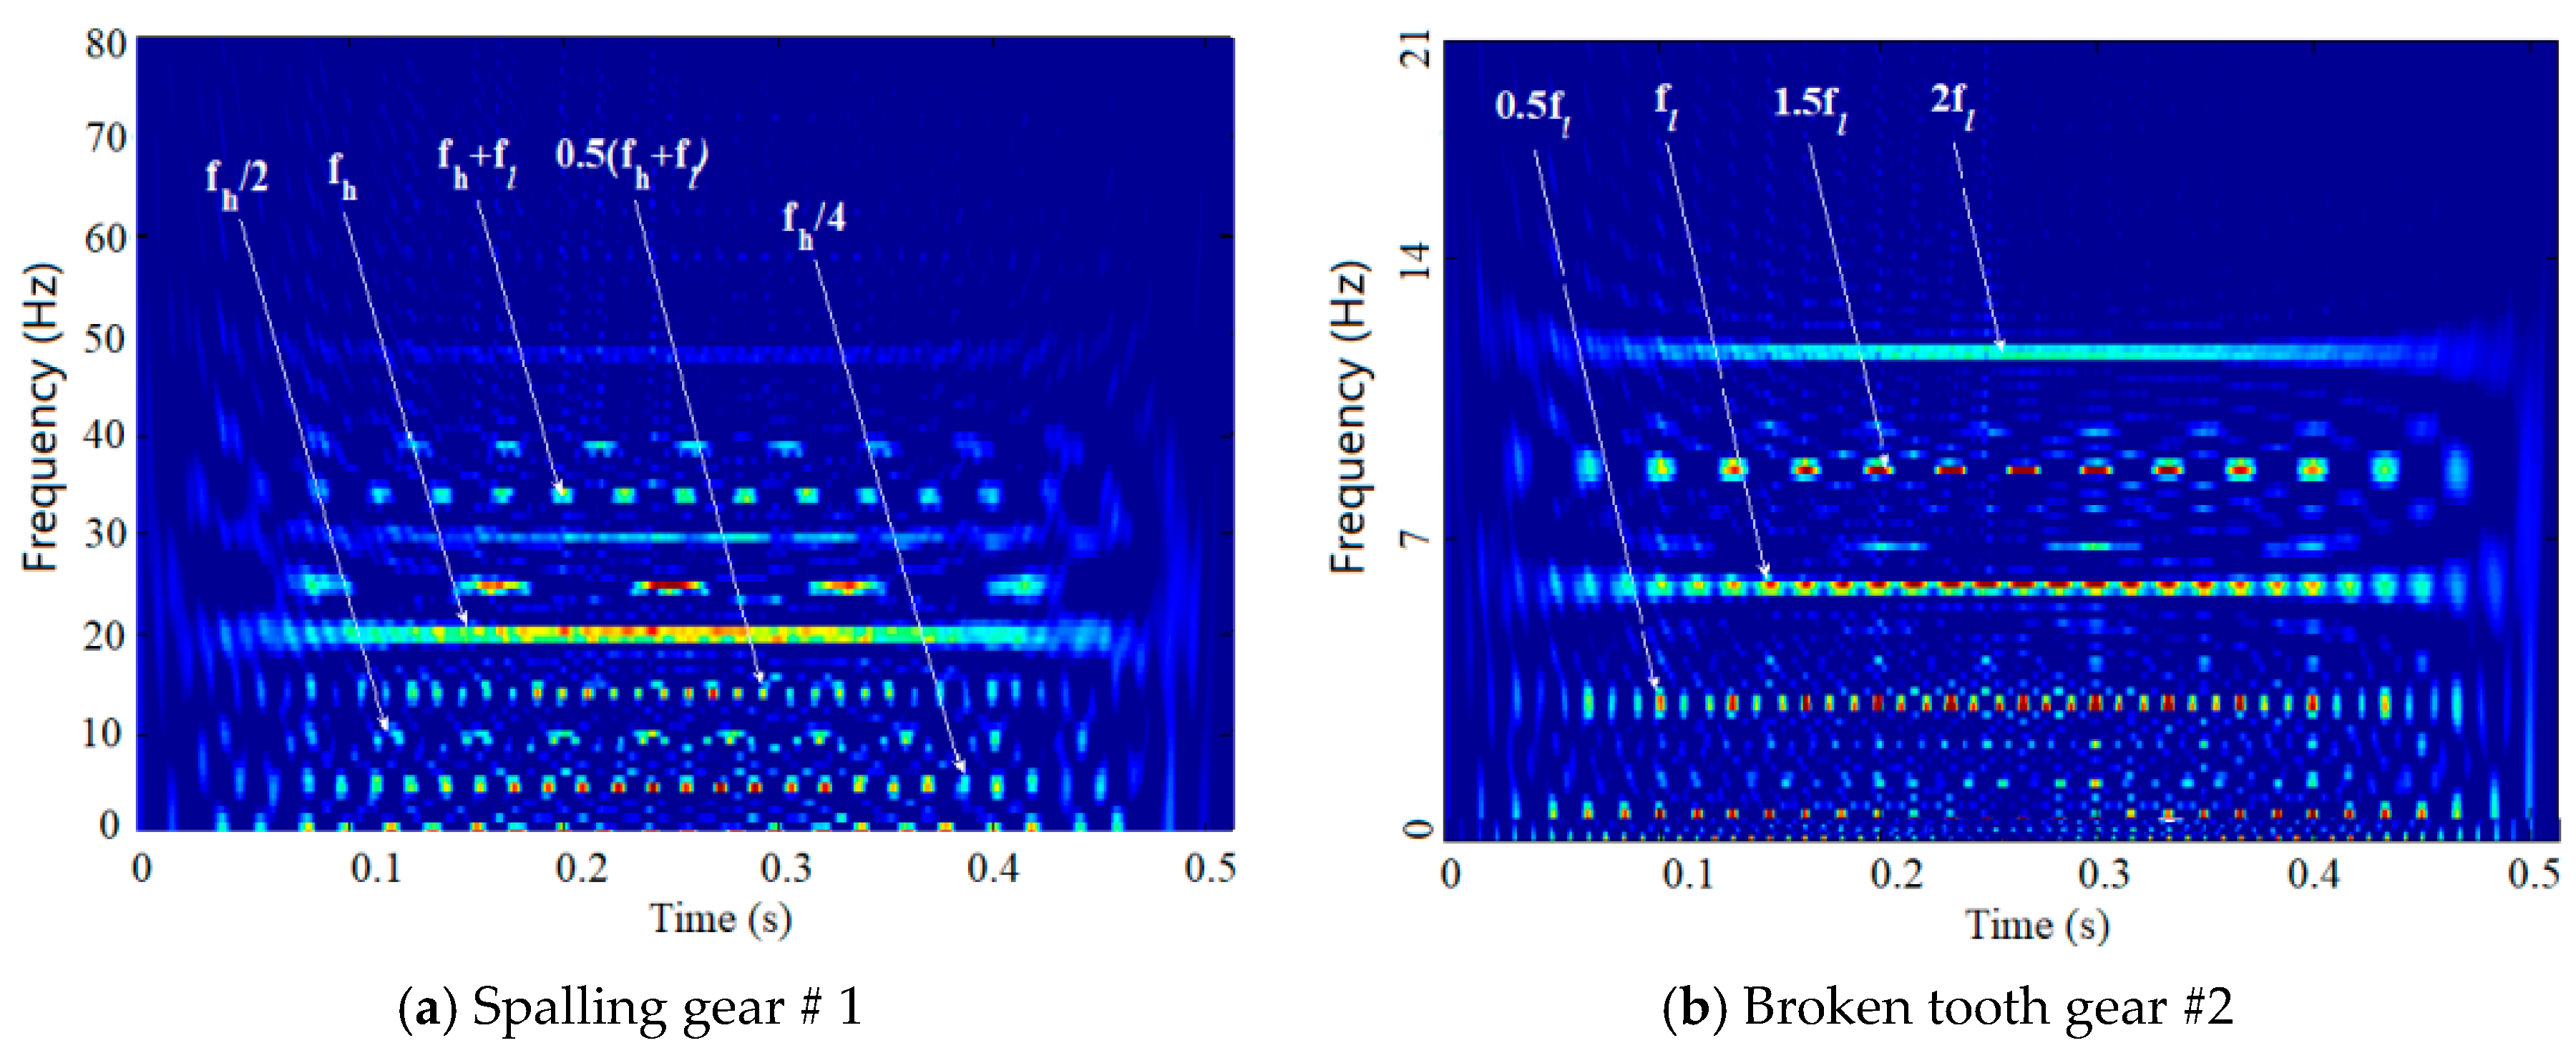
Similar observations can be seen from Figure 8 and Figure 9. However, when the gear fault degree increases, in addition to energy lines at fh and fl, the separated fault sources present complex coupling frequency components at low frequencies. The coupling frequency (fh + fl) is clearly observed in Figure 9a. Moreover, the amplitude of the energy lines with broken gear tooth condition is much larger than those of other gear fault types. The reason is probably due to functionally damage of the gear pair. By comparing Figure 7, Figure 8 and Figure 9 with Figure 6, it can be seen that the proposed nonlinear ICA model can recover the gear fault vibration sources from the multi-vibration measurements. As a result, the compound gear faults can be effectively identified.
In order to diagnose the gear faults, the WPD analysis was first applied to the separated sources to calculate 32 fault features for each source. Because db10 mother wavelet was effective for vibration analysis [25], it was used in the WPD processing. Then a RBFNN classifier was used to identify the fault types. The RBFNN classifier consisted of 32 notes in input layer, 35 notes in hidden layer and three notes in output layer. The values of the three output notes were set to correspond to the fault patterns; namely, [0 0 1] of the outputs correspond to fault pattern (1) spalling + wear, [0 1 0] to fault pattern (2) spalling + spalling, and [1 0 0] to fault pattern (3) spalling + broken gear tooth. In the process of diagnosing the gear faults, 30 pieces of the datasets were prepared for each operation condition of the gearbox, and there were 90 pieces in total for the three operation conditions of the mining machine. Half of the datasets were used to train the RBFNN classifier and the other half were used for testing.
In order to study the advancement of the proposed method, the blind separation method of linear FastICA and nonlinear ICA based on RBFNN was compared in the diagnosis process. Table 2 gives the diagnosis results of the three test pieces. Table 3 gives the overall diagnostic performance of different methods.
It can be seen from Table 2 that, in general, the proposed method outperforms the other three methods. The proposed method correctly identifies the three test pieces of different gear fault conditions while the two FastICA based methods can only recognize one piece. It is not surprising that all the four methods correctly identify the spalling + wear condition because of slight level of the gear faults. However, with the increase of gear fault degree, the FastICA, Wavelet-FastICA and Nonlinear ICA fail to recognize the gear faults. It is noticed that when wavelet de-noising is not applied, the probability of misjudgment is high, indicating that additive noise increases the difficulty of vibration source separation, which makes ICA separation effect unsatisfactory such that the accuracy of fault diagnosis is low. Compared with the fault detection results of Wavelet-FastICA and Wavelet-nonlinear ICA, the RBF output of the Wavelet-nonlinear ICA is much closer to the truth than that of Wavelet-FastICA.
It can be seen from Table 3 that the proposed Wavelet-nonlinear ICA is able to improve the fault detection accuracy and misdiagnosis rates. Compared with linear separation technology, the nonlinear algorithm can improve the detection accuracy by at least 4.4%. This result further confirms that the signal collected by the sensor is a nonlinear mixing between different vibration sources; especially for faulty operation condition of the mining machine, the degree of nonlinearity will become stronger than that in normal condition. As a result, the traditional linear separation model is not effective for the nonlinear vibration mixture. Moreover, thanks to wavelet de-noising, the additive noise can be reduced to improve the separate performance of ICA and enhance the fault detection rate.
4. Discussions
In the experimental analysis, the db10 mother wavelet was used in the WPD processing. In order to compare different mother wavelets in the WPD processing, the fault detection performance was analyzed using six different mother wavelets. Table 4 shows the comparison results. The wavelet-nonlinear ICA was used as the source separation method in the comparison. As can be seen in Table 4, the fault detection rates of different mother wavelets are very close. As a result, the choice of the mother wavelet is not the key factor that influences the fault detection performance. According to the fault diagnosis results in Table 4, one can note that the proposed wavelet-nonlinear ICA is the key factor. Because the useful vibration source of the faulty part can be effectively extracted by the key wavelet-nonlinear ICA method, the fault detection rate is improved.
5. Conclusions
The complexity and multipath effect of the mining machine vibration lead to the nonlinear mixing of signal sources, and additive noise was introduced by the sensor when collecting the vibration signal. Hence, useful vibration characteristics for revealing the health status of the mining machine were completely submerged in the background noise and disturbance. In order to separate the mining machine vibration fault signal from the nonlinear mixed signal with additive noise, this paper proposes a novel wavelet-nonlinear ICA model to extract distinct source components of machine faults. Through analysis of the actual vibration signal of a mining machine, the effectiveness of the proposed diagnostic model was verified. The main conclusions are drawn as follows.
(1) Wavelet de-noising can effectively suppress additive noise in the nonlinear mixed observations to improve the separation performance of the ICA models.
(2) In the case of hybrid gear failures, the nonlinear degree of observation has exceeded the capacity of linear ICA. In this situation, the linear assumption of linear ICA separation cannot be satisfied, so the fault detection accuracy is lower than that of the nonlinear ICA model.
(3) The diagnostic model proposed in this paper is sensitive to the vibration source of the mining machine and can accurately extract the fault vibration source. As a result, it is very suitable for feature extraction and pattern recognition of early faults of mining machine.
Author Contributions
H.D. proposed the idea and methodology; H.D. and Y.W. performed the experiments and analyzed the data; Z.Y. conducted investigations and guidance; H.D. wrote the paper; O.P. edited writing and polished language.
Funding
This research was funded by the Shanxi Science and Technology Foundation Condition Platform Project, grant 201805D141002 and the Joint Training Base for Postgraduate Students in Shanxi Province, grant 2018JD15.
Acknowledgments
Thanks are due to Taizhong Coal Machinery Co., Ltd. for providing experimental equipment and environment.
Conflicts of Interest
The authors declare no conflict of interest.
References
- Miriam, A.; Anna, G.; Daniela, M.; Gabriel, F.; Vieroslav, M. Using logistic regression in tracing the significance of rubber–textile conveyor belt damage. Wear 2014, 318, 145–152. [Google Scholar]
- Glowacz, A. Fault diagnosis of single-phase induction motor based on acoustic signals. Mech. Syst. Signal Process. 2019, 117, 65–80. [Google Scholar] [CrossRef]
- Li, Z.; Jiang, Y.; Guo, Q.; Hu, C.; Peng, Z. Multi-dimensional variational mode decomposition for bearing-crack detection in wind turbines with large driving-speed variations. Renew. Energy 2018, 116, 55–73. [Google Scholar] [CrossRef]
- Glowacz, A. Fault Detection of Electric Impact Drills and Coffee Grinders Using Acoustic Signals. Sensors 2019, 2, 269. [Google Scholar] [CrossRef] [PubMed]
- Liu, G.; Wang, M.; Wang, A.; Wang, S.; Yang, T.; Malekian, R.; Li, Z. Research on flow field perception based on artificial lateral line sensor system. Sensors 2018, 18, 838. [Google Scholar] [CrossRef] [PubMed]
- Taghizadeh-Alisaraei, A.; Mahdavian, A. Fault detection of injectors in diesel engines using vibration time-frequency analysis. Appl. Acoust. 2019, 143, 48–58. [Google Scholar] [CrossRef]
- Li, Z.; Jiang, Y.; Hu, C.; Peng, Z. Difference equation based empirical mode decomposition with application to separation enhancement of multi-fault vibration signals. J. Differ. Equ. Appl. 2017, 23, 457–467. [Google Scholar] [CrossRef]
- Zheng, J.D.; Pan, H.Y.; Cheng, J.S. Rolling bearing fault detection and diagnosis based on composite multiscale fuzzy entropy and ensemble support vector machines. Mech. Syst. Signal Process. 2017, 85, 746–759. [Google Scholar] [CrossRef]
- Pan, N.; Wu, X.; Chi, Y.L.; Liu, X.Q.; Liu, C. Mechanical equipment condition monitoring and fault diagnosis based on frequency-domain blind deconvolution. J. Vib. Shock 2012, 31, 34–41. [Google Scholar]
- Xing, W.U.; Chen, J.B.; Wu, J. Using blind source separation to recover the mechanical fault feature. J. Mech. Strength 2002, 4, 3. [Google Scholar]
- Jiao, W.D.; Yang, S.X.; Wu, Z.T. A method of blind source separation for rotating machinery based on estimation of the number of sources. China Mech. Eng. 2003, 14, 1. [Google Scholar]
- Li, Z.; Jiang, Y.; Hu, C.; Peng, Z. Recent progress on decoupling diagnosis of hybrid failures in gear transmission systems using vibration sensor signal: A review. Measurement 2016, 90, 4–19. [Google Scholar] [CrossRef]
- Hyvärinen, A.; Patrik, O.H.; Mika, I. Topographic independent component analysis. Neural Comput. 2001, 13, 1527–1558. [Google Scholar] [CrossRef]
- Tan, Y.; Wang, J.; Zuradam, M. Nonlinear blind source separation using a radial basis function network. IEEE Trans. Neural Netw. 2001, 12, 124–134. [Google Scholar]
- Swaim, M.; Rutuparna, P.; Prithviraj, K. A Comparative Study of Infomax, Extended Infomax and Multi-User Kurtosis Algorithms for Blind Source Separation. Int. J. Rough Sets Data Anal. 2019, 6, 1–17. [Google Scholar] [CrossRef]
- Li, Z.; Yan, X.; Wang, X.; Peng, Z. Detection of gear cracks in a complex gearbox of wind turbines using supervised bounded component analysis of vibration signals collected from multi-channel sensors. J. Sound Vib. 2016, 371, 406–433. [Google Scholar] [CrossRef]
- Fantinato, D.G.; Duarte, L.T.; Deville, Y.; Attux, R.; Jutten, C.; Neves, A. A second-order statistics method for blind source separation in post-nonlinear mixtures. Signal Process. 2019, 155, 63–72. [Google Scholar] [CrossRef]
- Li, J.; Zhang, H.; Wang, P. Blind separation of temporally correlated noncircular sources using complex matrix joint diagonalization. Pattern Recognit. 2019, 87, 285–295. [Google Scholar] [CrossRef]
- He, P.; She, T.; Li, W.; Yuan, W. Single channel blind source separation on the instantaneous mixed signal of multiple dynamic sources. Mech. Syst. Signal Process. 2018, 113, 22–35. [Google Scholar] [CrossRef]
- Li, Z.; Peng, Z. A new nonlinear blind source separation method with chaos indicators for decoupling diagnosis of hybrid failures: A marine propulsion gearbox case with a large speed variation. Chaos Solitions Fractal 2016, 89, 27–39. [Google Scholar] [CrossRef]
- Pajunen, P.; Hyvarinen, A.; Karhunen, J. Nonliner blind source separation by self-organizing maps. In Proceedings of the International Conference on Neural Information Processing, Hong Kong, China, 24–27 September 1996; Volume 2, pp. 1207–1210. [Google Scholar]
- Burel, G. Blind separation of sources: A nonlinear neural algorithm. Neural Netw. 1992, 5, 937–947. [Google Scholar] [CrossRef]
- Xie, S.; Xie, Y.; Huang, T.; Gui, W.; Yang, C. Generalized Predictive Control for Industrial Processes Based on Neuron Adaptive Splitting and Merging RBF Neural Network. Neural Networks. IEEE Trans. Ind. Eelctron. 2019, 66, 1192–1202. [Google Scholar] [CrossRef]
- He, H.; Tan, Y.; Xing, J. Unsupervised classification of 12-lead ECG signals using wavelet tensor decomposition and two-dimensional Gaussian spectral clustering. Knowl.-Based Syst. 2019, 163, 392–403. [Google Scholar] [CrossRef]
- Wang, Y.; He, Z.; Zi, Y. Enhancement of signal denoising and multiple fault signatures detecting in rotating machinery using dual-tree complex wavelet transform. Mech. Syst. Signal Process. 2010, 24, 119–137. [Google Scholar] [CrossRef]
Figure 1.
Process of fault diagnosis principle of mining machines. WPD, wavelet package decomposition; RBF, radial basis function; ICA, independent component analysis.
Figure 1.
Process of fault diagnosis principle of mining machines. WPD, wavelet package decomposition; RBF, radial basis function; ICA, independent component analysis.
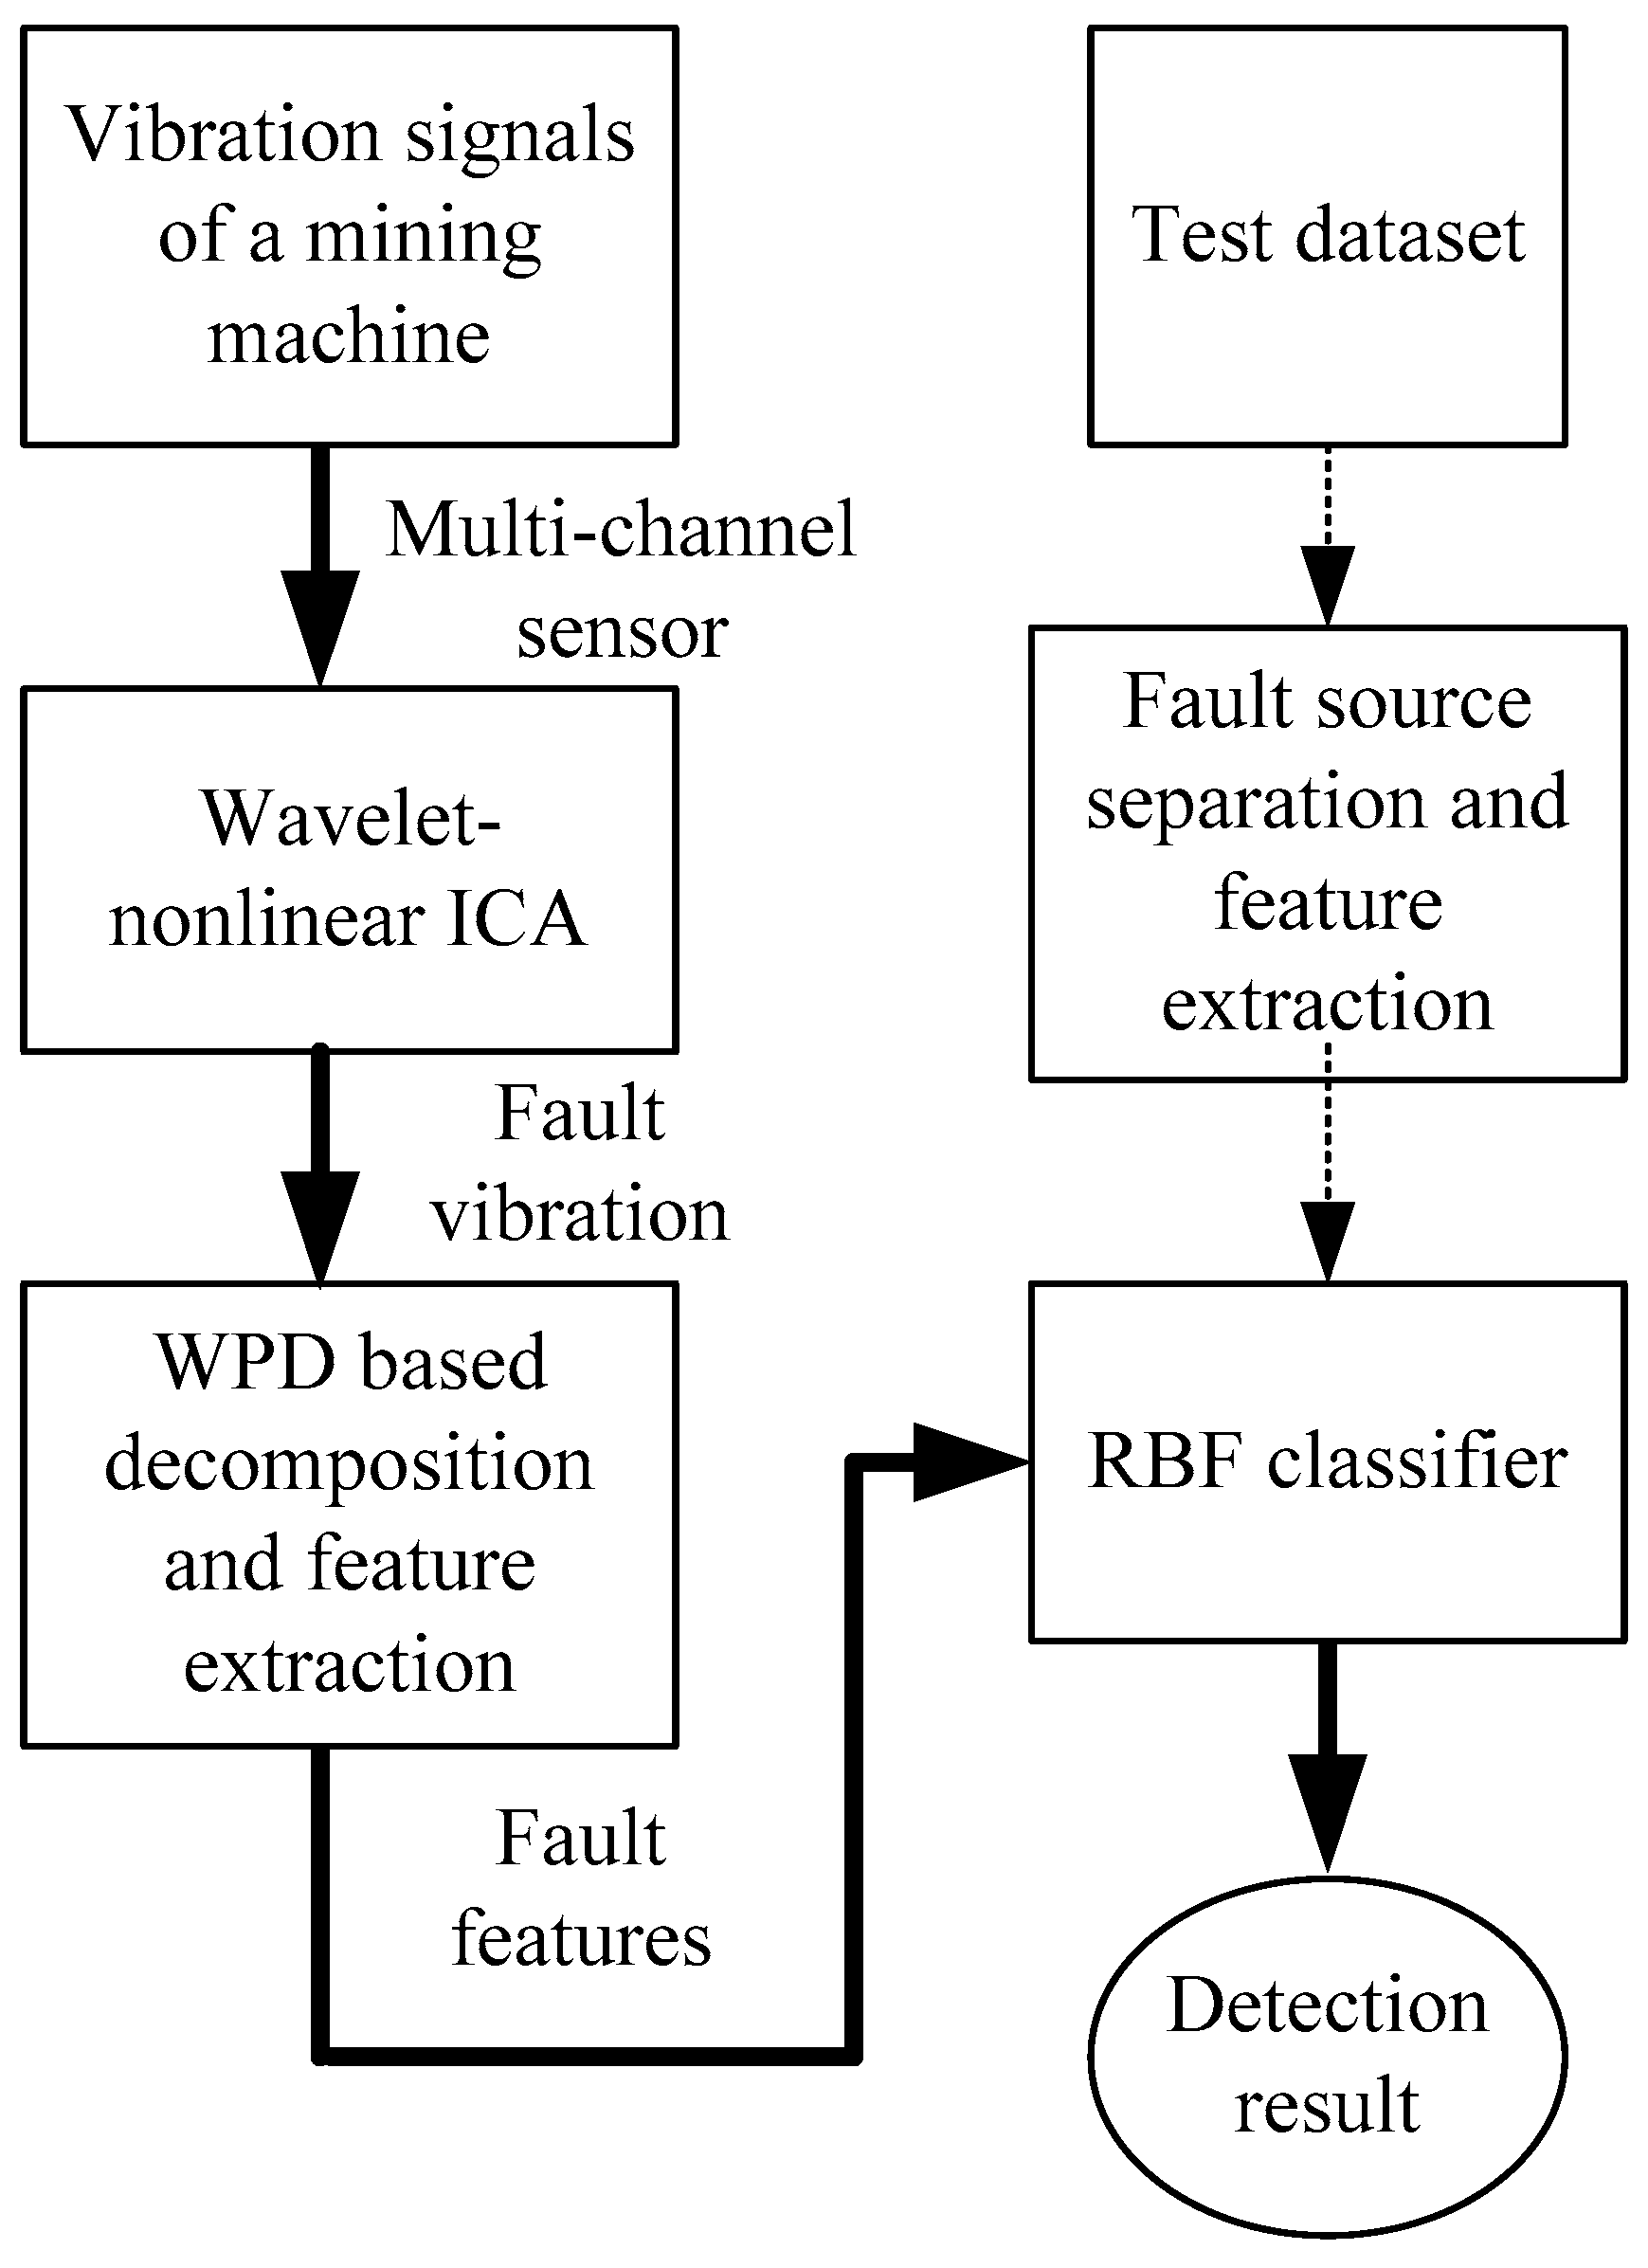
Figure 2.
Nonlinear blind separation of vibration signals of mining machines with additive noise.

Figure 3.
Sensor locations in the experiments.
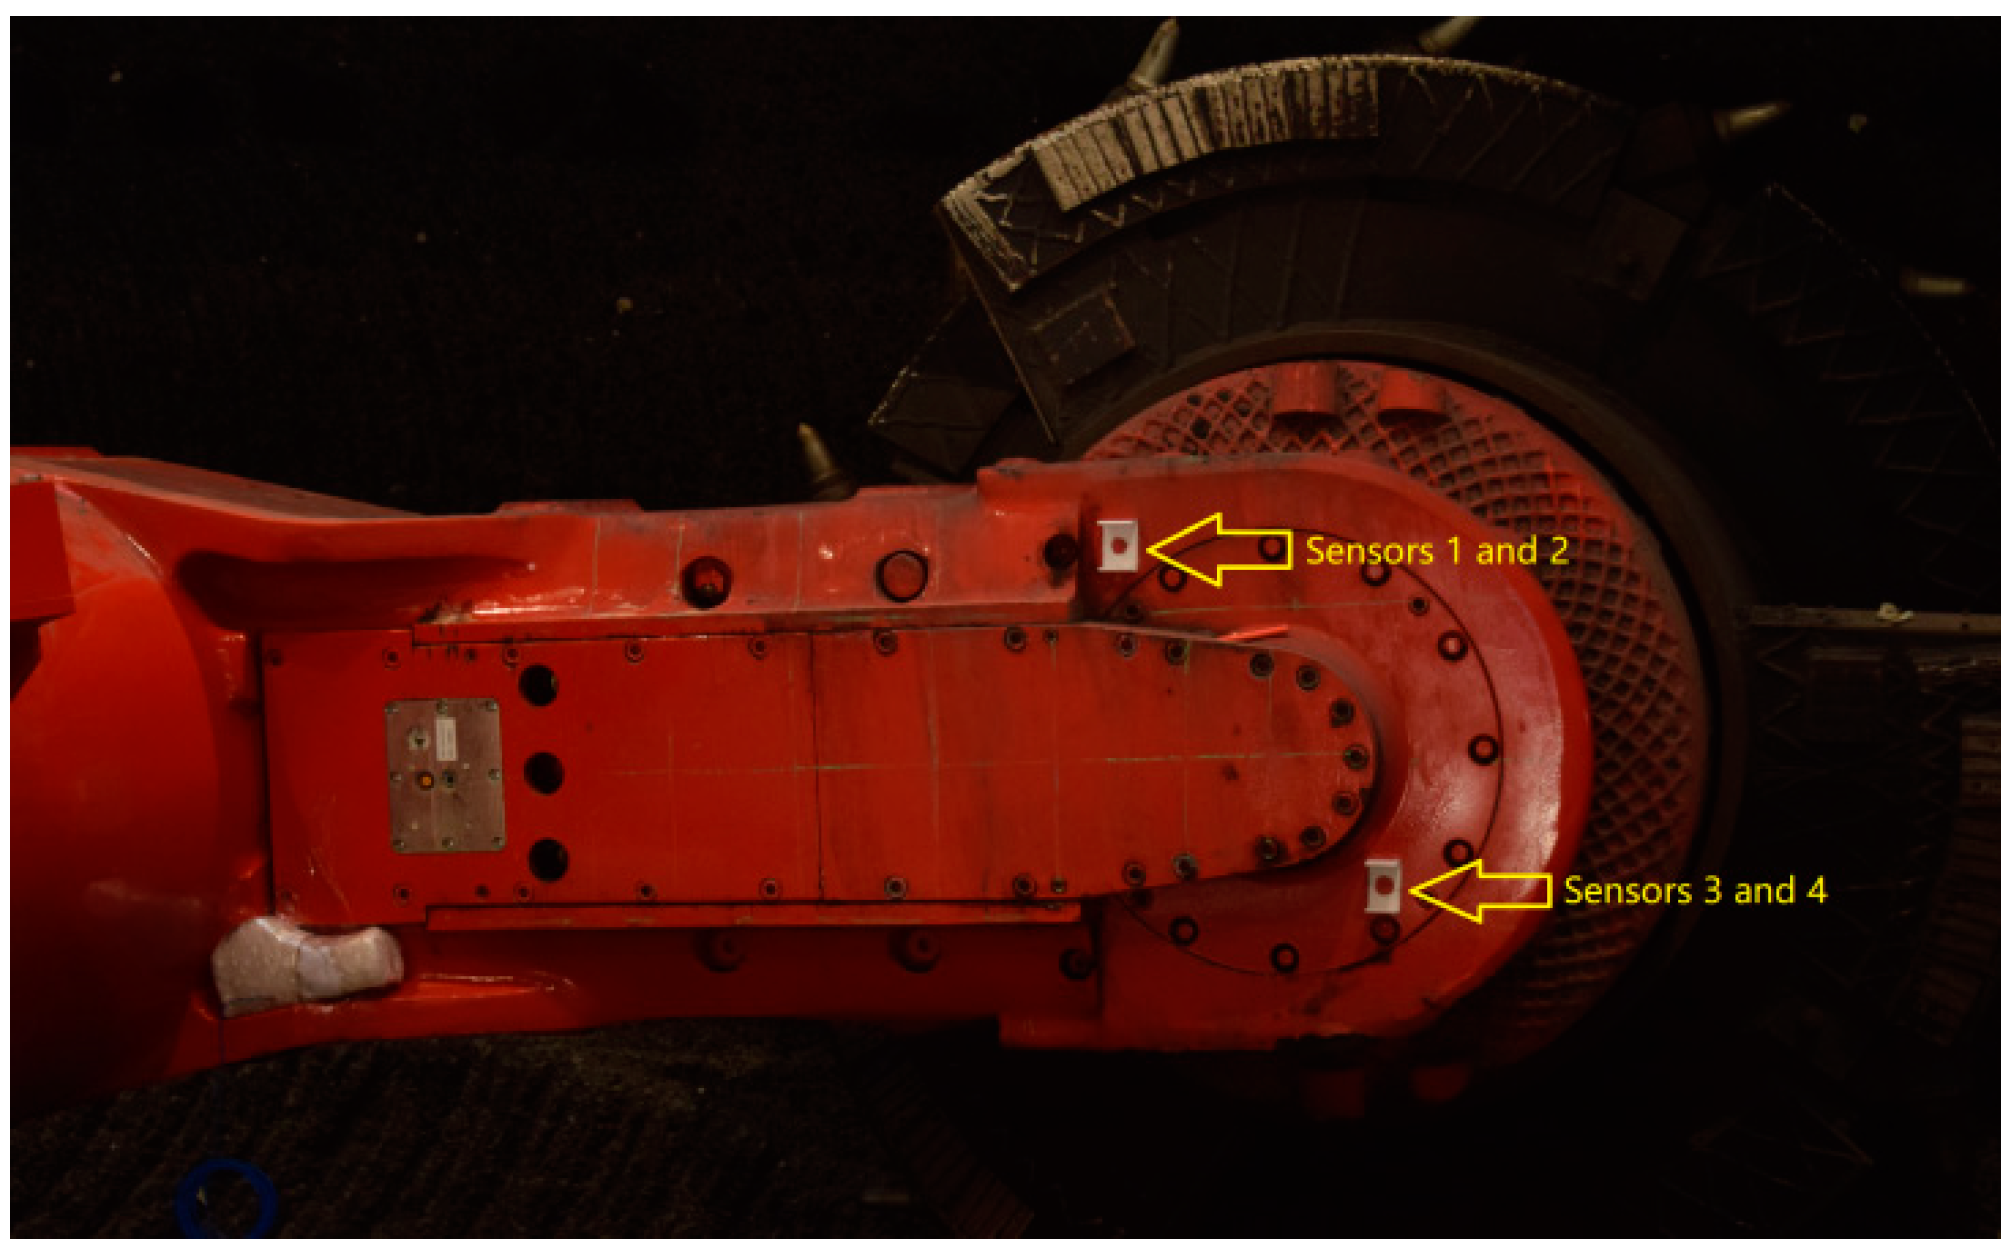
Figure 4.
Time waveforms of measured vibration signals of the four sensors.
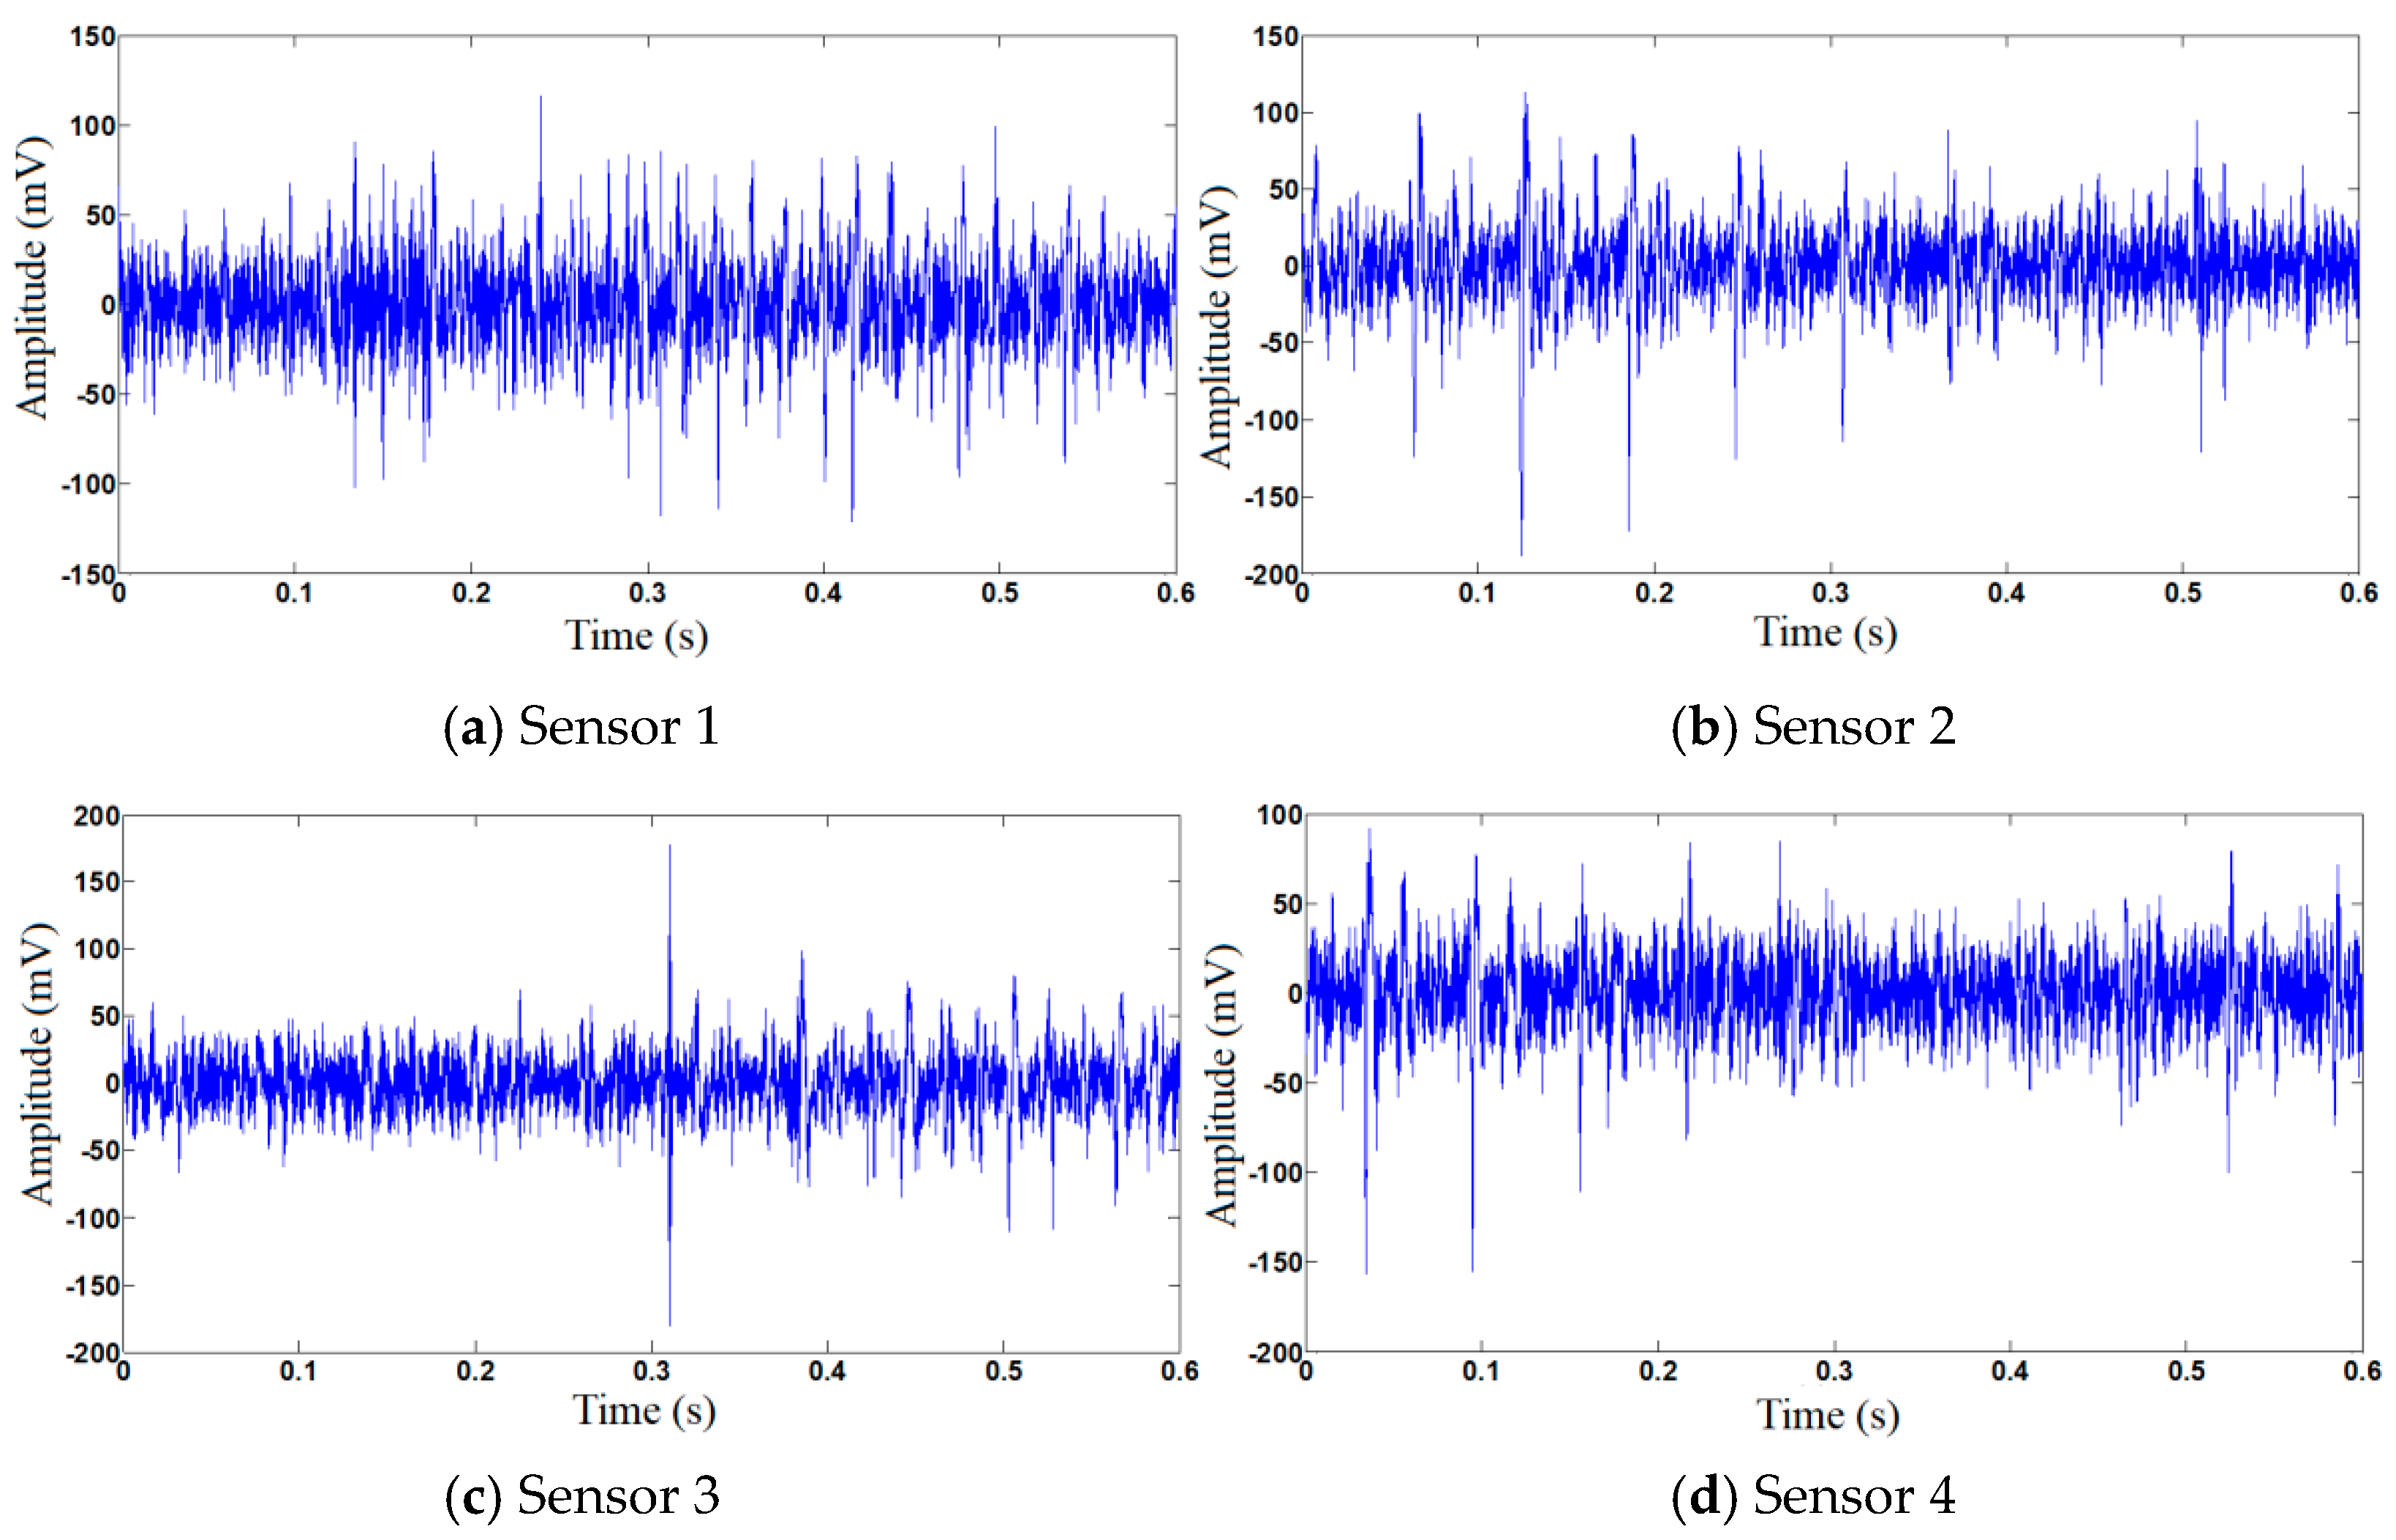
Figure 5.
Time waveforms of measured vibration signals after wavelet de-noising.
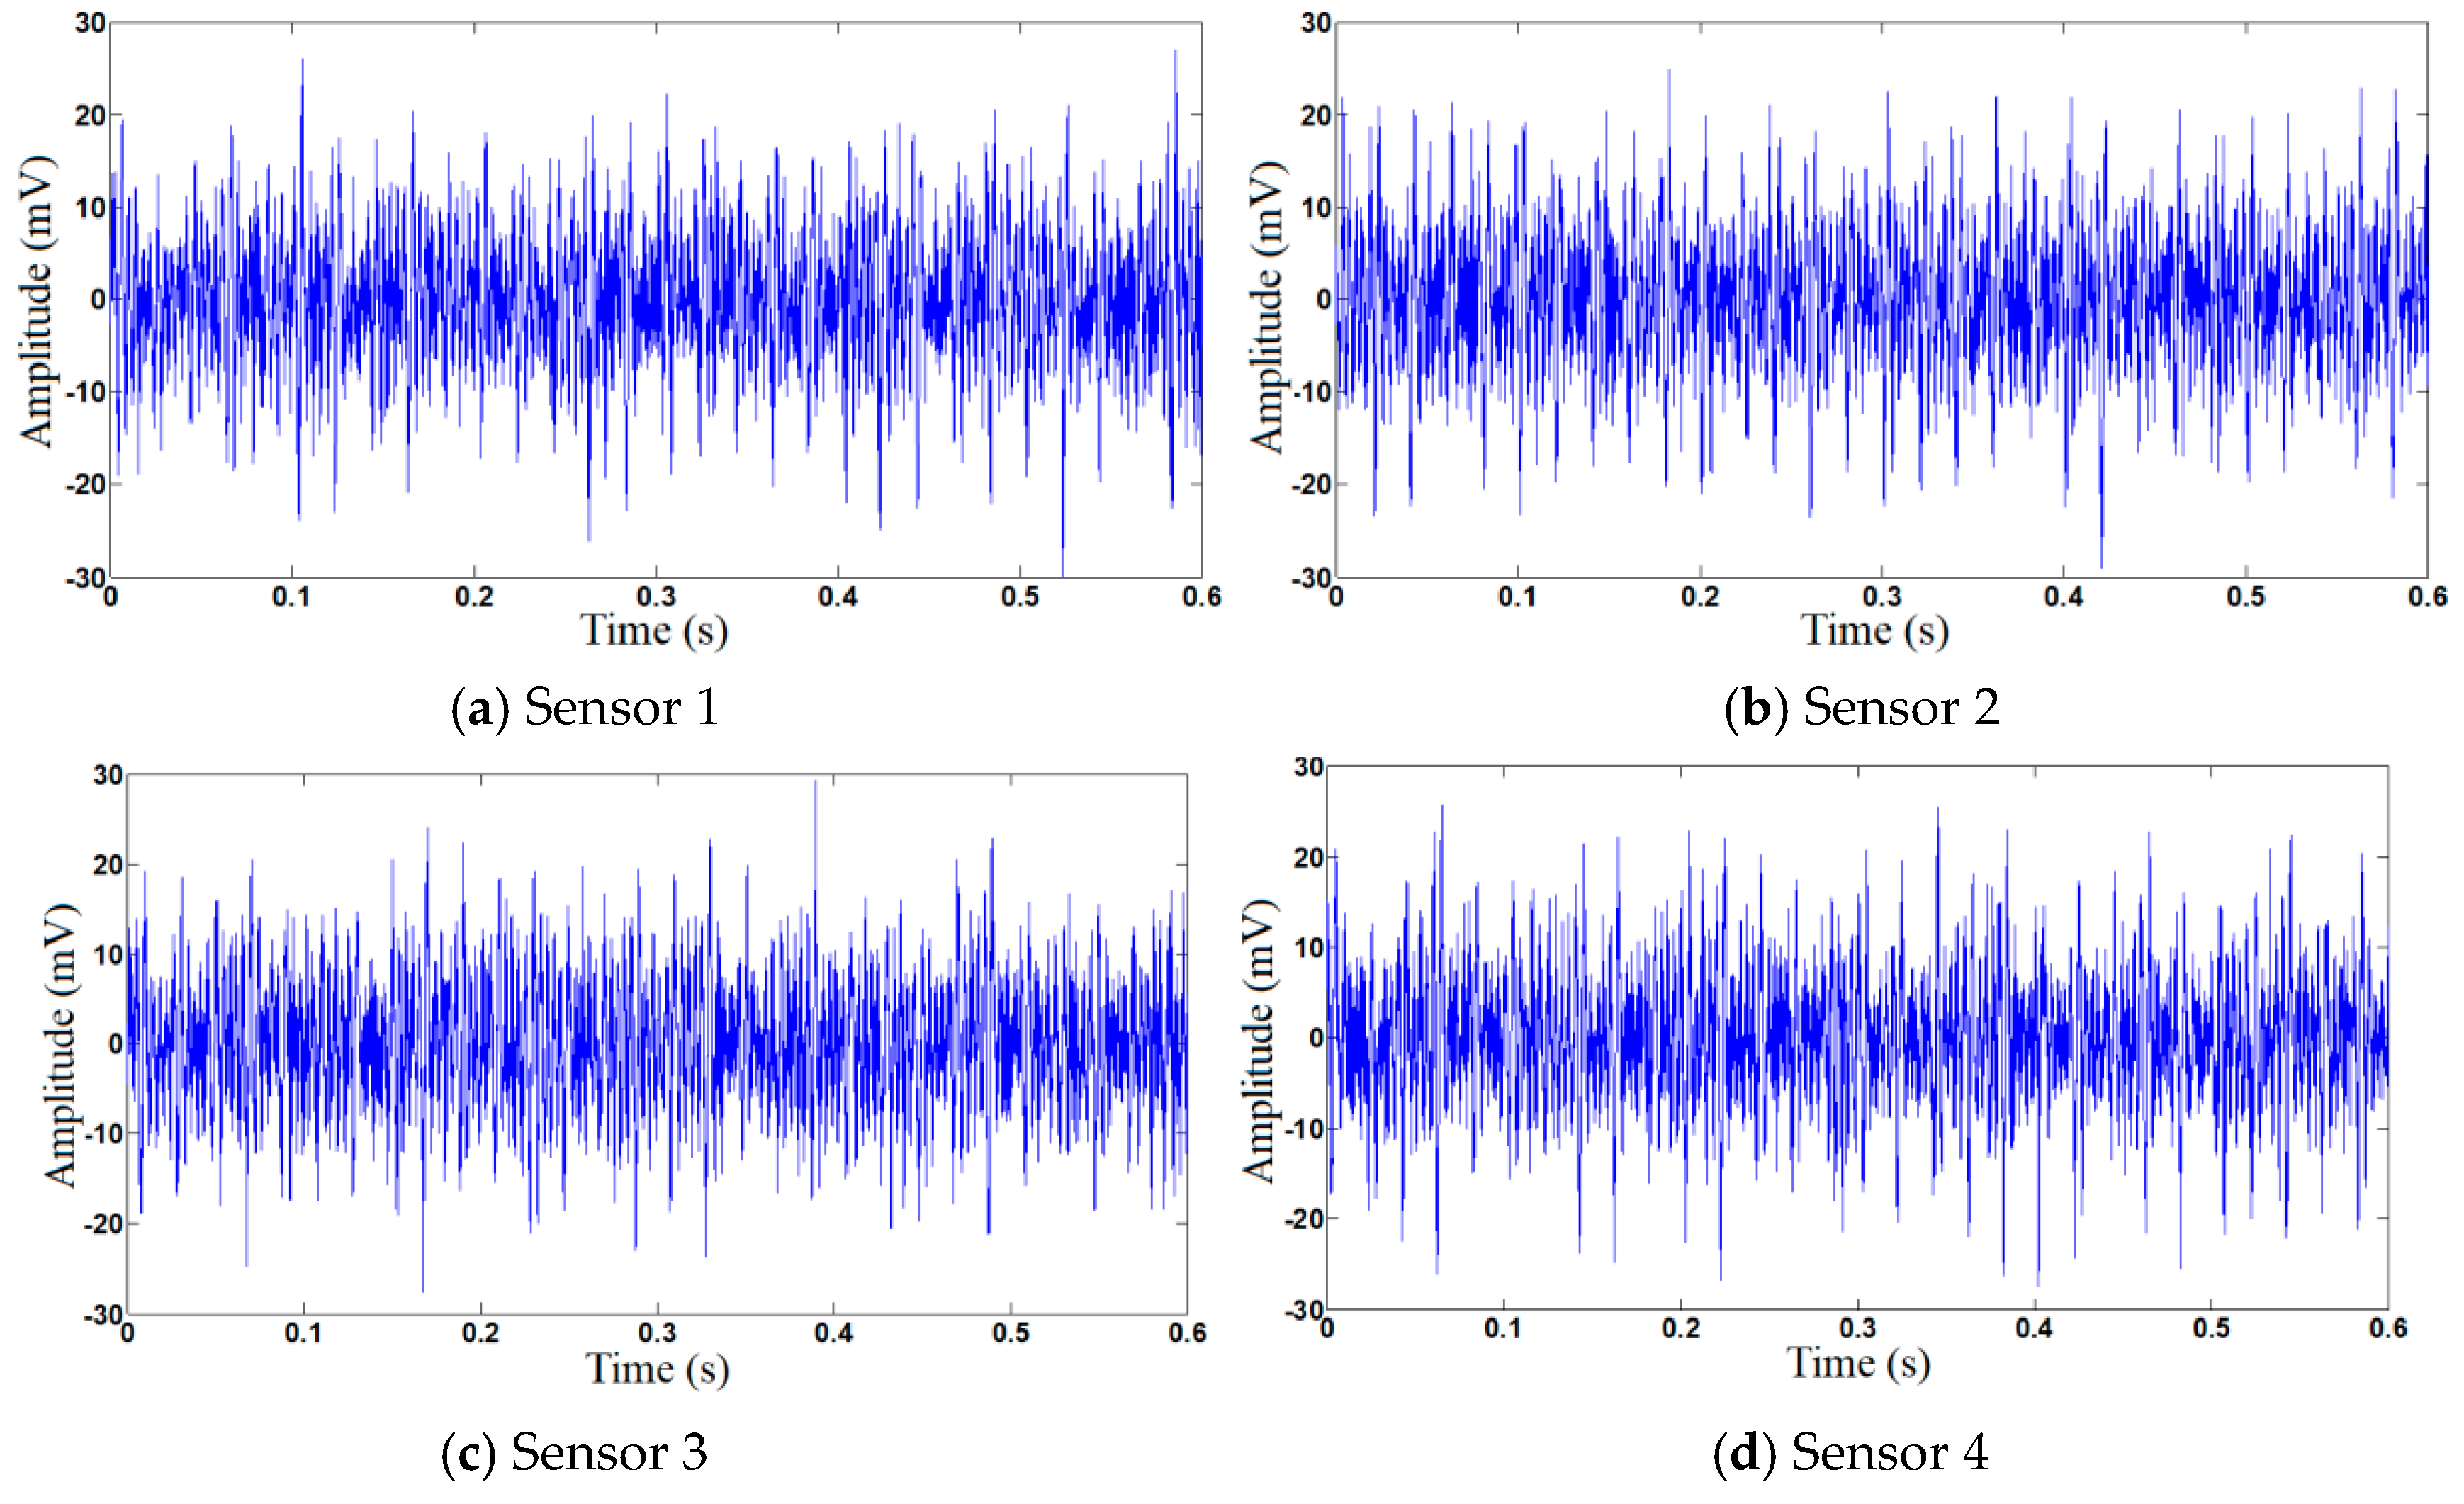
Figure 6.
Spectra of measured vibration signal of Sensor 3.

Figure 7.
Two independent sources separated by nonlinear ICA with spalling gear #1 and worn gear #2.
Figure 7.
Two independent sources separated by nonlinear ICA with spalling gear #1 and worn gear #2.
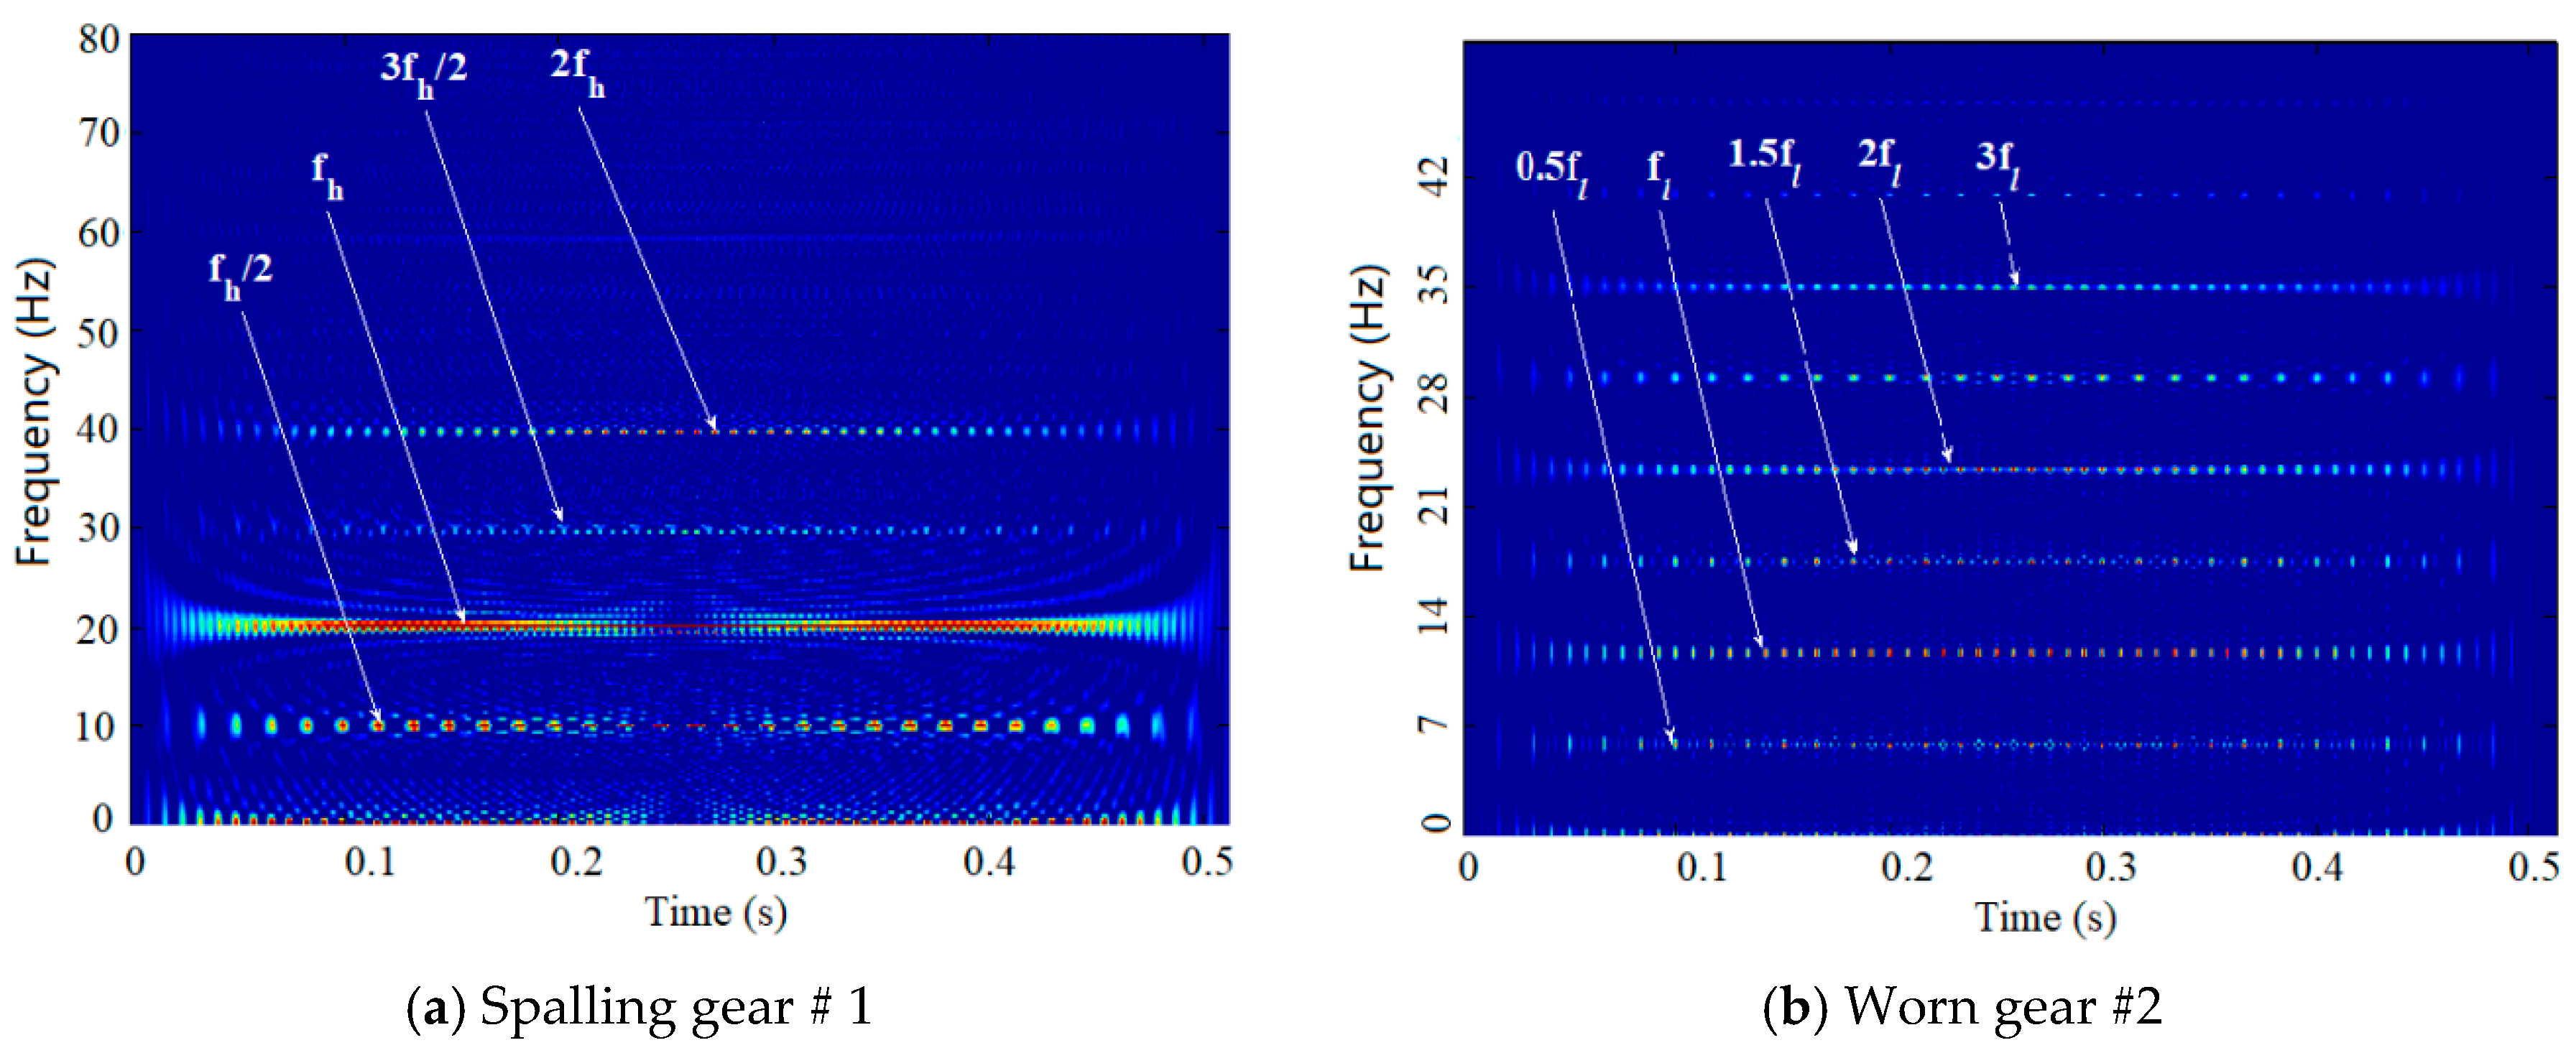
Figure 8.
Two independent sources separated by nonlinear ICA with spalling gear #1 and spalling gear #2.
Figure 8.
Two independent sources separated by nonlinear ICA with spalling gear #1 and spalling gear #2.
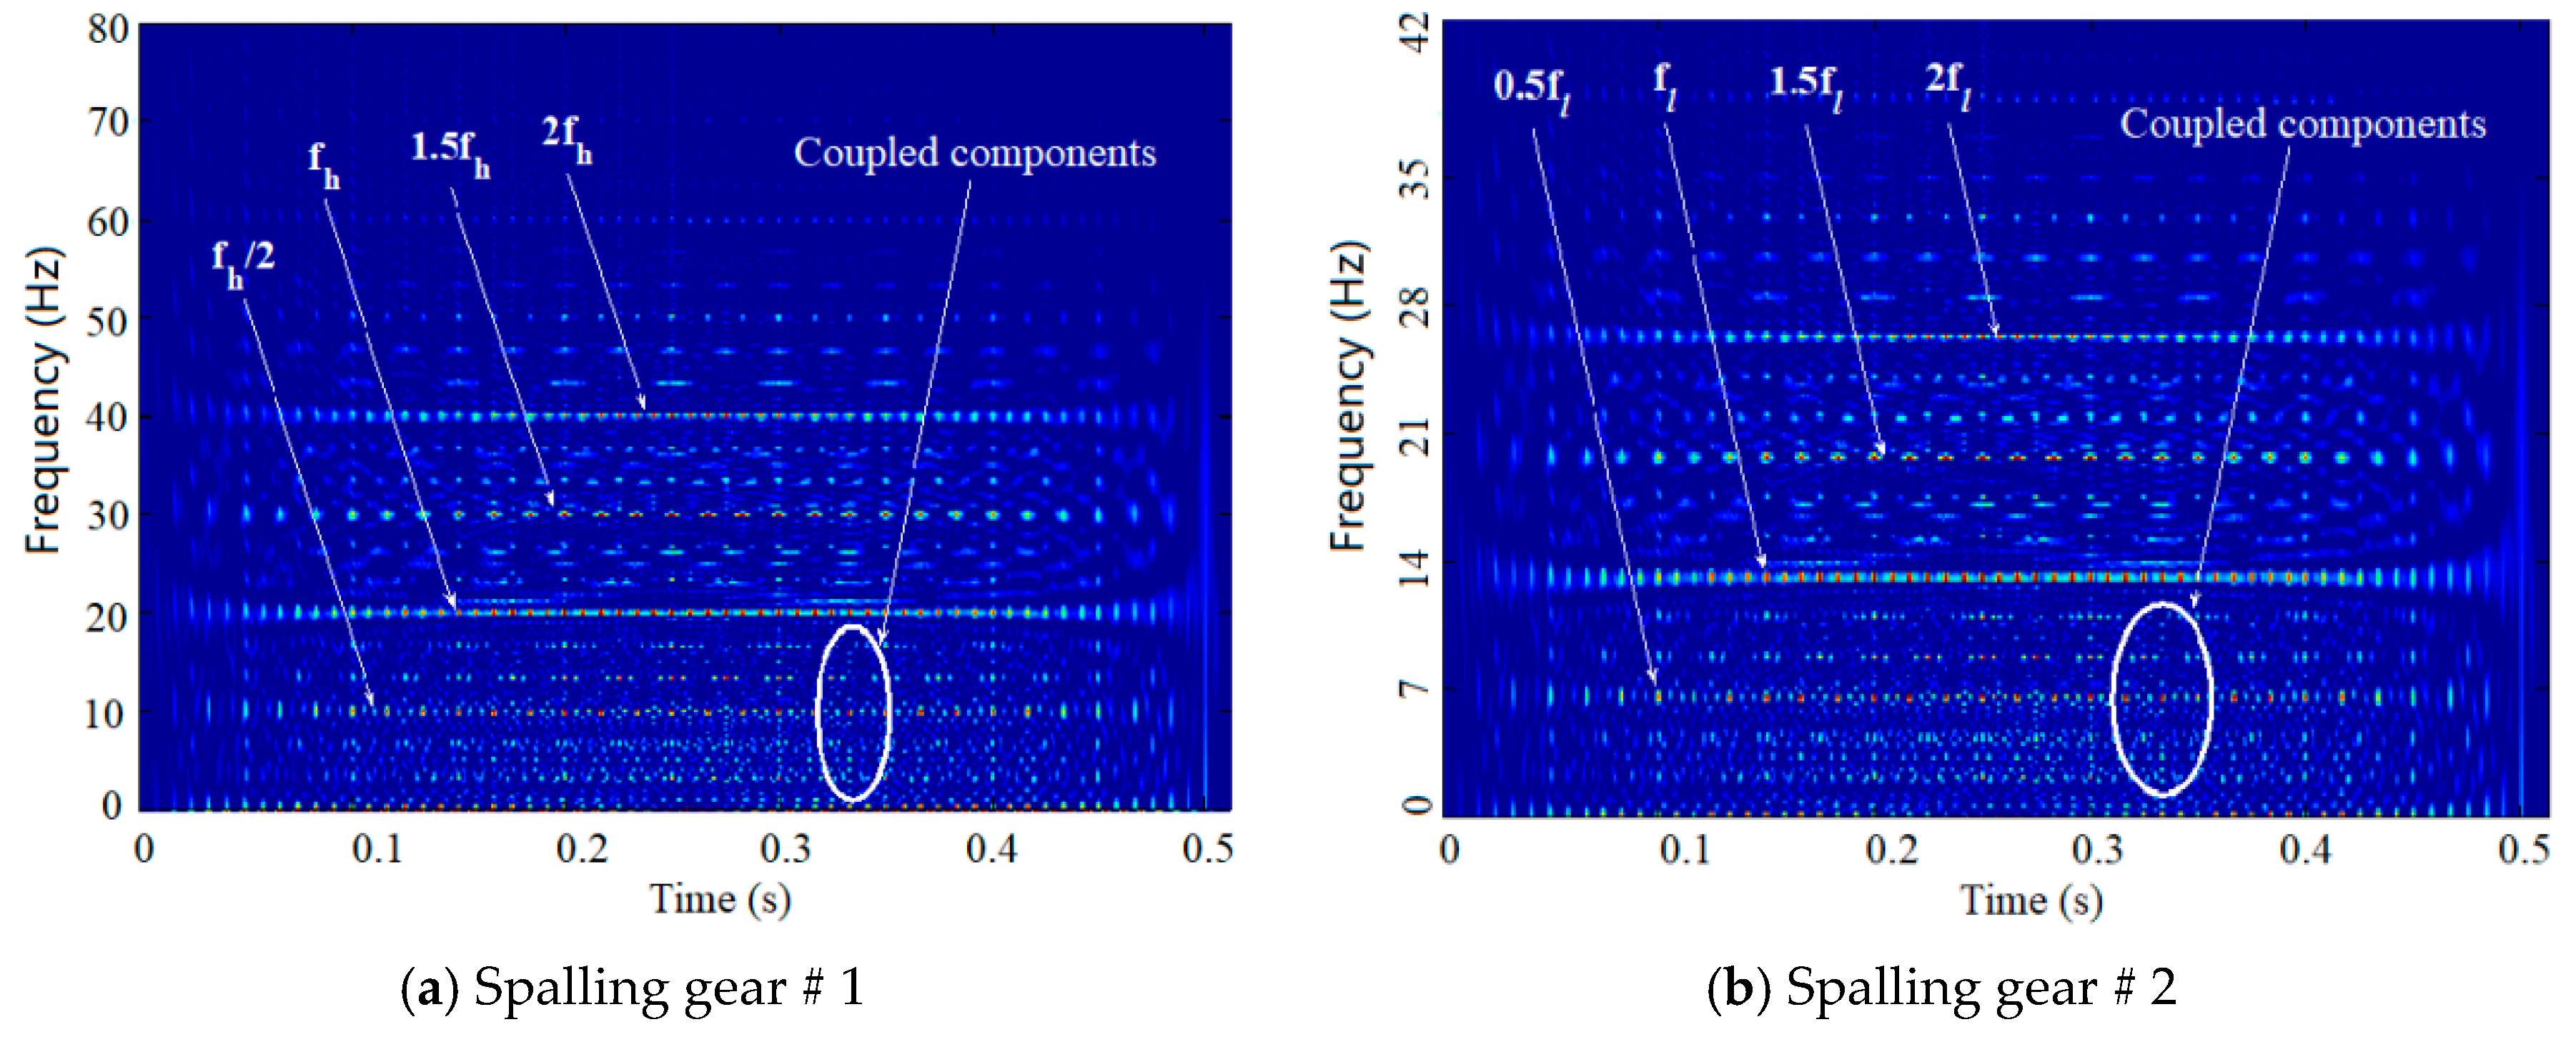
Figure 9.
Two independent sources separated by nonlinear ICA with spalling gear #1 and broken tooth gear #2.
Figure 9.
Two independent sources separated by nonlinear ICA with spalling gear #1 and broken tooth gear #2.

Table 1.
Detailed implementation of the proposed method.
| Step: | Implementation |
|---|---|
| 1. | Training: Establish a fault detection model |
| 1.1 | Measure multi-channel vibration signals of the mining machine |
| 1.2 | Separate the fault vibration source using wavelet-nonlinear ICA |
| 1.3 | Extract fault features based on wavelet package decomposition (WPD) |
| 1.4 | Train a radial basis function neural network (RBFNN) classifier using the features |
| 2. | Testing: Validate the trained model using test datasets |
| 2.1 | Extract fault features using the wavelet-nonlinear ICA and WPD preprocessing |
| 2.2 | Identify the fault patterns via the trained RBFNN |
Table 2.
Diagnostic performance.
| Condition | Method | RBF output | Truth | Result | ||
|---|---|---|---|---|---|---|
| Spalling gear #1 + worn gear #2 | FastICA | 0.4541 | 0.3375 | 0.8183 | [0 0 1] | Correct |
| Wavelet-FastICA | 0.2145 | 0.1536 | 0.9211 | [0 0 1] | Correct | |
| Nonlinear ICA | 0.3125 | 0.3127 | 0.8843 | [0 0 1] | Correct | |
| Wavelet-Nonlinear ICA | 0.0883 | 0.1036 | 0.9765 | [0 0 1] | Correct | |
| Spalling gear #1 + spalling gear #2 | FastICA | 0.7362 | 1.0053 | 0.4381 | [0 1 0] | Incorrect |
| Wavelet-FastICA | 0.4809 | 1.6476 | 0.5147 | [0 1 0] | Incorrect | |
| Nonlinear ICA | 0.4809 | 0.5033 | 1.6476 | [0 1 0] | Incorrect | |
| Wavelet-Nonlinear ICA | 0.3842 | 1.1481 | 0.4238 | [0 1 0] | Correct | |
| Spalling gear #1 + broken gear #2 | FastICA | 0.7862 | 0.1154 | 0.7124 | [1 0 0] | Incorrect |
| Wavelet-FastICA | 1.4429 | 0.4154 | 0.4124 | [1 0 0] | Incorrect | |
| Nonlinear ICA | 1.3009 | 0.4342 | 0.4752 | [1 0 0] | Correct | |
| Wavelet-Nonlinear ICA | 1.2135 | 0.1399 | 0.3654 | [1 0 0] | Correct | |
Table 3.
Comparison of diagnostic performance of different diagnosis methods.
| Wavelet-Nonlinear ICA | Nonlinear ICA | Wavelet-FastICA | FastICA | ||||
|---|---|---|---|---|---|---|---|
| Correctness | Misdiagnosis | Correctness | Misdiagnosis | Correctness | Misdiagnosis | Correctness | Misdiagnosis |
| 93.3% | 2.7% | 87.8% | 4.3% | 88.9% | 3.7% | 82.2% | 6.7% |
Table 4.
Comparison of different mother wavelets.
| Mother Wavelet | Correctness |
|---|---|
| db10 | 93.3% |
| db17 | 91.1% |
| sym5 | 91.1% |
| Sym7 | 93.3% |
| haar | 88.9% |
| bior3.3 | 91.1% |
© 2019 by the authors. Licensee MDPI, Basel, Switzerland. This article is an open access article distributed under the terms and conditions of the Creative Commons Attribution (CC BY) license (http://creativecommons.org/licenses/by/4.0/).
Share and Cite
MDPI and ACS Style
Ding, H.; Wang, Y.; Yang, Z.; Pfeiffer, O. Nonlinear Blind Source Separation and Fault Feature Extraction Method for Mining Machine Diagnosis. Appl. Sci. 2019, 9, 1852. https://doi.org/10.3390/app9091852
AMA Style
Ding H, Wang Y, Yang Z, Pfeiffer O. Nonlinear Blind Source Separation and Fault Feature Extraction Method for Mining Machine Diagnosis. Applied Sciences. 2019; 9(9):1852. https://doi.org/10.3390/app9091852
Chicago/Turabian StyleDing, Hua, Yiliang Wang, Zhaojian Yang, and Olivia Pfeiffer. 2019. "Nonlinear Blind Source Separation and Fault Feature Extraction Method for Mining Machine Diagnosis" Applied Sciences 9, no. 9: 1852. https://doi.org/10.3390/app9091852
Note that from the first issue of 2016, this journal uses article numbers instead of page numbers. See further details here.