Article

Variation of Zooplankton Mean Volume Backscattering Strength from Moored and Mobile ADCP Instruments for Diel Vertical Migration Observation

1
Graduate School of Marine Technology, PMDSU Batch II, Bogor Agricultural University, Jln. Agatis IPB Dramaga Campus, Bogor 16680, West Java, Indonesia
2
Laboratory of Marine Environment and Resources Sensing, Faculty of Fisheries Sciences, Hokkaido University, 3-1-1, Minato-cho, Hakodate, Hokkaido 041-8611, Japan
3
Department of Marine Science and Technology, Faculty of Fisheries and Marine Sciences, Bogor Agricultural University, Jln. Agatis IPB Dramaga Campus, Bogor 16680, West Java, Indonesia
4
Marine Geological Institute, Ministry of Energy and Mineral Resources Republic of Indonesia, Jl. Dr. Djunjunan No. 236, Bandung 40174, West Java, Indonesia
*
Authors to whom correspondence should be addressed.
Appl. Sci. 2019, 9(9), 1851; https://doi.org/10.3390/app9091851
Submission received: 25 February 2019 / Revised: 24 April 2019 / Accepted: 27 April 2019 / Published: 6 May 2019
(This article belongs to the Special Issue Fishery Acoustics, Applied Sciences and Practical Applications)

Abstract

:
Zooplankton can be detected by using acoustic Doppler current profiler (ADCP) instruments through acquiring the mean volume backscattering strength (MVBS) data. However, the precision of the backscattered signal measured by single ADCP measurement has a limitation in the MVBS variation of zooplankton. The objectives of this study were to analyze the MVBS and vertical velocity from ADCPs at the same time and location for zooplankton’s daily vertical migration (DVM) observation. Measurements were conducted in Lembeh Strait, North Sulawesi, Indonesia. Instruments used included a moored ADCP 750 kHz and a mobile ADCP 307.2 kHz. High MVBS value was found at 11.5–16 m depths and was identified as the sound scattering layer (SSL). The DVM patterns in the SSL displayed significant differences over time and had good relationships with the diurnal cycle. Theoretical target strength (TS) from the scattering models based on a distorted-wave Born approximation (DWBA) was estimated for Oithona sp. and Paracalanus sp.; the two dominant species found in the observed area. However, ΔMVBS and ΔTS proved that the dominant zooplankton species were not the main scatterers. The strong signal in SSL was instead caused by the schools of various zooplankton species.

1. Introduction

Zooplankton is a key component and plays an important role in fisheries as the first level consumer in oceanic food webs [1]. The research on this organism need to be explored more, particularly in tropical areas with additional complexity due to the high biodiversity [2,3,4]. The main problem in zooplankton research, more specifically in observing the behavior of zooplankton’s diel vertical migration is the lack of continuous and comprehensive spatial data [5,6,7,8]. The direct sampling method has various biases which cannot recognize zooplankton vertical migration over time. Vertical migration is a common behavior of zooplankton which is easily affected by environmental conditions [9,10]. One of the methods used to estimate the presence of zooplankton in the ocean is the acoustic technique combined with biological sampling [11,12,13].
Observation of zooplankton in the water column can be done by processing the backscatter value [14,15] and vertical velocity profiles [16] from the acoustic Doppler current profiler (ADCP) instrument. ADCP instruments can observe zooplankton distribution and behavior, although these instruments are not designed explicitly to detect zooplankton, but rather to measure ocean currents. This instrument is an exciting option because it can simultaneously measure all parameters of currents speed and direction with backscatter amplitude [17].
However, from the previous research, although the observation was simultaneous, it was reported that the precision of the backscattered signal measured by ADCP has a limitation in measuring and detecting different types of scatterers, for example, bubbles, zooplankton, and suspended sediments which individually and differentially affect the acoustic backscatter signal [18,19,20]. On the other hand, the use of single frequency acoustic in ADCP, in particular, is hardly able to discriminate the scatterers [21] and difficult to use to observe the zooplankton presence [9,22]. The objectives of this study were to analyze the mean volume backscattering strength (MVBS) and vertical velocity obtained from ADCPs, by combining moored and mobile acquisition methods with different frequency at the same time and location for zooplankton’s daily vertical migration (DVM) observation.

2. Materials and Methods

2.1. Time and Location

Field data collection of acoustic and biological samples was conducted in Lembeh Strait, North Sulawesi, Indonesia, in April 2016. Lembeh Strait is a narrow strait separating the northeast coast of Sulawesi and Lembeh Island, with a length of 15 km, a width of 2 km, and a depth of less than 60 m at its deepest point. The average depth of the observed area was 20 m. Figure 1 shows the sampling point and the transect line for data acquisition.
The moored ADCP instrument was placed at coordinate 01°27′53.3412″ N–125°14′05.5644″ E, deployed on 3 April 2016, and finished on 28 April 2016. Mobile ADCP data acquisition was designed with a predefined cross section passing through moored ADCP, from the coast to Sulawesi Island moving towards the coast of Lembeh Island on 7, 13, 18, 22 April 2016 at daylight (11:30 to 15:30 UTC +8, hereafter all time was indicated UTC +8), twilight (15:30 to 18:30), and night (18:30 to 21:30). Biological samples were taken near the deployed ADCP on 5, 7, 13, 18, 22, and 25 April 2016 at around 16:00 to 19:00. CTD observations were performed every day during the daylight and night time on 1–31 April 2016 to obtain oceanographic and environmental information. Data processing and analysis were conducted in the Laboratory of Marine Environment and Resources Sensing, Faculty of Fisheries Sciences, Hokkaido University, Japan in September 2018–February 2019.

2.2. Tools and Materials

The ADCP systems used in this research were a 750 kHz moored ADCP SonTek Argonaut-XR and a 307.2 kHz ship-mounted mobile ADCP Teledyne RDI Workhorse Mariner. The research vessel was equipped with a Differential Global Positioning System (D-GPS) C-Nav and a gyroscope motion sensor to minimize the effect on ship movements. Net sampling for collecting the zooplankton sample was conducted by using a plankton-net (nylon type of net, net’s mouth opening diameter width 31.5 cm, net length 120 cm, mesh size 25 μm) at an 18 m depth and pulled by hand. The ADCPs were operated and configured as shown in Table 1.

2.3. Data Collection Procedure

2.3.1. CTD Observation and Net Sampling

Temperature and salinity were measured by CTD while pH was measured by Horiba U-50. Temperature, salinity, and pH of seawater were required for calculating sound speed [23] and absorption coefficient [24]. Each parameter was averaged over each bin to get a profile at day and night. The zooplankton samples were taken from a six-day sampling near the moored ADCP area using a plankton-net vertically from the bottom to the surface and then were preserved with 1% Lugol solution. Sedgewick-Rafter Counting Cell was used for the analysis of species identification, taxa number, and abundance in the laboratory. Zooplankton was identified morphologically and observed using stereomicroscopes [25].

2.3.2. Echo Intensity and Vertical Velocity Data Acquisition

Echo intensity value and vertical velocity profiles were obtained from ADCP data acquisition. ADCP instruments record acoustic backscatter signal as echo intensity on count scale [26]. The echo intensity was processed and converted to mean volume backscattering strength (MVBS) based on the sonar equation [18,19]. MVBS values in units of dB re 1 m−1. A single ping in one ensemble recorded the echo intensity simultaneously with the velocity profile. The sampling point was designated after an initial dive survey. Additionally, the initial survey found that the observed area mainly consisted of small size zooplankton. Therefore, this research used moored 750 kHz ADCP [26].
Vertical profiling of acoustic backscatter data from moored ADCP was recorded at a 20 m depth. Specific settings on the size of the pulse or the length of pulses emitted by ADCP in the data acquisition process were needed to observe the distribution and phenomenon of zooplankton migration based on the value of the echo intensity. On another acquisition method, mobile ADCP instrument was mounted on the ship at 0.65 m of depth below the water surface, connected with a D-GPS and motion sensor gyroscope for the position, heading, and time recording. The speed of the ship was set at 2 ms−1 (4 knots), and the transect line was 2 km. The maximum detection range, bin size, and sampling intervals for each ADCP acquisition method were configured as shown in Table 1, and the data acquisition was visualized in Figure 2.

2.4. Data Analysis

2.4.1. Mean Volume Backscattering Strength (MVBS) Computation

ADCP instruments have significant advantages in detecting zooplankton because of their wide coverage area of three or four transducers [27]. The consistency of the backscatter value from each transducer was analyzed by using cross-beam calibration [17,20]. Aside from that, the acoustic waves from ADCP instruments still have sound attenuation from the geometrical spreading and sound absorption in the water column. Sound attenuation due to scatterers consists of scattering suspended particles, viscous, chemical, and thermal absorption [28]. By considering these sound attenuations effects, the echo intensity values obtained from the moored and mobile ADCP were processed based on the modified Deines [18] and Mullison [19] equation for ADCP, with the range (R) parameter in the original formula replaced by the slant range (m) as stated in the Lee [22] equation.
The MVBS data from mobile ADCP were extracted and grouped into three categories based on time. Sunset and sunrise times at observed area were extracted from the astronomical database of the Indonesian Meteorological, Climatological, and Geophysical Agency (http://www.bmkg.go.id/). Raw acoustics data in echo intensity units and the vertical velocity profile were extracted using Argonaut Data Post-Processing v3.71 (Xylem, Inc.) for moored ADCP and WinRiver II v2.12 (Teledyne Technologies, Inc.) for mobile ADCP. Extracted echo intensity data, velocity profiles, and numerical modeling were then processed using MATLAB 2016a (Mathwork, Inc.).

2.4.2. MVBS Comparison

Two frequency comparisons were needed to calculate the differences in MVBS values generated from the backscatter of the same object. The process was done in order to distinguish the effect of frequency variability, which eventually can determine the dominant scatterers [29]. The difference in MVBS values for each ADCP instrument is written as:
Δ MVBS = MVBS 750 kHz   MVBS 307.2 kHz ,
where ∆MVBS are the differences of MVBS from each ADCP and are also used as the threshold value for the echo intensity tracing method (dB). This method considers echo intensity from one bin obtained from each moored and mobile ADCP and also analyzes the MVBS value from time series data. The number of the tracers were selected by matching the time, depth, and location of the mobile ADCP to that of the moored ADCP. The echo intensity tracing method contains many successive echoes from the same backscattered signal of the zooplankton. The equation used to match the acoustic data is written as follows [12]:
t c = t d Δ t ,
where the td value is the actual time at the beginning of the mobile ADCP ship moving past the moored ADCP location placed at the depths d, and tc is the end time when the ship crosses the moored ADCP. The variable time difference, Δt, is calculated from the equation:
Δ t = D 2 d 2 v ,
where D is the distance between the GPS antenna on the ship and the transducer (5 m), d is the depth when td time starts, and v is the speed of the ship (ms−1).

2.4.3. Vertical Velocity

As stated before, one of the advantages of using ADCP instruments for zooplankton detection rather than other acoustic devices is that it can measure the speed and direction of the movement of zooplankton’s vertical migration [26]. The ADCP instrument is designed to measure mass water velocity based on the Doppler principle by using an object’s displacement in the water column [26]. Therefore, this instrument is also able to measure the velocity and direction of zooplankton’s diurnal vertical migration. Since we only have time series data from moored ADCP, we cannot use mobile ADCP data due to the lack of continual observation data. Vertical velocity profiles from every single ping of moored ADCP data were used for zooplankton displacement speed [12,30,31]. The vertical velocity determines the descend and ascend speed at the range of time with specified zooplankton movement. Thus, frequency shift (Δf) based on the Doppler principle can be applied to identify zooplankton movements which can be written as follows:
Δ f f 0 = x v c x 2 + H 2 ,
where c is the sound speed propagating through the water column (ms−1), x is the distance between the initial and final location of the zooplankton movement (mm), v is the zooplankton movement speed (mm s−1), and H is the distance between the transducer and object (mm). The mean vertical velocity speed of the sound scattering layer (SSL) is in average vertical current and can be calculated based on the average of Equation (4) for each bin.

2.4.4. Center of the Sound Scattering Layer (SSL)

The center of the SSL was quantitatively measured and defined based on the averaged MVBS and vertical velocity around the detected zooplankton area [32]. For the MVBS echogram, the SSL was determined by the shape and length of the high acoustic scattering in the water column. MVBS contrast between pixels in echogram with high value was compared with the background pixels outside the SSL, which have relatively low value. The threshold of the SSL was set at a low MVBS value (threshold −100 dB was used in this research). The averaged MVBS (dB) for each ensemble was then plotted in the echogram. The average MVBS calculations were done for each ensemble in moored ADCP data. The identification of the center of the SSL was calculated as stated below [32]:
S S L =   { 1 ,          p x > μ 0 ,          p x μ ,
where SSL is a Boolean variable with 1 is for bins that are deemed to belong to an SSL while 0 is for those that are not, px is the specified MVBS value in one bin, µ is the MVBS value threshold (−100 dB). After the SSL range was identified by extracting the bin that scored 1, the background noise outside the range that has a low MVBS value was eliminated. The upper and lower border and the size of the SSL can vary depending on the acoustic backscattering distribution in the SSL. For example, the midnight time may have a different range from the twilight time caused by the migration of zooplankton. The center of the SSL was determined based on the average around the identified SSL range over time. The center of the SSL line has the purpose to gain better insight into the nature of the SSL within the observed area, enabling us to understand the pattern of the daily zooplankton migration over time.
The average vertical velocity was calculated on the SSL by analyzing the vertical velocity each bin that have different contrasts value with other bin. The procedure was identifying the upward and downward movement from the vertical velocity profiles time series, analyzing the highest velocity in some range of depth, and averaging the velocity. The averaged velocity values were then plotted into the vertical velocity profiles over time.

2.5. Distorted wave-Born Approximation (DWBA) Model

Zooplankton tends to aggregate in schools at some layer. Consequently, special consideration for understanding the characteristics of acoustic backscatter must be given to specifying the single object detected from the ADCP instrument. In addition, the orientation angle of zooplankton to incidence acoustic sources from upward and downward looking method affected the TS variation. The scattering model was used to describe the echo returned by the single object to predict the theoretical target strength from dominant species of zooplankton compared to the angle of orientation, since we found various species of zooplankton in this research. On the other hand, each zooplankton species has a specific shape which affected the TS value from a different orientation of the body.
In this study, the distorted wave-Born approximation (DWBA) model was used. This model uses theoretical backscatter by considering the overall shape and length (body length, L) of the detected zooplankton body from the net samples. It was assumed that the zooplankton body shape was a deformed cylinder and was categorized as a weak scatterer. The DWBA model was used because it was related to the detection of zooplankton in the water column by different frequency and acquisition method of ADCP used in this research. This model is valid for all acoustic frequencies, the angle of orientation, and arbitrary shapes of zooplankton [33,34,35]. General mathematical equations for scattering amplitude can be written as follows [36]:
f b s = k 1 2 4 π V ( γ κ γ ρ ) exp i 2 ( k i ) 2 · r p o s   dv ,
where fbs is the complex backscattering amplitude, k1 is the acoustic wave number in the surrounding medium that is related to the equation k = 2π/λ with λ is acoustic wavelength, r0 is position vector, r p o s value is the position in a particular line of the body axis. The material properties of zooplankton body, γρ and γκ were expressed as:
γ ρ   ρ 2 ρ 1 ρ 2 =   g 1 g ,
γ κ   κ 2 κ 1 κ 2 = 1 g h 2 g h 2 ,
where g is density contrast, h is sound speed contrast, and κ is compressibility and can be written as:
κ = ( ρ c 2 ) 1 ,
where ρ is mass density, and c is sound speed. The simplified form of the DWBA model for the deformed cylinder was used [34]. Since the zooplankton species found in this study mainly consisted of very small (<1 mm) copepods with high diversity, the g and h measurement were relatively difficult and did not need to be measured directly [5]. The approximate solution was considered using g and h from other research based on the acoustic properties of the weakly scattering sphere of fluid-like bodies which is true for copepods [37,38]. Density (ρ) and sound speed (c) in the zooplankton body were 1028 kg m−3 and 1480.3 m s−1, respectively, against the surrounding medium 1026.9 kg m−3 and 1477.4 m s−1.

3. Results and Discussion

3.1. Moored ADCP

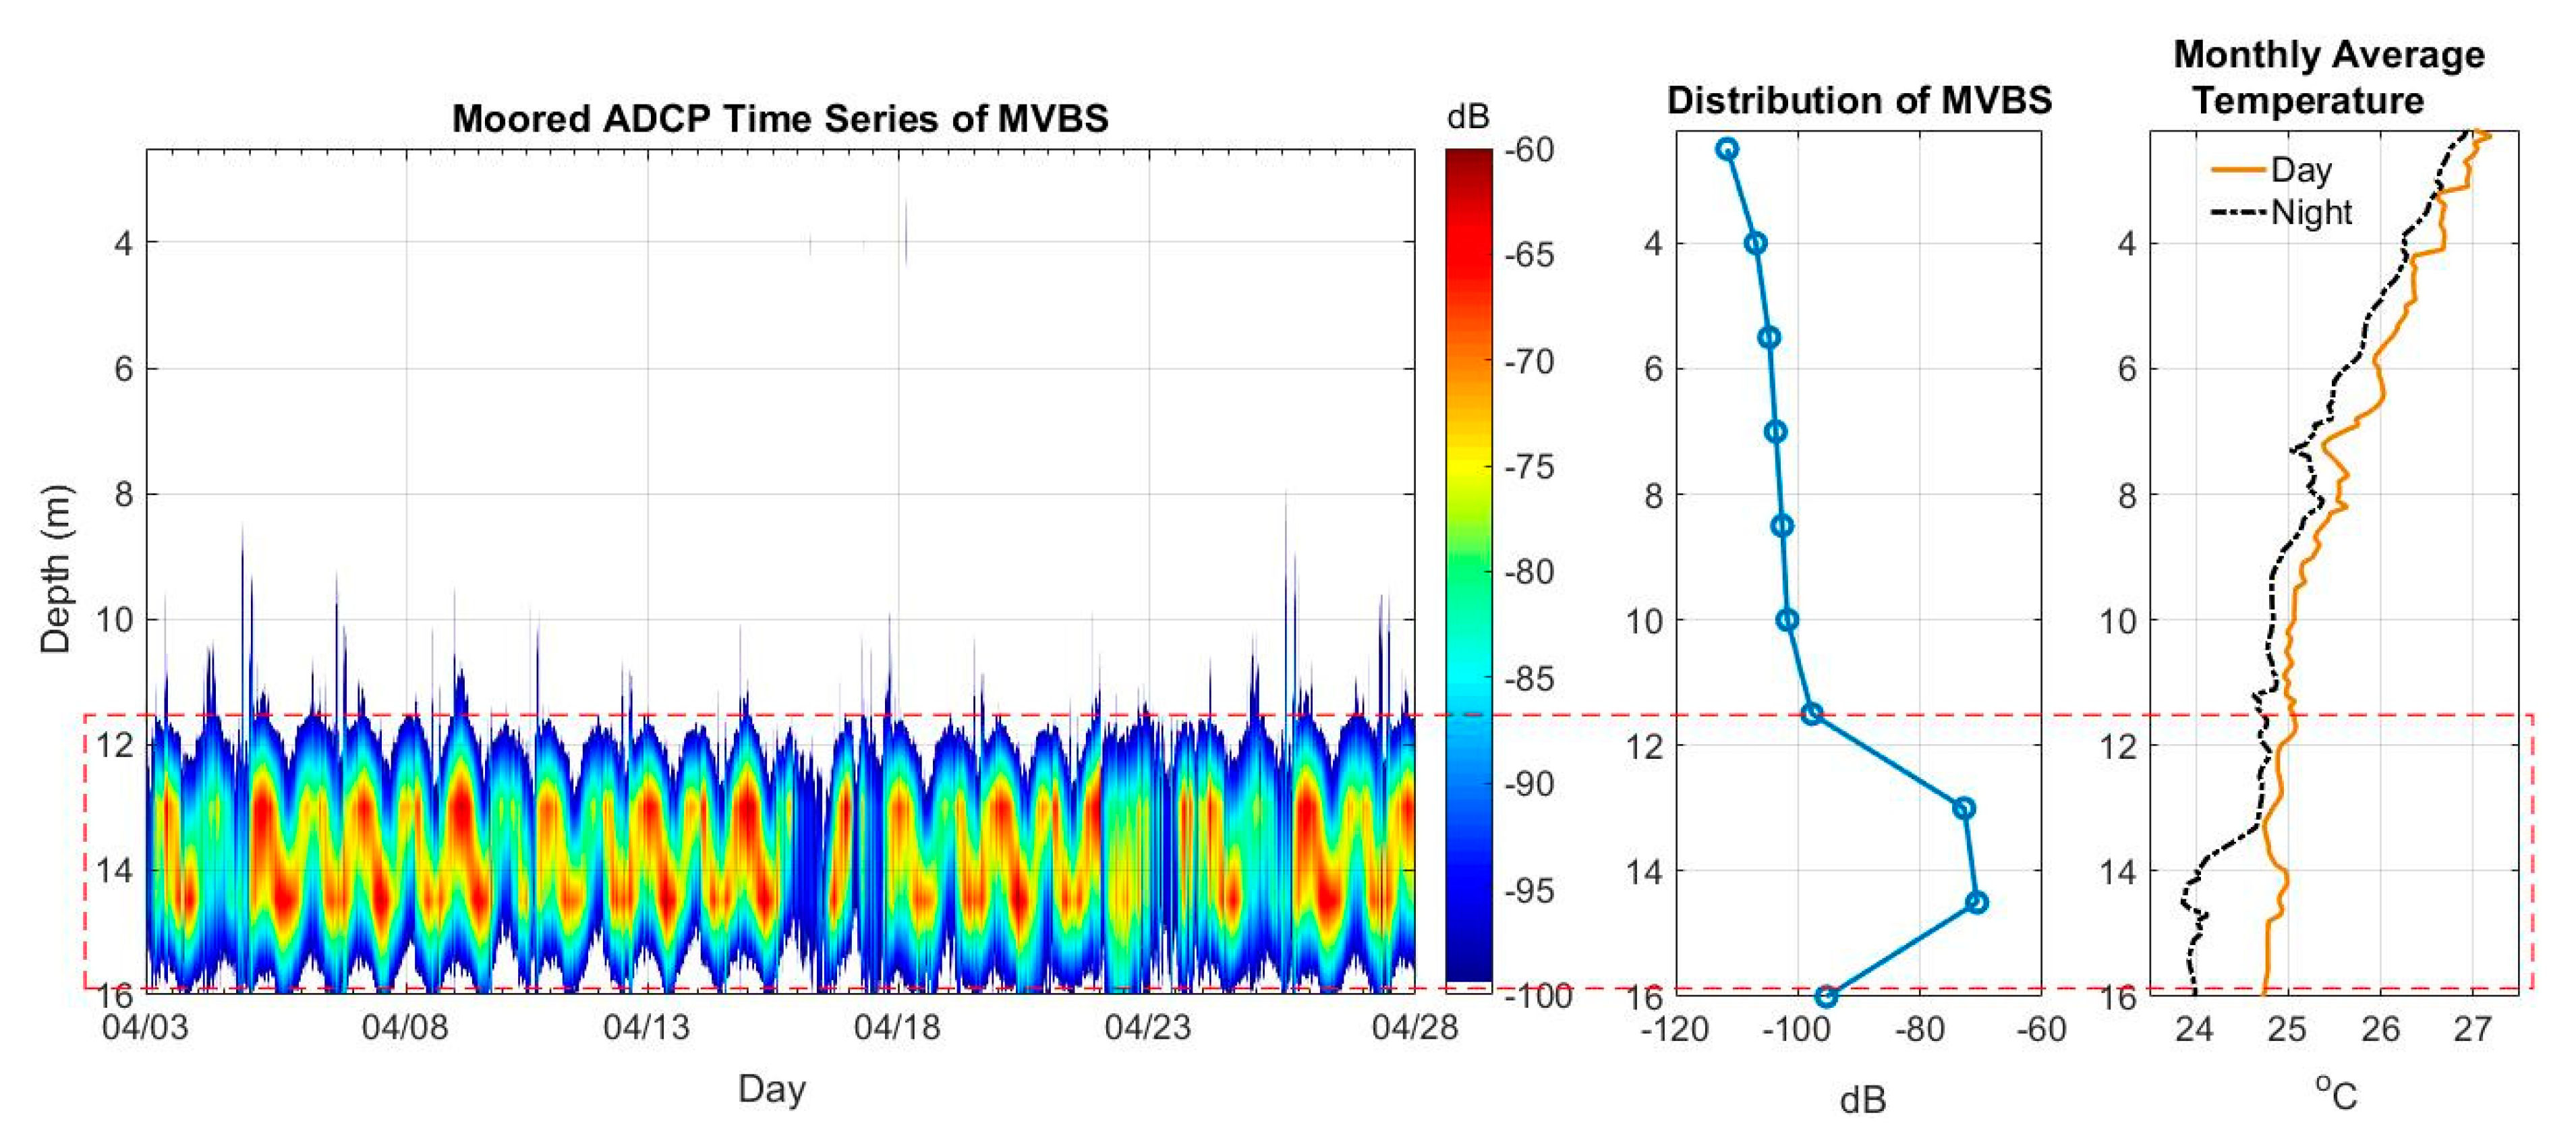
Water temperature in the observed area varied between 24–27 °C during the day and night time, average salinity 33 psu, and average pH 8.03. The water temperature was relatively constant during day and night throughout the observation time [39]. The observation was carried out during the wet season. The results of the MVBS time series, the vertical distribution of MVBS and the monthly average water temperature in the survey area are shown in Figure 3.
The time series MVBS data from the surface to a depth of 11.5 m were filtered because the values were below −100 dB. A high level of MVBS mainly occurred at the near bottom of the observed depth, indicated as the SSL. Near the surface and middle columns layer, the MVBS value was much lower when compared with the near-bottom area. Overall, the MVBS value in the SSL from the time series data ranged between −100 dB to −60 dB. The highest MVBS value was between −95 dB to −70 dB at 12 m to 16 m of depth.
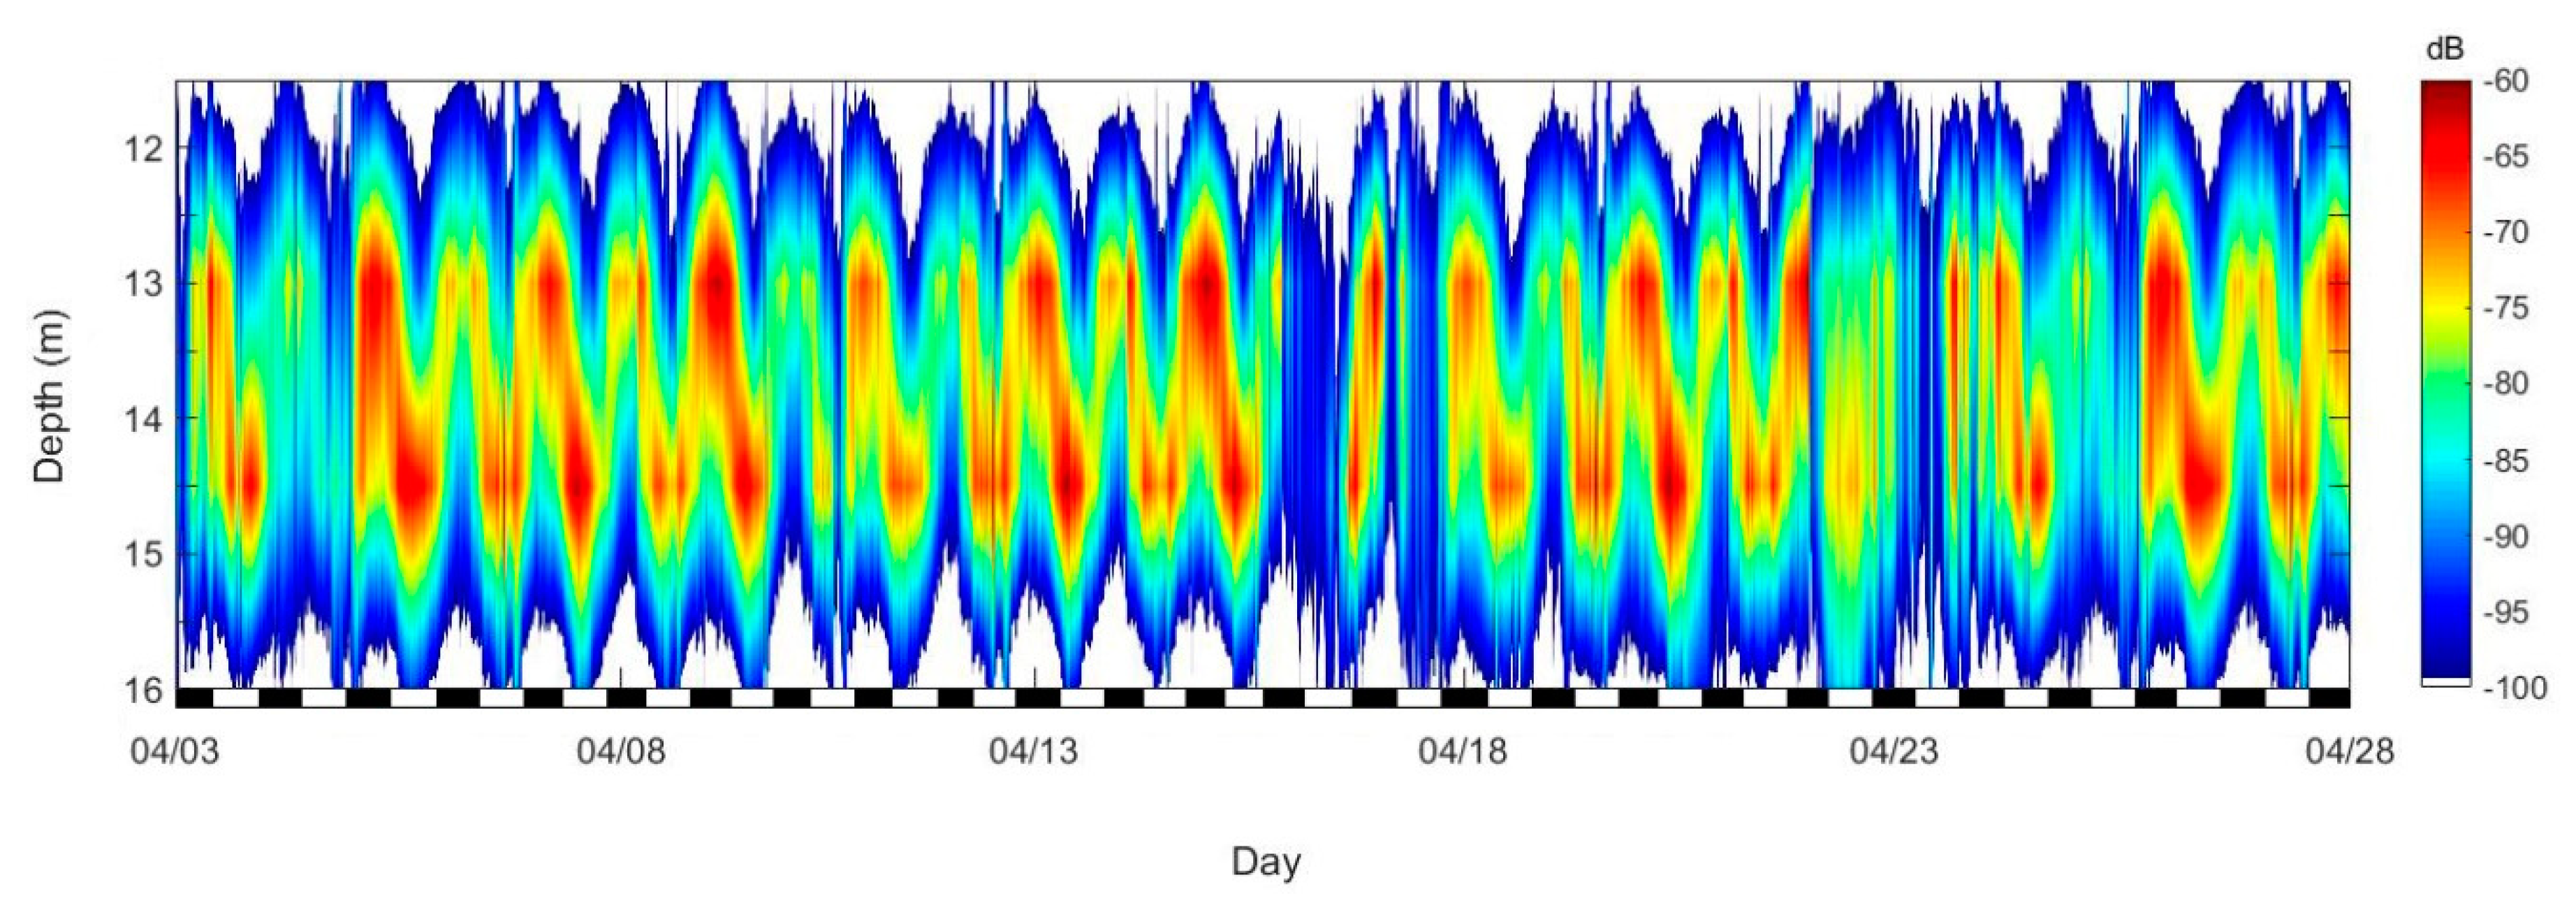
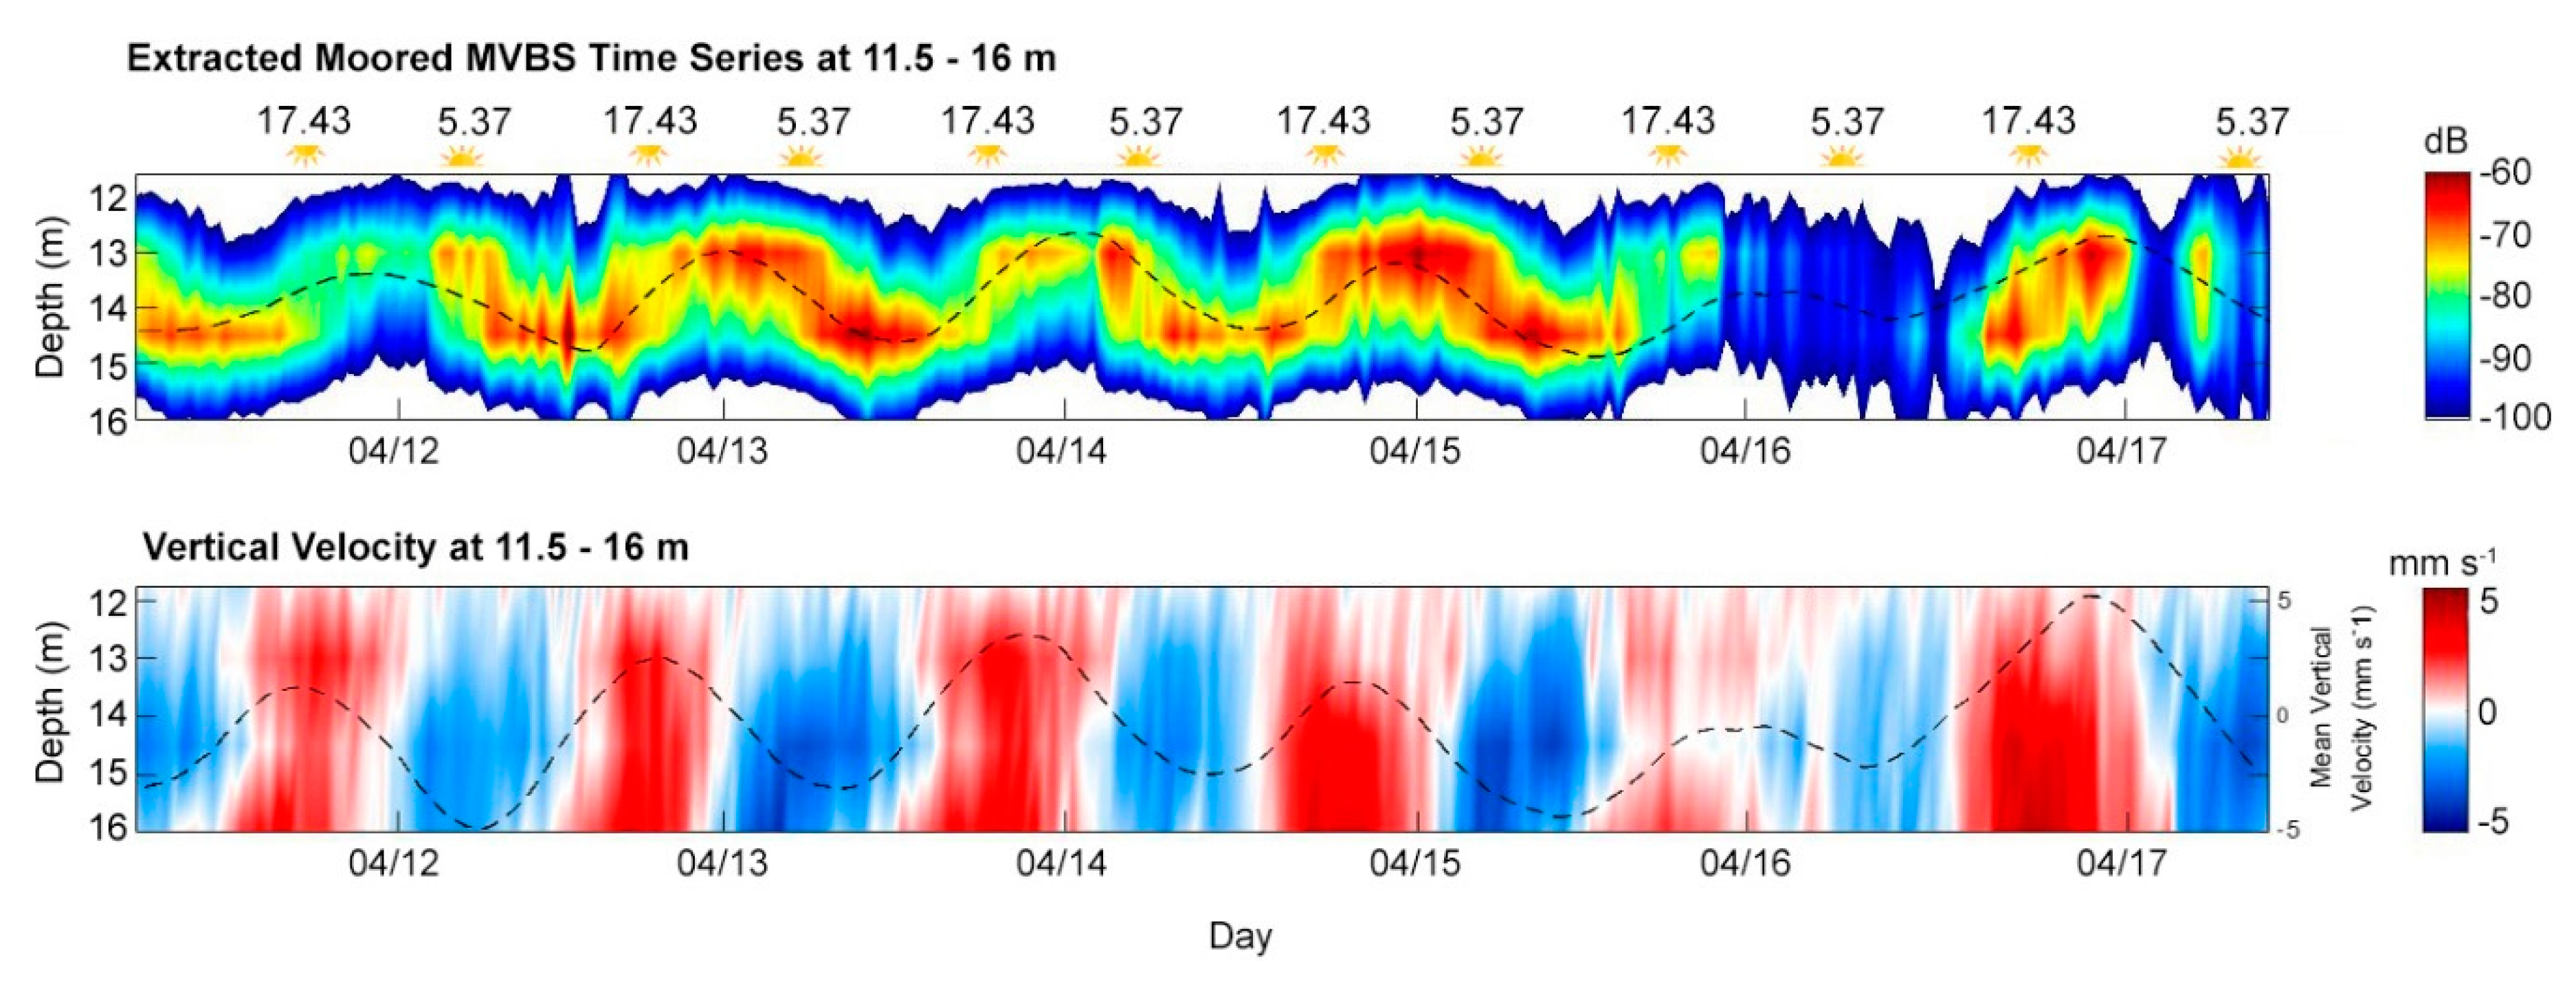
The extracted data ranging from 11.5 to 16 m were indicated as an SSL. The zooplankton behavior based on the MVBS pattern was moved up and down as shown in the MVBS echogram and classified as the diurnal cycle. The echogram indicated that zooplankton migrated upward during the night time in 14–16 m of depth. The more detailed look in Figure 4 with the black and white strips below the echogram represents night (black) and day time (white), allowing the identification and analysis of oscillatory MVBS value from moored ADCP time series data.
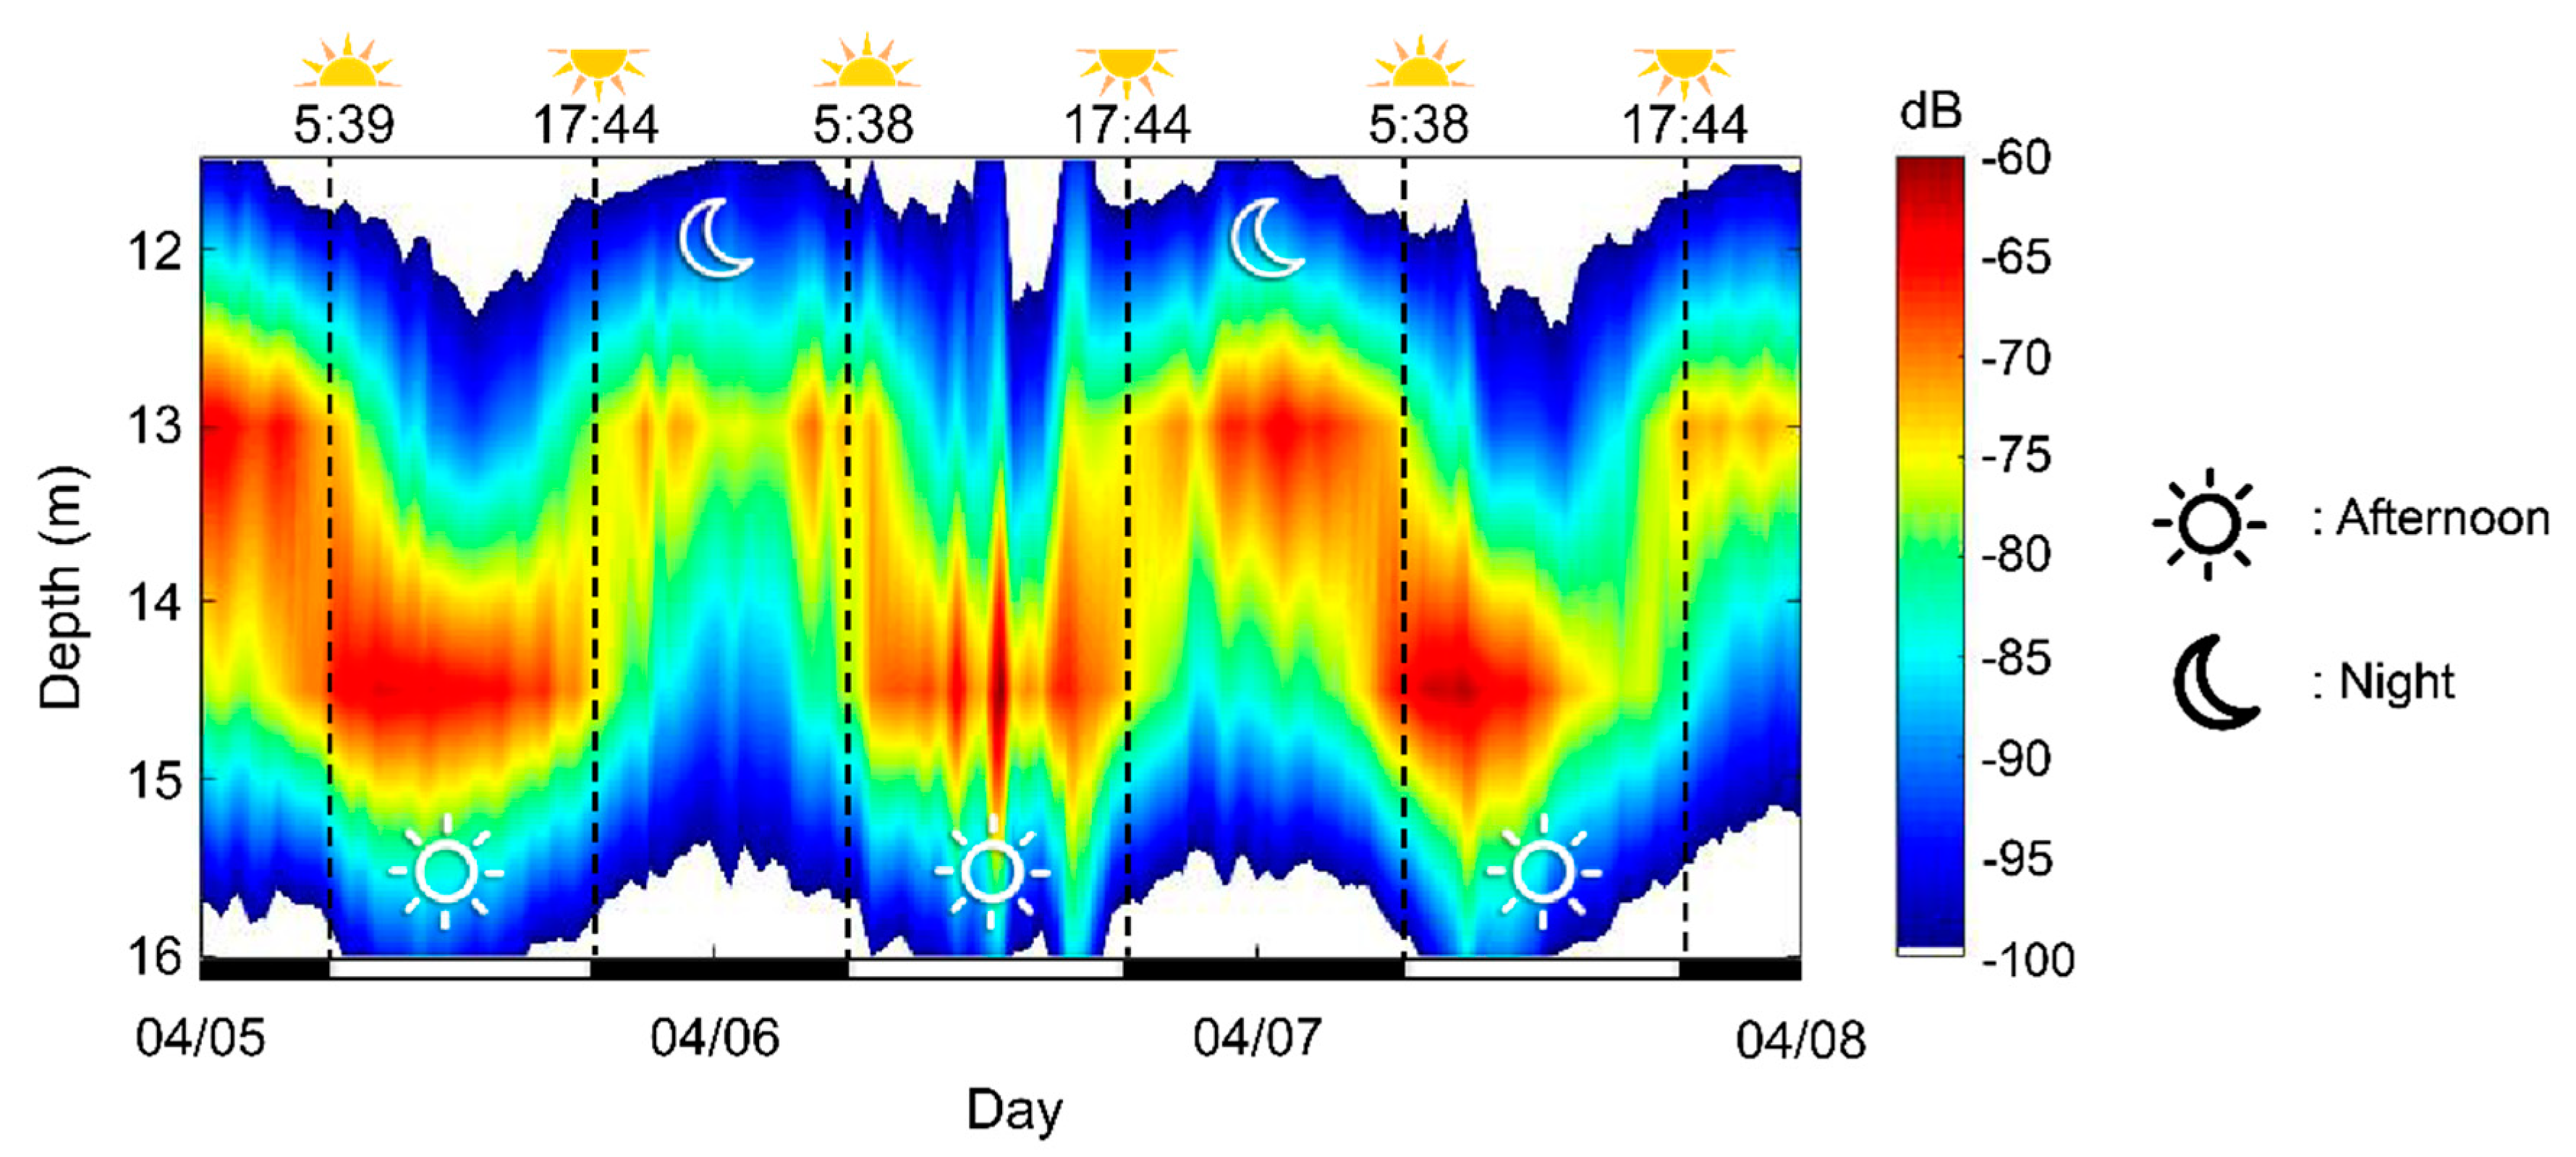
All MVBS data selected for a daily pattern of zooplankton vertical migration were in depths between 11.5 and 16 m. Based on time, there was an increase and decrease in the value of MVBS in the morning and night time. The yellow to red color variation indicates zooplankton vertical migration. The red color represents the larger MVBS value produced by a high density of zooplankton compared to the density that is represented by a blue color. MVBS in the center of the SSL gradually moved down in the daylight and went up at night (Figure 5). On 5, 16, 22, 23 April the MVBS value was slightly lower than other days, ranged from −95 to −85 dB, and it appears that the weak acoustic signal is marked in blue color. This was probably due to zooplankton moving away from the observed area, indicated by MVBS values during that time [40,41,42].
Generally, the zooplankton migrated to the top of the SSL at midnight, as shown in Figure 5. The zooplankton leaving the deeper layer started two hours before sunset, ascended to a shallow depth at night time and settled on the top layer, and moved again to the deeper layer starting at sunrise. The MVBS showed changes around 05:30 and 18:00. In the early morning, the strong MVBS at the 12 m of depth propagated downward to a deeper depth of 15.5 m, while in the twilight time the strong MVBS propagated upward. This pattern, eventually, was general daily vertical migration [43] but in some cases, zooplankton was not moving to the surface area of the water column, due to sunlight penetration to the water column. There was research for light intensity as one of the factors controlling vertical of migration [44,45]. Another study was found that detritus near the seabed might be a possible food source for zooplankton [46].

3.2. Mobile ADCP

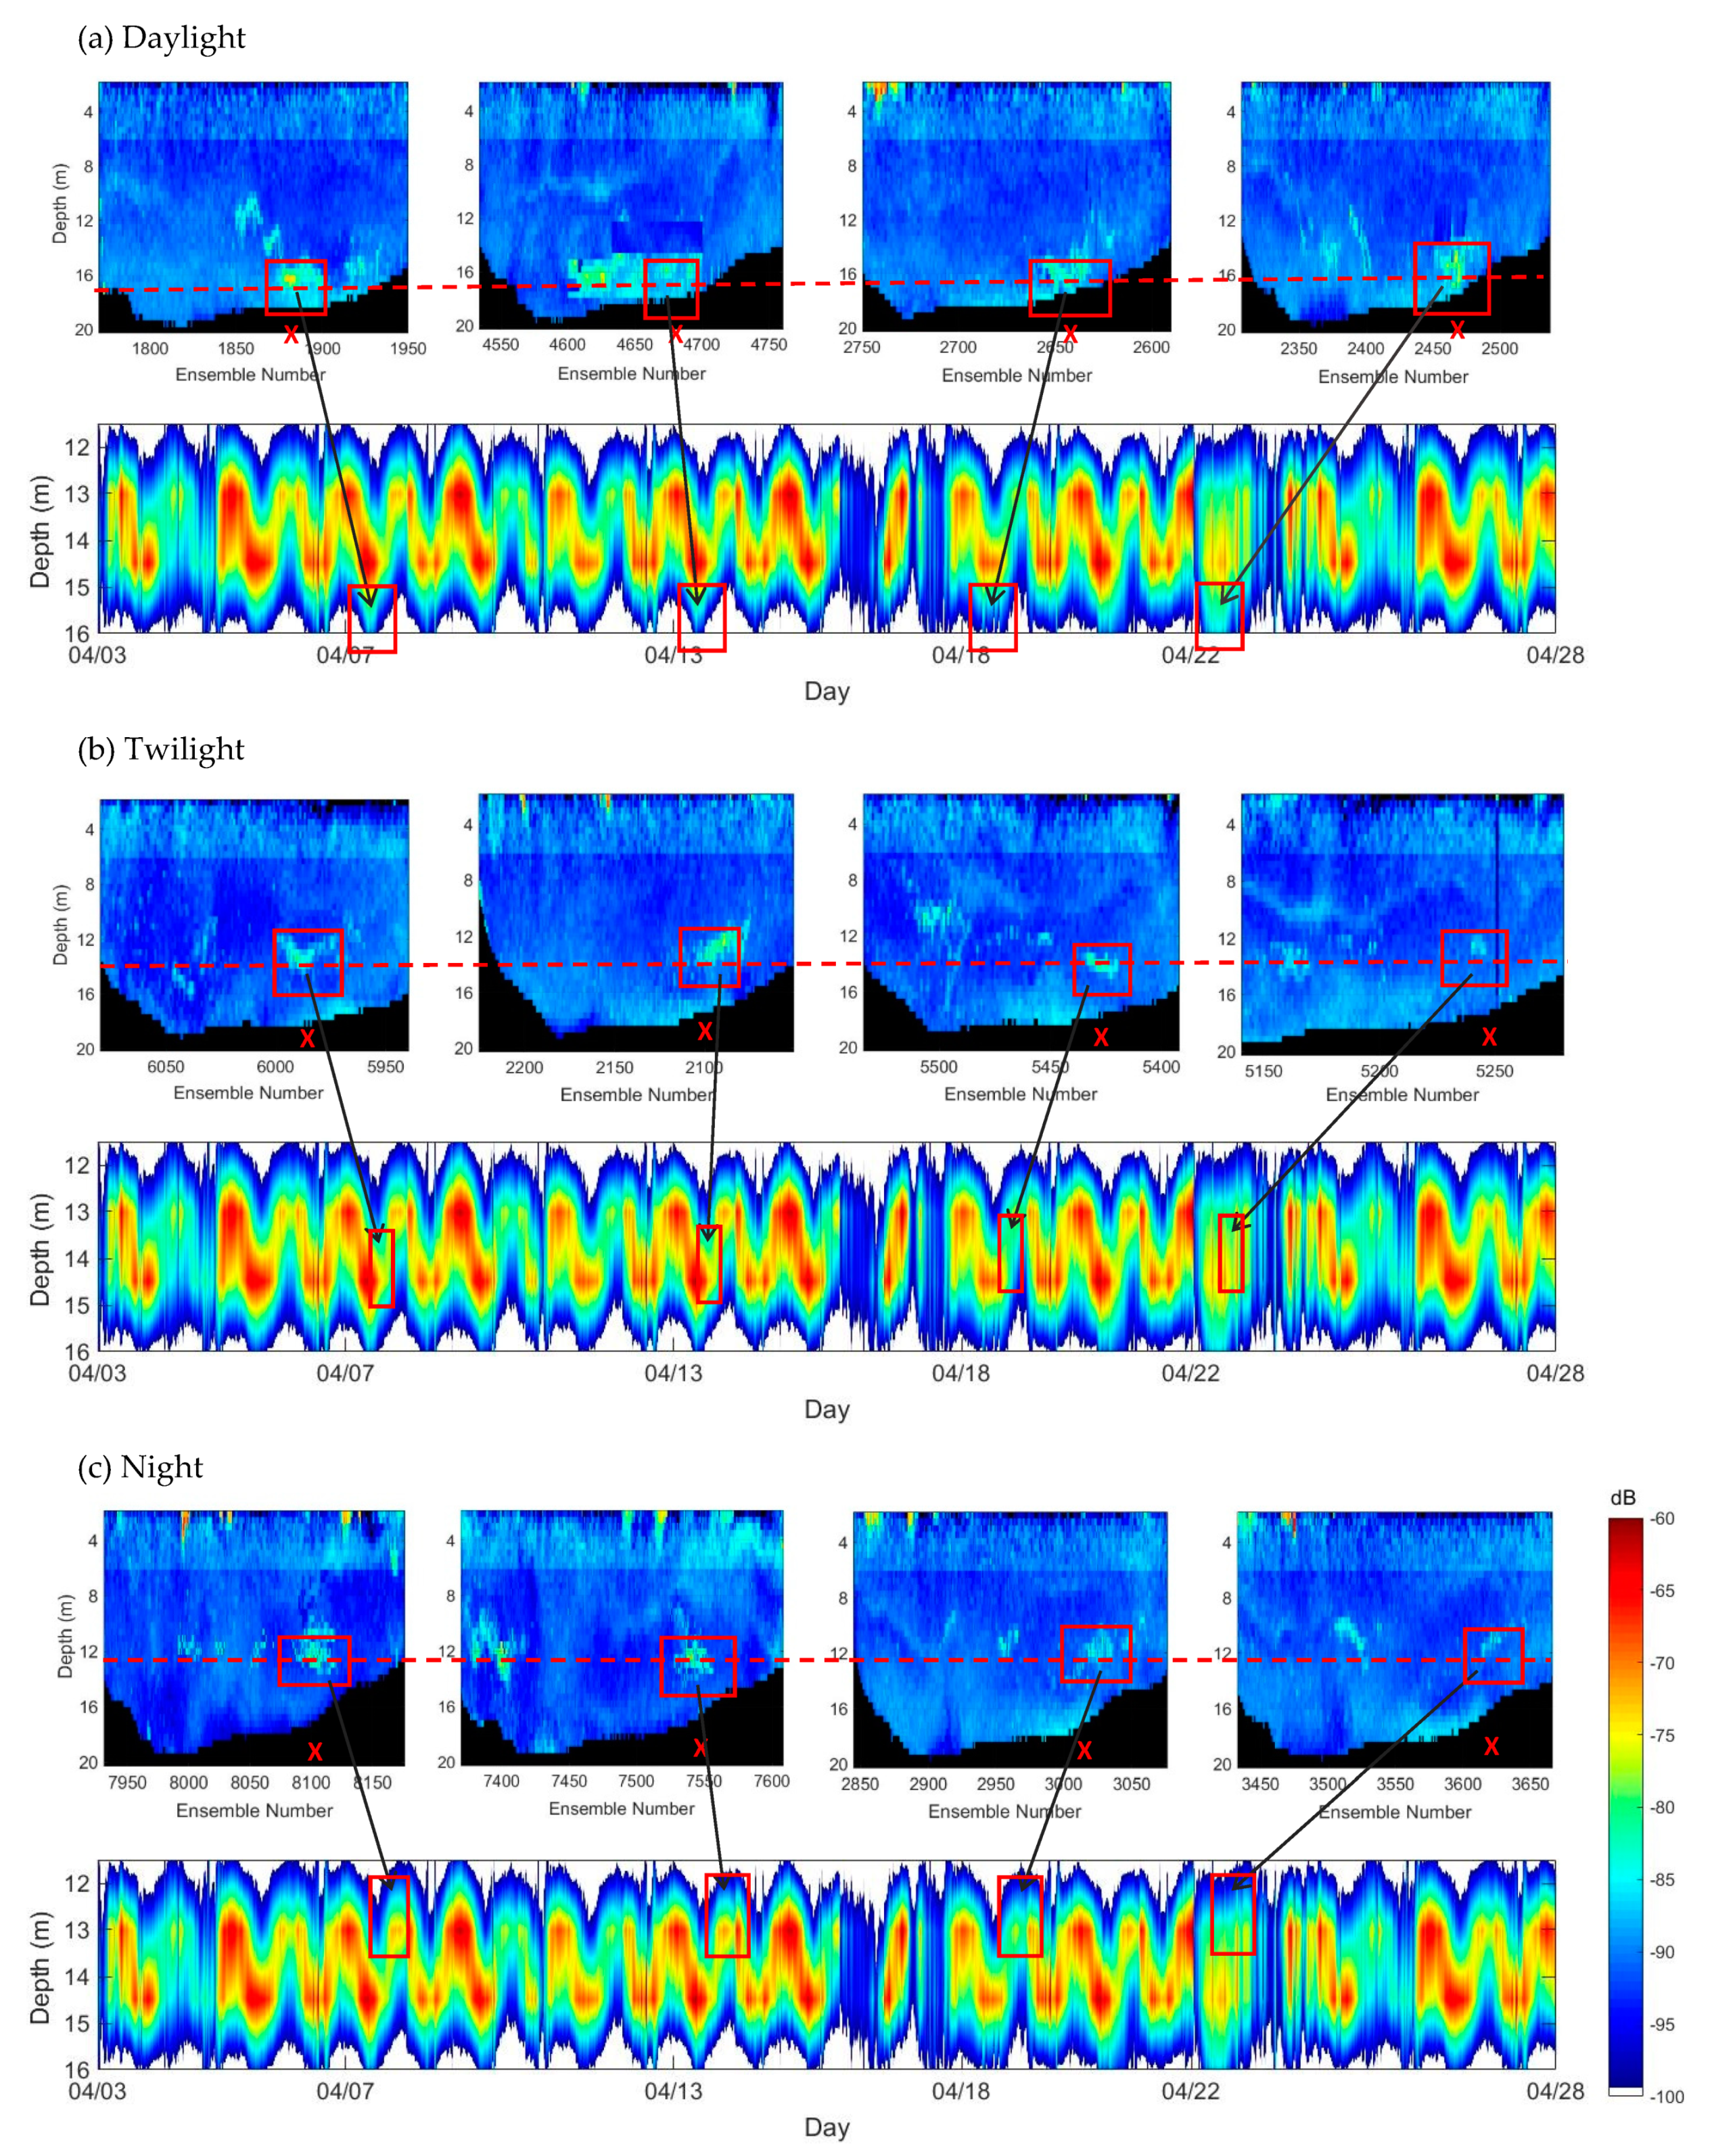
Analysis of the pattern of temporal variation derived from MVBS of moored ADCP has demonstrated meaningful information for diel vertical migration of zooplankton. Such information provides a rough estimation and correlation between water environments and their effects on zooplankton migration behavior. However, in general, zooplankton does not present uniform horizontal or vertical distribution but instead tends to be patchy, with different vertical abundance differences at each bin/depth due to vertical migration. On the other hand, under the condition that moored ADCP cannot reach broad spatial data, the mobile ADCP might be a solution, although the frequency used in the mobile ADCP is lower compared with moored ADCP. As a result, the MVBS value might be lower than the mobile ADCP, so verification of the MVBS value from both ADCP is needed. Comparison of echograms obtained from moored ADCP and mobile ADCPs was analyzed by observing MVBS values based on the exact time and location using the echo intensity tracing method. The two frequency, MVBS307.5kHz, and MVBS750kHz echogram were also used to identify DVM (Figure 6).
The high scatterers observed from the mobile ADCP showed that zooplankton spread along the track at one layer during certain times. We used the echo intensity tracing analysis for identifying the signal from both ADCP. Different MVBS variance of zooplankton at daylight, twilight, and night time was considered separately in the following analysis. The results show that strong MVBS were spread along the three different times. During the day, strong MVBS were around the bottom area, between 14 to 16 m of depth with MVBS value between −85 to −70 dB. At night, a large distribution of strong MVBS was formed between 13 to 14 m with MVBS value between −85 to −75 dB. The vertical distribution of MVBS in the night time was found varying from 10 to 13 m with MVBS value between −80 to −70 dB. The nighttime observation was still at the initial rise stage where zooplankton had just started moving to the upper layer. As shown from temporal variation observed from moored ADCP in Figure 5, zooplankton completely moved to the shallow in the midnight, indicated from the static red color at a depth between 11.5 to 13 m. Unfortunately, the lack of mobile ADCP data made it difficult to analyze during that period.

3.3. Biological Sampling

Most studies demonstrate that only specific single species of zooplankton were analyzed using the acoustic method and acoustic backscattering model [7,47,48,49]. However, this research found that the observed area had diverse types of zooplankton. Table 2 shows the zooplankton composition of the biological samples taken by plankton-net and all zooplankton categorized as mesoplankton with sizes ranging between 0.2–1.1 mm. Zooplankton was then classified into eight groups: protozoa, crustaceans, urochordate, chaetognath, nematode, gastropods, pelecypods, and polychaete. However, by comparing all samples data, the nauplius (stadia) zooplankton was excluded from the analysis because their size is too small (<0.01 mm). ADCP is not able to quantify small-size zooplankton because they cannot be detected by the 750 kHz ADCP used in this study [50]. The MVBS and the biological samples found in the observed area needed to be verified through specific target strength (TS) measurements at the laboratory for the further research, especially by measuring TS for each zooplankton found (Table 2) to determine zooplankton abundance.
Regarding the species differentiation in the acoustic scattering layer, detection of the movement speed of the target echo was effective in addition to the evaluation of the MVBS value and the spatial distribution [51]. MVBS value depends not only on the size but also on the abundance of zooplankton in one volume. The spatial variation of zooplankton was varied by the morphological and environment characteristic changes in the strait. The SSL in the observed area comprises various mixed zooplankton species. Thus, it is complicated to differentiate among the species in the SSL. However, in this study, we only focused on the MVBS observation and vertical velocity of the dominant zooplankton because the numbers of other species were too few and their sizes were too small to observe.
The species of zooplankton were constituting the SSL, which caused deviations in the MVBS from the mean of different depth. Based on the result of biological collection and identification, it was found that the strong backscatter value might be caused by the most abundant type of zooplankton which was categorized as crustacean zooplankton. The most abundant and dominant species comprising the SSL were Oithona sp., Paracalanus sp., Microsetella sp., Corycaeus sp., and in the form of nauplius stadia. The same results were shown in other research, with cyclopoids and calanoid being the dominant zooplankton in this location [52]. Among these species, Oithona sp. was the most abundant with the average density of 1636 ind m−3 followed by Paracalanus sp. with 1113 ind m−3. The average body length of the Oithona sp. and Paracalanus sp. were 0.74 mm and 0.39 mm, with a maximum of 1.09 mm and 0.93 mm, respectively. This species of zooplankton hence was considered to be the main scatterers in the observed area. DVM is typical behavior of the crustaceans [10] and based on the net-sampling and laboratory analysis; it is possible that the identified crustacean was moving in the observed area. Oithona has been described as the most ubiquitous and abundant copepod in the world’s oceans [53] and also Paracalanus [54].
The diversity index shows that zooplankton species were found to be diverse, showed by values greater than 1. The dominance index also proves that there was a species that dominated other groups, shown by the value below 1 which was indicated by the high abundance of zooplankton from Oithona sp. and Paracalanus sp. from each net-sampling. The uniformity index shows low (<0.40) and medium (0.40–0.65) categories of the uniformity of zooplankton types.

3.4. Relationship Between the MVBS and Zooplankton Abundance

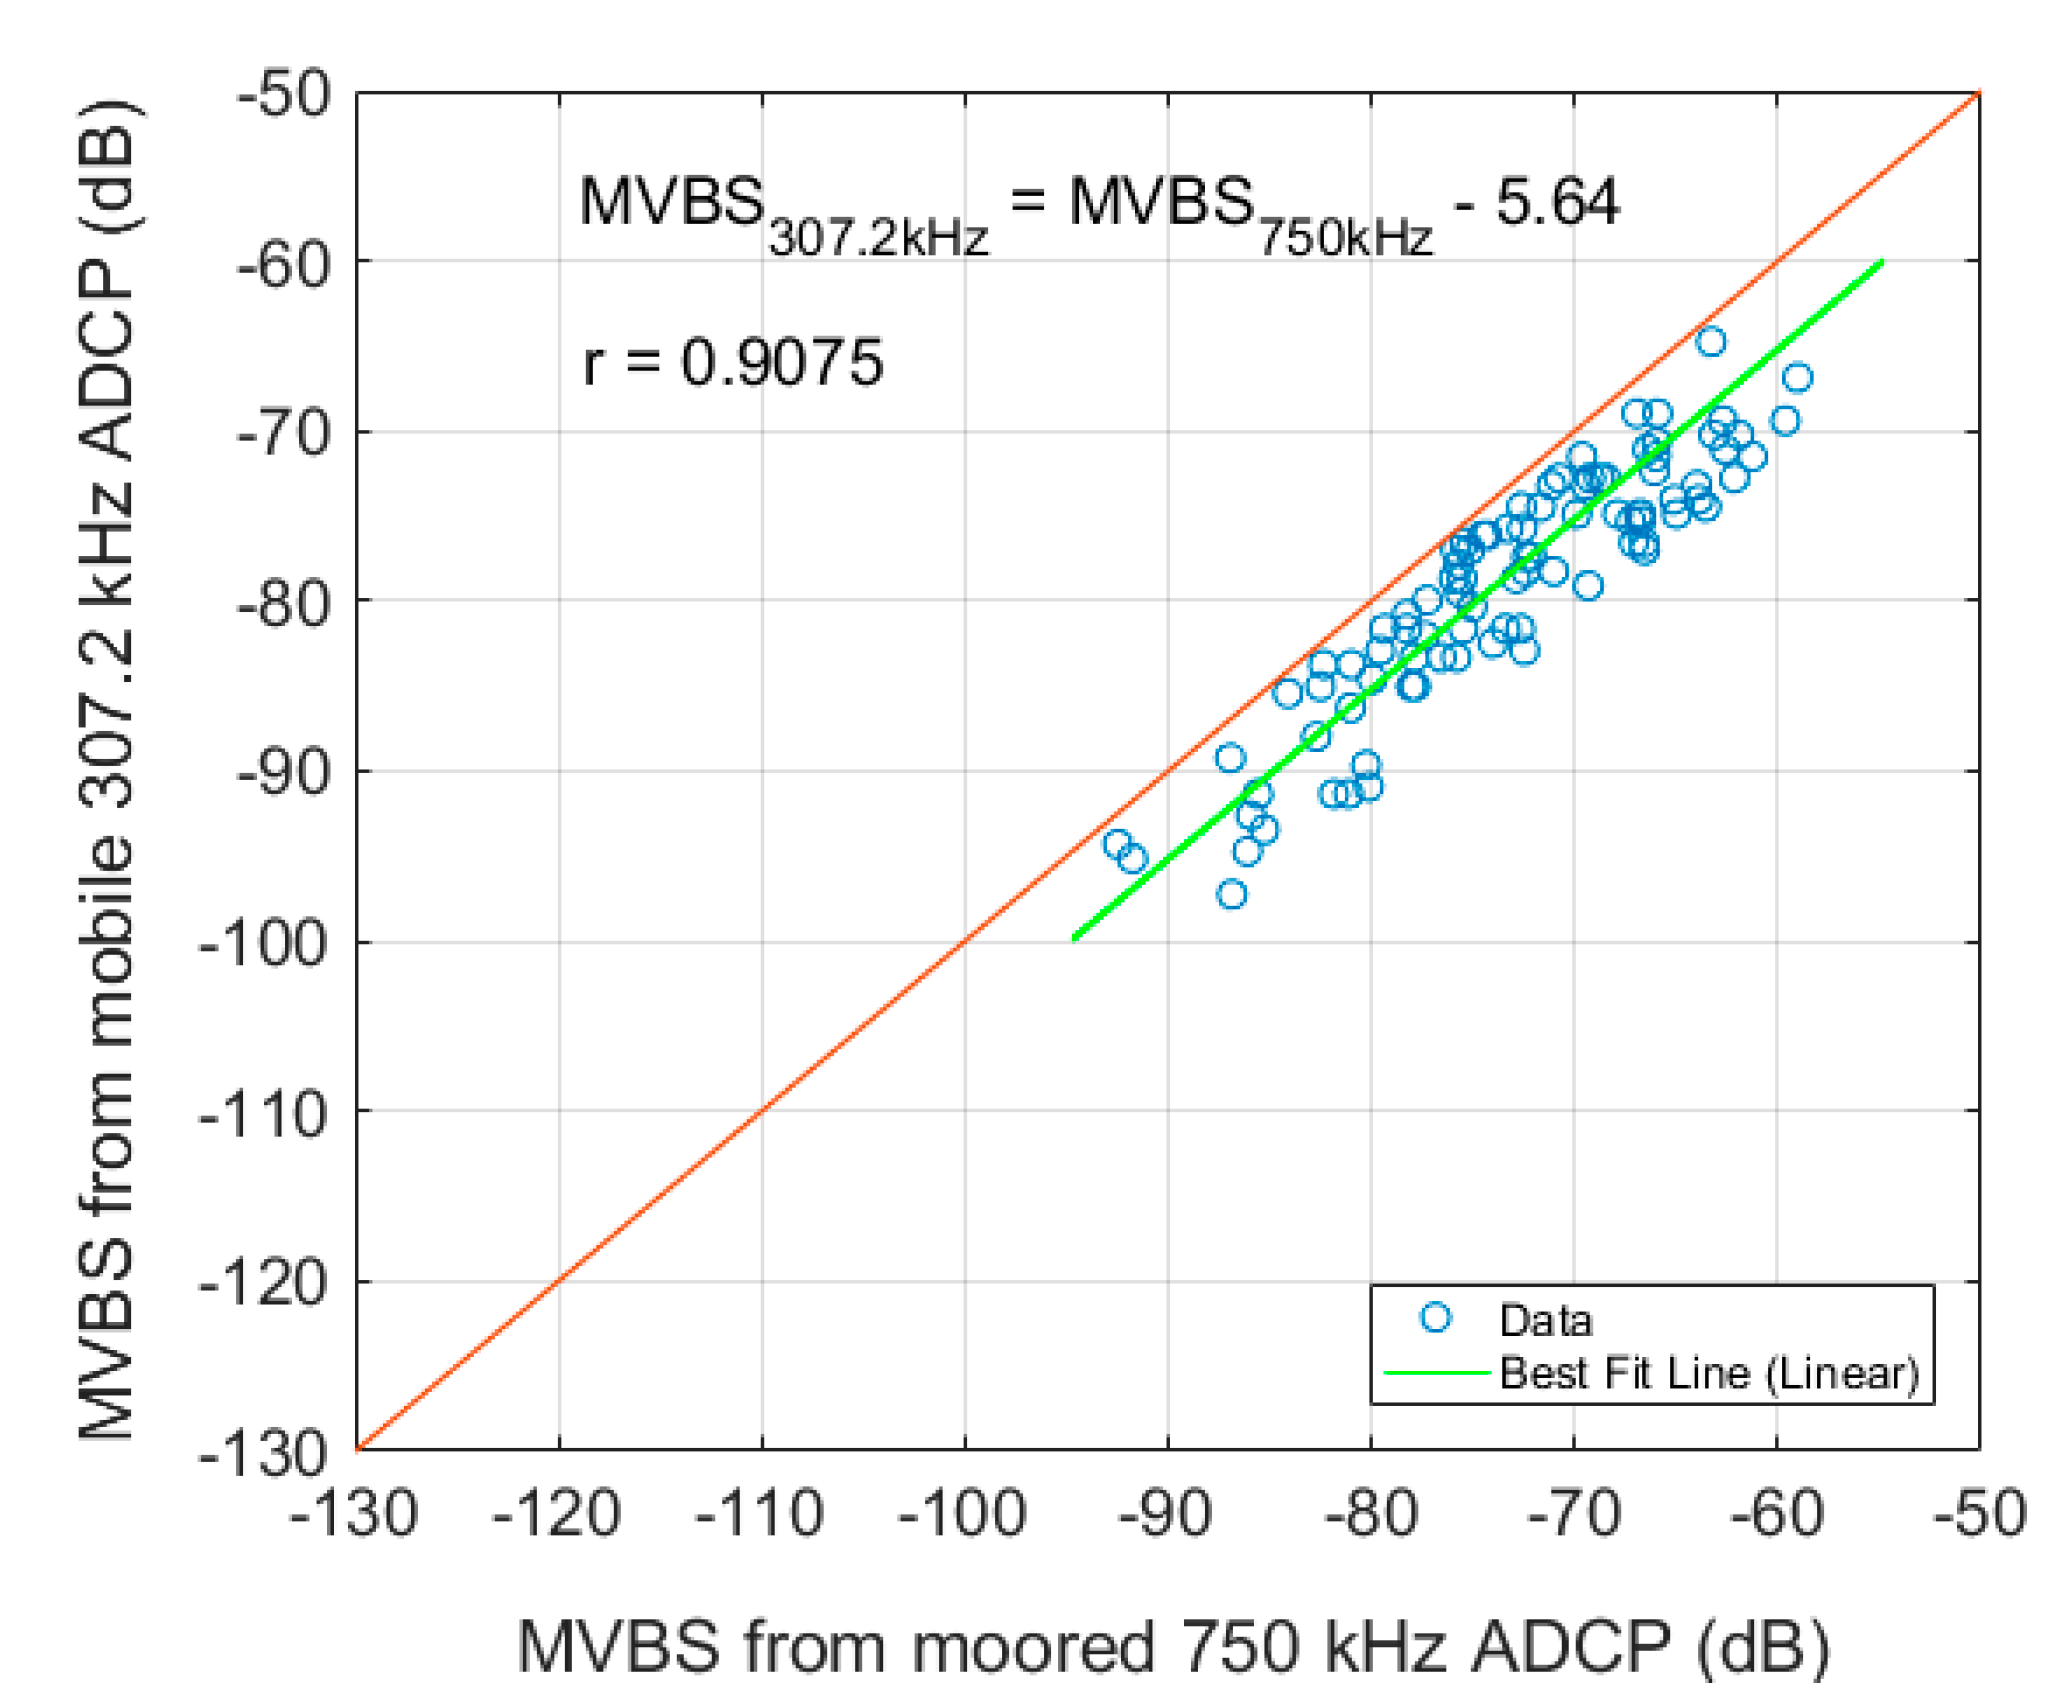
Measurements of zooplankton from both ADCP methods were correlated as shown in Figure 7. The relationship at sound scattered layers showed that MVBS from moored ADCP has a slightly higher signal compared to the MVBS from mobile ADCP. In the regression line, the deviations of 750 kHz relative to the 307.2 kHz in the SSL was y = x − 5.64 while the regression coefficient (r) was 0.9075. The MVBS differences between these two methods, MVBS 750 kHz MVBS 307.2 kHz , were the intercept of these linear equations (5.64 dB). The MVBS value from 750 kHz moored ADCP was higher than 307.2 kHz mobile ADCP. It was related to the frequency used in moored ADCP, which was higher compared to mobile ADCP. This MVBS difference happened because the acoustic method is very dependent on the acoustic frequency used, so the backscattered signal from the object will be different [15]. Based on the result, it is shown that these two methods can be applied for more detailed analysis for zooplankton detection.
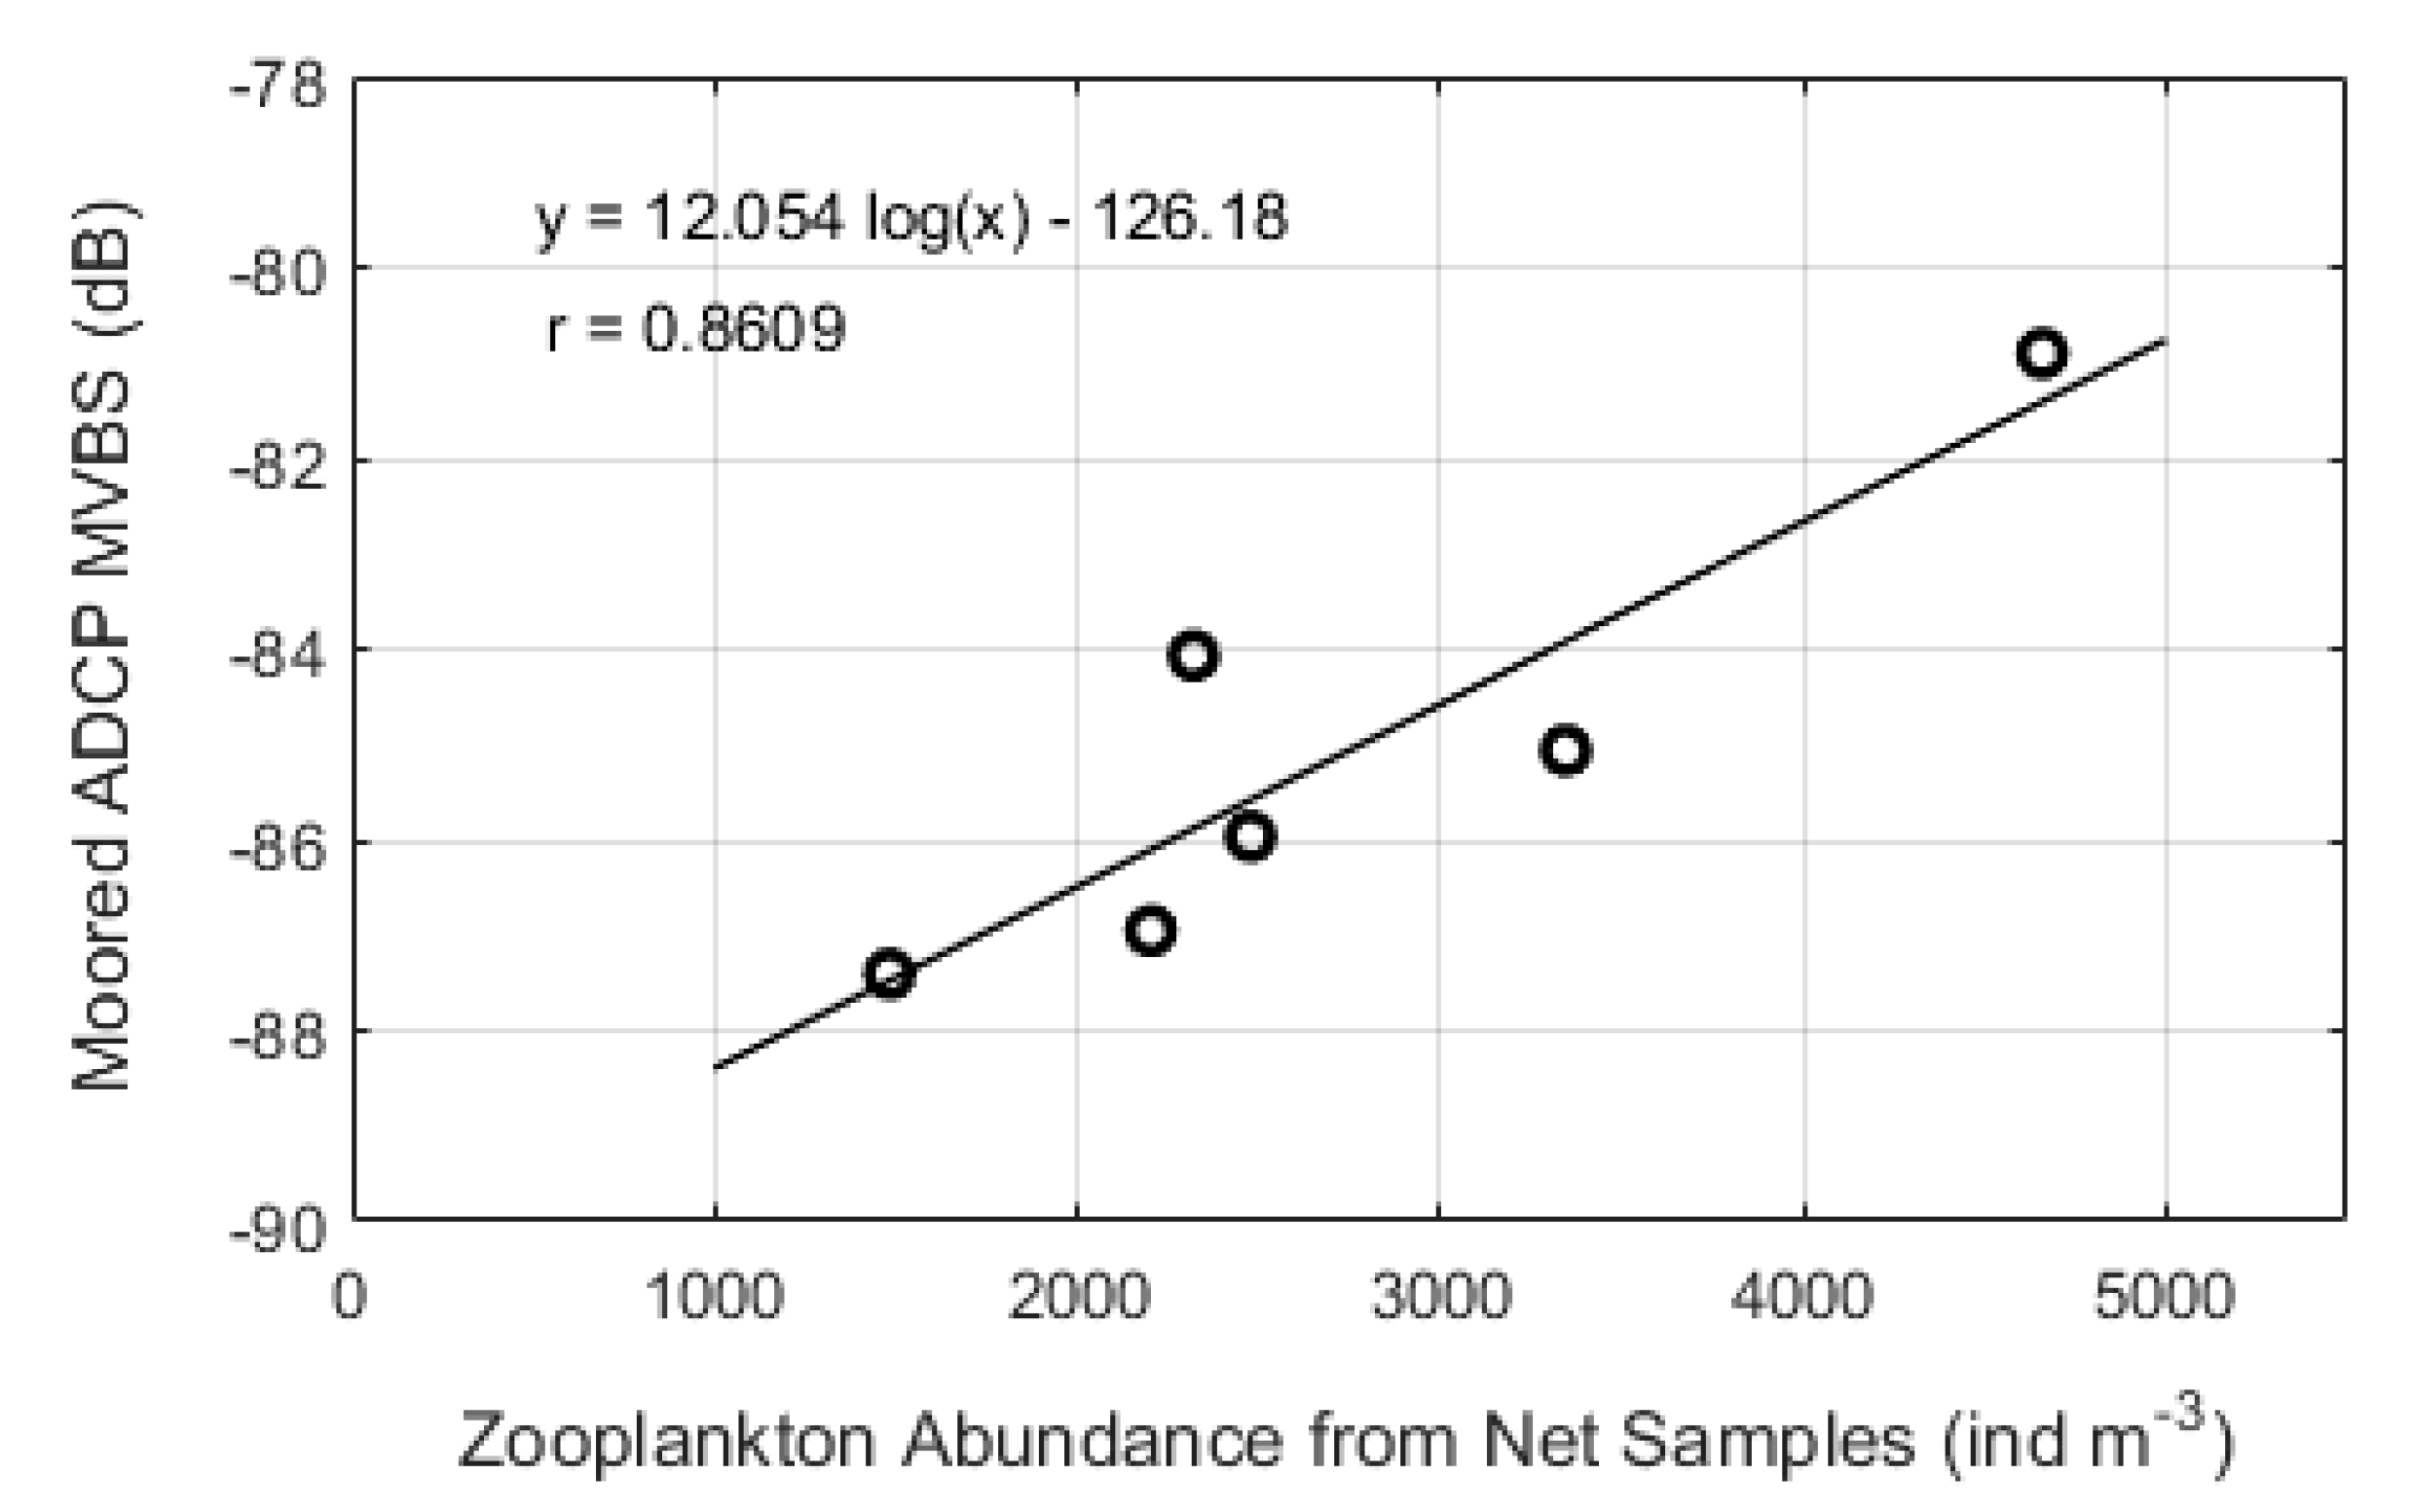
The acoustic wavelength given from the frequency of 750 kHz and 307.2 kHz ADCP instrument and sound speed set in the instruments were approximately 2 and 5 mm, respectively. However, the body size of zooplankton found in the observed area was smaller than the wavelength of the ADCP. The previous research found that if the zooplankton was dense and numerous enough at one layer, it could create strong backscatter signals as well [55]. So, it was important to find the relationship between the MVBS (dB) and the zooplankton abundance (ind m−3). The relationship between the MVBS and zooplankton abundance was done through analysis of two dominant species found that contributed to the observed MVBS averaged over depth and time interval with using regression analysis. The selected MVBS was only based on the SSL depth. Altogether, the most abundant zooplankton species from six biological sample were used to find the relationship with the average MVBS during the sampling time. The results of the linear regression of the MVBS and measured zooplankton abundance was summarized in Figure 8.
The magnitudes of these coefficients are, among many other acoustical properties of the corresponding scatterers, related to zooplankton size (acoustic cross-sectional area). The linear regression of this relationship was explained, with the x-axis as zooplankton abundance and y-axis as averaged moored ADCP MVBS. The most representative species, Oithona sp. and Paracalanus sp., had high abundance compared to other species and were related to higher values of averaged MVBS. The MVBS variation significantly reflected the zooplankton abundance. In particular, the high MVBS value agreed with the highest abundance. Our research was found to be consistent with a similar result from other research [31,55].
However, the lack of biological samples made it difficult to find which zooplankton species had a strong influence on the MVBS variation. The zooplankton abundance could be used as a parameter by employing assumptions about the particular individual zooplankton found in the laboratory analysis to the MVBS value at the time of the sampling process. Such measurements of the MVBS only resulted in rough estimation; thus, it could not distinguish among different species of zooplankton which could differ in abundance as well as in the acoustic properties of the zooplankton species [50].

3.5. Diel Vertical Migration

Estimation of the vertical movement of the zooplankton in the scattering layer can be easily performed by using a scientific echosounder in general, but it is impossible to estimate the vertical movement speed in the water column. On the other hand, the ADCP method is a direct measurement of the vertical velocity component as long as the acoustic backscatter measurement and can measure a zooplankton behavior pattern using the vertical velocity component.
Figure 9 shows that the daily variability on echogram of the MVBS, vertical velocity, and current speed from April 4 to 8 were measured on the moored ADCP. In the case of the seabed installation, since the transducer is fixed to the bottom of the sea, the measurement of the vertical velocity with high accuracy can be expected. By integrating the MVBS at a long series of data, the diel vertical migration was confirmed on the SSL depth, and similar pattern with the vertical velocity profiles was found. At shallower depths until 11.5 m, lower vertical velocity value was detected during the observation. The vertical velocity value in this layer had much flatter variation compared to the SSL.
The color in the vertical velocity profile expresses the zooplankton’s swimming behavior. Red indicates that the upward movement and downward movement is indicated by blue. The migration stages of zooplankton consisted of the initial rise (from white to red), rapid rise (strong red), stable (white), initial descent (from red to white), and rapid sinking (blue). The sinking and rising speed of velocity component were detected from the maximum value of 4.9 mm s−1 and 4.4 mm s−1, respectively. These vertical velocities were much smaller than those obtained in a different area, especially in the sub-tropical and arctic which varied between 10~20 mm s−1 [10,30,51]. It appears that zooplankton does not need to swim quickly to migrate because the vertical migration range is very short.
The clear diel pattern captured was associated with low current speed (Figure 9a,c) on the nights of 4, 6, and 8 April, and correlated between the mean MVBS and current speed indicated by the similar pattern. When the current speed was high, at the same time the average MVBS value was lower compared to the same hour in another day. High current speeds of >100 cm s−1 mainly affected the MVBS [10]. Zooplankton relies on water currents to move around. The upward and downward vertical movement ranging from the surface to 11.5 m (Figure 9d) at night and daytime might be caused by the tidal flow, as there was fluctuation on the mean sea level (MSL) over time and slowly affected the vertical movement of the particle in the water column, since the vertical velocity value was much lower compared to the SSL area. However, the vertical velocity changed significantly around the depth of 11.5–16 m, and it was confirmed as a sound scattering layer, with a pattern of the diurnal cycle of vertical movement. The peak of strong vertical velocity value in this deeper layer suggested that the diurnal cycle of the pattern was caused by something other than by the tides [31]. Such a phenomenon was often seen, indicated by the dashed line in the echogram. In Figure 10e, the clear peak of the MVBS and vertical velocity profiles reflects the DVM of the zooplankton.
The maximum average velocity speed of upward vertical movement was 5 mm s−1 at the center of the SSL. It started moving downward slowly at sunrise and reached the peak at −5 mm s−1. This slow movement of zooplankton in the observed area was due to their small size. Mean vertical velocity at sunset was slower than at sunrise. The dashed line inside the echogram in Figure 10 indicates the center of the SSL and the average of vertical velocity speed. During the migration period, the average MVBS value ranged between −75 to −70 dB with vertical velocity varied between 2 to 5 mm s−1 with downward movement at sunrise and 2 to 5 mm s−1 with upward movement at sunset. The vertical velocity profiles were slightly lower on April 16 throughout the day, which was related to the lower MVBS value. It was assumed that the zooplankton moved to another area outside the detection area of moored ADCP.
During 11–17 April 2016, sunrise and sunset occurred between 5:37 and 17:43 (UTC +8), respectively. Diel vertical migration started during this time. A typical DVM pattern of the acoustic scattering layer is seen in the echogram at 11.5–16 m of depth with upward vertical movement to shallower depth sunset at 17:43, while downward vertical migration to a deeper depth about 20 min before sunrise at 5:37. The duration of DVM was repeated every day based on the MVBS echogram and vertical velocity profile, and it related to the diurnal cycle. Based on this analysis, it was assumed that DVM was triggered by the sunlight penetration to the water column, depending on solar irradiance.
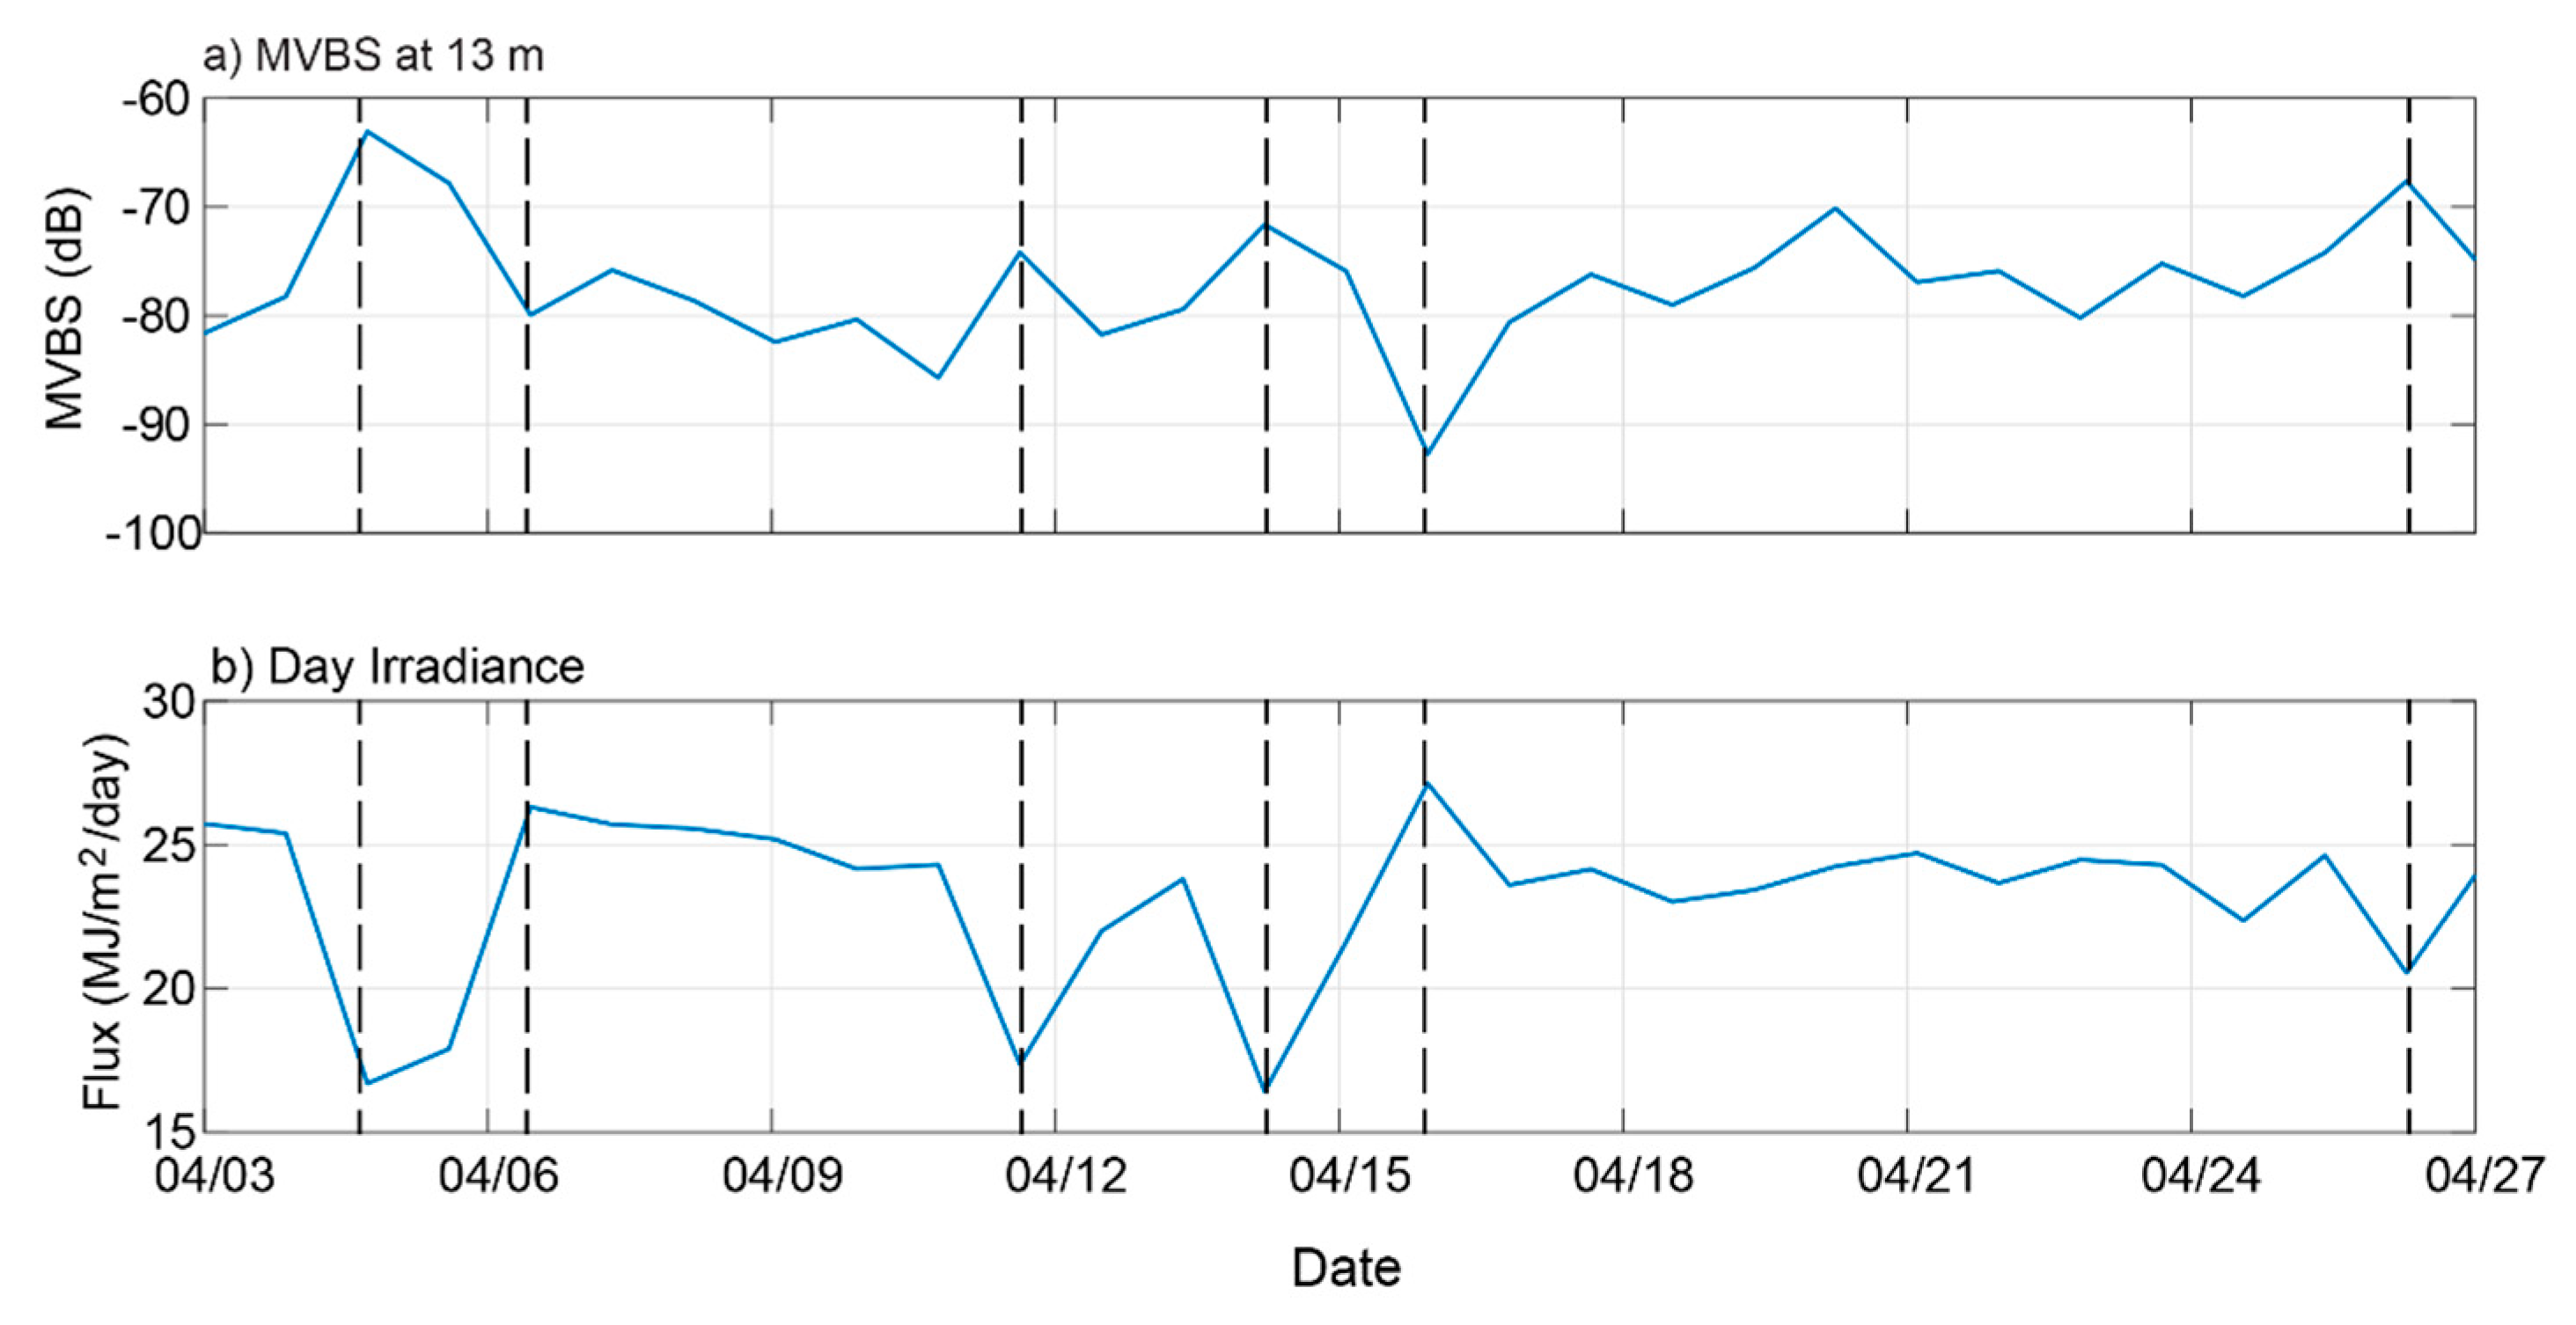
However, the irradiance data in the observed area were not measured directly, and temporal average solar irradiance data was used instead, obtained from the National Aeronautics and Space Administration (NASA) Prediction of Worldwide Energy Resource (POWER), close to the ADCP position. The all significant MVBS peaks are related to the minimum value of irradiance. The day-time MVBS at 13 m and irradiance are shown in Figure 11. This result probably indicates that the MVBS variation correlated with irradiance which triggered the DVM.

3.6. Theoretical TS using the DWBA Model

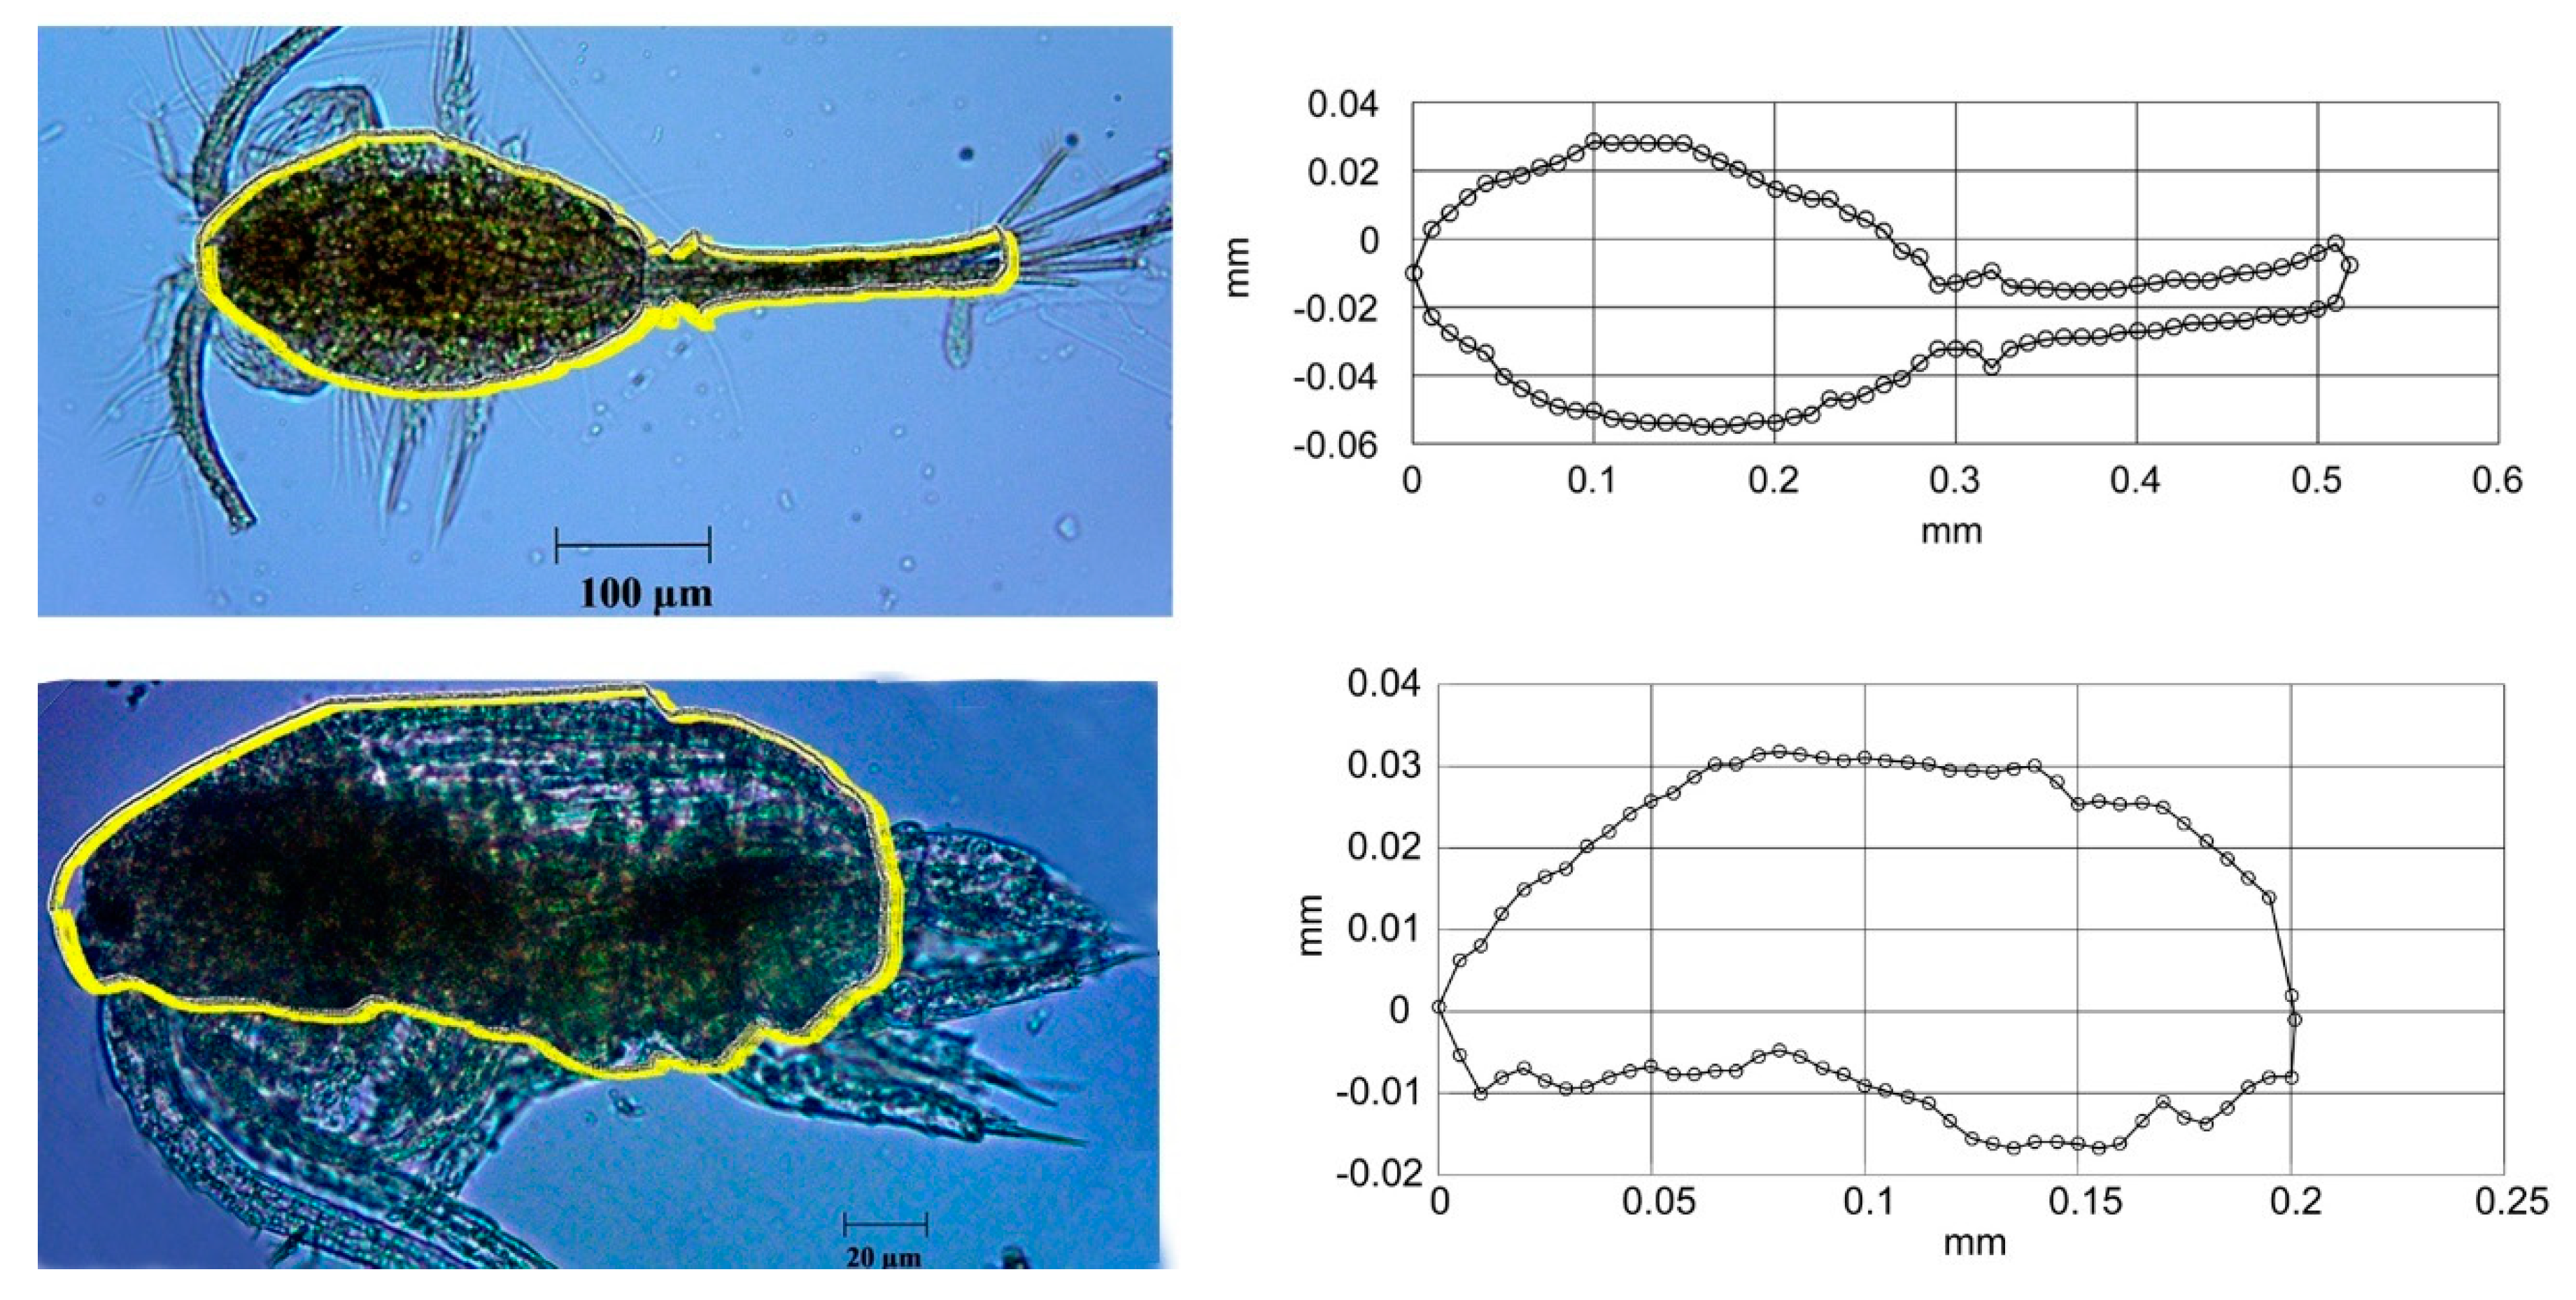
Classification of zooplankton species by ADCP may encounter many challenges that cannot be resolved using MVBS analysis. The theoretical TS of dominant scatterers based on the biological sampling, Oithona sp. and Paracalanus sp. was used. From these samples, a photo from a biological sample was taken for digitizing the shape of each zooplankton. The digitized photo of dominant zooplankton was used to measure their 2D morphology (Figure 12).
The acoustic backscatter characteristic differences from different zooplankton also had a different response with various sizes and shape. Although other research [12] showed that there were some challenges to obtaining quantitative estimates of zooplankton abundance and biomass in mixed populations, by using acoustic modeling it was possible to identify which zooplankton was responsible for the acoustic backscatter collected. Figure 13 shows target strength (dB) calculated from body length (L) for two acoustic frequencies used in ADCP.
Zooplankton could freely swim and changed their orientation in the water, for example during the diel vertical migration that could vary in TS value. Since all species were small, weak, and complicated in shape, the estimated TS were small and variable. Thus, they were compared to the TS from the theoretical model. Scattering from a different angle was modeled based on the orientation of zooplankton. TS values varied based on different angles at all 360°. The 0° angle was the acoustic angle of incidence that affected the zooplankton head section, while the 180° angle scattered the tail part of the zooplankton. The difference in the acoustic incidence angle in both zooplankton also varies with the zooplankton orientation. As explained earlier, Oithona sp. was digitized by the dorsal aspect, while Paracalanus sp. was digitized with side aspects. All aspects were observed because small-sized zooplankton may roll in the water column depending on the water current strength [56]. Measurements at angles 90° and 270° in Oithona sp. were from the left and right sides of the body, while at an angle 90° and 270° in Paracalanus sp. were from the upper and lower sides of the zooplankton body. The difference in acoustic angle of orientation was observed to find out the three-dimensional acoustic responses in all zooplankton body parts. The results of these experiments indicate that either the dorsal or side aspect had the same theoretical TS results as that of the DWBA model.
Theoretical TS value of the DWBA model for Oithona sp. species ranged from −148.3 to −148.19 dB at the frequency 307.2 kHz and between −133.63 to −132.92 dB at the frequency of 750 kHz. Theoretical TS species of Paracalanus sp. ranged from −161.9 to −161.83 dB at the frequencies of 307.2 kHz and −146.7 to −146.4 dB at a frequency of 750 kHz. The peak of the TS value was on the side aspect (90° and 270°) of the Oithona sp. body, whereas the TS peak was from dorsal (270°) and ventral (90°) aspects of the Paracalanus sp. body. The lowest TS value was on the anterior (0°) and posterior (180°) from both species. The zooplankton theoretical TS value from different acoustic incidence angle measurements proved that acoustic measurements using upward-looking and downward-looking methods were not different in acoustic backscatter response for zooplankton studies, with the highest possible TS values obtained from individual zooplankton. In future studies, direct measurement of TS, density contrast, and sound speed contrast should be conducted to characterize the source of the MVBS recorded by the ADCP instruments associated with DVM.
By using two frequency in ADCP instruments, the theoretical TS from each species was used to differentiate between general classes of scatterers. The relationship between the TS and MVBS was MVBS freq =   10 log ρ · TS freq , while when we compared the MVBS for each frequency, the equation became dB diff = MVBS 750 kHz MVBS 307.2 kHz = TS 750 kHz     TS 307.2 kHz . This assumption of the MVBS and TS was used to estimate the major scatterers in the water column of the observed area. So, based on the equation, TS 750 kHz     TS 307.2 kHz for each dominant zooplankton was around 15 dB, while MVBS 750 kHz MVBS 307.2 kHz was 5.64 dB. If a single zooplankton species was assumed to dominate the MVBS in the SSL, then ΔMVBS750–307.2 in the SSL was equal to ΔTS750–307.2 of the scatterers [57]. The dominant zooplankton species was not the main scatterers based on the ΔMVBS and ΔTS. Instead, it was assumed that the strong signal was caused by all zooplankton species found in the waters which aggregated into schools. This study did not directly measure zooplankton TS at measured conditions in the laboratory against acoustic angle variations due to equipment limitations. Further studies involving more sample collections every day are needed, especially during the night and daylight.

4. Conclusions

The acoustic method using an acoustic Doppler current profiler (ADCP) can be applied for observing the distribution and migration pattern of zooplankton based on the MVBS variation as well as a vertical velocity profile. From the time series data, a relatively high MVBS that was indicated as the SSL was found near the seabed at 11.5 to 16 m. Combined moored and mobile ADCP provided insight into determining the spatial and temporal variation of zooplankton with their behavior. The DVM pattern was shown based on the echogram and vertical velocity profiles, which resulted in zooplankton moving to shallower depth during the night and moving to the deeper depth at daylight. The difference of theoretical TS (ΔTS) from the DWBA model were then compared to the MVBS difference (ΔMVBS) to identify the source of the strong scattering in the SSL, which showed that the dominant zooplankton species was not the main scatterers. The strong signal in the SSL was instead caused by the school of various zooplankton species. This study provides implications for understanding behavior or zooplankton using echo intensity analysis and vertical velocity profiles of an ADCP.

Author Contributions

Conceptualization, A.D. and T.M.; Formal analysis, A.D. and T.M.; Funding acquisition, H.M.M.; Investigation, A.D.; Methodology, A.D., H.M.M., T.P., S.S. and T.M.; Software, A.D. and T.M.; Supervision, H.M.M.; Validation, T.M.; Visualization, A.D.; Writing—original draft, A.D.; Writing—review & editing, H.M.M., T.P., S.S. and T.M.

Funding

The authors would like to acknowledge the Directorate General of Higher Education (DIKTI) for financially supporting this research through PMDSU Research Grant Scheme (No. 129/SP2H/PTNBH/DRPM/2018), also Directorate of Human Resource Qualifications, Directorate General of Resources for Science and Technology and Higher Education (DG-RSTHE), Ministry of Research, Technology and Higher Education of Republic of Indonesia for financially supporting this publication through Enhanced International Publication (EIP) Program (No. 1406.3/D3/PG/2018).

Acknowledgments

This work is also supported by Marine Geological Institute, Ministry of Energy and Mineral Resources, Bandung, Republic of Indonesia. We sincerely thank the editors and reviewers for their constructive and valuable comments of our paper.

Conflicts of Interest

The authors declare that there are no conflicts of interest.

References

  1. Leonori, I.; De Felice, A.; Canduci, G.; Costantini, I.; Biagiotti, I.; Giuliani, G.; Budillon, G. Krill distribution in relation to environmental parameters in mesoscale structures in the Ross Sea. J. Mar. Syst. 2017, 166, 159–171. [Google Scholar] [CrossRef]
  2. Brown, J.H. Why are there so many species in the tropics? J. Biogeogr. 2014, 41, 8–22. [Google Scholar] [CrossRef] [PubMed]
  3. Rumengan, I.F.M.; Akerina, J.; Rampengan, M.M.F.; Masengi, K.W.A. Abundance and diversity of zooplankton in Lembeh Strait, Bitung, Indonesia. Mar. Resour. Indones. 2011, 36, 15–20. [Google Scholar] [CrossRef]
  4. Cornils, A.; Schulz, J.; Schmitt, P.; Lanuru, M.; Richter, C.; Schnack-Schiel, S.B. Mesozooplankton distribution in the Spermonde Archipelago (Indonesia, Sulawesi) with special reference to the Calanoida (Copepoda). Deep Res. Part II Top. Stud. Oceanogr. 2010, 57, 2076–2088. [Google Scholar] [CrossRef]
  5. Aboul Ezz, S.M.; Heneash, A.M.M.; Gharib, S.M. Variability of spatial and temporal distribution of zooplankton communities at Matrouh beaches, south-eastern Mediterranean Sea, Egypt. Egypt. J. Aquat. Res. 2014, 40, 283–290. [Google Scholar] [CrossRef] [Green Version]
  6. Powell, J.R.; Ohman, M.D. Changes in zooplankton habitat, behavior, and acoustic scattering characteristics across glider-resolved fronts in the Southern California Current System. Prog. Oceanogr. 2015, 134, 77–92. [Google Scholar] [CrossRef]
  7. Simmonds, E.J.; MacLennan, D.N. Fisheries Acoustics: Theory and Practice, 2nd ed.; Fish and Fisheries Series; Blackwell: Oxford, UK, 2005; pp. 266–280. [Google Scholar]
  8. Saklnan, S.; Gücü, A.C. Spatial distribution of the Black Sea copepod, Calanus euxinus, estimated using multi-frequency acoustic backscatter. ICES J. Mar. Sci. 2017, 74, 832–846. [Google Scholar] [CrossRef]
  9. Ursella, L.; Cardin, V.; Batistić, M.; Garić, R.; Gačić, M. Evidence of zooplankton vertical migration from continuous Southern Adriatic buoy current-meter records. Prog. Oceanogr. 2018, 167, 78–96. [Google Scholar] [CrossRef]
  10. La, H.S.; Ha, H.K.; Kang, C.Y.; Wåhlin, A.K.; Shin, H.C. Acoustic backscatter observations with implications for seasonal and vertical migrations of zooplankton and nekton in the Amundsen shelf (Antarctica). Estuar. Coast. Shelf Sci. 2015, 152, 124–133. [Google Scholar] [CrossRef]
  11. Mukai, T.; Iida, K.; Ando, Y.; Mikami, H.; Maki, Y.; Matsukura, R. Measurements of swimming angles, density, and sound speed of the krill Euphausia pacifica for target strength estimation. In Proceedings of the Oceans ’04 MTTS/IEEE Techno-Ocean ’04, Kobe, Japan, 9–12 November 2004; Volume 4, pp. 383–388. [Google Scholar] [CrossRef]
  12. Fielding, S.; Griffiths, G.; Roe, H.S.J. The biological validation of ADCP acoustic backscatter through direct comparison with net samples and model predictions based on acoustic-scattering models. ICES J. Mar. Sci. 2004, 61, 184–200. [Google Scholar] [CrossRef] [Green Version]
  13. Sawada, K.; Mukai, T.; Fukuda, Y.; Matsuura, T. Comparison of zooplankton density estimated by acoustic inversion method and net sampling. J. Acoust. Soc. Am. 2016, 140, 3243. [Google Scholar] [CrossRef]
  14. Schiano, E.; Pensieri, S.; Bozzano, R.; Picco, P. Analysis of long time series of ADCP backscatter data in the Ligurian Sea to investigate the zooplankton variability. In Proceedings of the Oceans 2013 MTS/IEEE Bergen Challenges Northern Dimension, Bergen, Norway, 10–14 June 2013. [Google Scholar]
  15. Dwinovantyo, A.; Manik, H.M.; Prartono, T.; Susilohadi, S. Application of Acoustic Doppler Current Profiler (ADCP) to Observe Diel Vertical Migration of Zooplankton. J. Phys. Conf. Ser. 2018, 1075, 012016. [Google Scholar] [CrossRef]
  16. Yang, C.; Liao, G.; Yuan, Y.; Chen, H.; Zhu, X. The diel vertical migration of sound scatterers observed by an acoustic Doppler current profiler in the Luzon Strait from July 2009 to April 2011. Acta Oceanol. Sin. 2013, 32, 1–9. [Google Scholar] [CrossRef]
  17. Lee, K.; Mukai, T.; Lee, D.; Iida, K. Verification of mean volume backscattering strength obtained from acoustic Doppler current profiler by using sound scattering layer. Fish. Sci. 2008, 74, 221–229. [Google Scholar] [CrossRef]
  18. Deines, K.L. Backscatter estimation using Broadband acoustic Doppler current profilers. In Proceedings of the IEEE Sixth Working Conference on Current Measurement (Cat. No.99CH36331), San Diego, CA, USA, 13 March 1999; pp. 249–253. [Google Scholar] [CrossRef]
  19. Mullison, J. Backscatter Estimation Using Broadband Acoustic Doppler Current Profilers-Updated. In Proceedings of the ASCE Hydraulic Measurements & Experimental Methods Conference, Durham, NH, USA, 9–12 July 2017; pp. 1–5. [Google Scholar]
  20. Dwinovantyo, A.; Manik, H.M.; Prartono, T.; Susilohadi, S. Quantification and Analysis of Suspended Sediments Concentration Using Mobile and Static Acoustic Doppler Current Profiler Instruments. Adv. Acoust. Vib. 2017, 2017, 4890421. [Google Scholar] [CrossRef]
  21. Miyashita, K.; Aoki, I. Acoustic measurements of zooplankton using a dual frequency echo sounder. Mar. Ecol. Prog. Ser. 1999, 180, 105–109. [Google Scholar] [CrossRef] [Green Version]
  22. Lee, K.; Mukai, T.; Kang, D.; Iida, K. Application of acoustic Doppler current profiler combined with a scientific echo sounder for krill Euphausia pacifica density estimation. Fish. Sci. 2004, 70, 1051–1060. [Google Scholar] [CrossRef]
  23. Mackenzie, K.V. Nine-term equation for sound speed in the oceans. J. Acoust. Soc. Am. 1981, 70, 807–812. [Google Scholar] [CrossRef]
  24. Francois, R.E.; Garrison, G.R. Sound absorption based on ocean measurements. Part II: Boric acid contribution and equation for total absorption. J. Acoust. Soc. Am. 1982, 72, 1879–1890. [Google Scholar] [CrossRef]
  25. Pratiwi, N.T.M.; Ardhito; Wulandari, D.Y.; Iswantari, A. Horizontal Distribution of Zooplankton in Tangerang Coastal Waters, Indonesia. Procedia Environ. Sci. 2016, 33, 470–477. [Google Scholar] [CrossRef] [Green Version]
  26. Brierley, A.S.; Saunders, R.A.; Bone, D.G.; Murphy, E.J.; Enderlein, P.; Conti, S.G.; Demer, D.A. Use of moored acoustic instruments to measure short term variability in abundance of Antartic krill. Limnol. Oceanogr. Methods 2006, 4, 18–29. [Google Scholar] [CrossRef]
  27. Lee, K.; Mukai, T.; Lee, D.-J.; Iida, K. Classification of sound-scattering layers using swimming speed estimated by acoustic Doppler current profiler. Fish. Sci. 2014, 80, 1–11. [Google Scholar] [CrossRef]
  28. Furusawa, M. Effects of noise and absorption on high frequency measurements of acoustic-backscatter from fish. Int. J. Oceanogr. 2015, 2015, 589463. [Google Scholar] [CrossRef]
  29. Amakasu, K.; Mukai, T.; Moteki, M. Measurement of the volume-backscattering spectrum from an aggregation of Antarctic krill and inference of their length-frequency distribution. Polar Sci. 2017, 12, 79–87. [Google Scholar] [CrossRef]
  30. Cisewski, B.; Strass, V.H.; Rhein, M.; Kragefsky, S. Seasonal variation of diel vertical migration of zooplankton from ADCP backscatter time series data in the Lazarev Sea, Antarctica. Deep Res. I 2010, 57, 78–94. [Google Scholar] [CrossRef] [Green Version]
  31. Cisewski, B.; Strass, V.H. Acoustic insights into the zooplankton dynamics of the eastern Weddell Sea. Prog. Oceanogr. 2016, 144, 62–92. [Google Scholar] [CrossRef] [Green Version]
  32. Proud, R.; Cox, M.J.; Wotherspoon, S.; Brierley, A.S. A method for identifying Sound Scattering Layers and extracting key characteristics. Methods Ecol. Evol. 2015, 6, 1190–1198. [Google Scholar] [CrossRef] [Green Version]
  33. Chu, D.; Foote, K.G.; Stanton, T.K. Further analysis of target strength measurements of Antarctic krill at 38 and 120 kHz: Comparison with deformed cylinder model and inference of orientation distribution. J. Acoust. Soc. Am. 1993, 93, 2985–2988. [Google Scholar] [CrossRef]
  34. Stanton, T.K.; Wiebe, P.H.; Chu, D. Differences between sound scattering by weakly scattering spheres and finite-length cylinders with applications to sound scattering by zooplankton. J. Acoust. Soc. Am. 1998, 103, 254–264. [Google Scholar] [CrossRef] [Green Version]
  35. Stanton, T.K.; Chu, D.; Wiebe, P.H. Sound scattering by several zooplankton groups. II. Scattering models. J. Acoust. Soc. Am. 1998, 103, 236–253. [Google Scholar] [CrossRef] [PubMed] [Green Version]
  36. McGehee, D.E.; O’Driscoll, R.L.; Traykovski, L.V.M. Effects of orientation on acoustic scattering from Antarctic krill at 120 kHz. Deep Res. Part II Top. Stud. Oceanogr. 1998, 45, 1273–1294. [Google Scholar] [CrossRef]
  37. Stanton, T.K.; Chu, D. Review and recommendations for the modelling of acoustic scattering by fluid-like elongated zooplankton: Euphausiids and copepods. ICES J. Mar. Sci. 2000, 57, 793–807. [Google Scholar] [CrossRef]
  38. Jech, J.M.; Horne, J.K.; Chu, D.; Demer, D.A.; Francis, D.T.I.; Gorska, N.; Jones, B.; Lavery, A.C.; Stanton, T.K.; Macaulay, G.J.; et al. Comparisons among ten models of acoustic backscattering used in aquatic ecosystem research. J. Acoust. Soc. Am. 2015, 138, 3742–3764. [Google Scholar] [CrossRef]
  39. Thoha, H.; Fitriya, N. The diversity of plankton in Sangihe - Sangir Talaud Islands, Sulawesi, Indonesia. Biosfera 2010, 27, 112–119. [Google Scholar] [CrossRef]
  40. Hays, G.C. Ocean currents and marine life. Curr. Biol. 2017, 27, R470–R473. [Google Scholar] [CrossRef] [PubMed]
  41. Lawson, G.L.; Wiebe, P.H.; Ashjian, C.J.; Gallager, S.M.; Davis, C.S.; Warren, J.D. Acoustically-inferred zooplankton distribution in relation to hydrography west of the Antarctic Peninsula. Deep Sea Res. Part II Top. Stud. Oceanogr. 2004, 51, 2041–2072. [Google Scholar] [CrossRef]
  42. Hays, G.C. A review of adaptive significance and ecosystem consequenses of zooplankton diel vertical migrations. Hydrobiologia 2003, 503, 163–170. [Google Scholar] [CrossRef]
  43. Zhu, X.-H.; Takasugi, Y.; Nagao, M.; Hashimoto, E. Diurnal cycle of soynd scatterers and measurements of turbidity using ADCP in Beppu Bay. J. Oceanogr. 2000, 56, 559–565. [Google Scholar] [CrossRef]
  44. Frank, T.M.; Widder, E.A. The correlation of downwelling irradiance and staggered vertical igration patterns of zooplankton in Wilkinson Basin, Gulf of Maine. J. Plankton Res. 1997, 19, 1975–1991. [Google Scholar] [CrossRef] [Green Version]
  45. Ringelberg, J. Changes in light intensity and diel vertical migration: A comparison of marine and freshwater environments. J. Mar. Biol. Ass. U. K. 1995, 75, 15–25. [Google Scholar] [CrossRef]
  46. Lawson, G.L.; Stanton, T.K.; Ashjian, C.J. Euphausiid distribution along the Western Antarctic Peninsula—Part A: Development of robust multi-frequency acoustic techniques to identify euphausiid aggregations and quantify euphausiid size, abundance, and biomass. Deep Sea Res. Part II Top. Stud. Oceanogr. 2008, 55, 412–431. [Google Scholar] [CrossRef]
  47. Amakasu, K.; Furusawa, M. The target strength of Antarctic krill (Euphausia superba) measured by the split-beam method in a small tank at 70 kHz. ICES J. Mar. Sci. 2006, 63, 36–45. [Google Scholar] [CrossRef]
  48. Amakasu, K.; Ono, A.; Hirano, D.; Ishimaru, T. Distribution and density of Antarctic krill (Euphausia superba) and ice krill (E. crystallorophias) off Adélie Land in austral summer 2008 estimated by acoustical methods. Polar Sci. 2011, 5, 187–194. [Google Scholar] [CrossRef]
  49. Miyashita, K.; Aoki, I.; Seno, K.; Taki, K. Acoustic identification of isada krill, Euphausia pacifica Hansen, off the Sanriku coast, North-Eastern Japan. Fish. Oceanogr. 1997, 6, 266–271. [Google Scholar] [CrossRef]
  50. Potiris, E.; Frangoulis, C.; Kalampokis, A.; Ntoumas, M.; Pettas, M.; Petihakis, G.; Zervakis, V. Acoustic Doppler current profiler observations of migration patterns of zooplankton in the Cretan Sea. Ocean Sci. 2018, 14, 783–800. [Google Scholar] [CrossRef]
  51. Wang, Z.; DiMarco, S.F.; Ingle, S.; Belabbassi, L.; Al-Kharusi, L.H. Seasonal and annual variability of vertically migrating scattering layers in the northern Arabian Sea. Deep Sea Res. Part I Oceanogr. Res. Pap. 2014, 90, 152–165. [Google Scholar] [CrossRef]
  52. Thoha, H.; Fitriya, N.; Sianturi, O.R.; Wang, Y. Community structure of zooplankton in the Lembeh Strait, Bitung, and Wori Beach, Manado, North Sulawesi, Indonesia. Acta Oceanol. Sin. 2018, 37, 28–34. [Google Scholar] [CrossRef]
  53. Gallienne, C.P.; Robins, D.B. Is Oithona the most important copepod in the world’s oceans? J. Plankton Res. 2001, 23, 1421–1432. [Google Scholar] [CrossRef]
  54. Lo, W.-T.; Shih, C.-T.; Hwang, J.-S. Diel vertical migration of the planktonic copepods at an upwelling station north of Taiwan, western North Pacific. J. Plankton Res. 2004, 26, 89–97. [Google Scholar] [CrossRef] [Green Version]
  55. Pinot, J.M.; Jansá, J. Time variability of acoustic backscatter from zooplankton in the Ibiza Channel (western Mediterranean). Deep Sea Res. Part I Oceanogr. Res. Pap. 2001, 48, 1651–1670. [Google Scholar] [CrossRef]
  56. Michalec, F.-G.; Fouxon, I.; Souissi, S.; Holzner, M. Zooplankton can actively adjust their motility to turbulent flow. Proc. Natl. Acad. Sci. USA 2017, 114, E11199–E11207. [Google Scholar] [CrossRef] [Green Version]
  57. Kang, M.; Furusawa, M.; Miyashita, K. Effective and accurate use of difference in mean volume backscattering strength to identify fish and plankton. ICES J. Mar. Sci. 2002, 59, 794–804. [Google Scholar] [CrossRef] [Green Version]
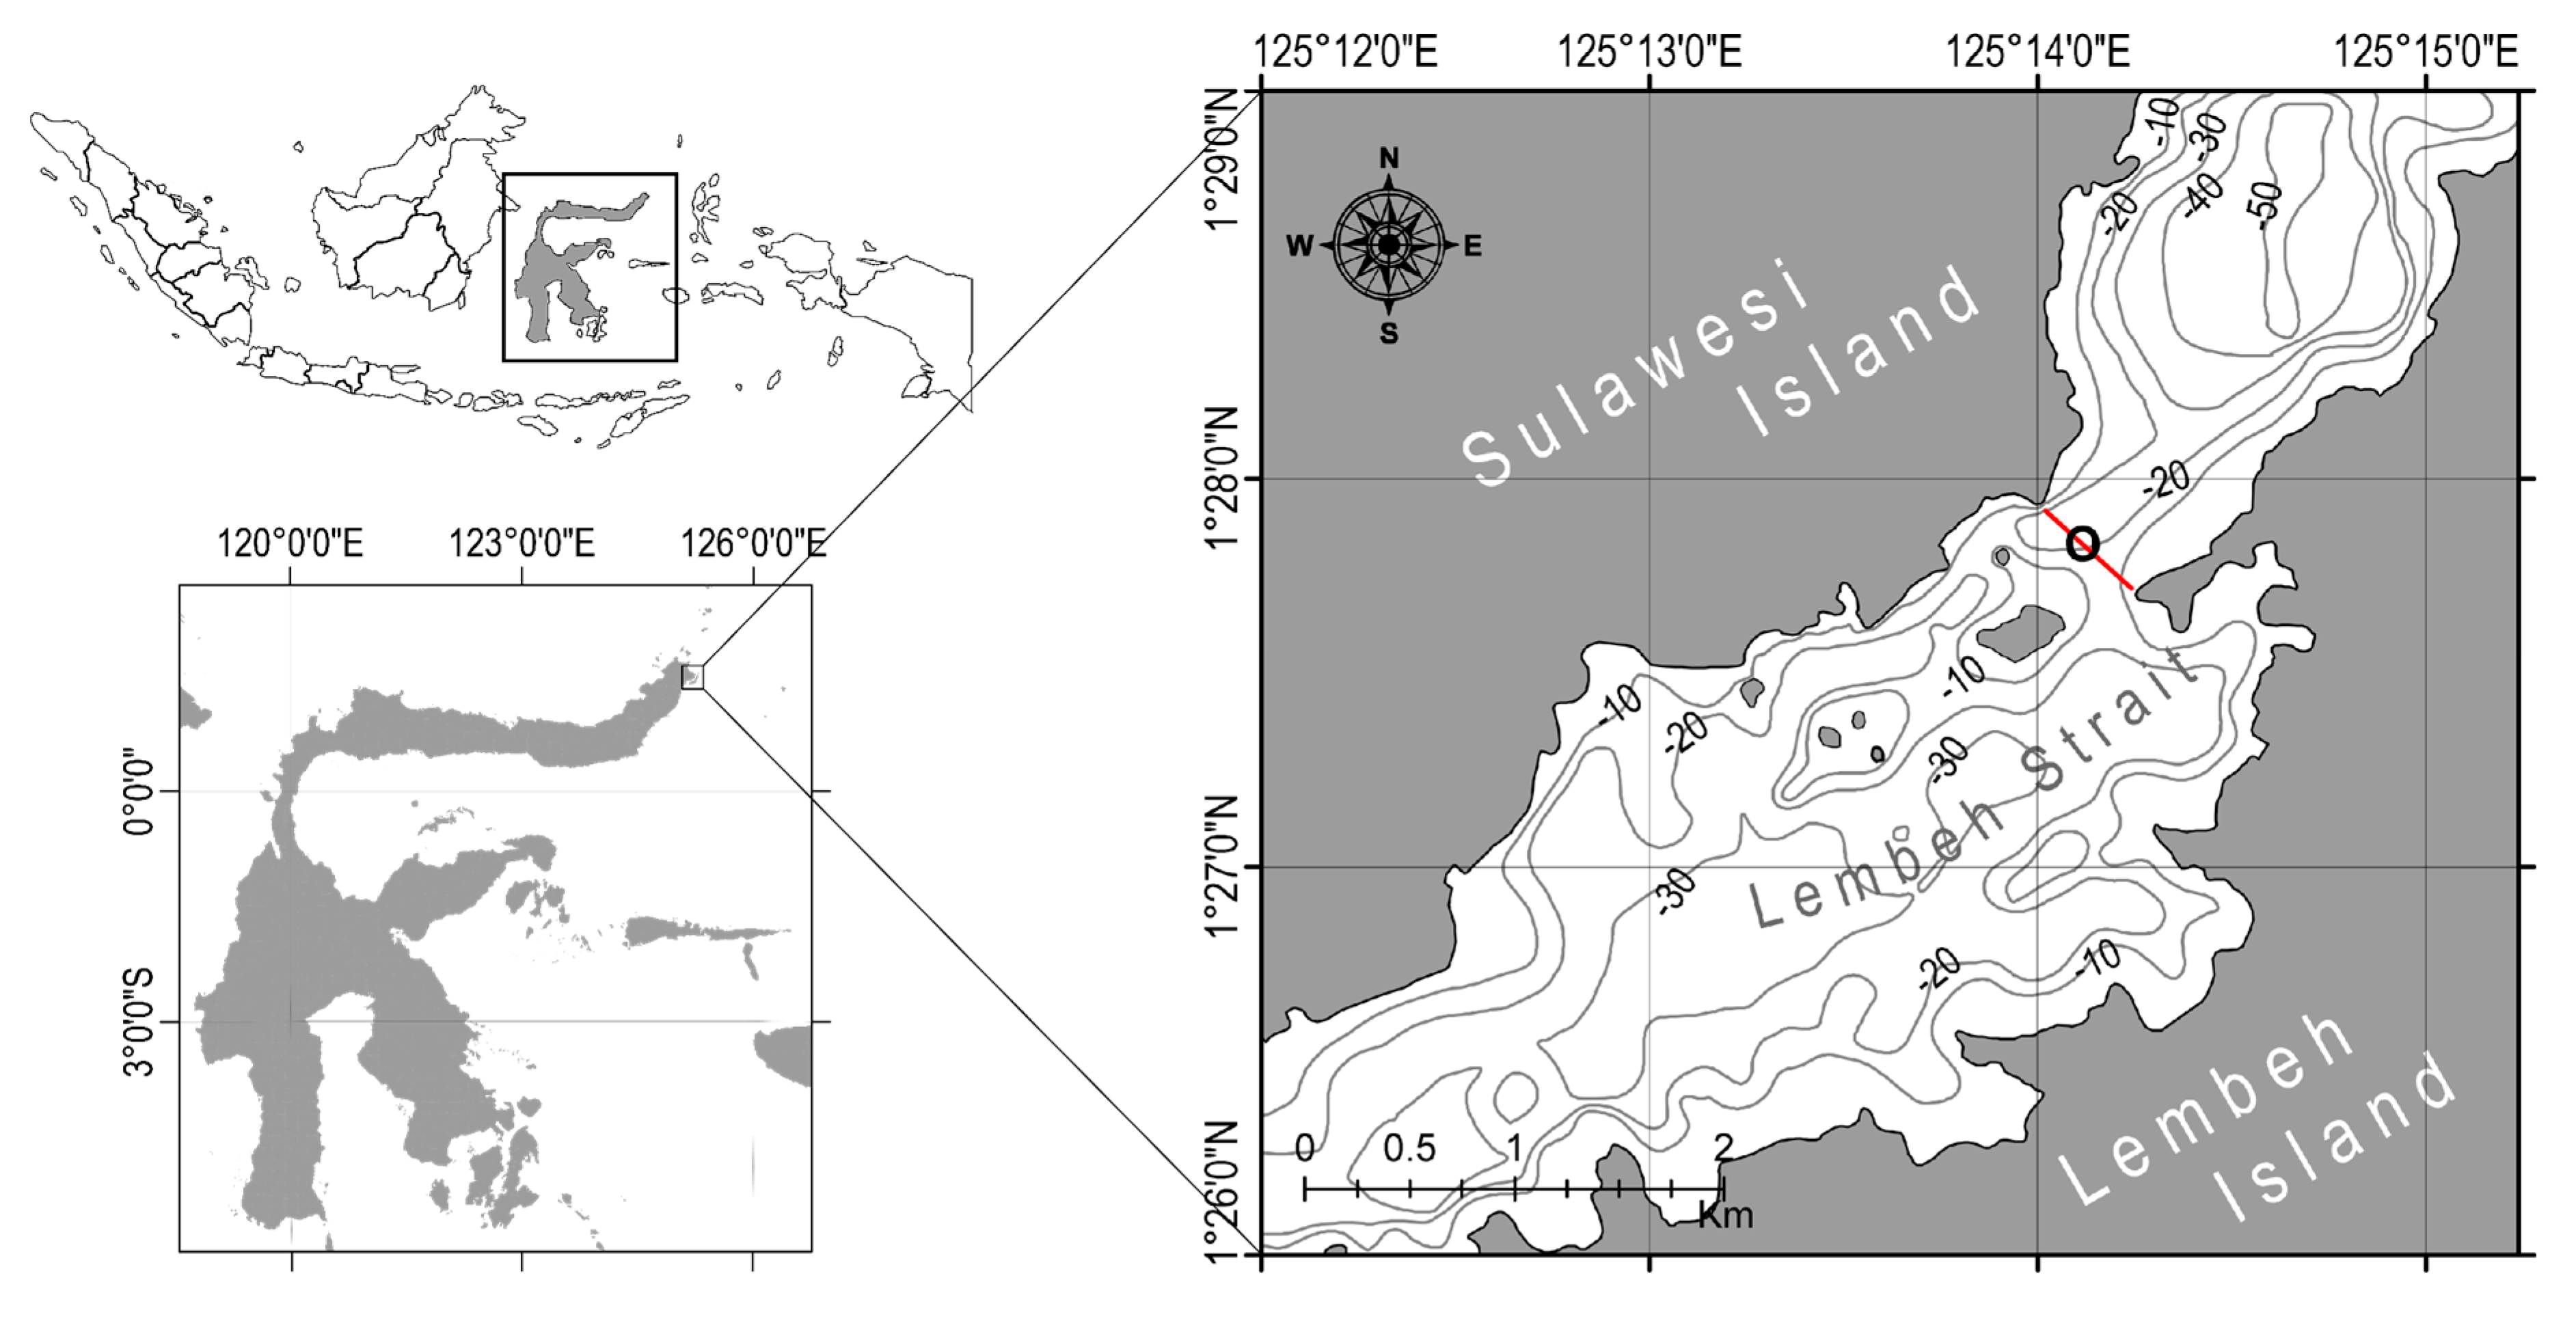
Figure 1. Moored ADCP and zooplankton sampling point (o) location and mobile ADCP survey transect line () in the Lembeh Strait, North Sulawesi, Indonesia in April 2016.
Applsci 09 01851 g001
Figure 2. The zooplankton acoustic acquisition setting on (a) moored ADCP and (b) mobile ADCP. The mobile ADCP moving through the pre-defined cross-section showed with arrows and passed moored ADCP location, turned back in the same track, and repeated for 3 hours of each session (daylight, twilight, and night).
Applsci 09 01851 g002
Figure 3. Time series (26 days) of filtered MVBS, the distribution of MVBS, and monthly average temperature. Yellow to red color in red square dashed line in 12–16 m of depth indicates the zooplankton movement during one cycle of the sun.
Applsci 09 01851 g003
Figure 4. Extracted MVBS of moored ADCP data at 11.5–16 m. The black bar below the echogram indicated the night time while the white bar indicated the daylight time.
Applsci 09 01851 g004
Figure 5. Diel vertical migration of zooplankton at the water column from an upward looking moored ADCP in daily periods. During the night, zooplankton moved to shallower depths compared to daylight.
Applsci 09 01851 g005
Figure 6. Vertical section of MVBS from mobile (upper) and moored (down) ADCP during (a) daylight, (b) twilight, (c) night time. The dotted red line indicates the position of the zooplankton with red ‘x’ marks visualized the location of moored ADCP. The red square box in both echograms was in the same location and time and are compared further in Figure 8.
Applsci 09 01851 g006
Figure 7. Relationship of MVBSs inside the SSL (11.5–16 m) determined from the selected ensemble from the four-beam averaged in two ADCPs.
Applsci 09 01851 g007
Figure 8. The relationship between the mean volume backscattering strength (dB) around the SSL and zooplankton abundance (ind m−3) from net samples. The x-axis is the two dominant zooplankton species abundance (Oithona sp. and Paracalanus sp.) measured in the laboratory while the y-axis is the averaged MVBS from moored ADCP over 30 min around the biological sampling time.
Applsci 09 01851 g008
Figure 9. Observed zooplankton’s DVM pattern from the comparison of (a) MVBS values with (b) vertical velocities and (c) current speed obtained from mooring ADCP. The graph line was mean vertical velocity in (d) surface to 11.5 m of depth and (e) in the sound scattering layer (11.5–16 m).
Applsci 09 01851 g009
Figure 10. The dashed line shows the center of the sound scattering layer on the echogram and the vertical velocity average at the vertical velocity profile at depths 11.5–16 m.
Applsci 09 01851 g010
Figure 11. Daytime distribution on the MVBS at 13 m of depth vs. solar irradiance. The dashed lines mark major MVBS peaks and their correspondence in irradiance.
Applsci 09 01851 g011
Figure 12. Shape and length of Oithona sp. (dorsal aspect) and Paracalanus sp. (side aspect).
Applsci 09 01851 g012
Figure 13. Theoretical target strength (dB) vs. acoustic incidence angle of 0.518 mm Oithona sp. and 0.201 mm Paracalanus sp. based on distorted wave-Born approximation (DWBA) model. These zooplankton were modeled in two frequencies (307.2 and 750 kHz) according to the frequency used in ADCP. The width of the cylinder for Oithona sp. and Paracalanus sp. were 0.01 mm and 0.005 mm, respectively. The peak of TS occurred at dorsal (270°) and ventral (90°) aspect.
Applsci 09 01851 g013
Table 1. Instruments and parameter configuration of both ADCP instruments for data acquisition and processing.
ParametersMoored ADCP Mobile ADCP
Frequency (kHz)750307.2
Sampling interval (s)601
Range (m)1550
Bin size/Pulse length (m)1.51
Transducer tilt angle (°)2020
OrientationUpward-lookingDownward-looking
Number of transducers34
Transducer depth (m)1 1 0.65 2
C, system constant (dB)−160.5−151.64
Tx, temperature of transducer (°C)28.0628.55
P, emitted wavelength (mm)25
LDBM, logarithmic transmit pulse (dB)−6.98−3.01
PDBW, logarithmic transmit power (dB)7.9517.5
Kc, beam specific scaling factor (dB count−1)0.720.43
Er, the minimum value of RSSI4340
Percent good threshold (%)6565
1 Above seabed, 2 Below sea surface.
Table 2. The abundance of zooplankton (ind m−3) based on laboratory analysis for 6-day observation.
ORGANISMTime
5/4/2016
18:05–18:22
7/4/2016
18:13–18:31
13/4/2016
17:48–18:13
18/4/2016
17:34–18:01
22/4/2016
17:20–17:49
25/5/2016
16:20–16:43
PROTOZOA
Favella sp.56519873408585
Tintinnopsis sp.0148044420
Eutintinnus sp.04900085
Leprotintinnus sp.00044169339
Globigerina sp.00001270
CRUSTACEAN
Nauplius (stadia)31,572939015,327590935586693
Oithona sp.18648901468131315672711
Microsetella sp.39514818488085
Paracalanus sp.3395931010100717791949
Corycaeus sp.00924400
Acartia sp.00000169
UROCHORDATE
Oikopleura sp.169990001017
CHAETOGNATH
Sagitta sp.0092000
NEMATODE
Nematoda Larvae (sp1)0004442169
GASTROPODS
Gastropoda Larvae (sp1)16949642481381508
PELECYPODS
Pelecypoda Larvae (sp1)169445367884285
POLYCHAETE
Polychaeta Larvae (sp1)034673402970
The number of Taxa8 11 10 10 11 12
Abundance (ind m−3)35,242 12,355 20,650 9062 8089 13,895
Diversity Index0.491.021.061.151.551.58
Uniformity Index0.240.420.460.500.650.64
Dominance Index0.810.590.560.460.280.30