1. Introduction
In 2005, a small fire broke out at a construction site of a new line of the Shanghai Metro system. The upper part of approximately 430 m of tunnel lining was affected. Concrete spalling damage affected a length of 16.8 m, and the maximal damage thickness of the lining concrete was 25 mm. In recent decades, many serious fires have occurred in subway tunnels worldwide (e.g., the Baku and Daegu subway fires in 2013) [
1].
Segment joints are a weak point in shield tunnel linings. A few studies have investigated the mechanical behavior of the shield tunnel lining exposed to high temperatures [
2,
3,
4]. The results indicate that the segment joints can significantly affect the mechanical performance and failure pattern of the lining under fire. In addition to the mechanical behavior, the sealing performance of the segment joints after fire is also of great concern in practical engineering. Obviously, such sealing performance is closely related to the residual properties of the rubber gaskets, which are greatly influenced by the thermal field within the joint gap. However, to the authors’ knowledge, the temperature distribution within the joint gap during fire has not yet been sufficiently studied. Even similar studies on the effect of concrete crack on thermal field of the structural component are very limited. Wu and his colleagues [
5] studied the thermal fields of cracked concrete members in fire, experimentally and using numerical methods. They found that the measured temperatures within the cracks were generally lower than in the neighboring concrete. Narrow cracks seemed to hinder heat transfer into the specimen. This is because the motion of air within the extremely narrow crack is very slow, due to the fluid layer sticking to the left and right surfaces of the pre-made crack having zero velocity according to the no-slip condition. Thus, the velocity profile of the air within the crack approaches zero in all directions, leading to the heat convection within the crack being approximately negligible. Since the heat conductivity of air is very low, the air within the crack acts as a thermal insulator to some extent. Yan’s group [
4] worked with reduced-scale segment joints (1:3). They measured the surface temperature of their specimens with a thermal infrared imager immediately after turning off the combustor, and they found that the surface temperature of the concrete was highest near the joints. This implies that heat had transferred into the joint gap, and the nearby concrete was heated on two sides. Both the concrete cracks in the literature [
5] and the joint gaps in reference [
4] belong to narrow crevices, however, the influences of them on heat transfer within the crevices seem to be different. That motivated the first part of this study in which fire tests on full-scale segment joints, which were preformed to investigate the influence of the joint gap on the temperature distribution in inter-segment joints. After that, the fire-damaged full-scale segment joints were strengthened in the second part of this study, and then the strengthening effect was examined by loading these joints till fail.
Steel plates or fiber-reinforced plastic (FRP) are the two materials most commonly applied for strengthening subway tunnels. A group led by Liu [
6] tested full-scale shield tunnel lining rings strengthened with 20 mm-thick steel plate rings. They found that such full-ring steel reinforcement significantly improves the bearing capacity and overall stiffness of tunnel structures. Further, such strengthened linings fail due to local bond failures between the steel plates and the segments. Chang [
7] describes how tunnels of the Taipei Rapid Transit System are strengthened with an inner steel lining. Such strengthening methods satisfy the mechanical requirements for a tunnel, but they use a lot of steel, and can therefore be uneconomic. Furthermore, the weight of the steel can cause additional settling during construction and in future operations. Kiriyama [
8] describes a method for reinforcing existing tunnel structures using thin steel panels, it involves elaborate design and construction work. A group led by Khan [
9] investigated using arch supports made with steel I-beams, and they found that the strength and stiffness of steel supports depends largely on the confinement to which the support is subjected. Thin steel plates and I-beams can suffer from local buckling at the waist of a tunnel lining, which prevents the full exploitation of the steel’s strength. Li and his colleagues [
10] investigated numerically the reinforcement of the tunnel linings with FRP. Other researchers [
11,
12,
13] have pursued retrofitting a tunnel using FRP grids and corrugates. Evidently, FRP strengthening parts only enhance the integrity of the tunnel ceiling, they have almost no reinforcing effect on the waist of a tunnel lining subjected to negative bending moments. Concrete- filled steel tubes (CFSTs) have also been proposed to support tunnel structures. Gao [
14] and Chang [
15] have described using CFSTs in a mine tunnel. In a CFST the most prominent natural characteristics of steel and concrete are used to advantage. The concrete is confined by the steel tube, and the concrete core supports the steel tube against the local buckling. The result is improved strength, ductility, stiffness, and energy absorption capacity for the combination [
16]. That suggests investigating the feasibility of using CFSTs to strengthen fire-damaged segment joints in tunnels. In this way, the second part of this study focused on the effectiveness of CFSTs for restoring segment joints damaged by a thermal shock. As compared with the traditional steel plate rings [
6], the steel consumption and weight of the CFSTs employed in this paper are only about 40% and 65%, respectively. Obviously, a large amount of steel can be saved and the self-weight of the strengthening parts can be reduced greatly in practical engineering, by replacing steel plate rings with CFSTs.
3. Fire Test Results and Discussion
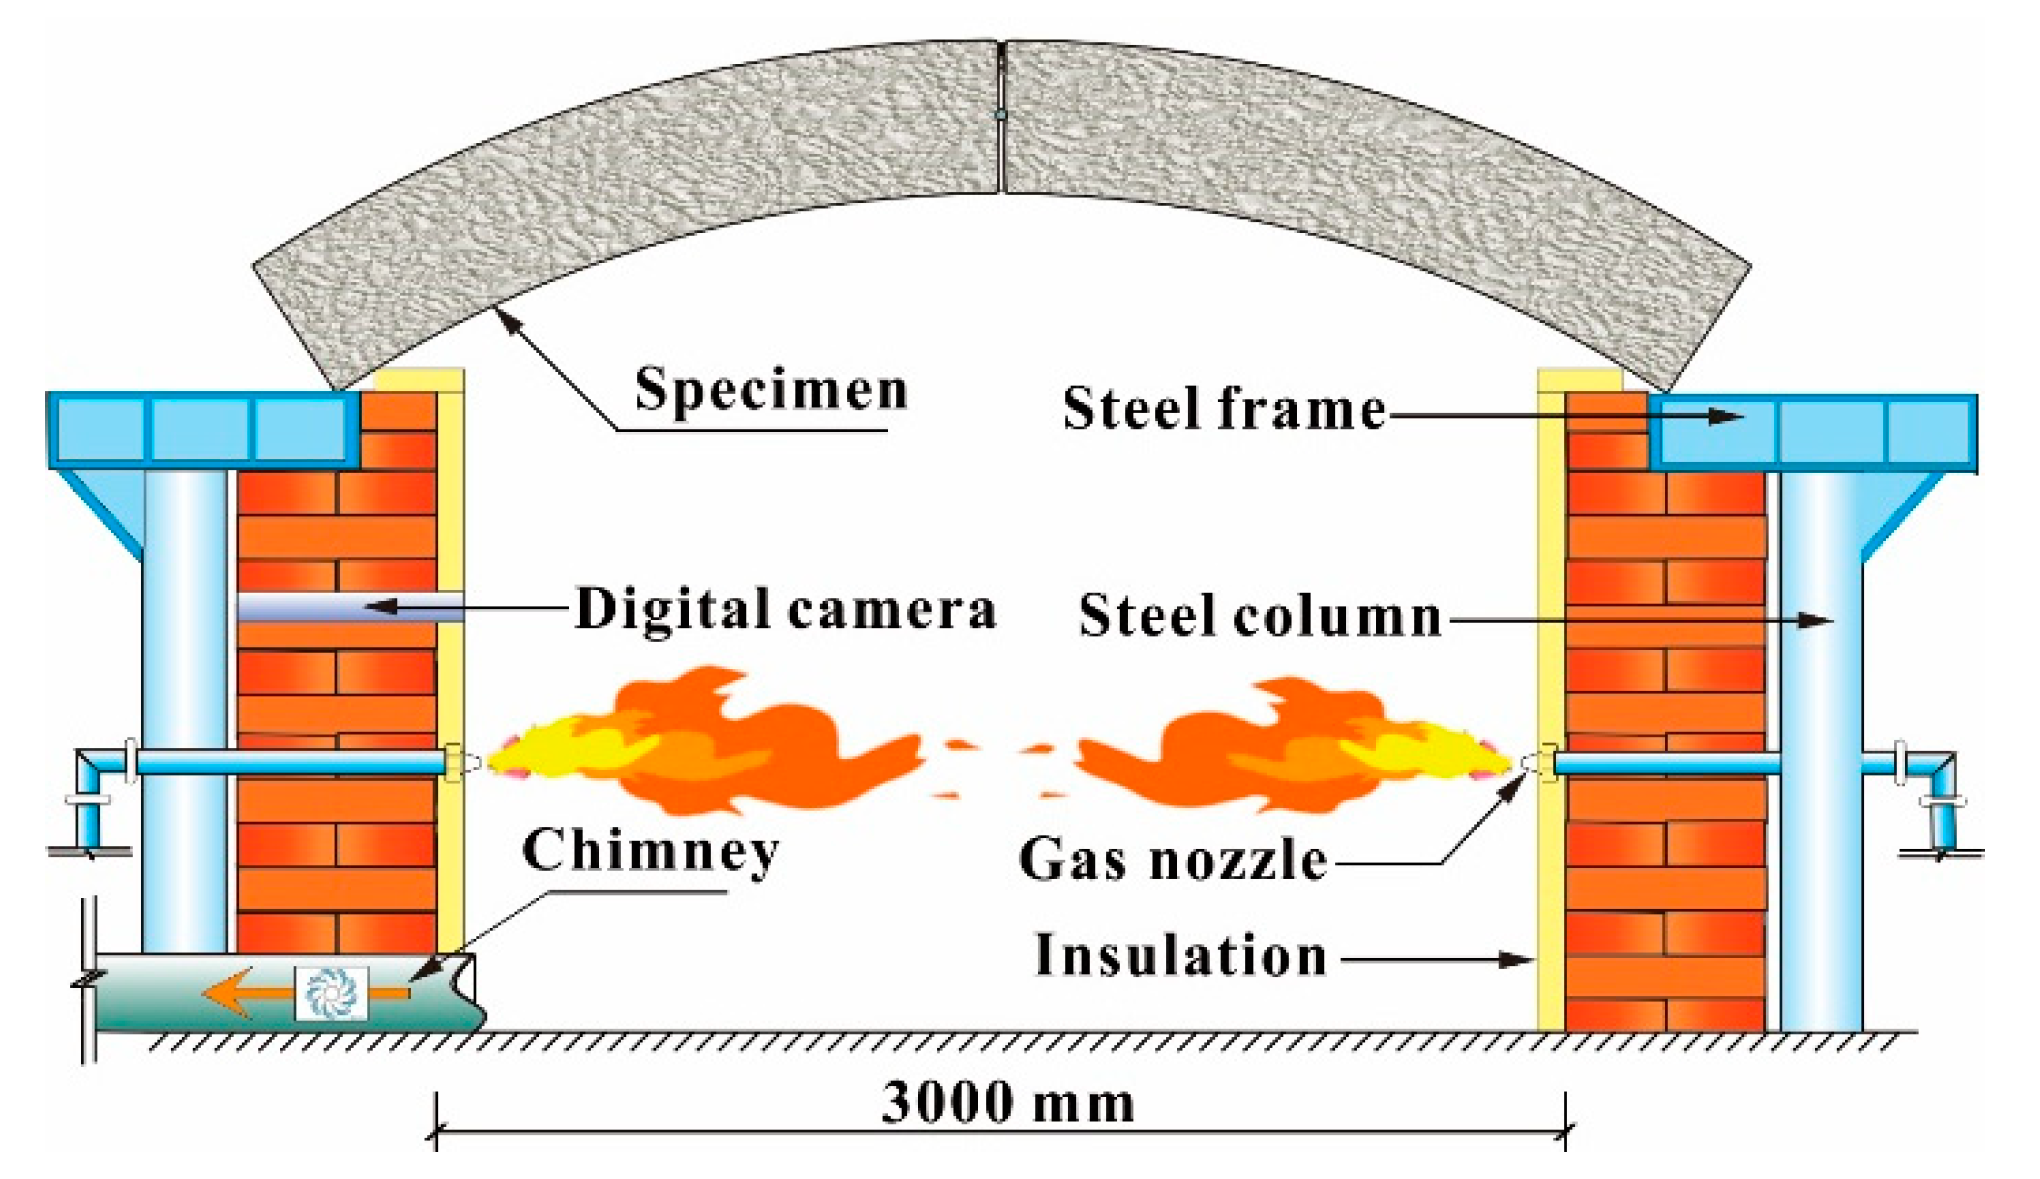
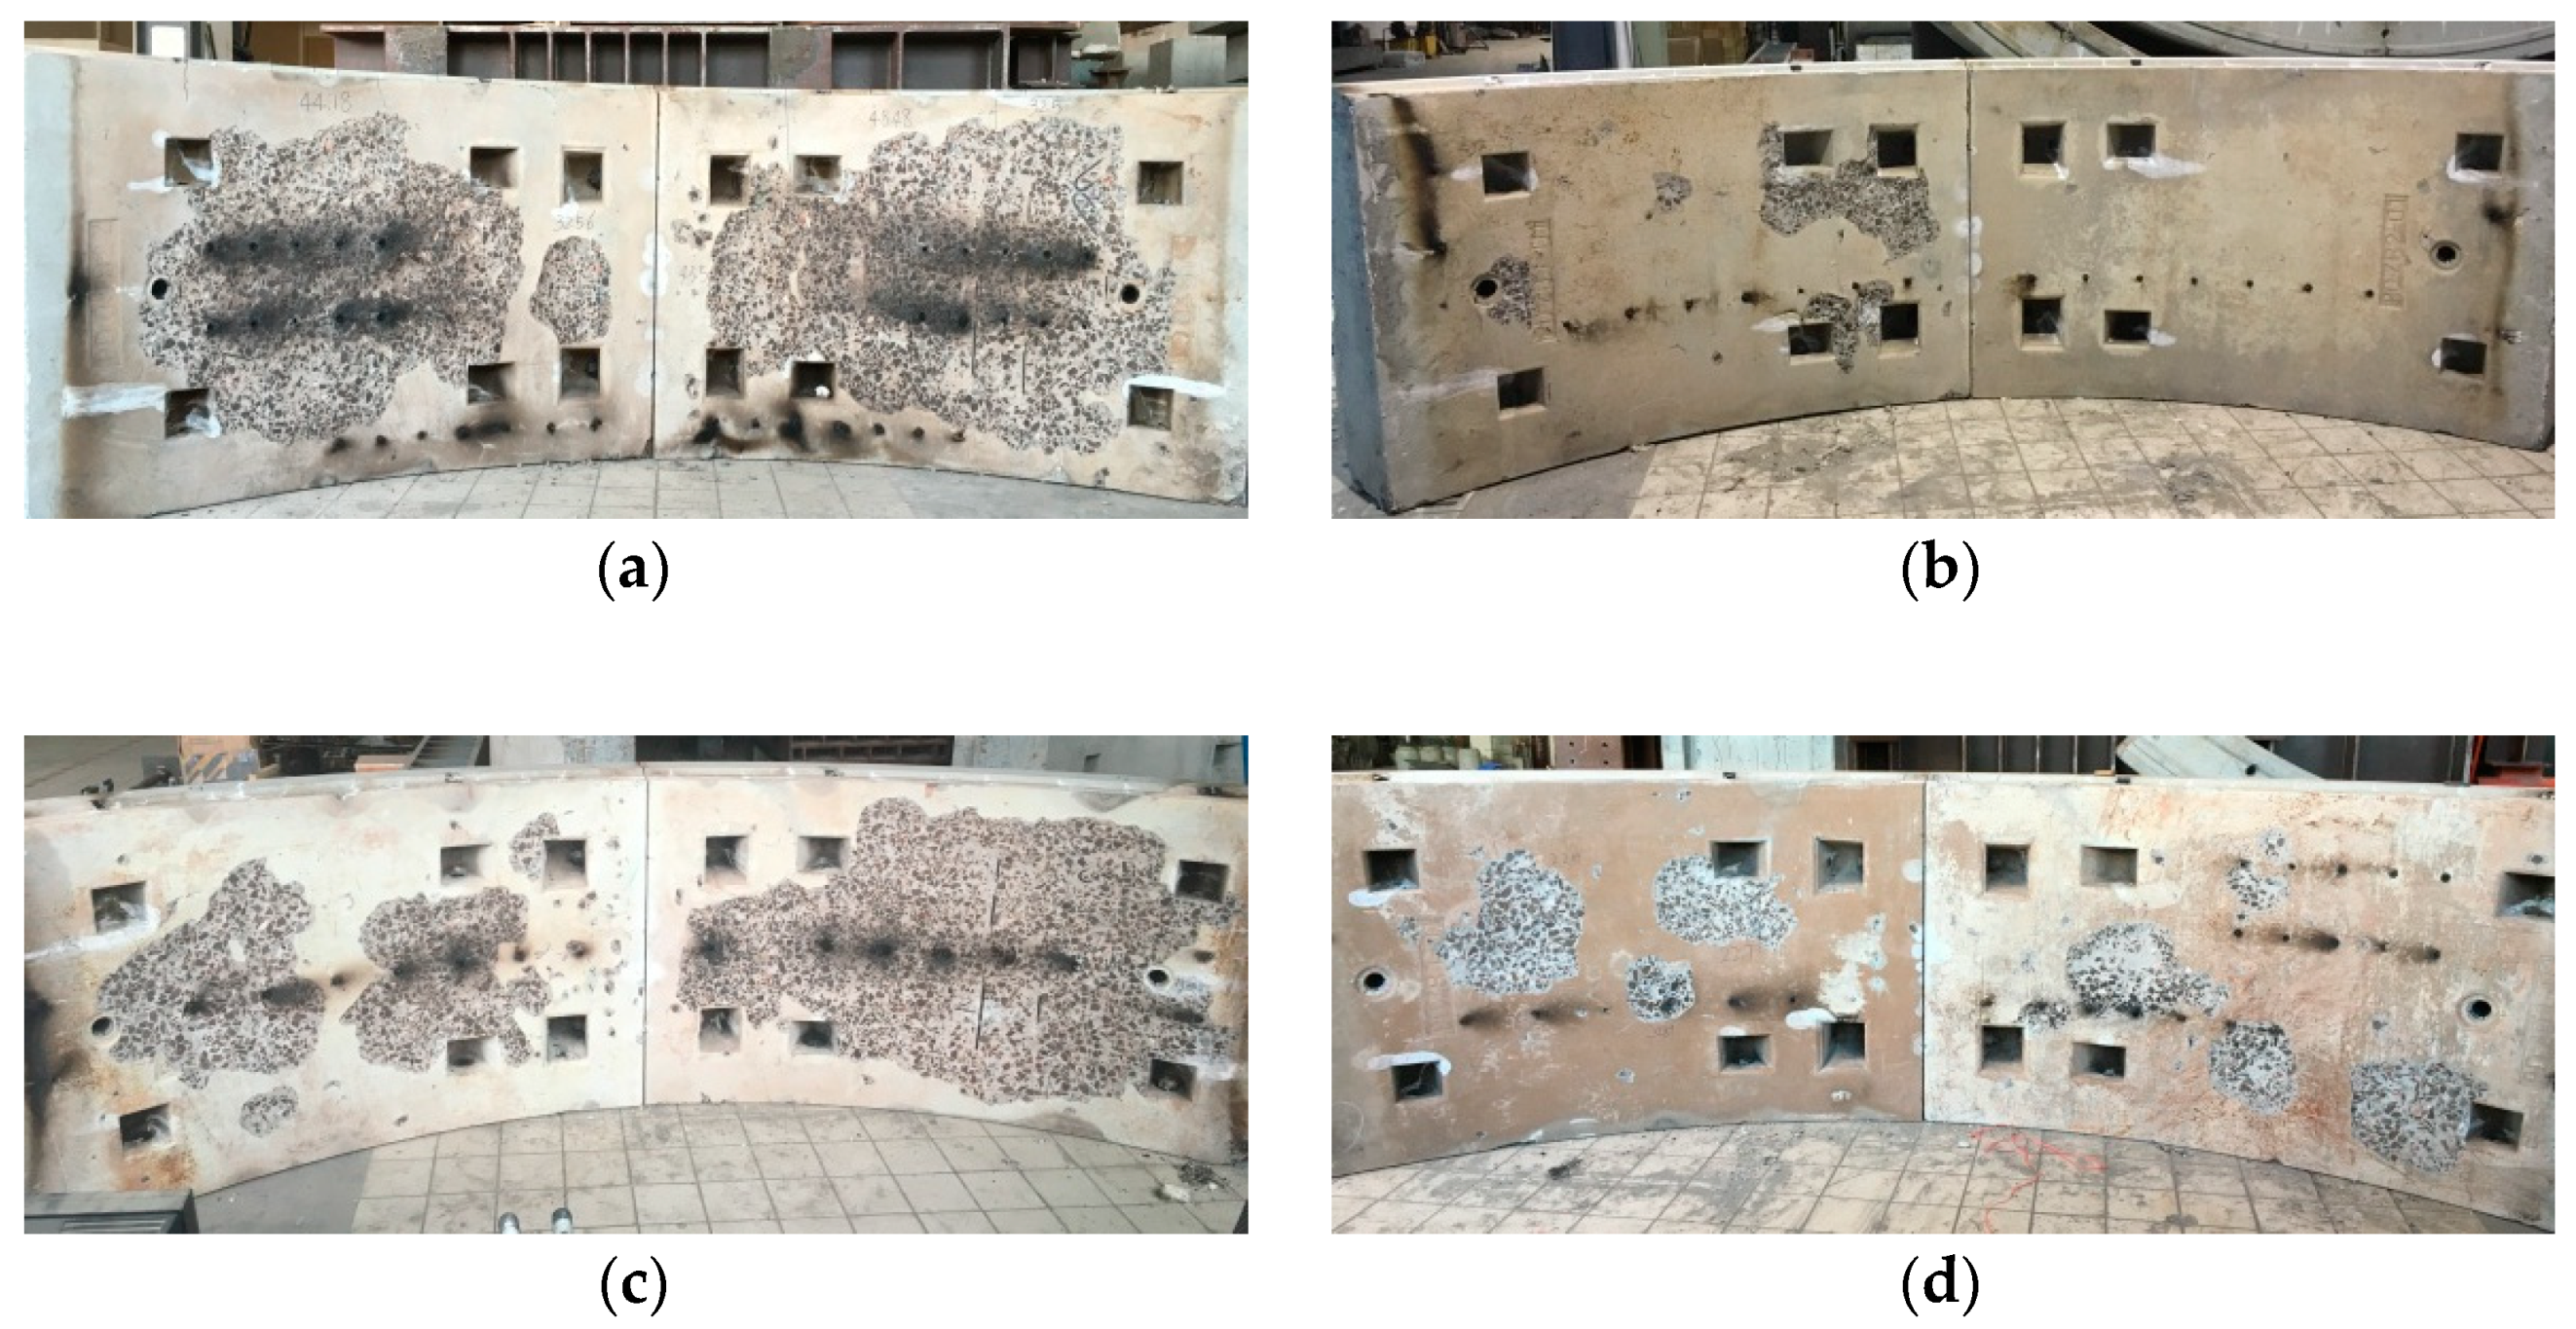
Figure 7 presents images of the specimens after the fire tests. Spalling occurred on the heated surfaces of the different specimens. The first significant spalling was observed through the digital camera during the first 8–15 min of the fire tests. The spalling lasted approximately 12–22 min, and mainly occurred at furnace temperatures of 645–856 °C. The spalling of Specimens S60, S120, and S120C was more severe than that of S60C because the moisture content of those three samples (see
Table 1) was higher. A higher moisture content is known to promote spalling [
22].
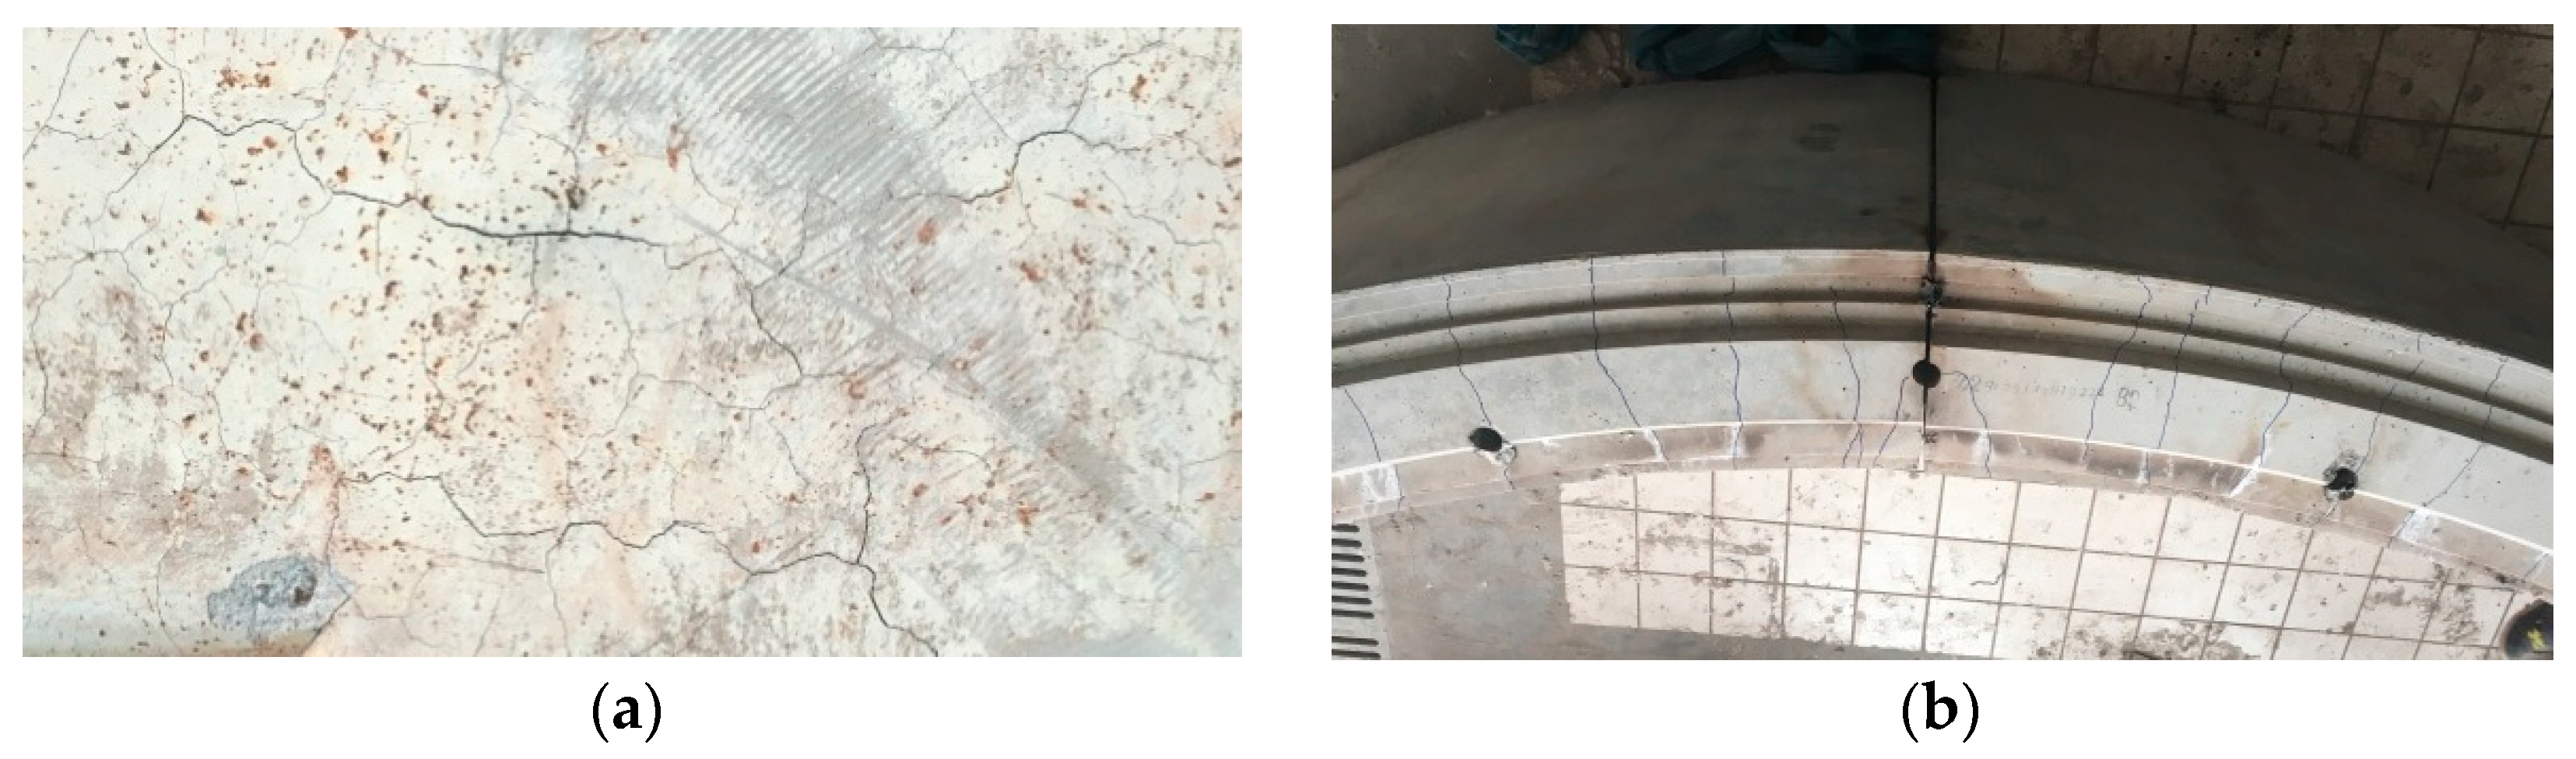
After the specimens had cooled to room temperature, extensive map cracks were found in the un-spalled regions of the heated surfaces, and the color of the concrete surface had turned light yellow (see
Figure 8a). In addition, a few vertical cracks spaced about 200 mm apart were observed on both the front and back of the different specimens (see
Figure 8b). They can be attributed to the following reasons: (1) The excessive expansion of the concrete at elevated temperatures; and (2) the incompatible expansions and contractions of the concrete and steel reinforcements during heating and cooling [
23]. Owing to the structural characteristics of a tunnel lining, the vertical cracks within the circumferential joints between the segments would be difficult to discover and repair. Evidently, sufficient attention must be devoted to these vertical cracks, which would eventually aggravate the deterioration of the tunnel lining after a fire.
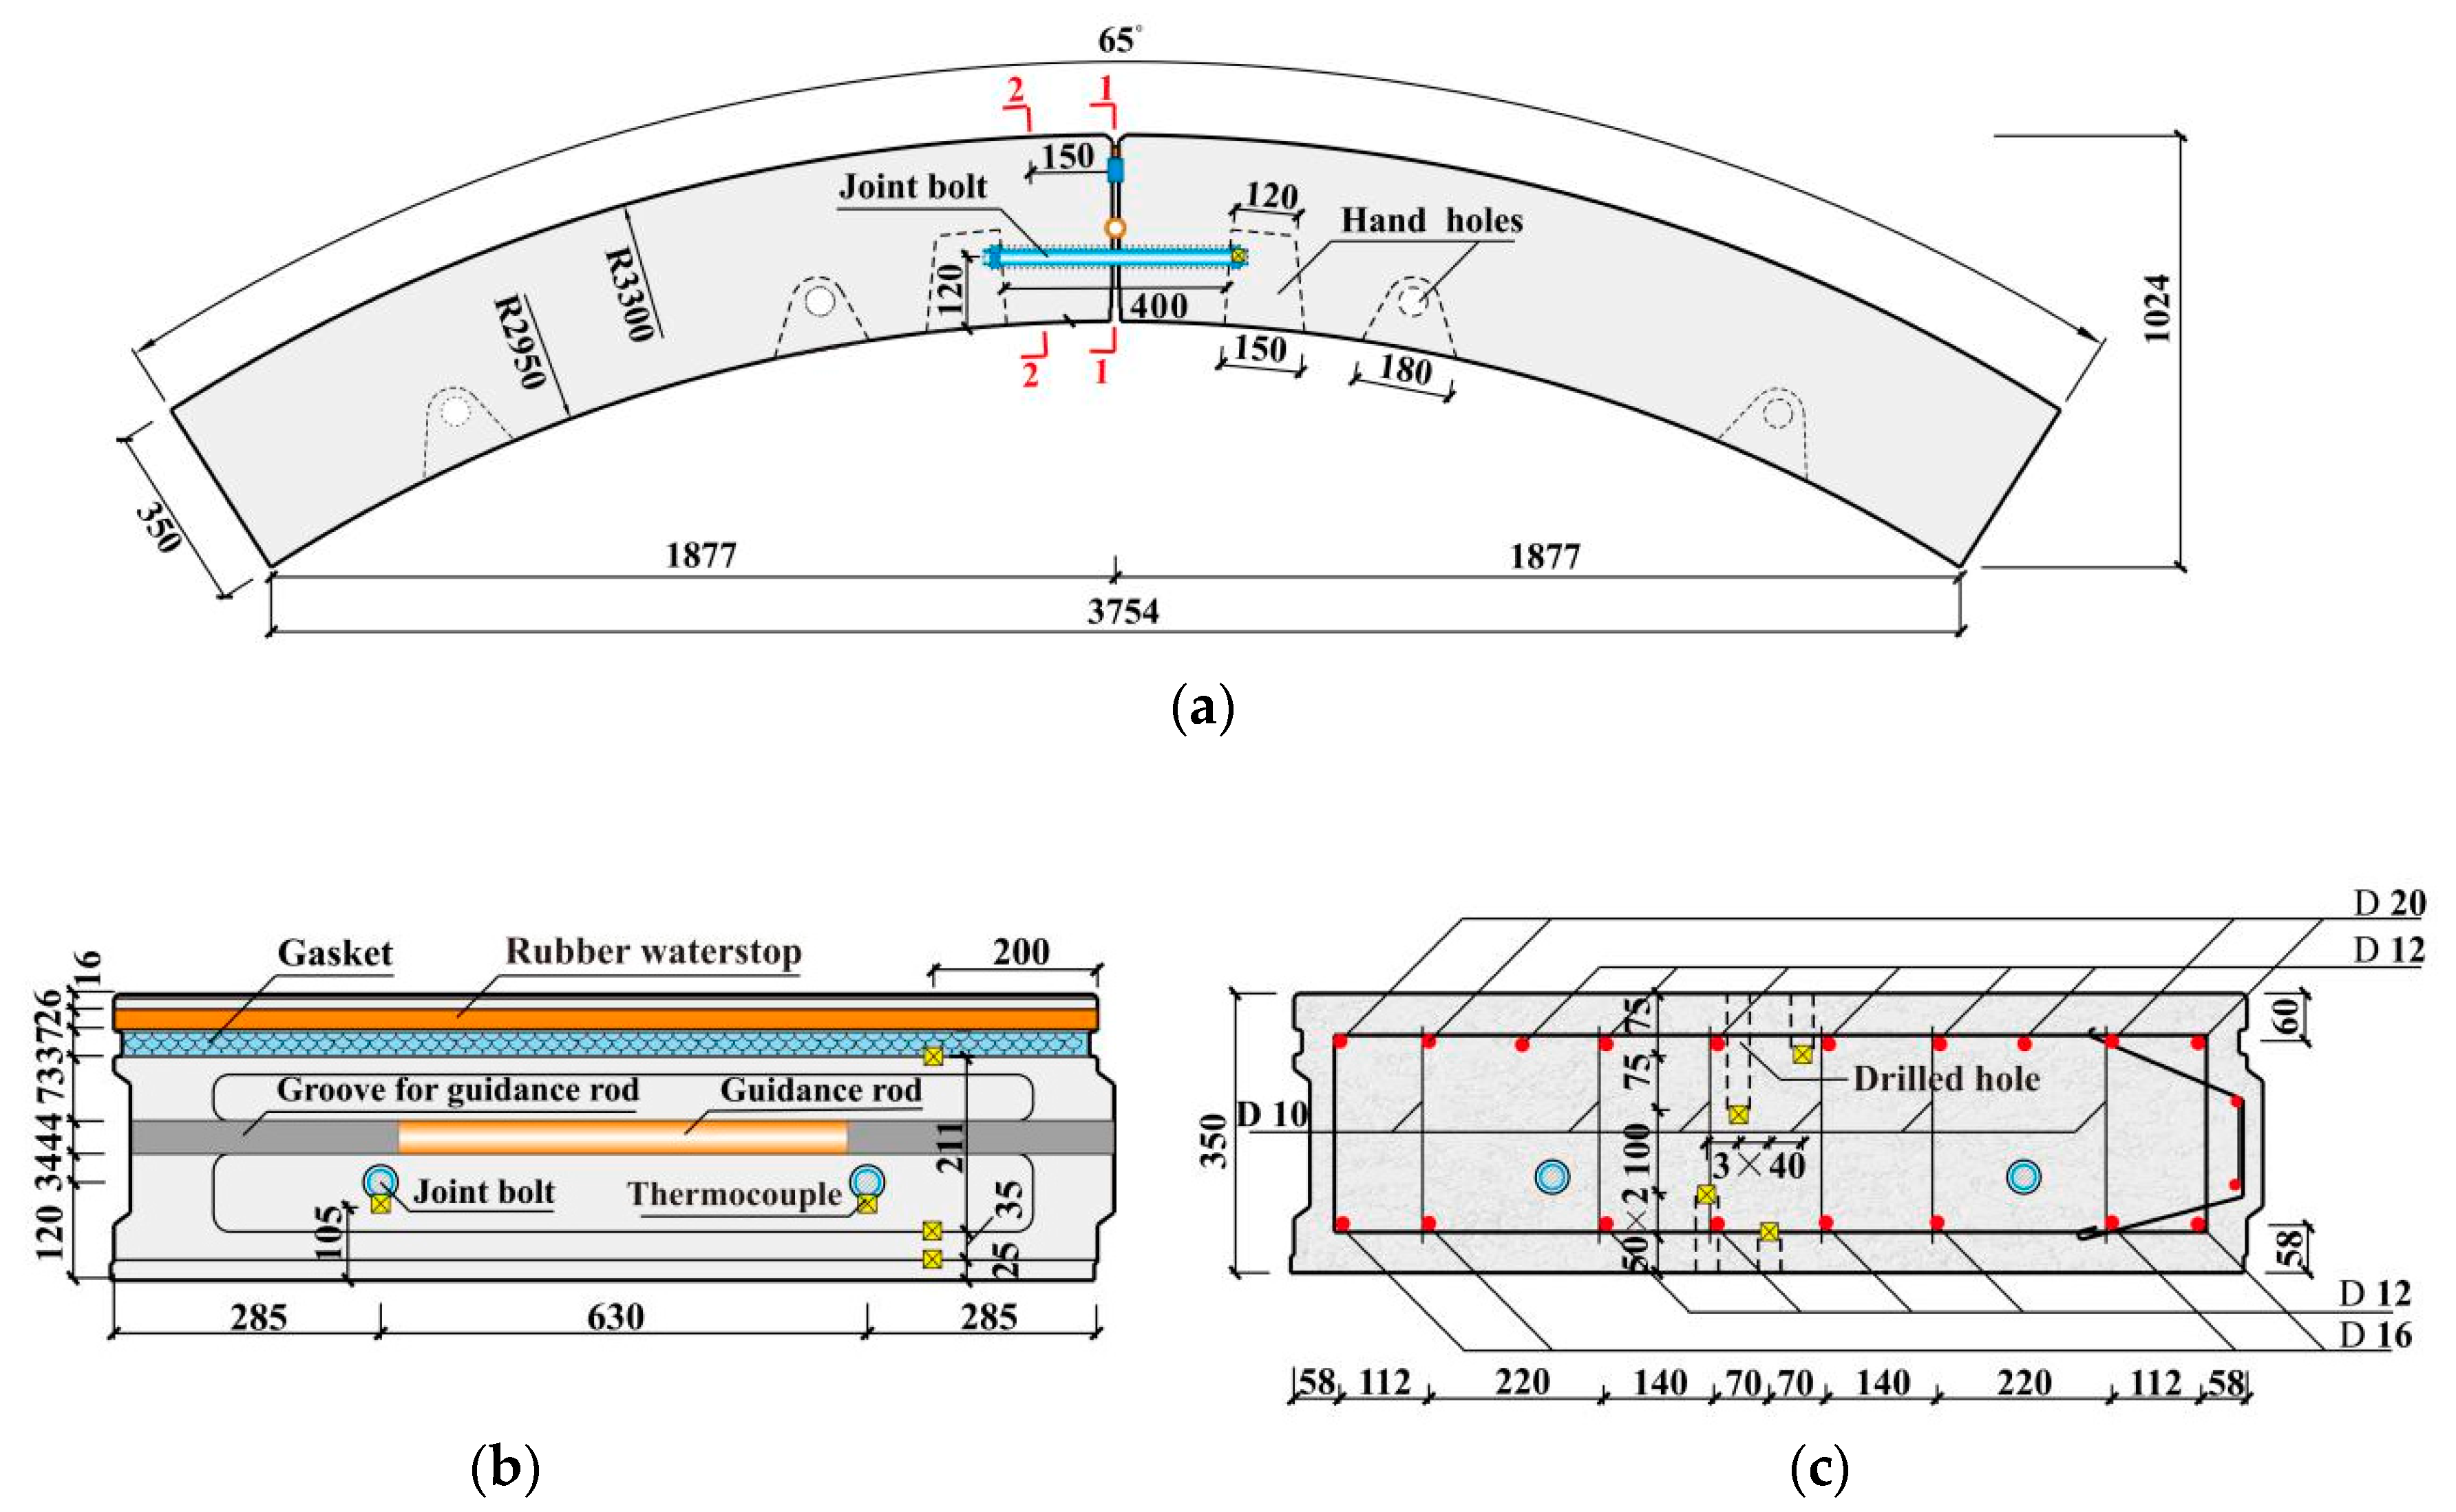
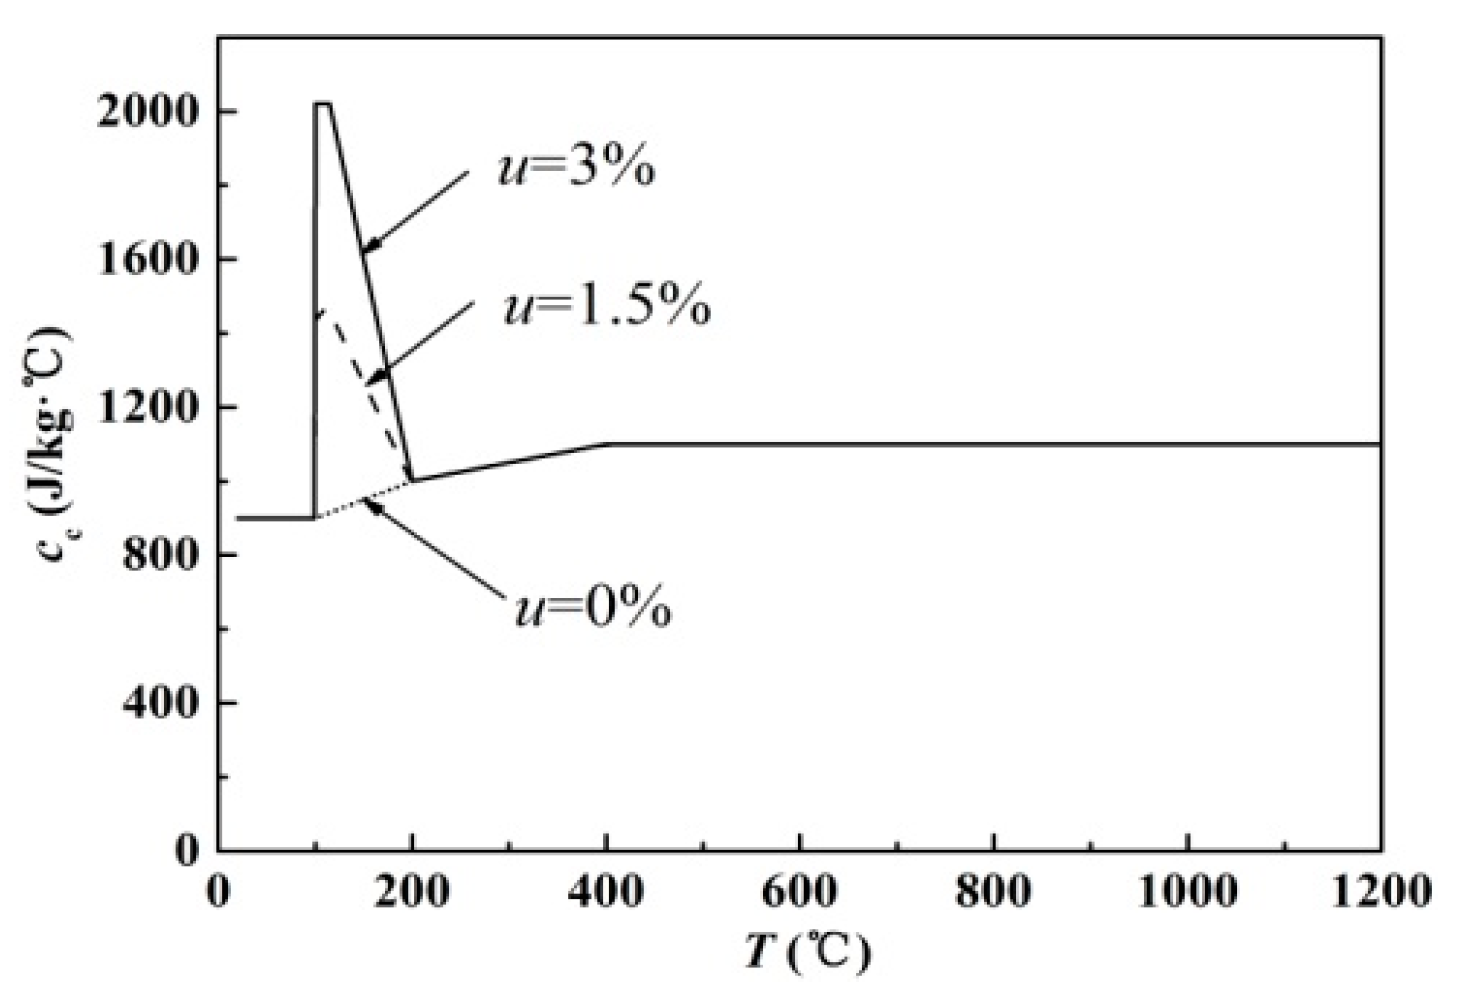
Figure 1b,c show that the positions of the thermocouples along the segment thickness at Section 1-1 and Section 2-2 were different. ABAQUS software was therefore used to develop numerically a temperature distribution at Section 2-2, so the temperature distributions at the two sections could be compared. The meshes of section 2-2 are presented in
Figure 9. The segment’s concrete was meshed with eight-node solid heat transfer elements (DC3D8). The thermal properties of the concrete, including the density, specific heat capacity and heat conductivity were assumed based on the Eurocode 2 standard [
24]. The density of the concrete at room temperature was set to 2350 kg/m
3. The specific heat
cc (J/kg∙°C) for a moisture content of
u = 0 in the concrete was calculated using Equation (2). The effect of water evaporation on the temperature in the concrete was considered by adjusting the specific heat of the concrete: The maximum (
cp, peak) of the specific heat was at 100–115 °C followed by a linear decrease in the specific heat between 115 and 200 °C (see
Figure 10).
cp, peak was taken as 1470 and 2020 J/kg∙°C for concretes with moisture contents of
u = 1.5% and 3%, respectively. The moisture content
u was set to 2.6%, the
cp, peak was set to 1873 J/kg∙°C in that calculation. The upper and lower limits of the thermal conductivity
λc of the concrete were determined using Equation (3). The value of α was set to 0.5. The convective heat transfer coefficients were 25 W/m
2∙K for the heated surfaces and 9 W/m
2∙K for the others. The resultant heat emissivity on the surface of the concrete was set to 0.5.
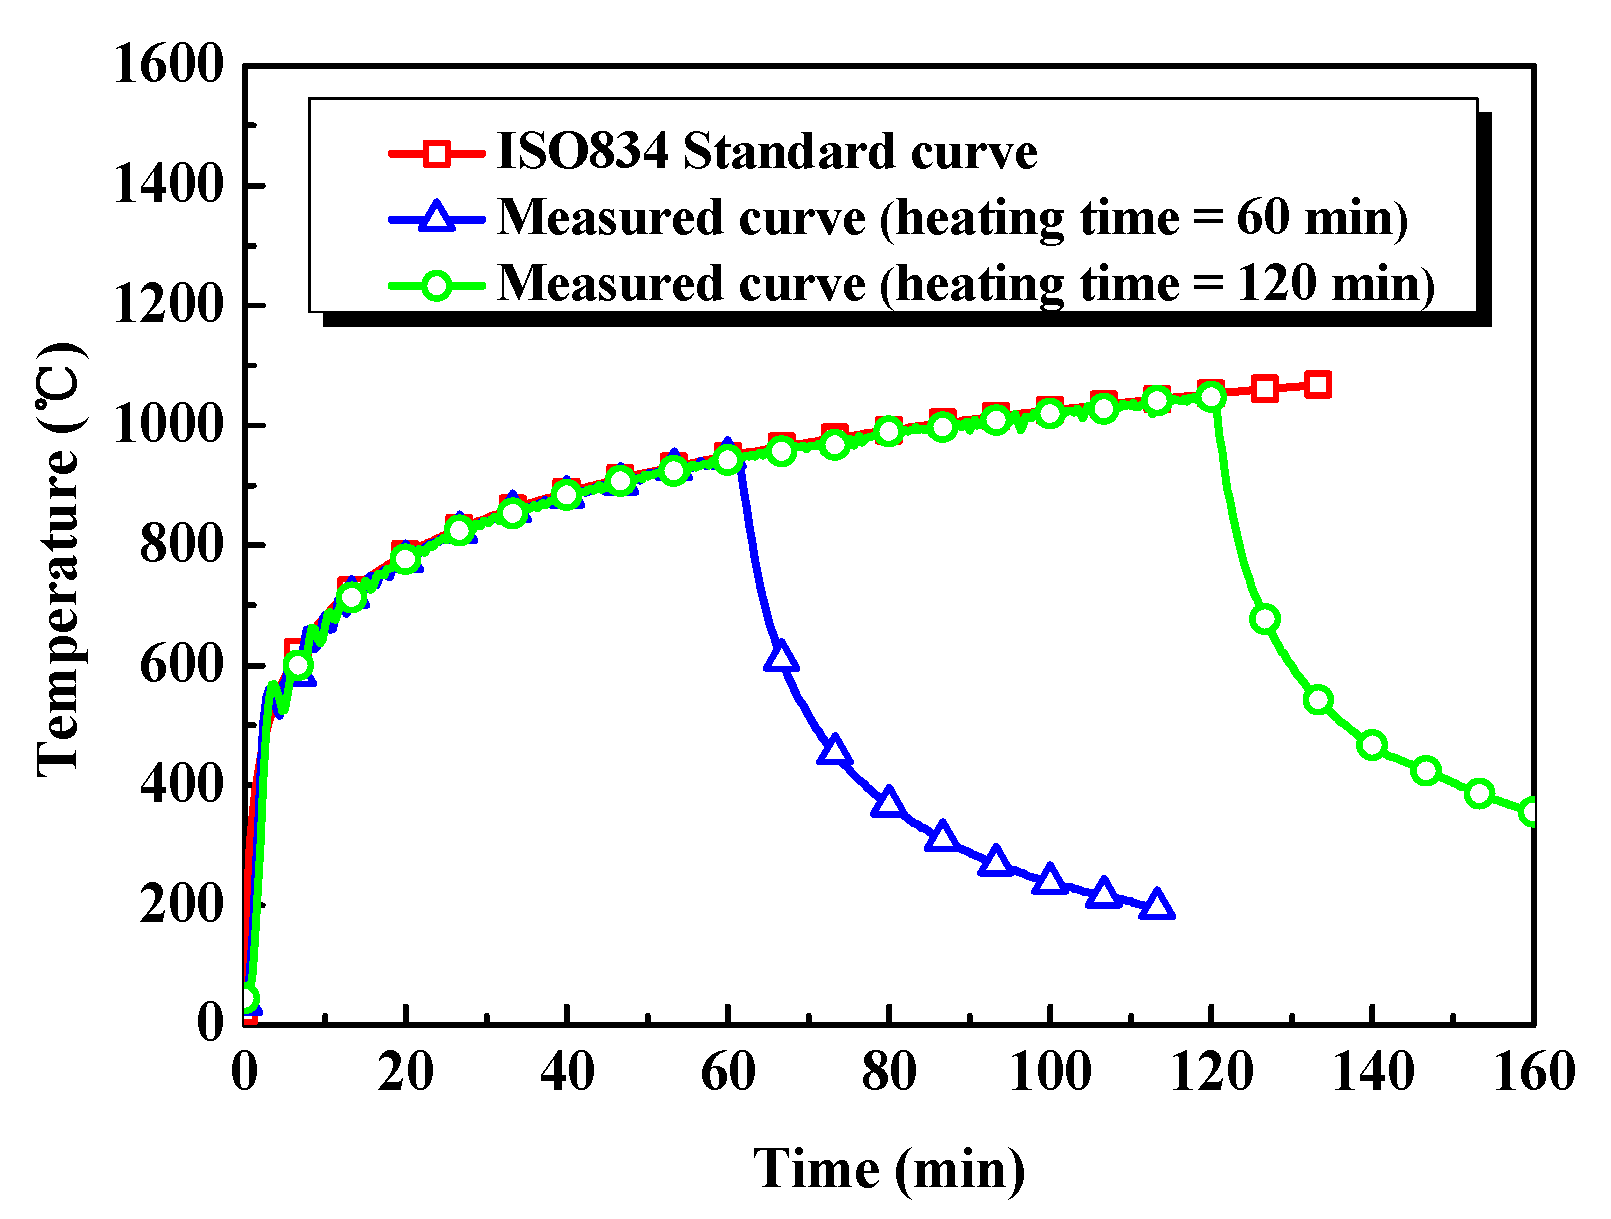
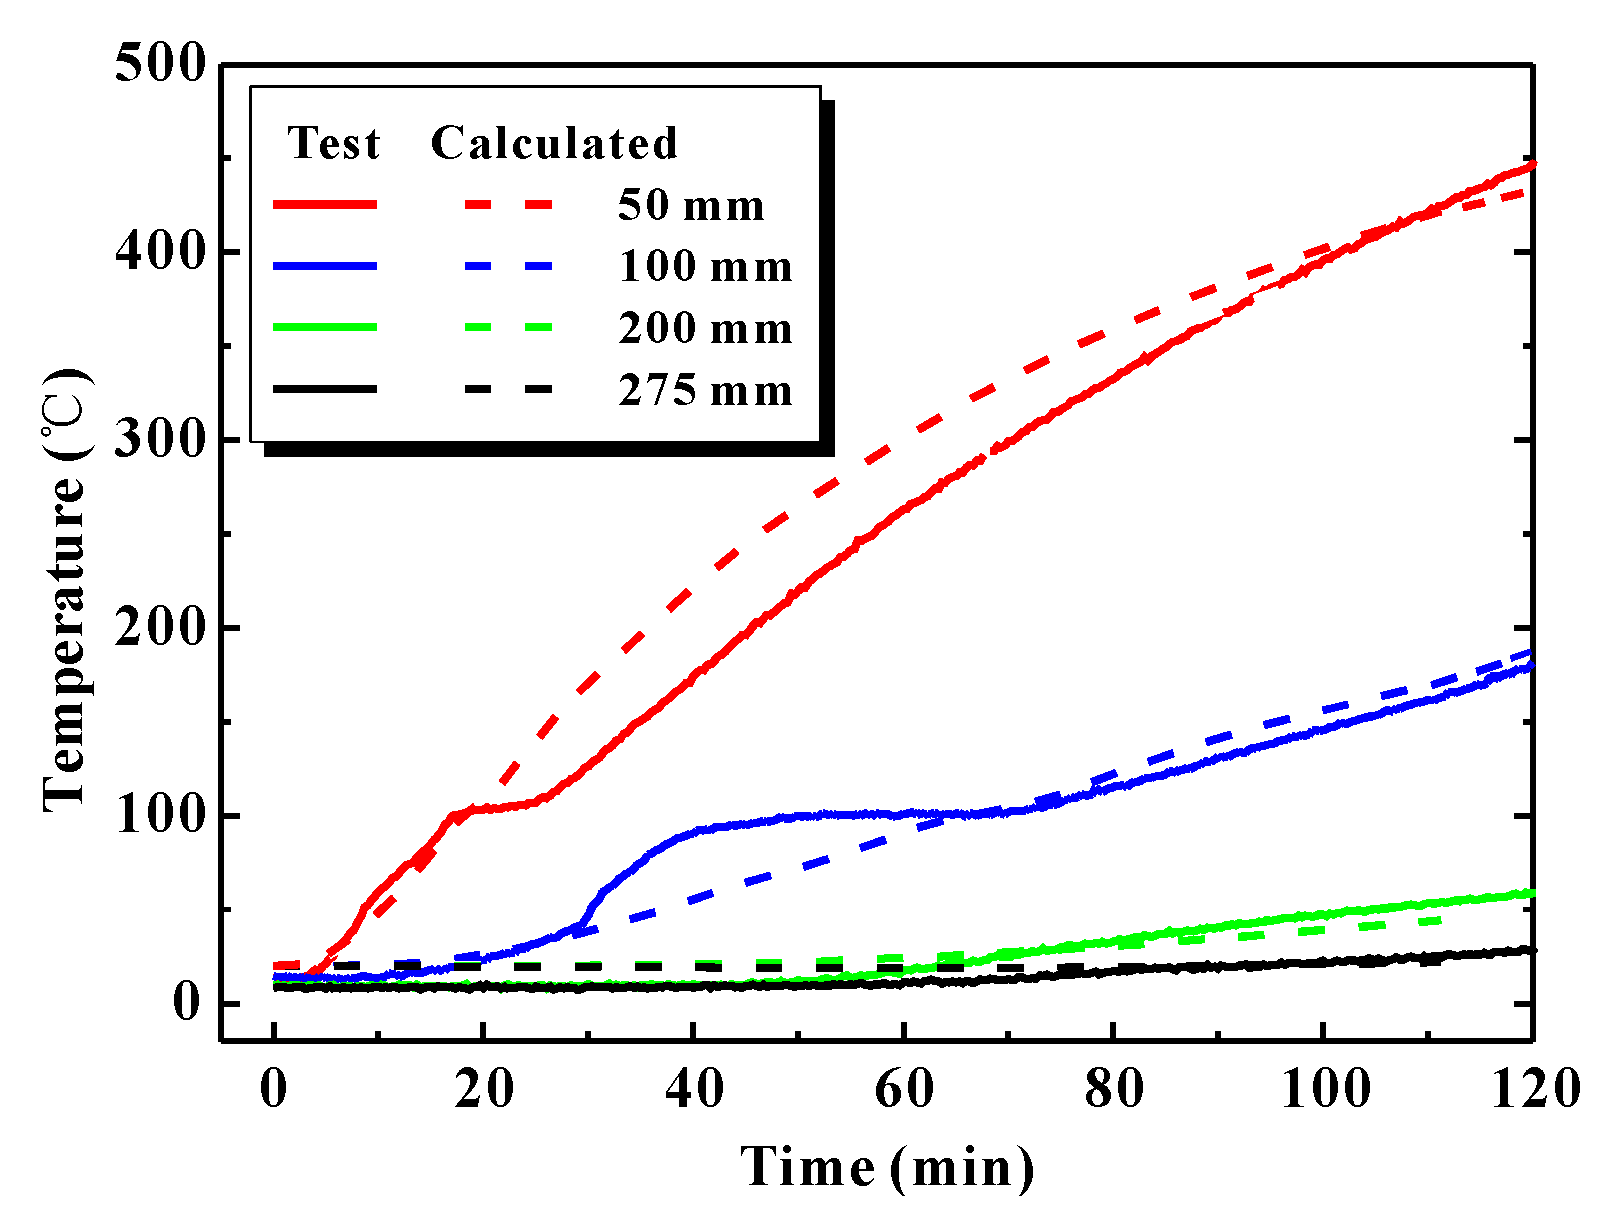
Figure 11 compares the calculated and measured temperature–time curves at Section 2-2 of Specimen S120C. In general, the calculated results agree well with the measured results, so the numerical method provides a good prediction of the temperatures at any point on Section 2-2.
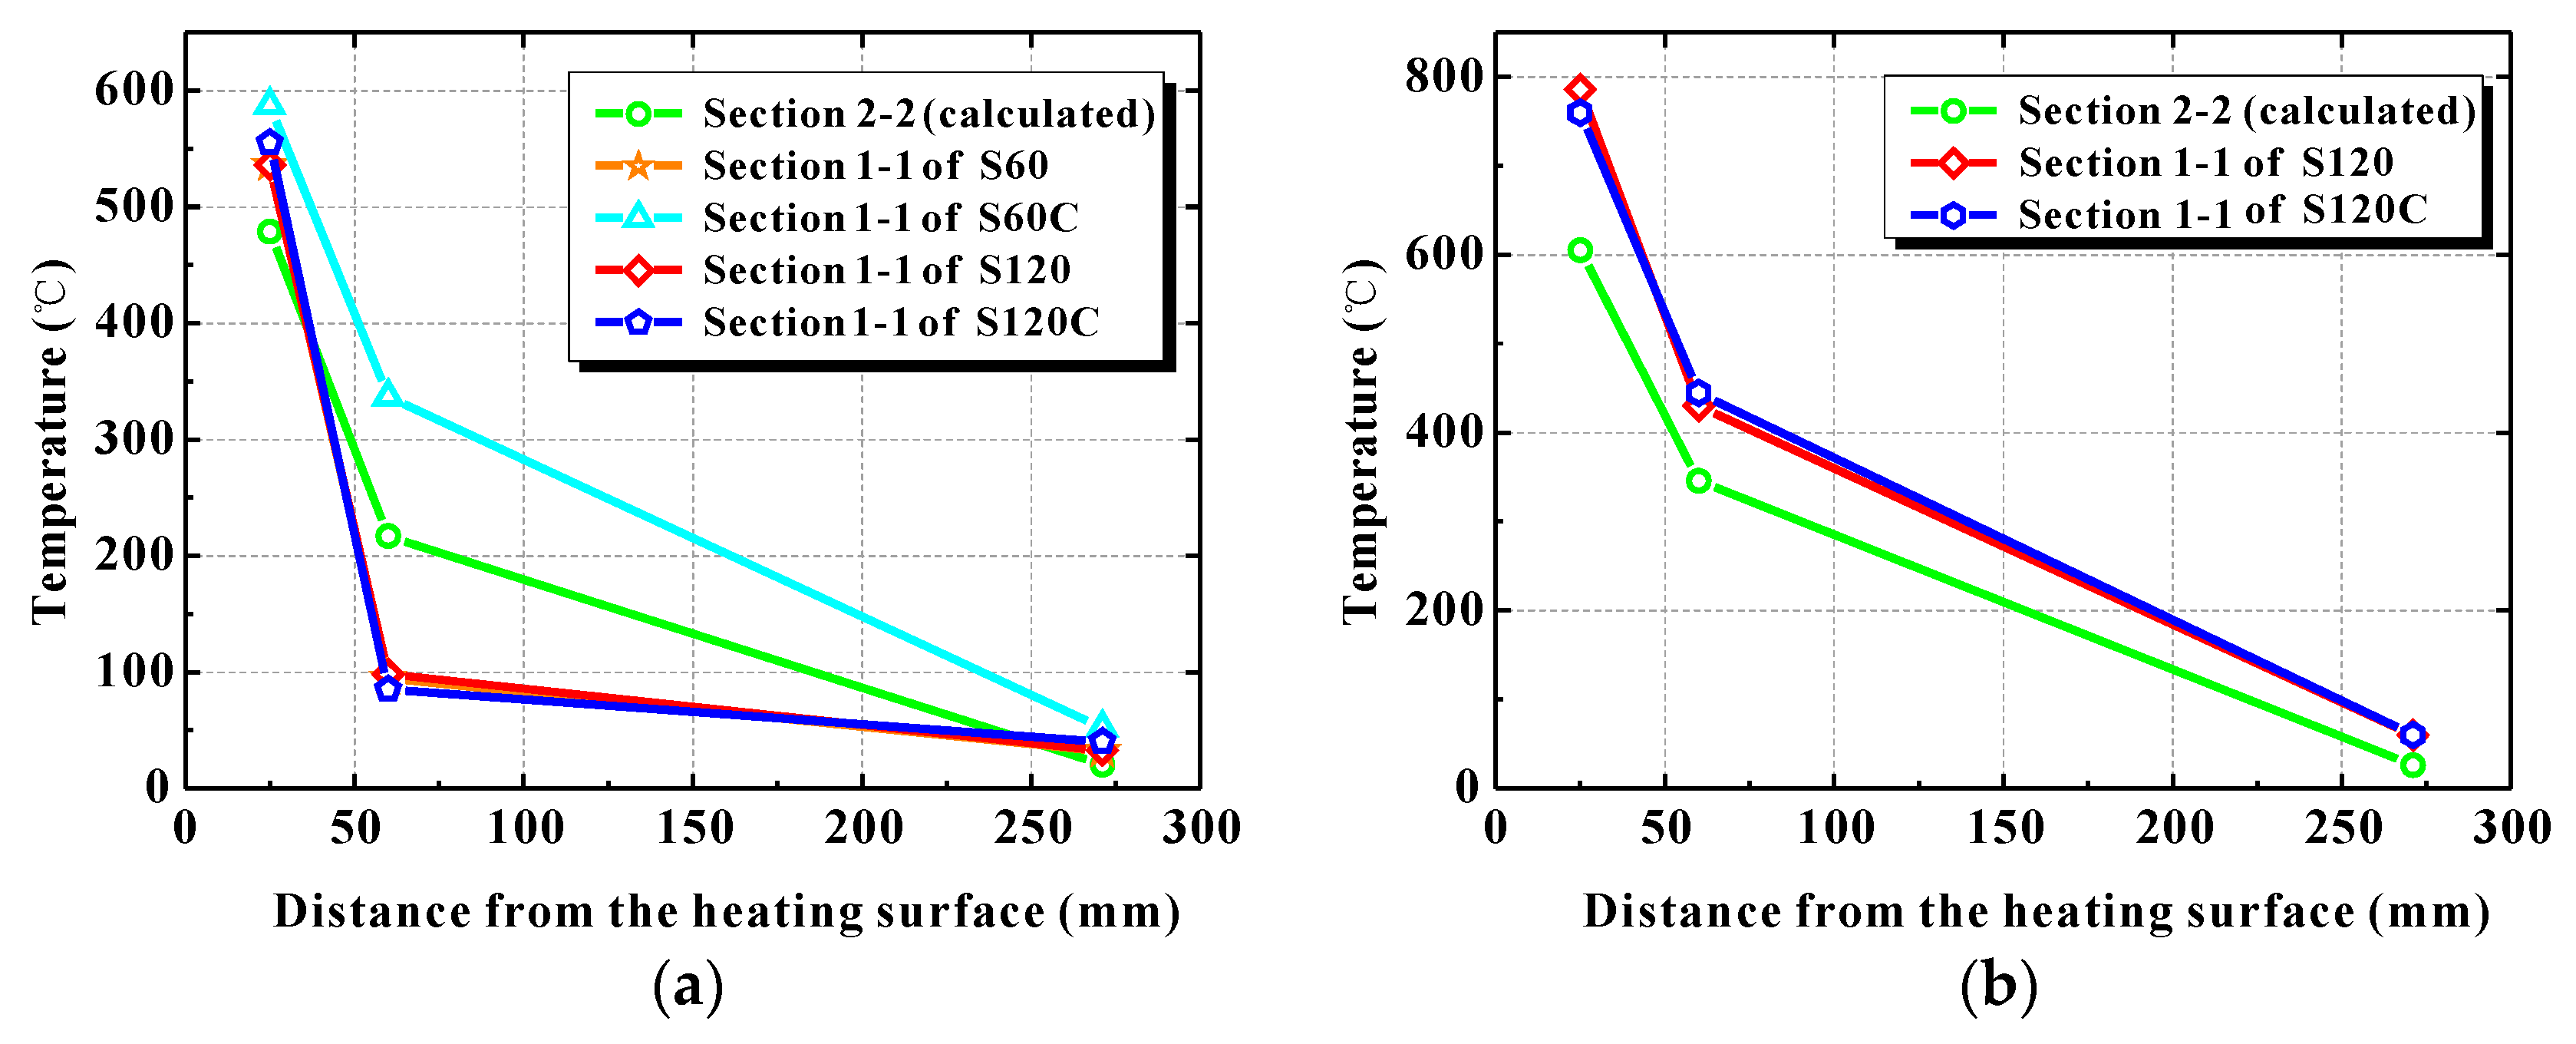
Figure 12 compares the measured temperatures at Section 1-1 with the calculated temperatures at Section 2-2 for the different specimens. The following can be observed:
(1) The temperatures at both Section 1-1 and Section 2-2 rapidly declined with distance from the heated surface in all of the specimens.
(2) For a heating time of 60 min, in Specimens S60, S120, and S120C, the temperature at Section 1-1 declined more sharply than that at Section 2-2 for the first 25–60 mm from the heated surface. Between 60 and 270 mm, however, the temperature at Section 1-1 declined more gradually than that at Section 2-2. In addition, the temperature at most of Section 1-1 was below 100 °C and lower than that at Section 2-2. This is probably because water vapor released from the concrete accumulated in the narrow joint gap and barely dissipated. That would have hindered heat transfer into the joint gap to some extent. Please note that the initial joint opening (see
Table 1) of S60C was larger than those of the other specimens. Consequently, for Specimen S60C, the temperature at Section 1-1 was higher than that at Section 2-2 for a heating time of 60 min. The larger initial joint opening promoted heat transfer into the joint gap and led to higher temperatures in the gap than in the neighboring concrete.
(3) For a heating time of 120 min, the temperature at Section 1-1 was higher than that at Section 2-2. This is because all of the moisture within the joint gap eventually dissipated with the longer heating time. Heat then penetrated the gap, increasing its temperature. Yan [
4] observed a similar phenomenon in fire tests with reduced-scale segment joints. In his study, the surface temperature of the concrete near the joint was higher than that farther away. This is mainly due to heat being transferred into the joint gap, the nearby concrete was heated on two sides. Note, though, that this is different to what was observed by Wu and his co-workers [
5]. They observed that the temperature in the crack was lower than that of the neighboring concrete. This is presumably because the joint opening tested here (9.5–11.8 mm) was much larger than the crack width in Wu’s tests (0.5–3 mm).
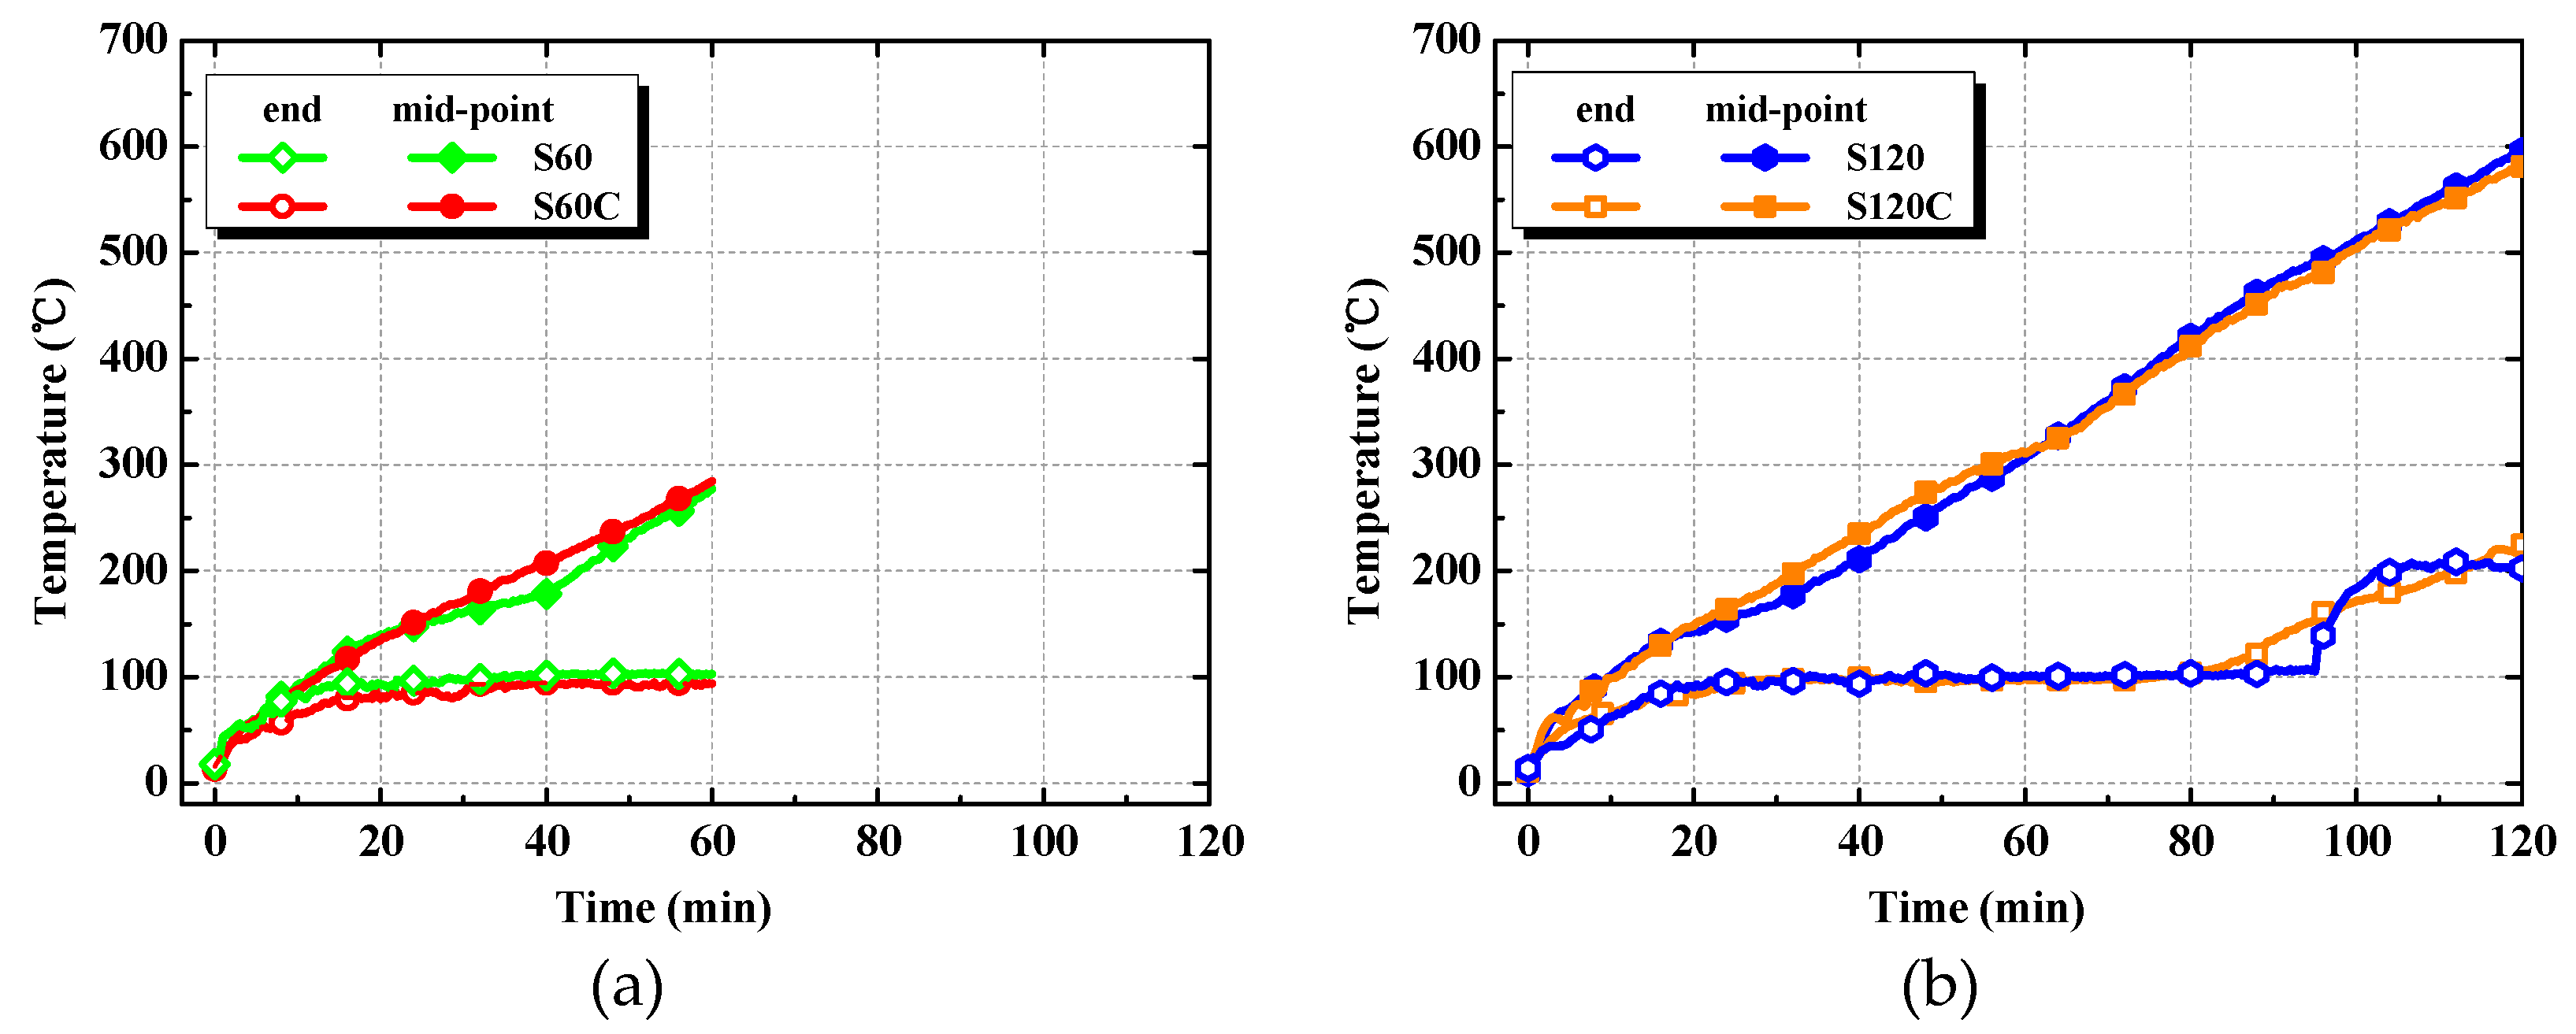
Figure 13 presents temperature–time curves for the joint bolts. The temperatures of the bolt ends were much higher than those in the mid-point during the entire heating process. The temperatures of the bolt ends increased approximately linearly with heating time, and reached a critical temperature of 300 °C [
25] after approximately 60 min, and 596 °C after approximately 120 min. To guarantee that the temperature of the joint bolts does not exceed the allowable value in a real tunnel fire, the bolt ends may need to be insulated.
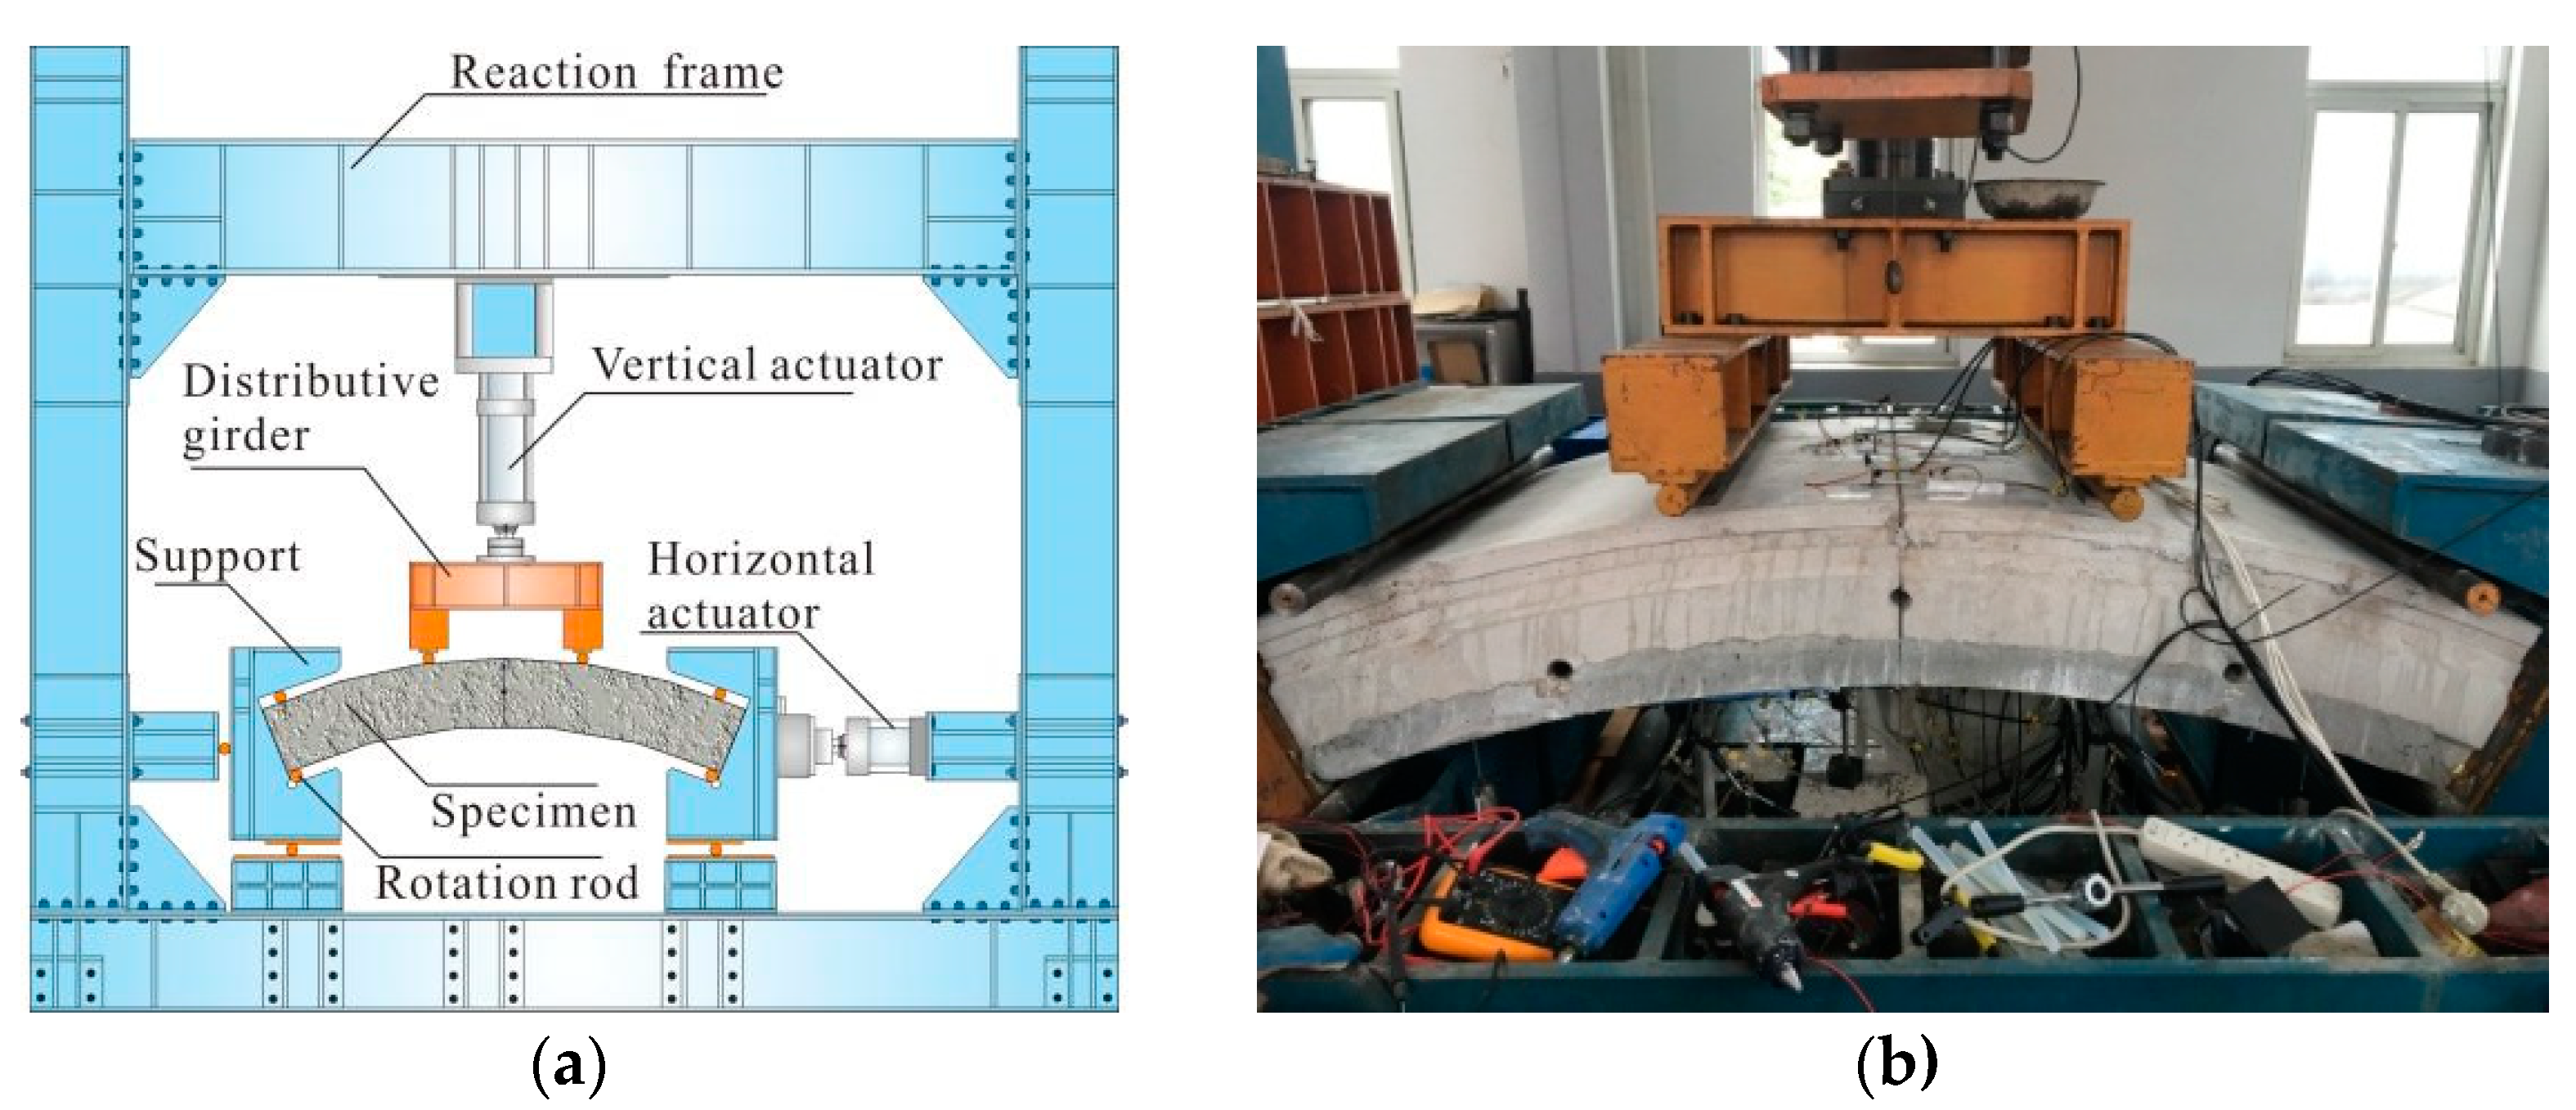
4. Load Test Results and Discussion
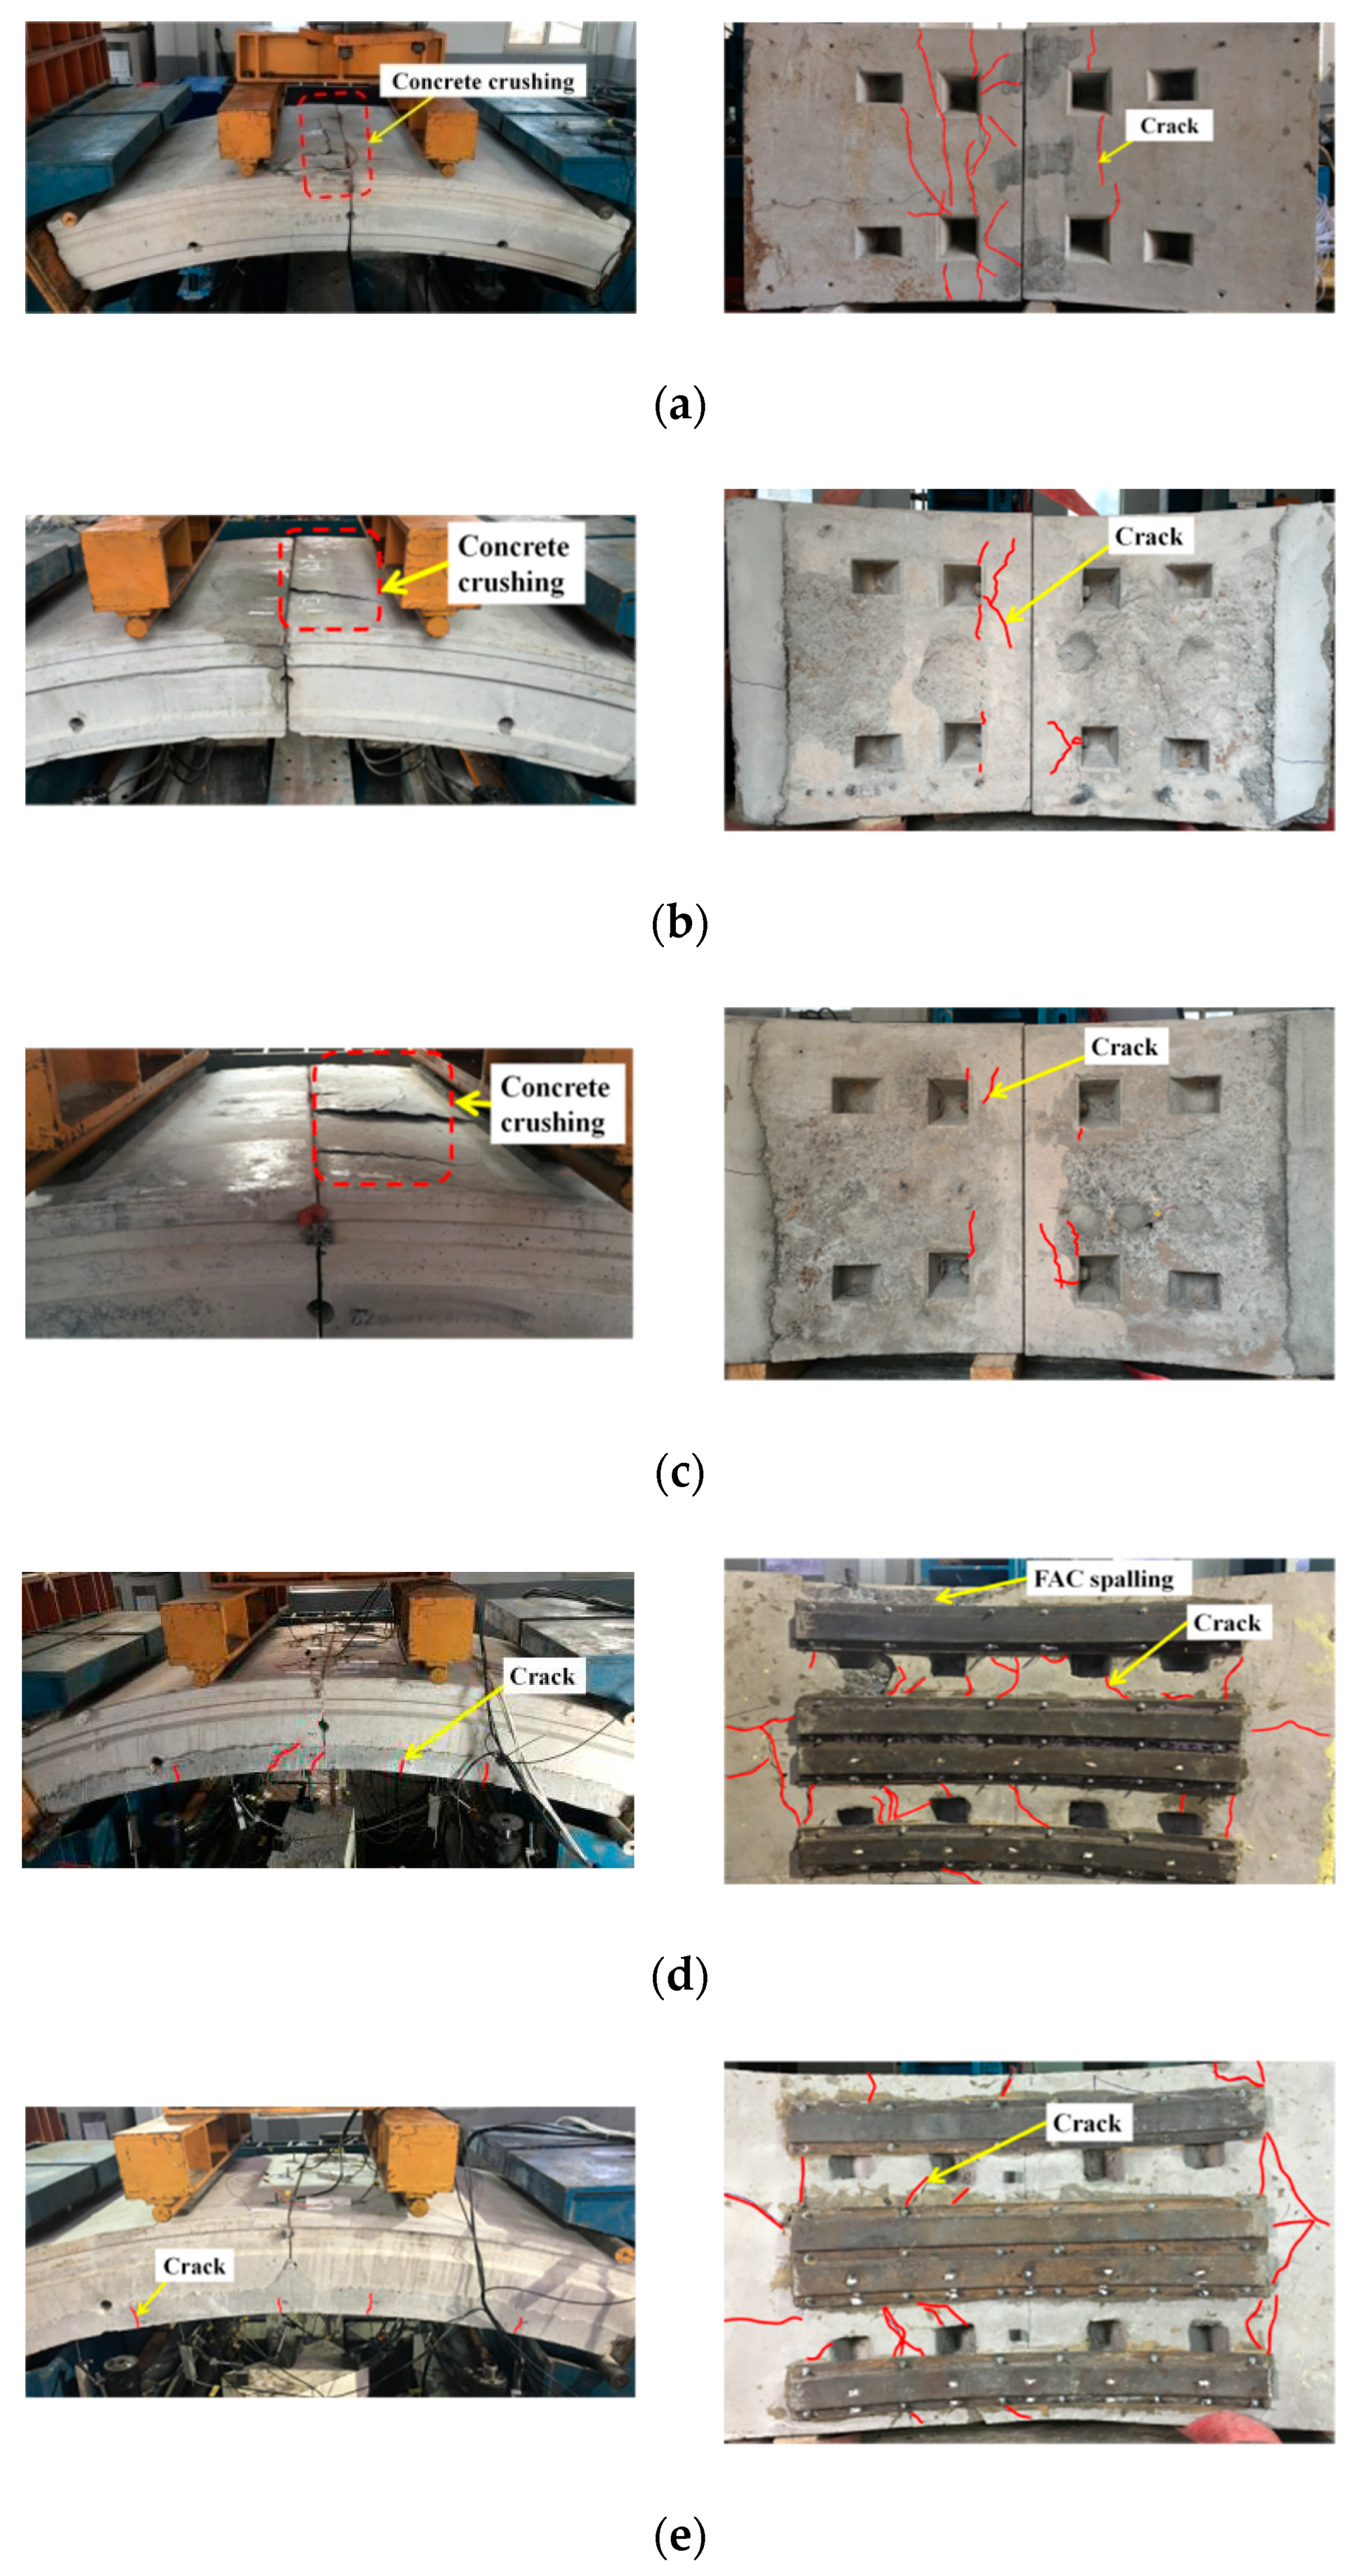
Figure 14 presents the final failure patterns of all of the specimens after the mechanical tests. The following can be observed:
(1) The failure modes of the unstrengthened specimens S60 and S120 were similar to that of untreated specimen S0. All three specimens primarily experienced concrete crushing in the compression region of the joint. However, flexural cracks in the tensile zones of the former two specimens were fewer than in the latter.
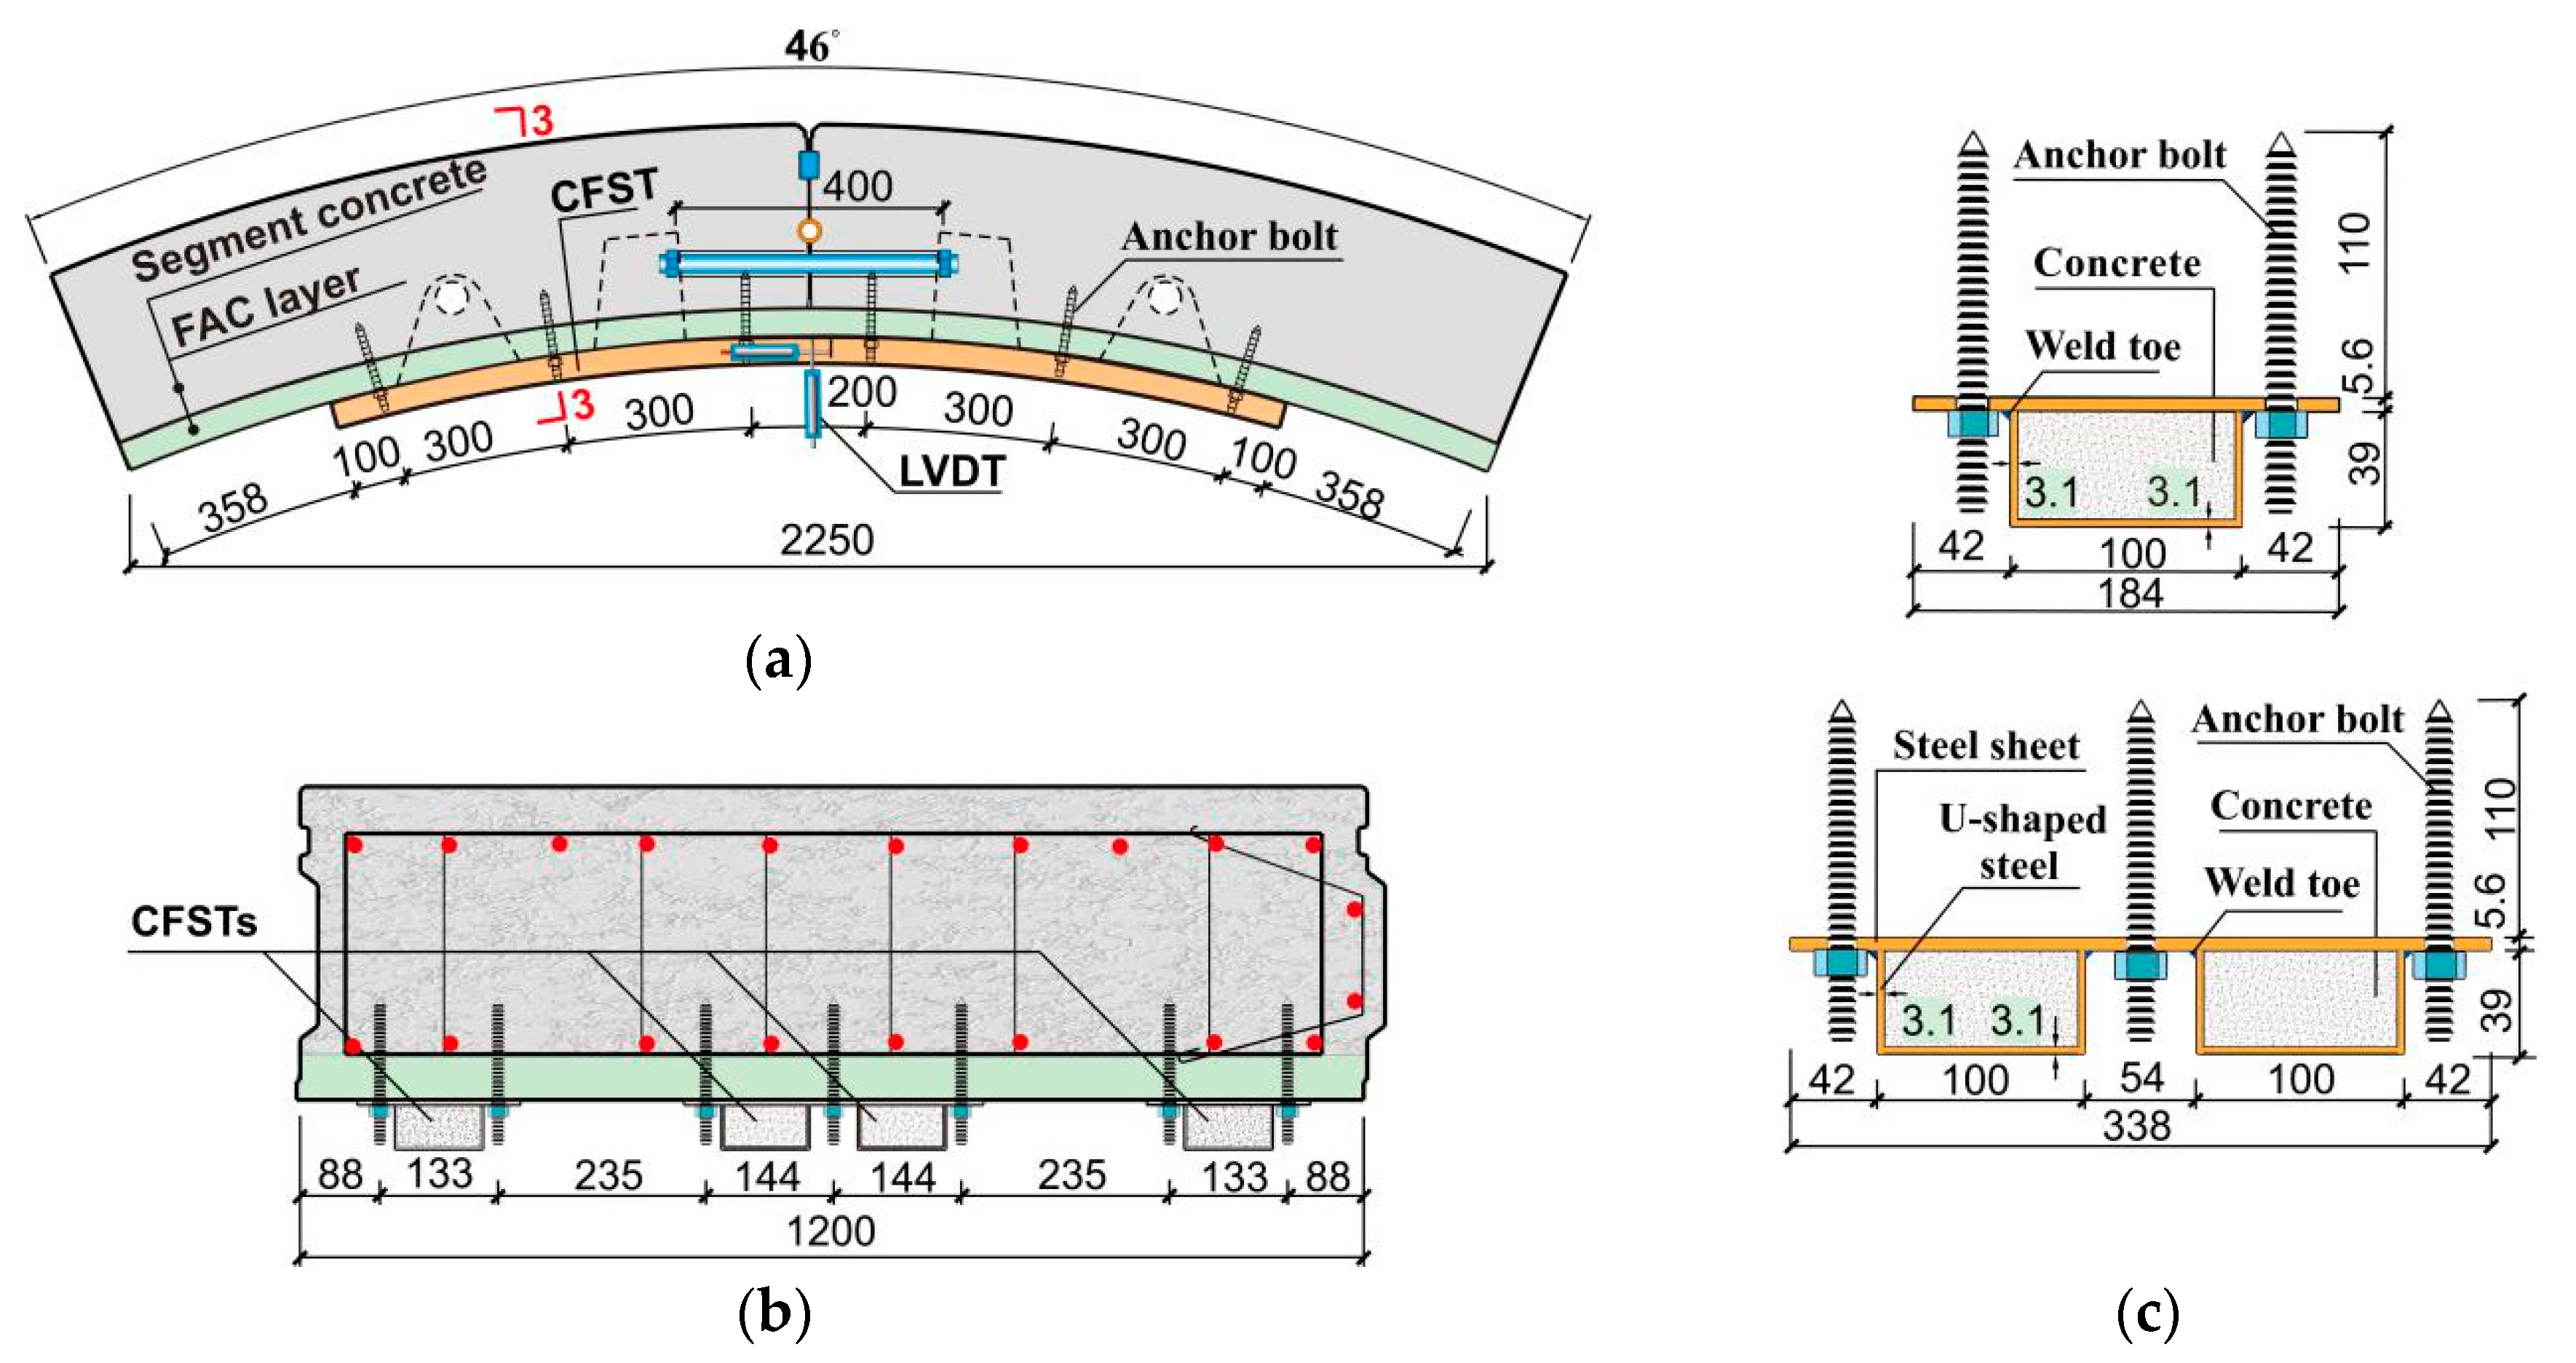
(2) The failure patterns of strengthened specimens S60C and S120C were similar. Flexural cracks were observed on the back and front of the FAC, however they did not oblique propagate deep into the segment concrete. In addition, some cracks in the direction of the anchor bolt’s root were found on the tension side of the specimens, and these cracks were resulted from the shear force transmitted from the bolts to the FAC. After the occurrence of the shear cracks, the restraint effect of surrounding FAC on the anchor bolts reduced, resulting in a certain bending deformation of the bolts. However, fracture of the anchor bolts was not observed during the loading tests. The epoxy adhesive between the strengthening members and the FAC experienced some local failure, and local debonding between the FAC and the segment concrete was observed.
The measured ultimate loads
Fv, max (maximum load in the vertical direction) of all of the specimens are listed in
Table 4. The bearing capacities of Specimens S60C and S120C were large and beyond the capacity of the vertical actuator, so for those two specimens it is the maximum applied load (1455 kN) instead of the ultimate load that is listed in
Table 4. Also included in
Table 4 are the initial stiffness (i.e., the secant stiffness at 30%
Fv, max) of all the specimens. As can be seen, the ultimate loads of the unstrengthened specimens S60 and S120 were about 24% smaller than that of the untreated specimen S0, the ultimate loads of strengthened specimen S60C and S120C were at least 55% larger than those of the unstrengthened specimens and at least 17% larger than that of the untreated specimen S0. In addition, the initial stiffness of the strengthened specimen was at least 550% larger than that of the untreated specimen and at least 360% higher than that of the unstrengthened specimen. It seems, therefore, that a fire-damaged segment joint can maintain considerable loading capacity and initial stiffness even surpassing those of an untreated segment joint if it is strengthened with the proposed CFST.
Table 4 also shows that exposure to fire for 60 or 120 min had no effect on the ultimate load of the unstrengthened specimens. The reason is probably that most parts of the joint bolts in Specimens S60 and S120 were not exposed to the fire directly. The temperatures of the joint bolts’ mid-points were below 220 °C throughout the fire testing. Consequently, the residual mechanical properties of the joint bolts were very similar after cooling [
26]. Moreover, regardless of whether the fire lasted 60 or 120 min, the compression regions of the segments experienced only room temperature because they were so far from the heated surface. Thus, the duration of exposure to fire had little effect on the specimens’ bearing capacity.
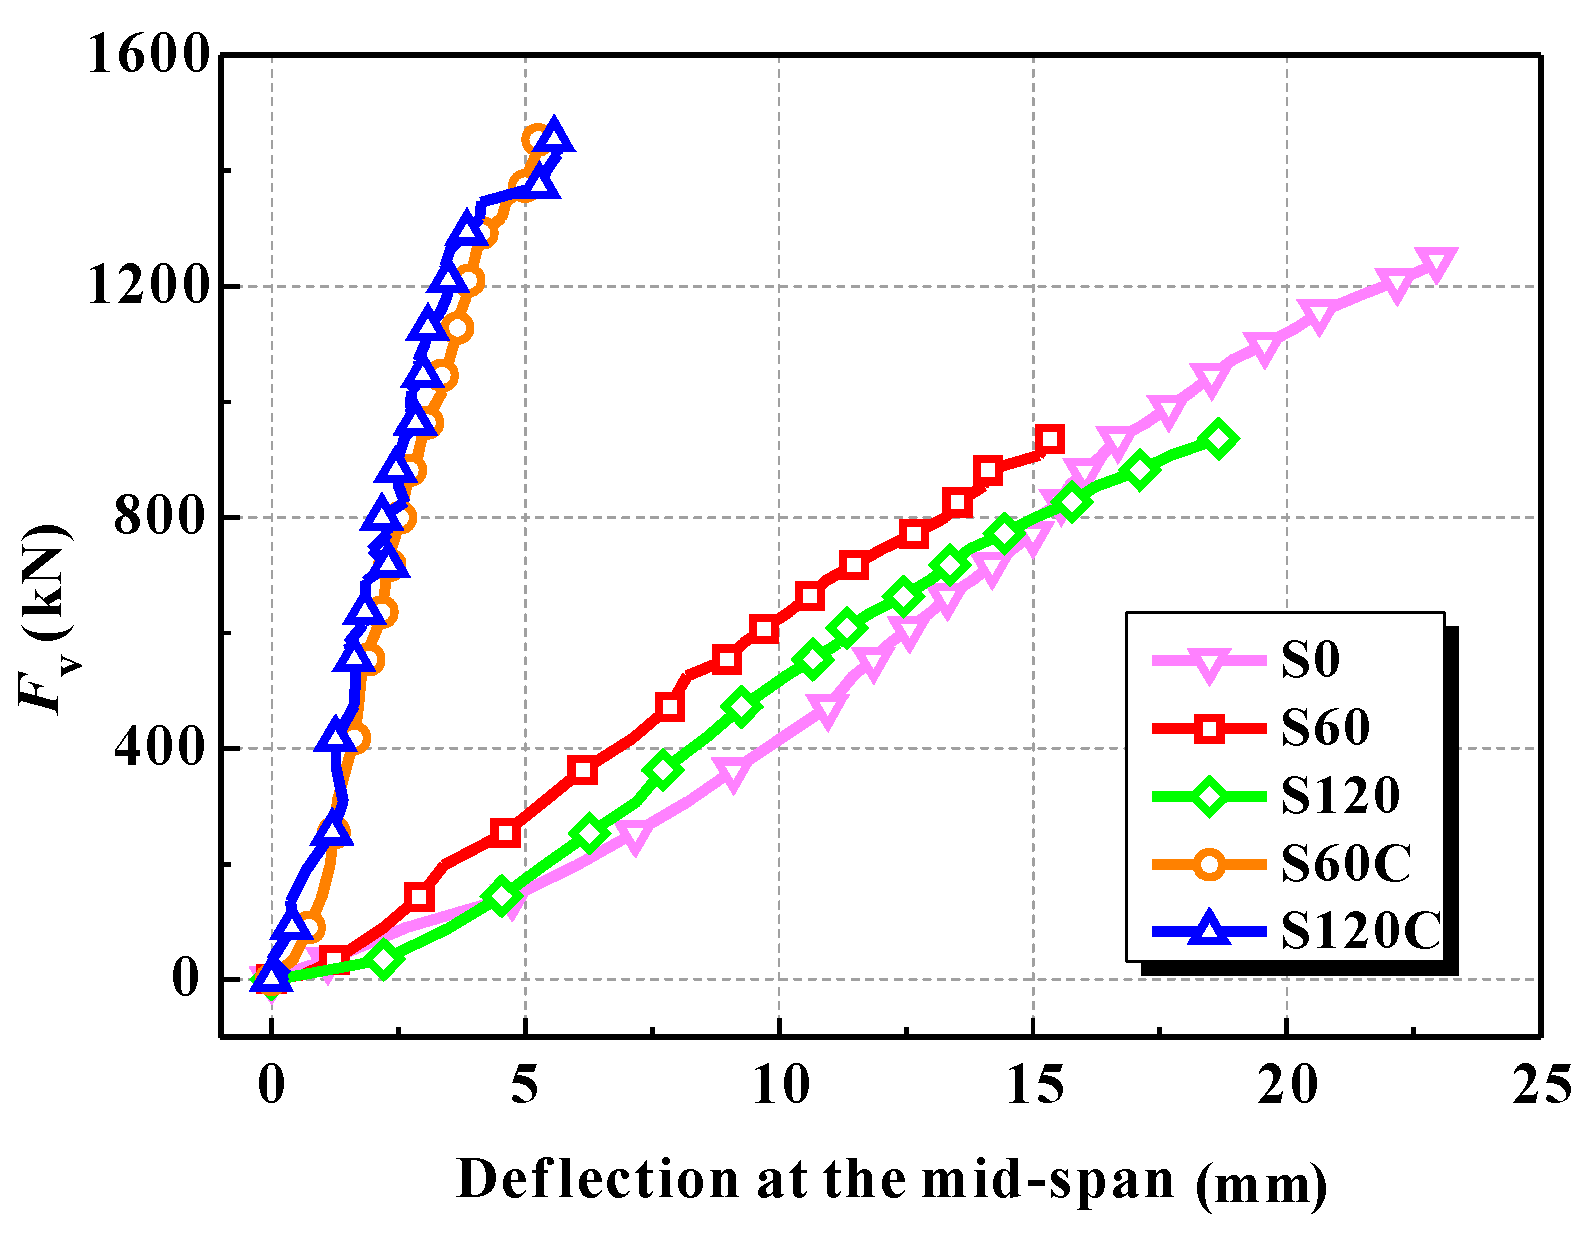
The relationship between the applied load and mid-span deflection for all of the specimens is presented in
Figure 15. The following can be observed:
(1) The flexural stiffnesses of the unstrengthened specimens S60 and S120 were generally higher than that of the untreated specimen S0. This is mainly because the flexural stiffness of a specimen mostly depends on the rotational stiffness of the joint [
27], which increased after the joint bolts of the specimens were retightened after the fire tests.
(2) The flexural stiffnesses of the strengthened specimens S60C and S120C were similar but much higher than those of the unstrengthened and untreated specimens. Consequently, the mid-span deflections of the strengthened specimens were significantly smaller under equal loads.
(3) The load deflection curves of S60C and S120C basically coincide. The curves of specimens S60 and S120 are also similar. Thus, the duration of fire exposure had little effect on specimens’ deformation behavior (at least up to 120 min).
Joint opening is an important indicator of deformation in a shield tunnel and it is often investigated to assess a tunnel’s safety [
28].
Figure 16 presents the joint opening increment versus vertical loading data for all of the specimens. It shows that:
(1) The joint opening increments of the unstrengthened specimens S60 and S120 were smaller than that of the untreated specimen S0 under equal loads. The previously-mentioned explanation is that the rotational stiffness of the fire-damaged joints became higher than that of the untreated specimen when the joint bolts were re-tightened after the fire test.
(2) The joint opening increments of strengthened specimens S60C and S120C were generally similar. At the end of the loading process, an increment of only 0.5 mm was observed, which was significantly smaller than those of the unstrengthened and untreated specimens.
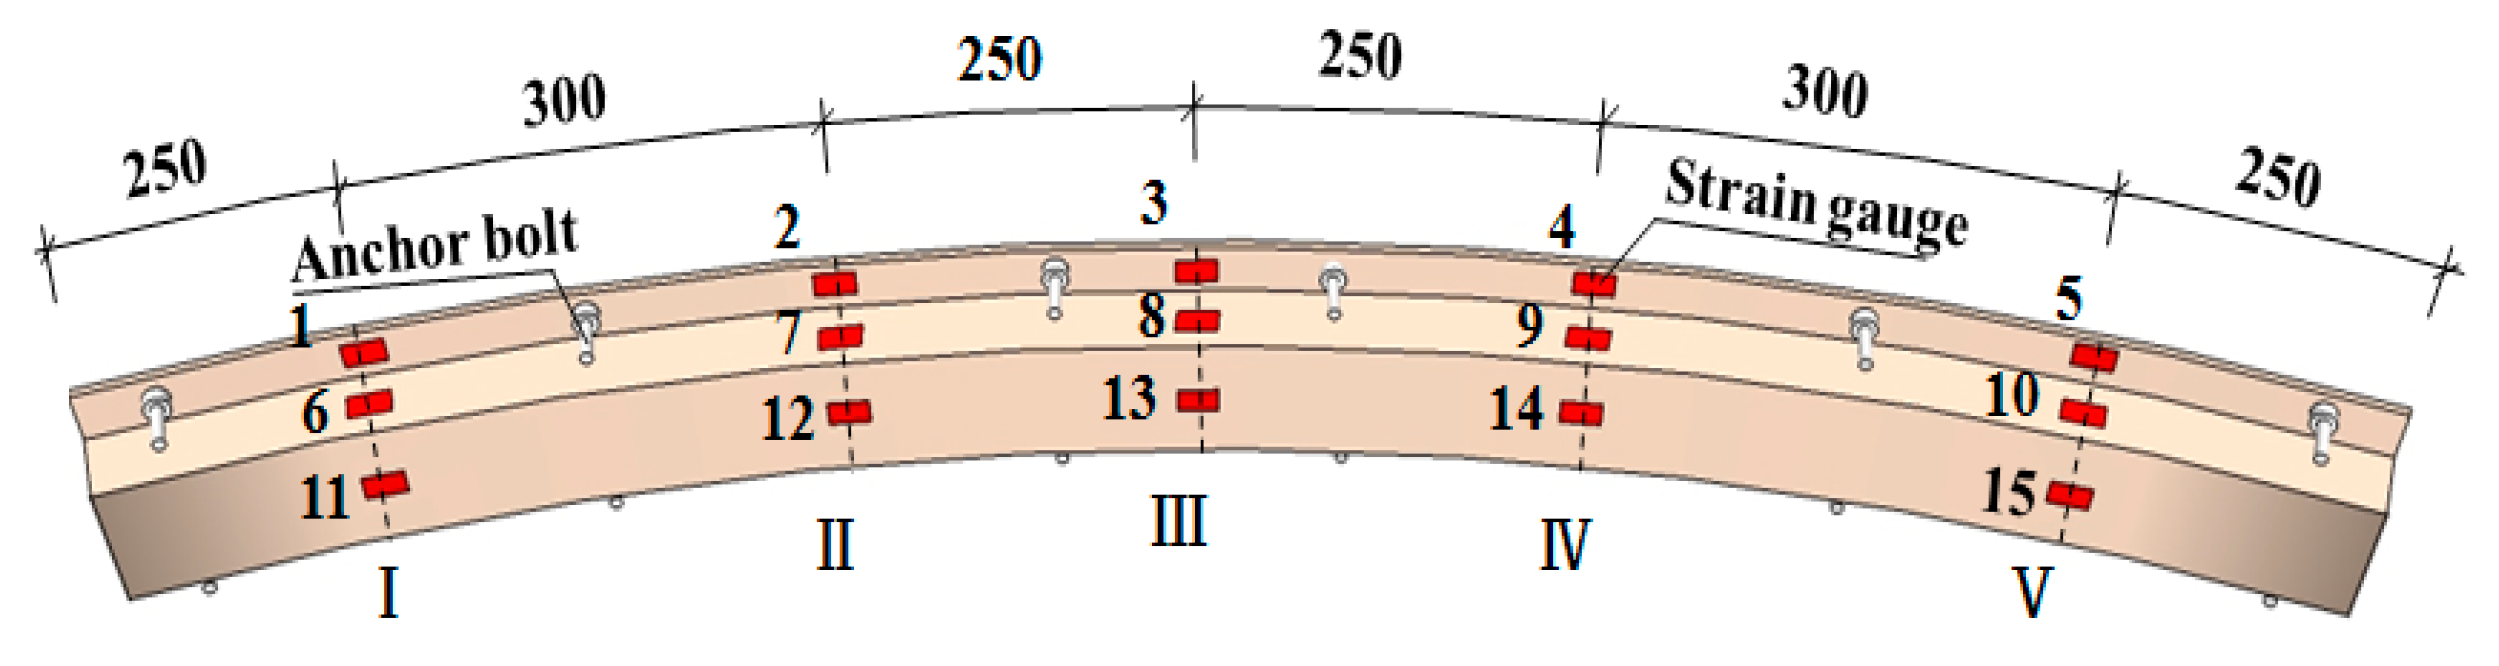
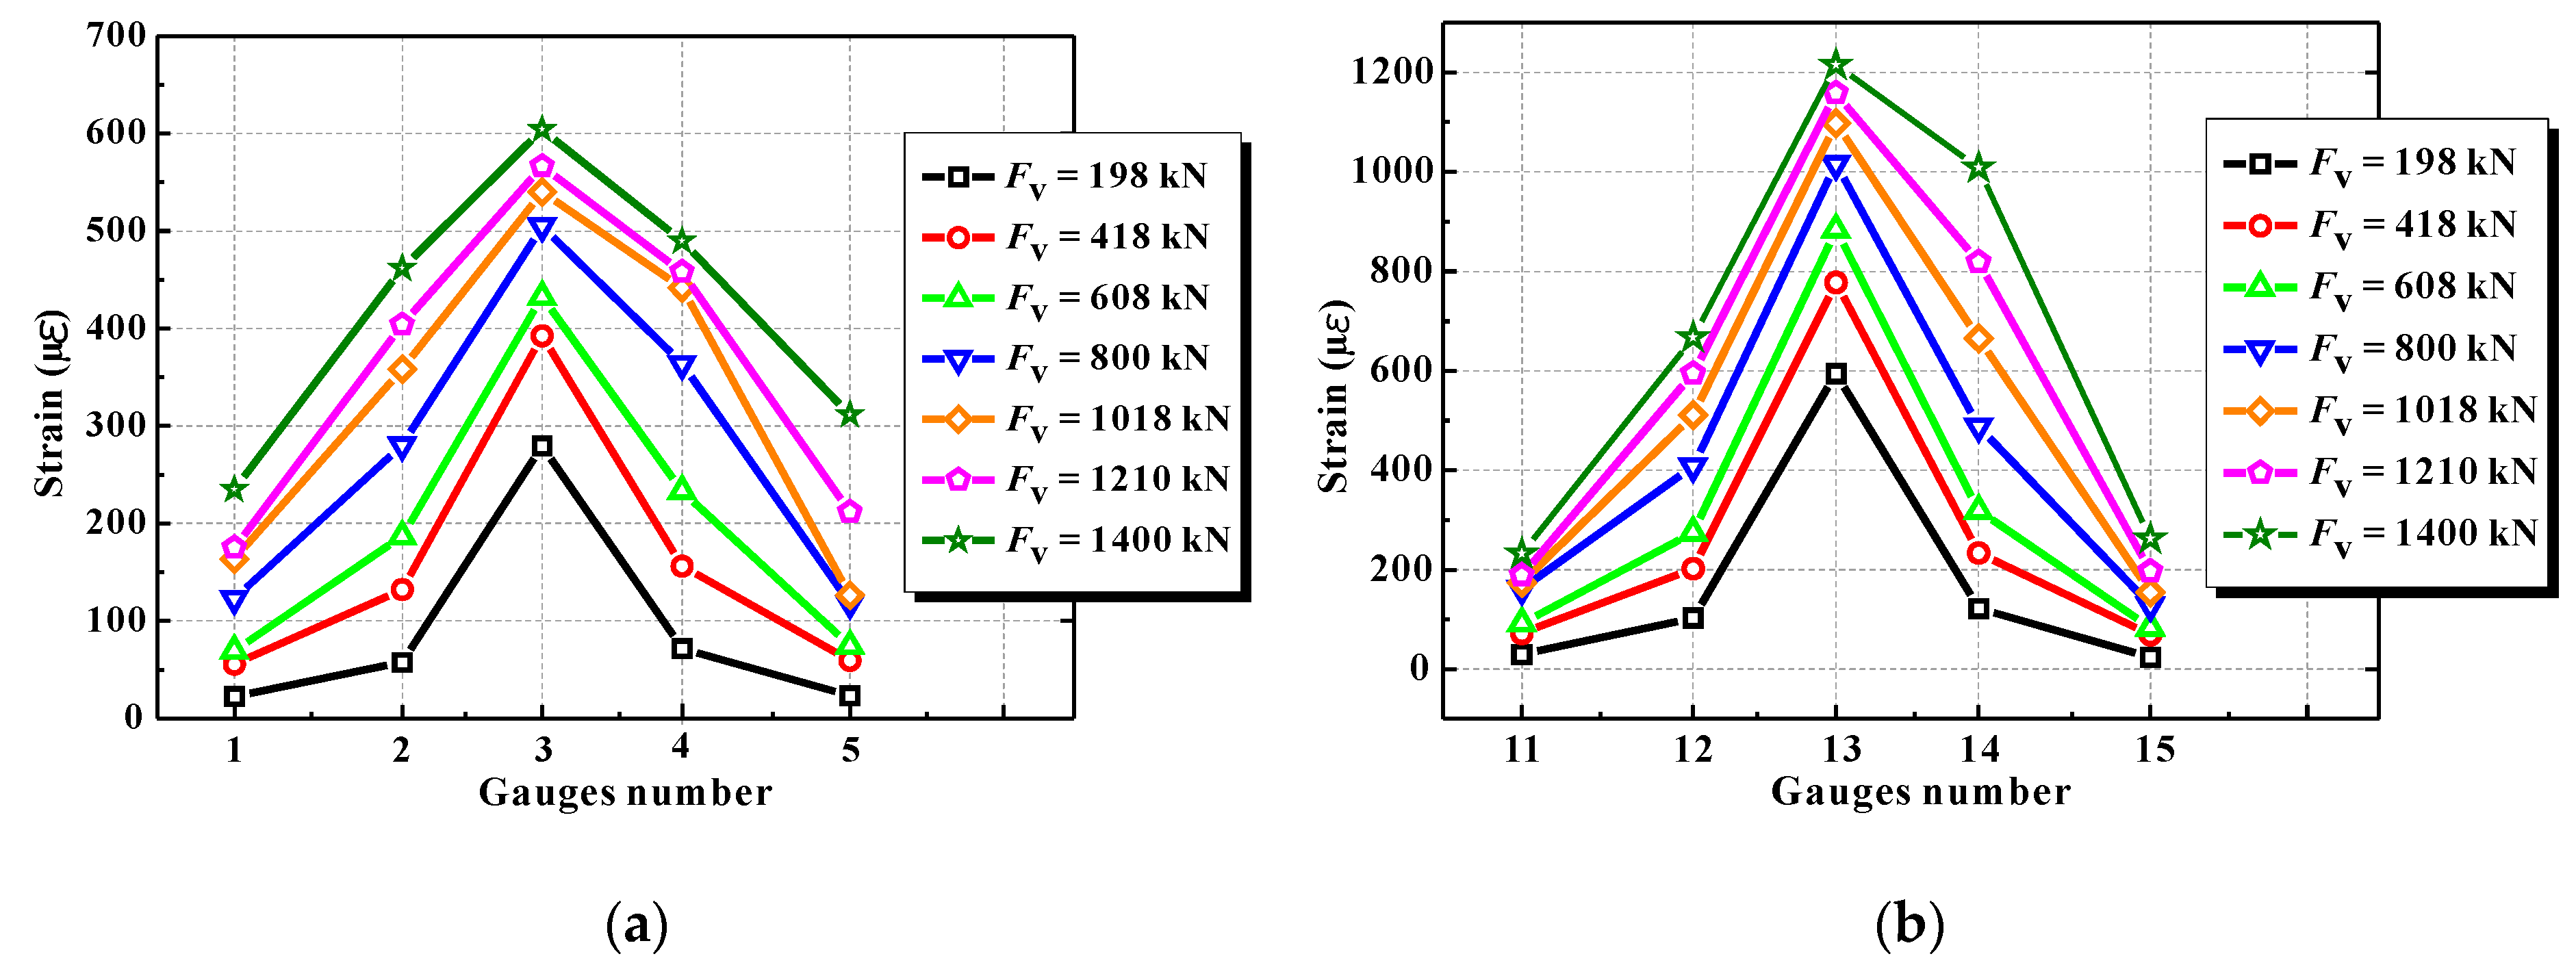
Figure 17 presents the strain profiles in the strengthening parts of Specimens S60C and S120C under different load levels. The details of the strain gauges are presented in
Figure 3. It can be observed that:
(1) All of the positions where strain gauges were attached were in tension. The deformations were approximately symmetrical about the mid-span. Further, the maximum and minimum strains were at the mid-span and the ends of the strengthening parts, respectively.
(2) The strains recorded by gauges 11–15 were much higher than those of gauges 1–5 throughout the entire loading process. Thus, the strengthening played a significant role in determining the tension and bending resistance.
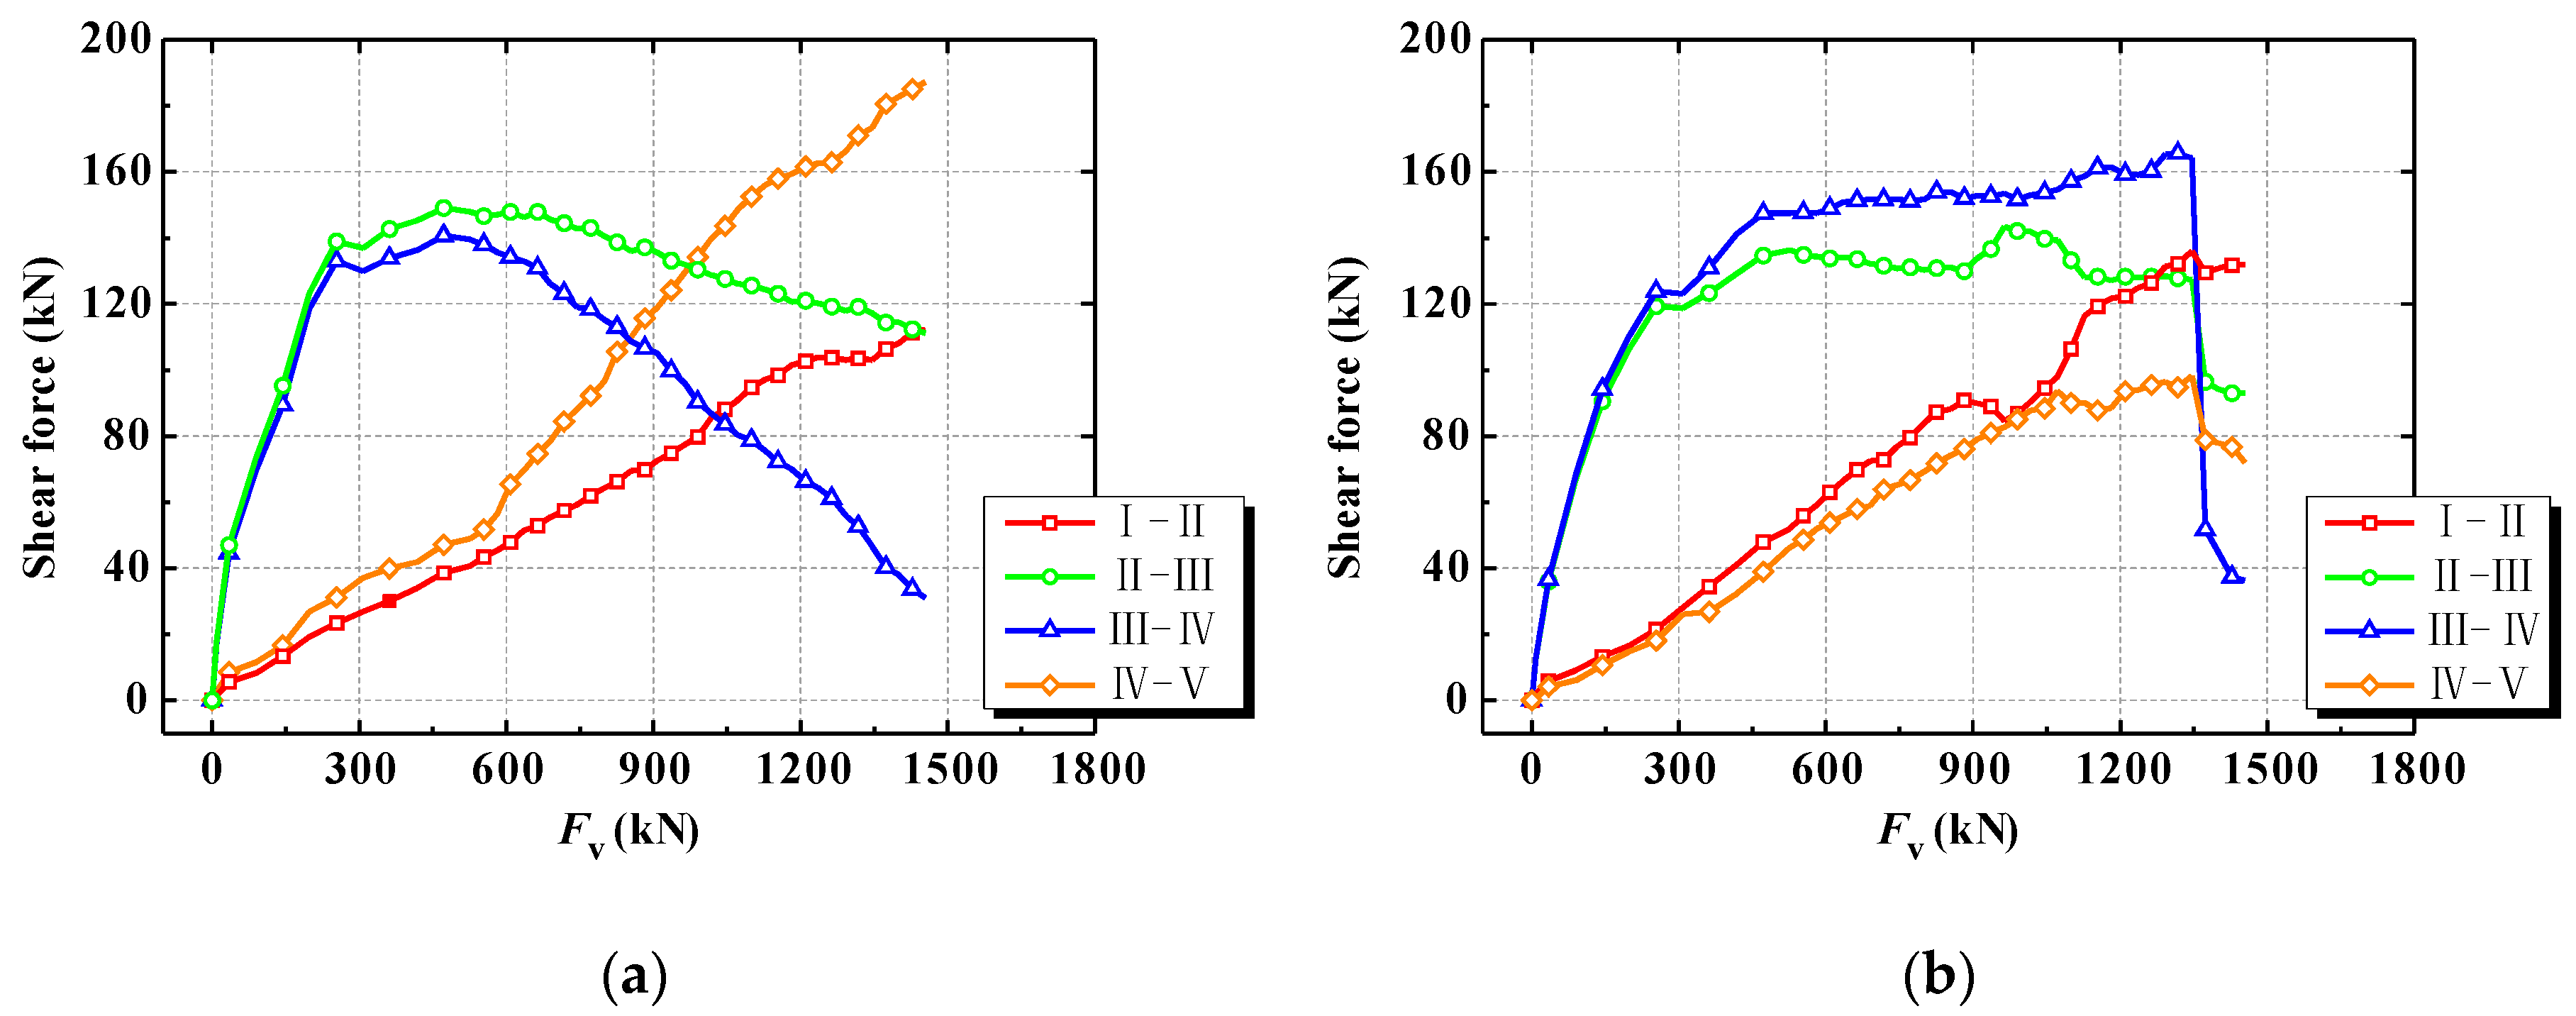
The variation in the local shear force between the strengthener and the segment can reflect the performance of the local connection between the strengthener part and the segment. The five sections (I–V) defined in the longitudinal direction are shown in
Figure 3. Assuming that the plane-section assumption still applies, the longitudinal strains at different positions in each section can be determined quantitatively based on the measured strains obtained from strain gauges 1–15. Thus, the axial force on each section can be obtained via an integration of the observed stress distribution. The elastic modulus of the steel was assumed to be 200 GPa. Any hardening of the steel after yielding and any contribution of the core concrete in tension were neglected. The local shear force between the strengthener and the segment was determined via the difference in axial force between neighboring sections, as presented in
Figure 18. The following observations were made:
(1) Regarding Specimen S60C, when the applied load was less than 17.5% of Fv, max the local shear force in regions II–III and III–IV increased much faster than in regions I–II and IV–V. There was thus significant strengthening near the joint during the initial phase of loading. Beyond 32.5% of Fv, max, the local shear forces in regions II–III and III–IV reached their maxima and then decreased gradually with increasing applied load. The local shear force in regions I–II and IV–V increased continuously. Thus, when the applied load exceeded 1/3 of Fv, max, the strengthening effect near the joint began to weaken, whereas far from the joint it was greater.
(2) Regarding Specimen S120C, when the applied load was less than 17.5% of Fv, max the trends in the local shear forces of the various regions were similar to those of S60C. Between 17.5 % and 90.6% of Fv, max the shear force in regions I–II and IV–V increased faster than in regions II–III and III–IV. When the applied load exceeded 90.6% of Fv, max the local shear forces in regions II–III and III–IV suddenly dropped. The connection between the strengthener and the segment was severely damaged in regions II–IV, and the strengthening effect mostly depended on the part far from the segment joint.
5. Conclusions
The thermal behavior of the tunnel segment joints exposed to fire and the strengthening of the fire-damaged joints with CFSTs were investigated experimentally. The effect of joint gap on the temperature distribution and the residual performance of the fire-damaged segment joint were studied. A method for strengthening fire-damaged segment joints was demonstrated. The experimental observations support the following conclusions.
(1) When the initial joint opening is smaller than 10 mm, the temperature at most positions in the joint gap remains lower than in the neighboring concrete with over 60 min of exposure to fire. After 120min, however, the temperature in the joint gap is higher than in the surrounding concrete.
(2) The temperature of the bolt ends is much higher than that of a bolt’s mid-point throughout the heating process. To prevent the temperature of the joint bolts from exceeding the allowable value in a real tunnel fire, they should be insulated.
(3) The bearing capacity and flexural stiffness of the segment joints after a fire can be significantly improved by strengthening with CFSTs. They may even surpass those of untreated joints.
(4) After exposure to fire for 60 or 120 min, specimen strengthened with the proposed CFSTs joint opening increment considerably less than untreated joints under equal loads.
(5) Strengthening near a joint play a crucial role during initial loading, but its effectiveness gradually decreases, and strengthening far from the joint becomes more important as the loading increases.


