Idealisations of Dynamic Modelling for Railway Ballast in Flood Conditions


Abstract
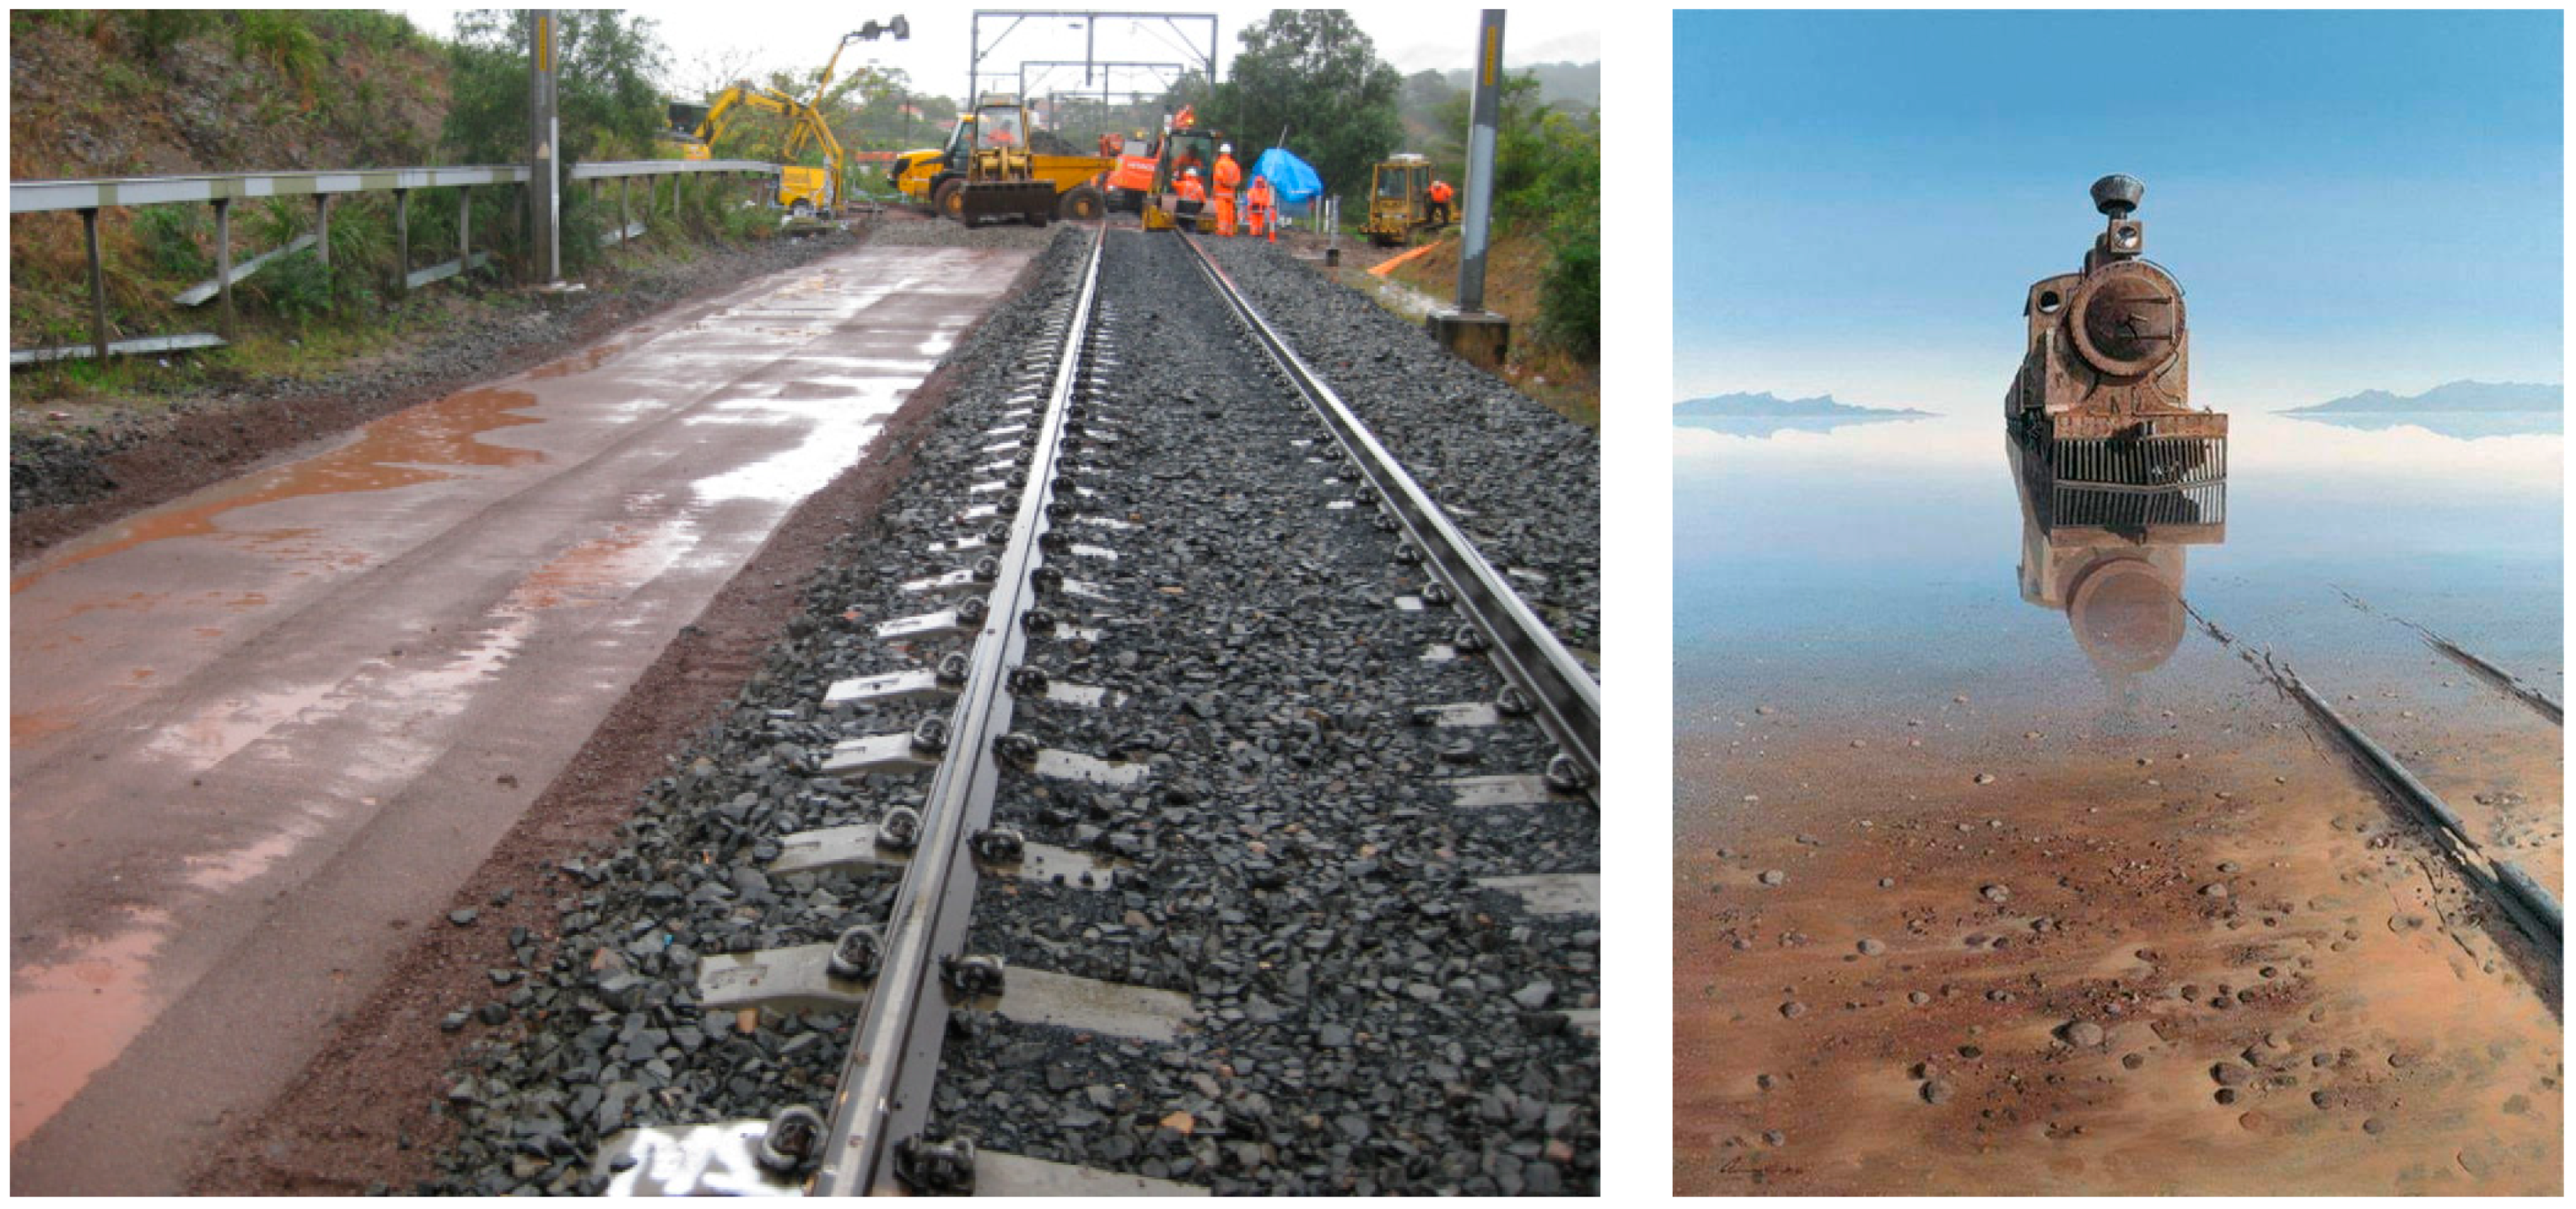
:1. Introduction
- Durable to be able to absorb the loads imposed by the sleepers and transmit the loads to the sub-grade without undue breakdown;
- Hard-wearing with high abrasion resistance in both wet and dry conditions;
- Angular with sufficient bulk density to resist movement of the track both longitudinally and laterally; and
- Particle size to allow packing and transfer of the loads of the track but with sufficient void space to allow free draining to assist shedding of all moisture.
- Primary Functions: the original purpose of ballast; and
- Secondary Functions: the characteristics of the material that enable the ballast to fulfil and continue to fulfil its primary function and those functions that have been added with technology improvements and community expectations.
2. Materials and Methods
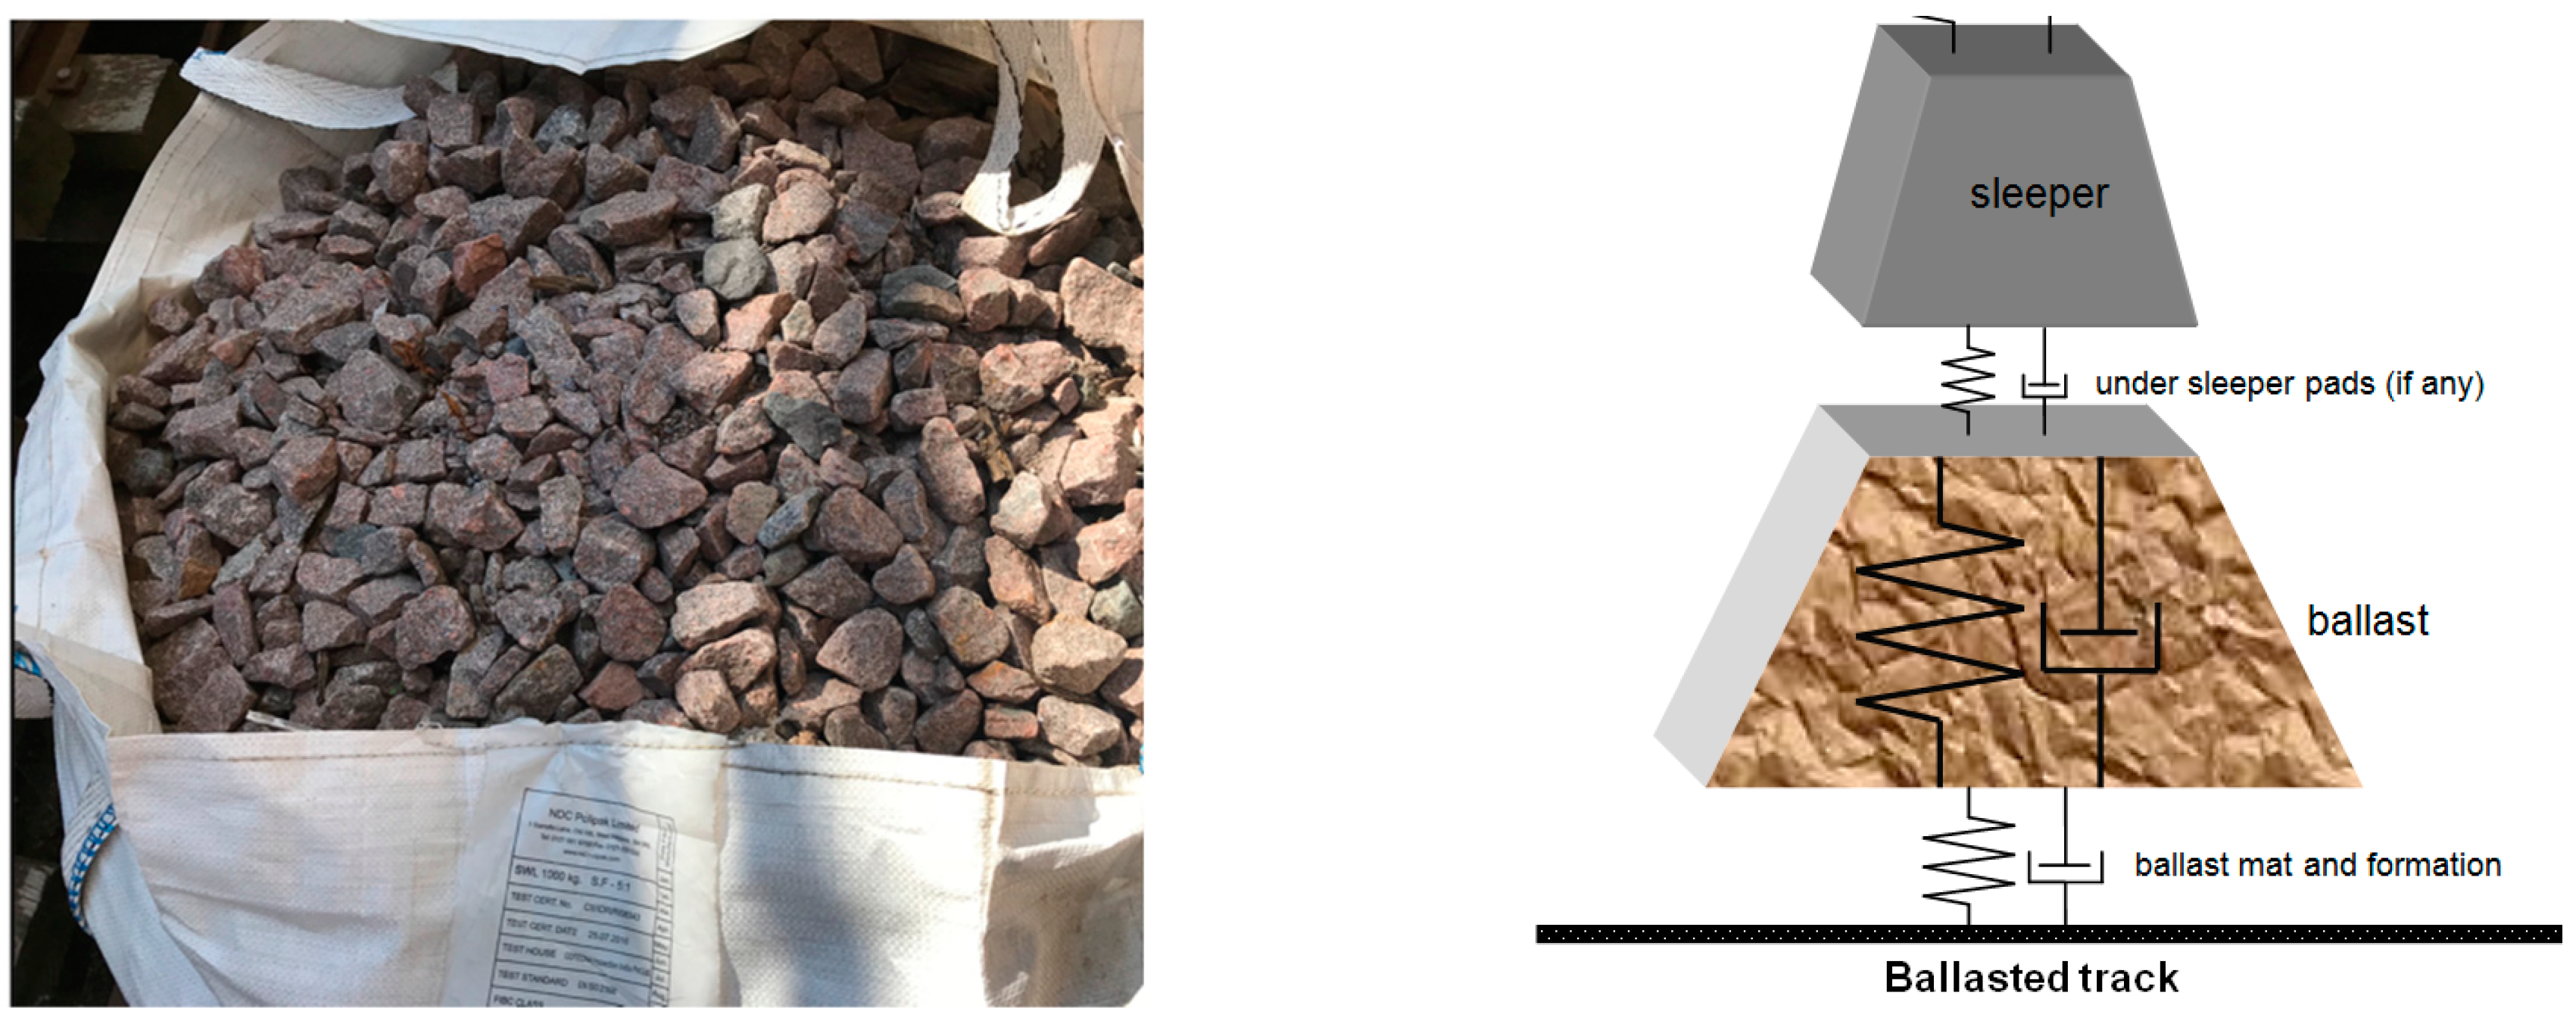
2.1. Materials
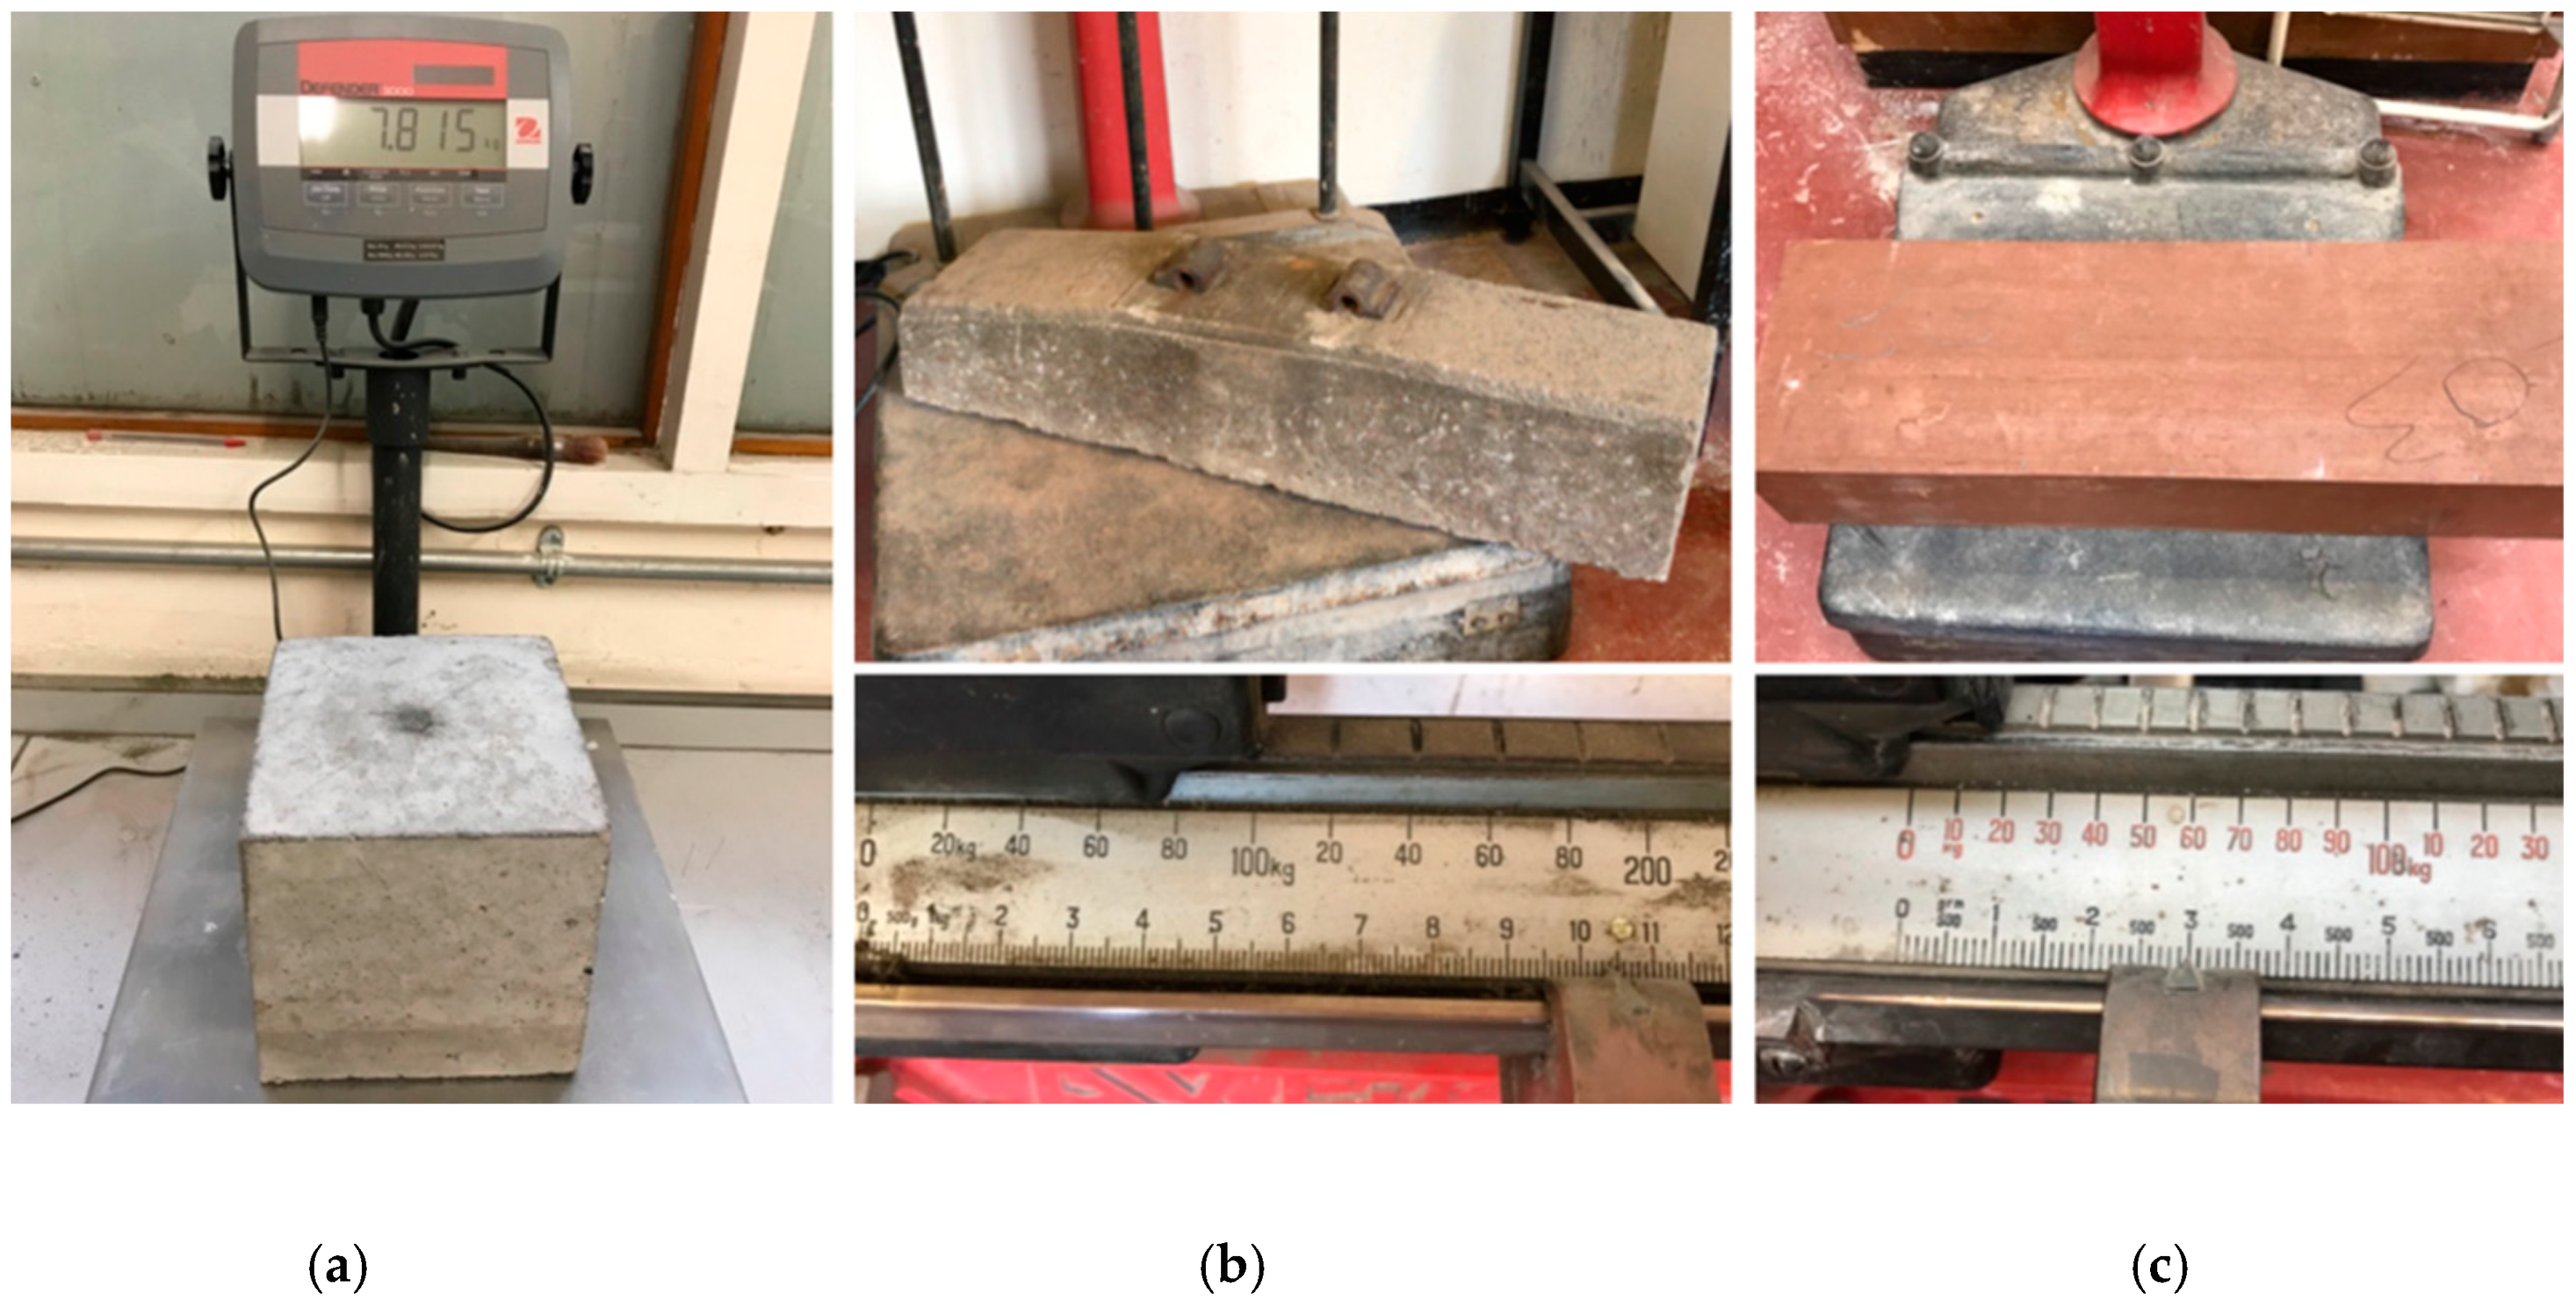
2.1.1. Types of Mass
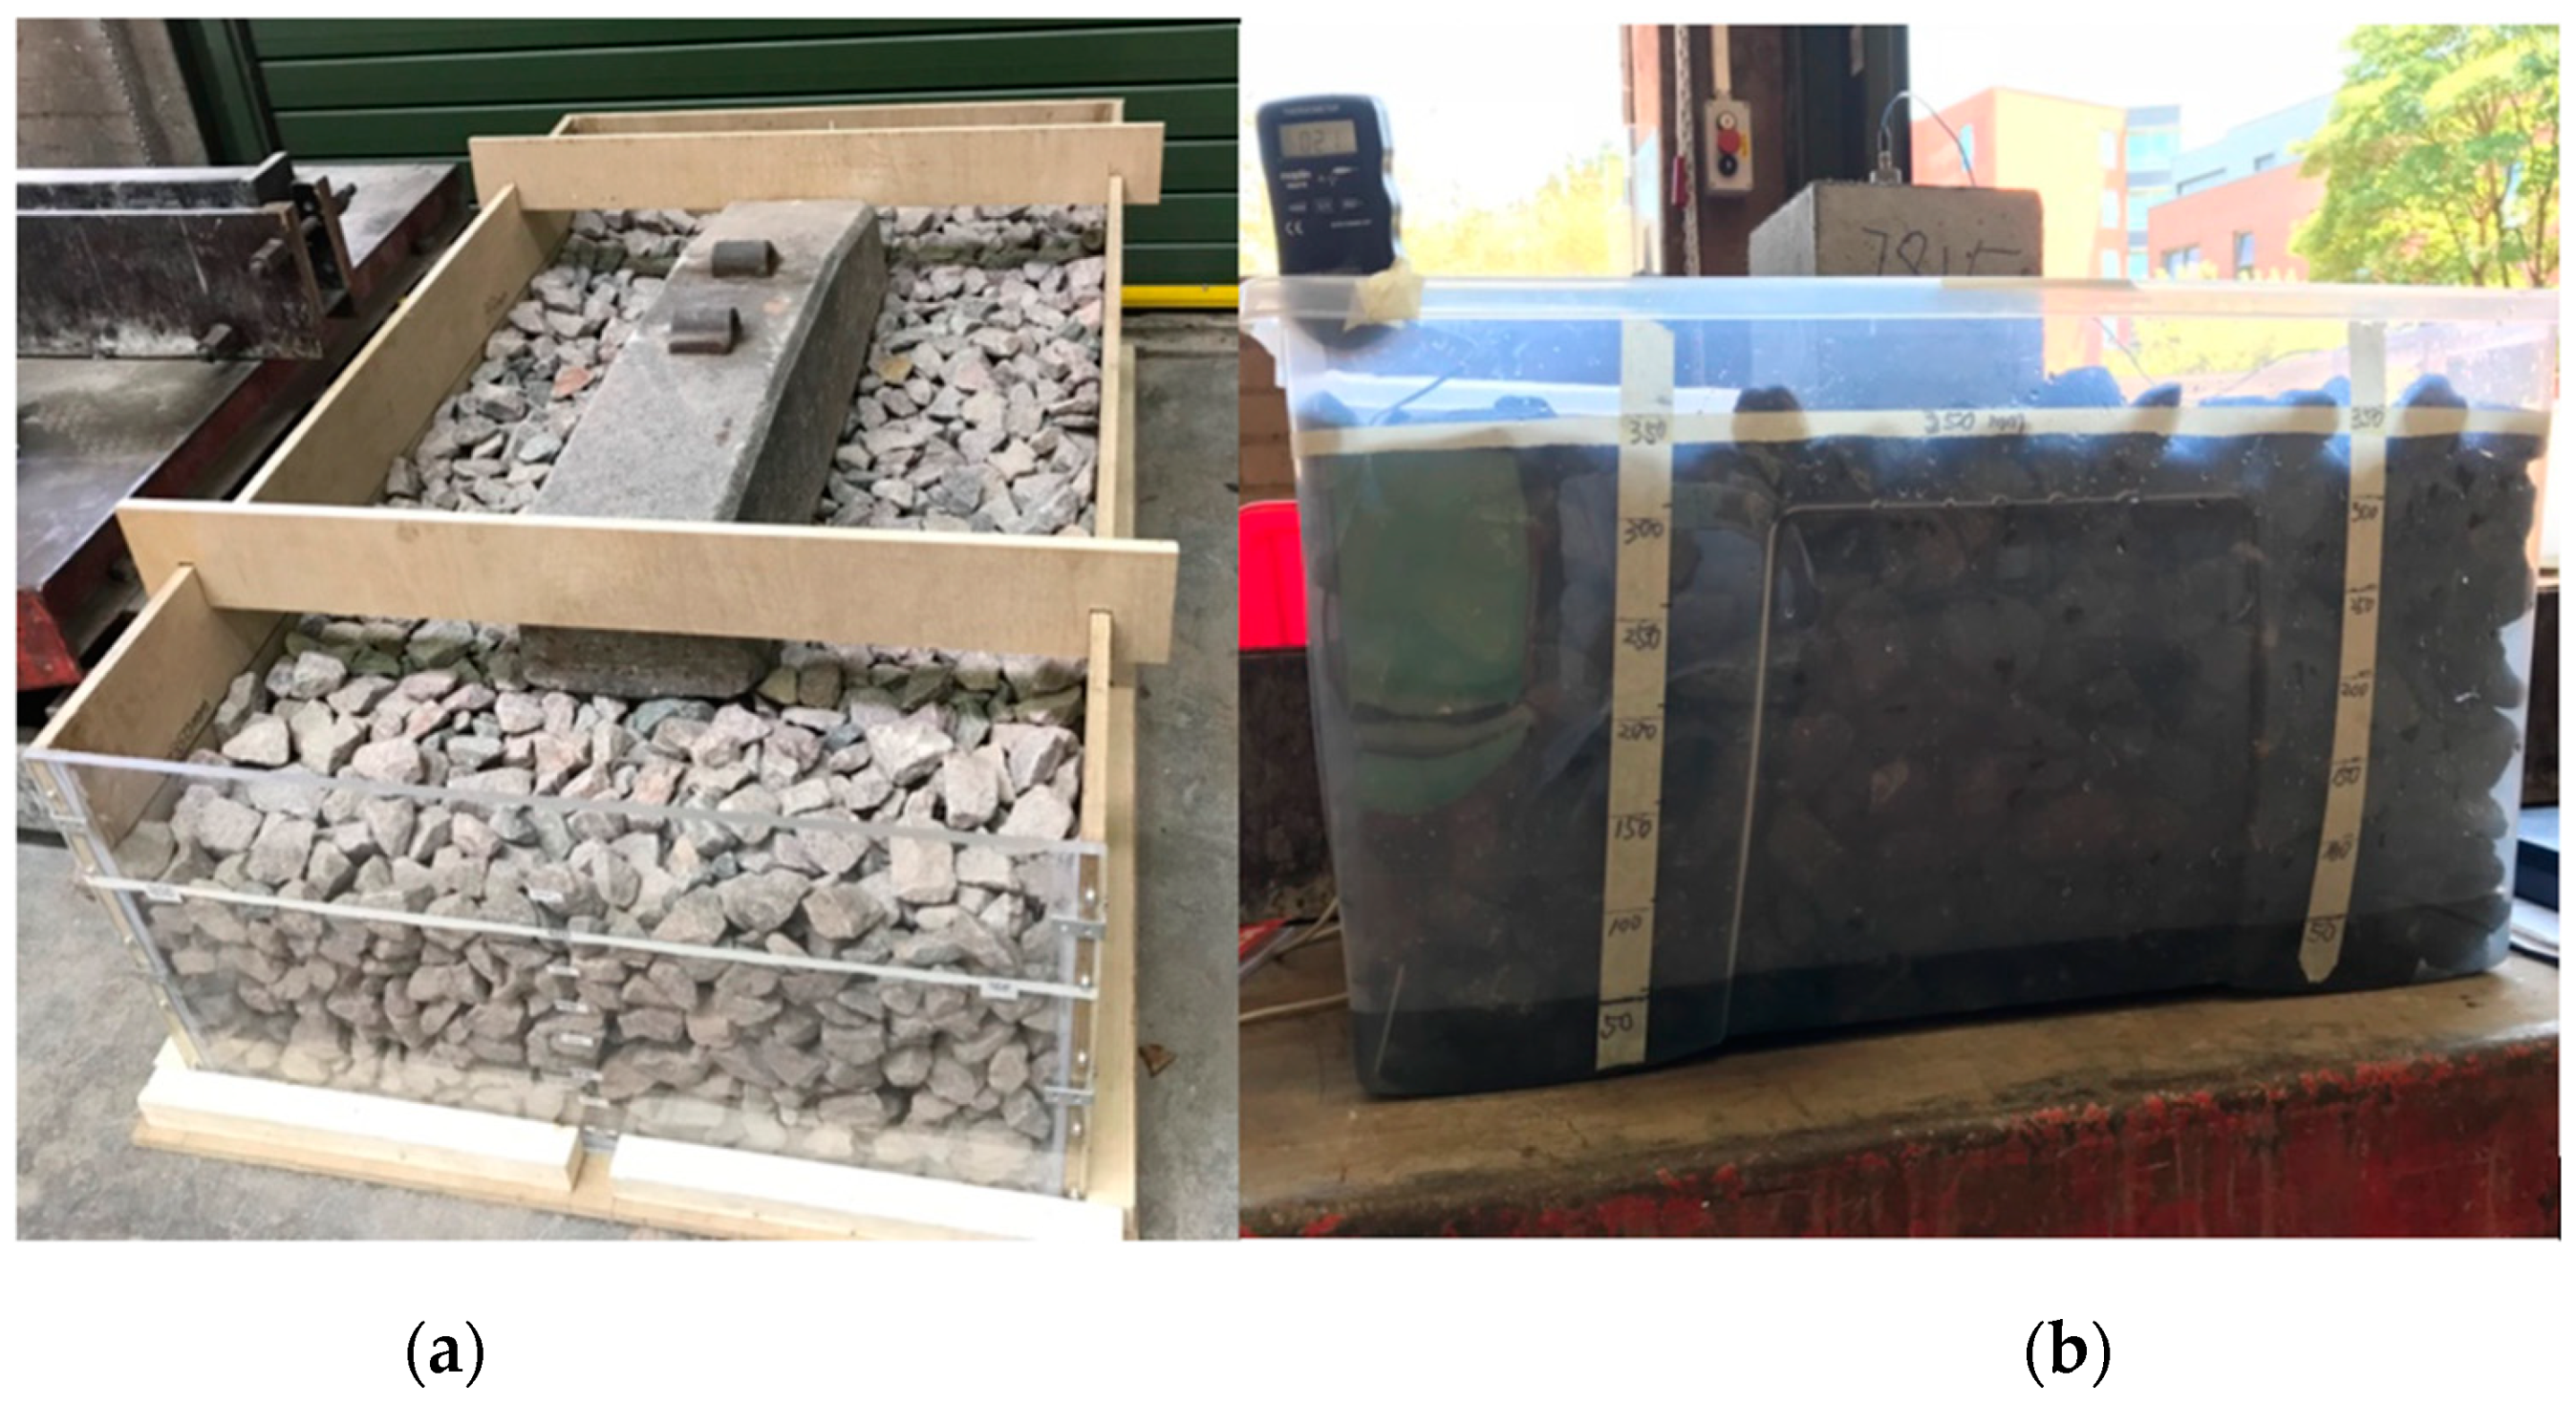
2.1.2. The Preparation of the Ballast Bed
2.2. Methods
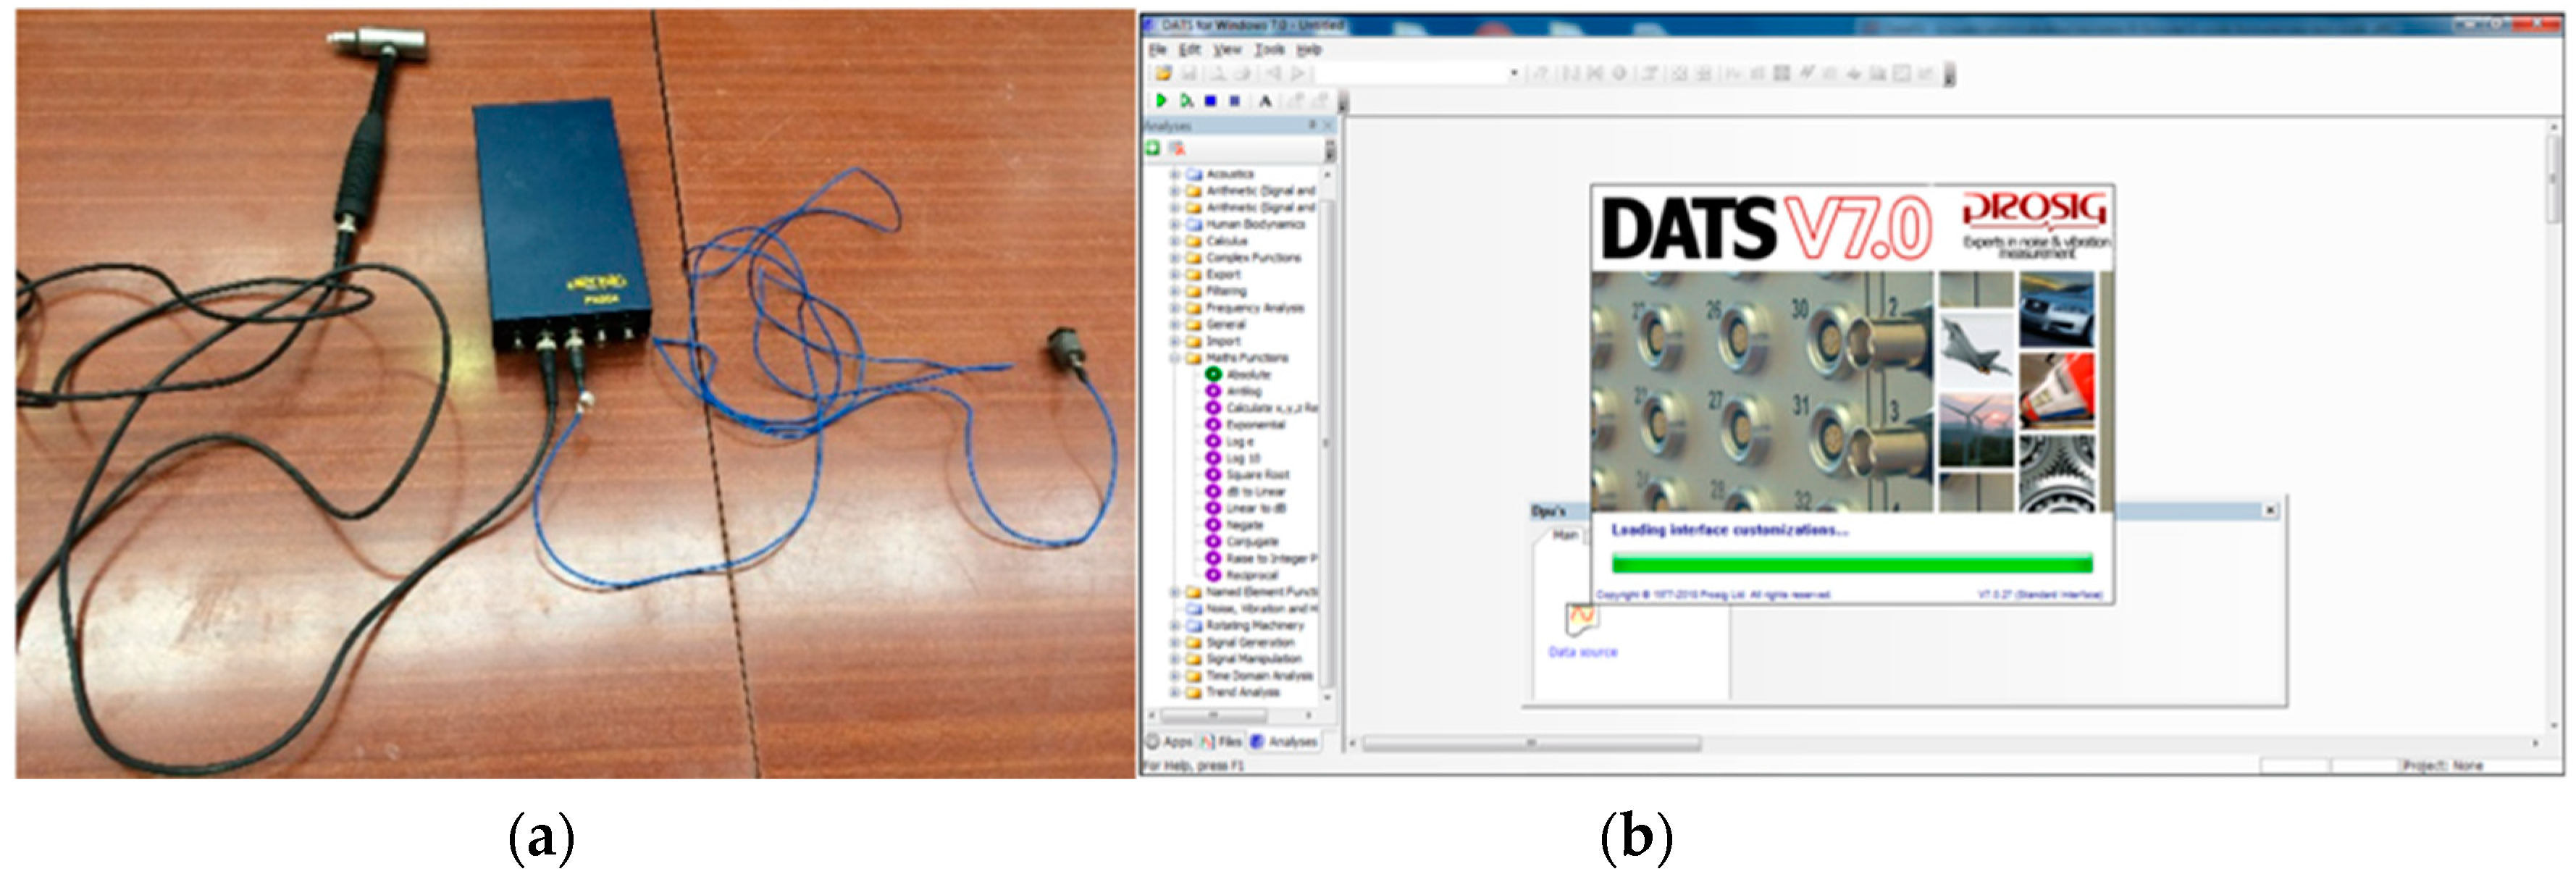
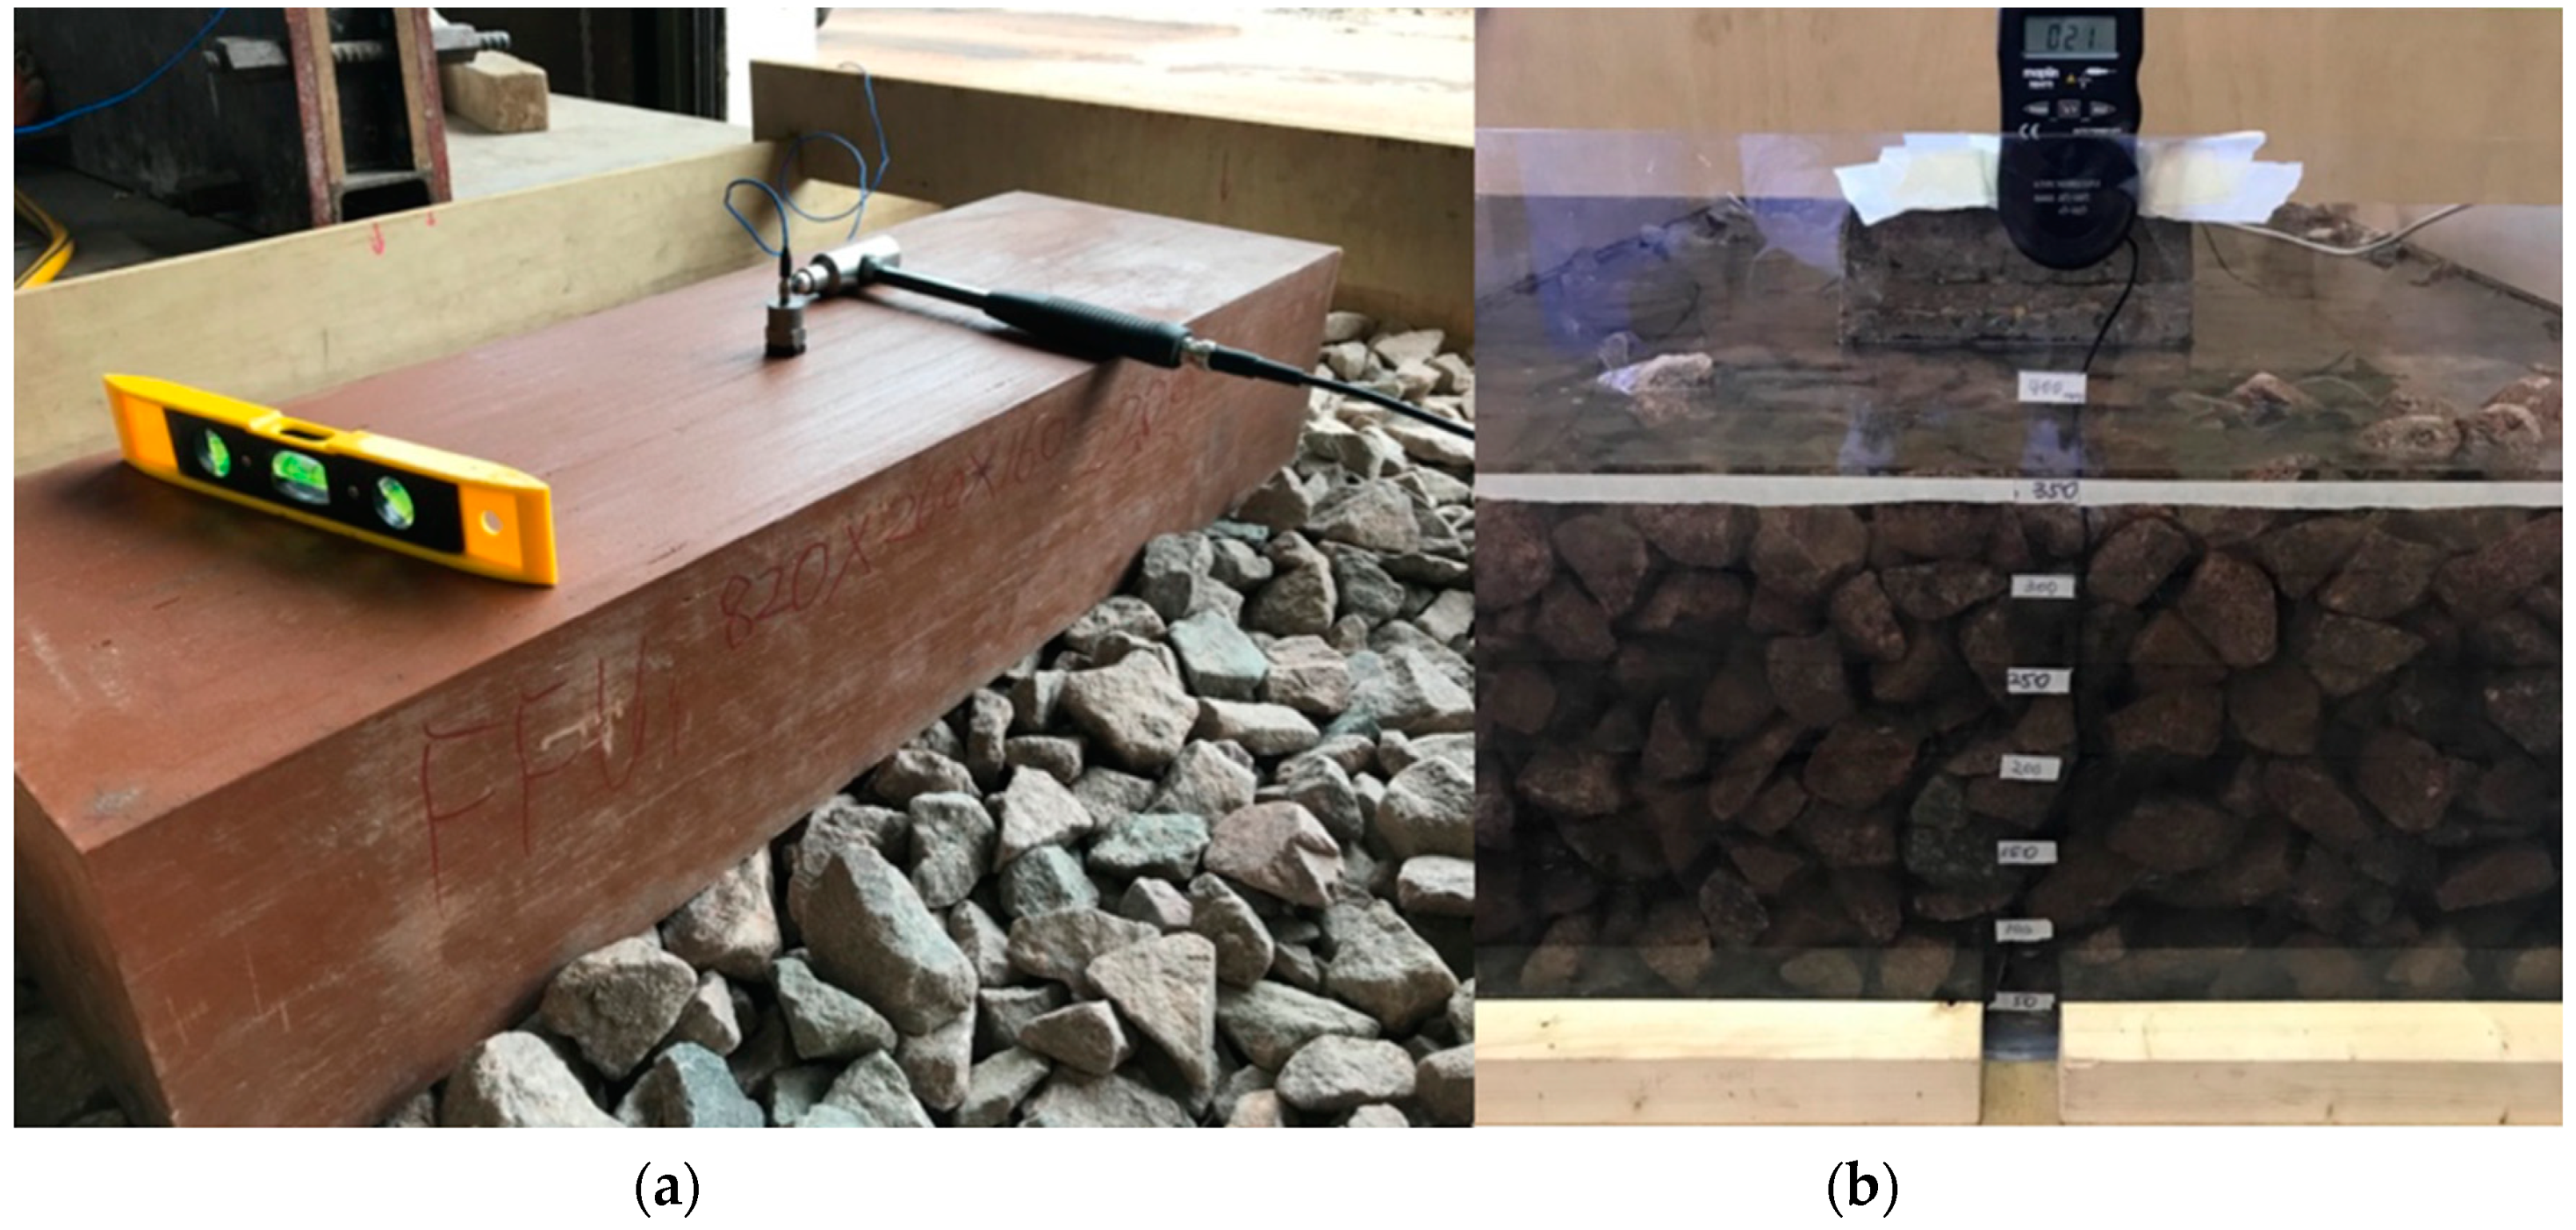
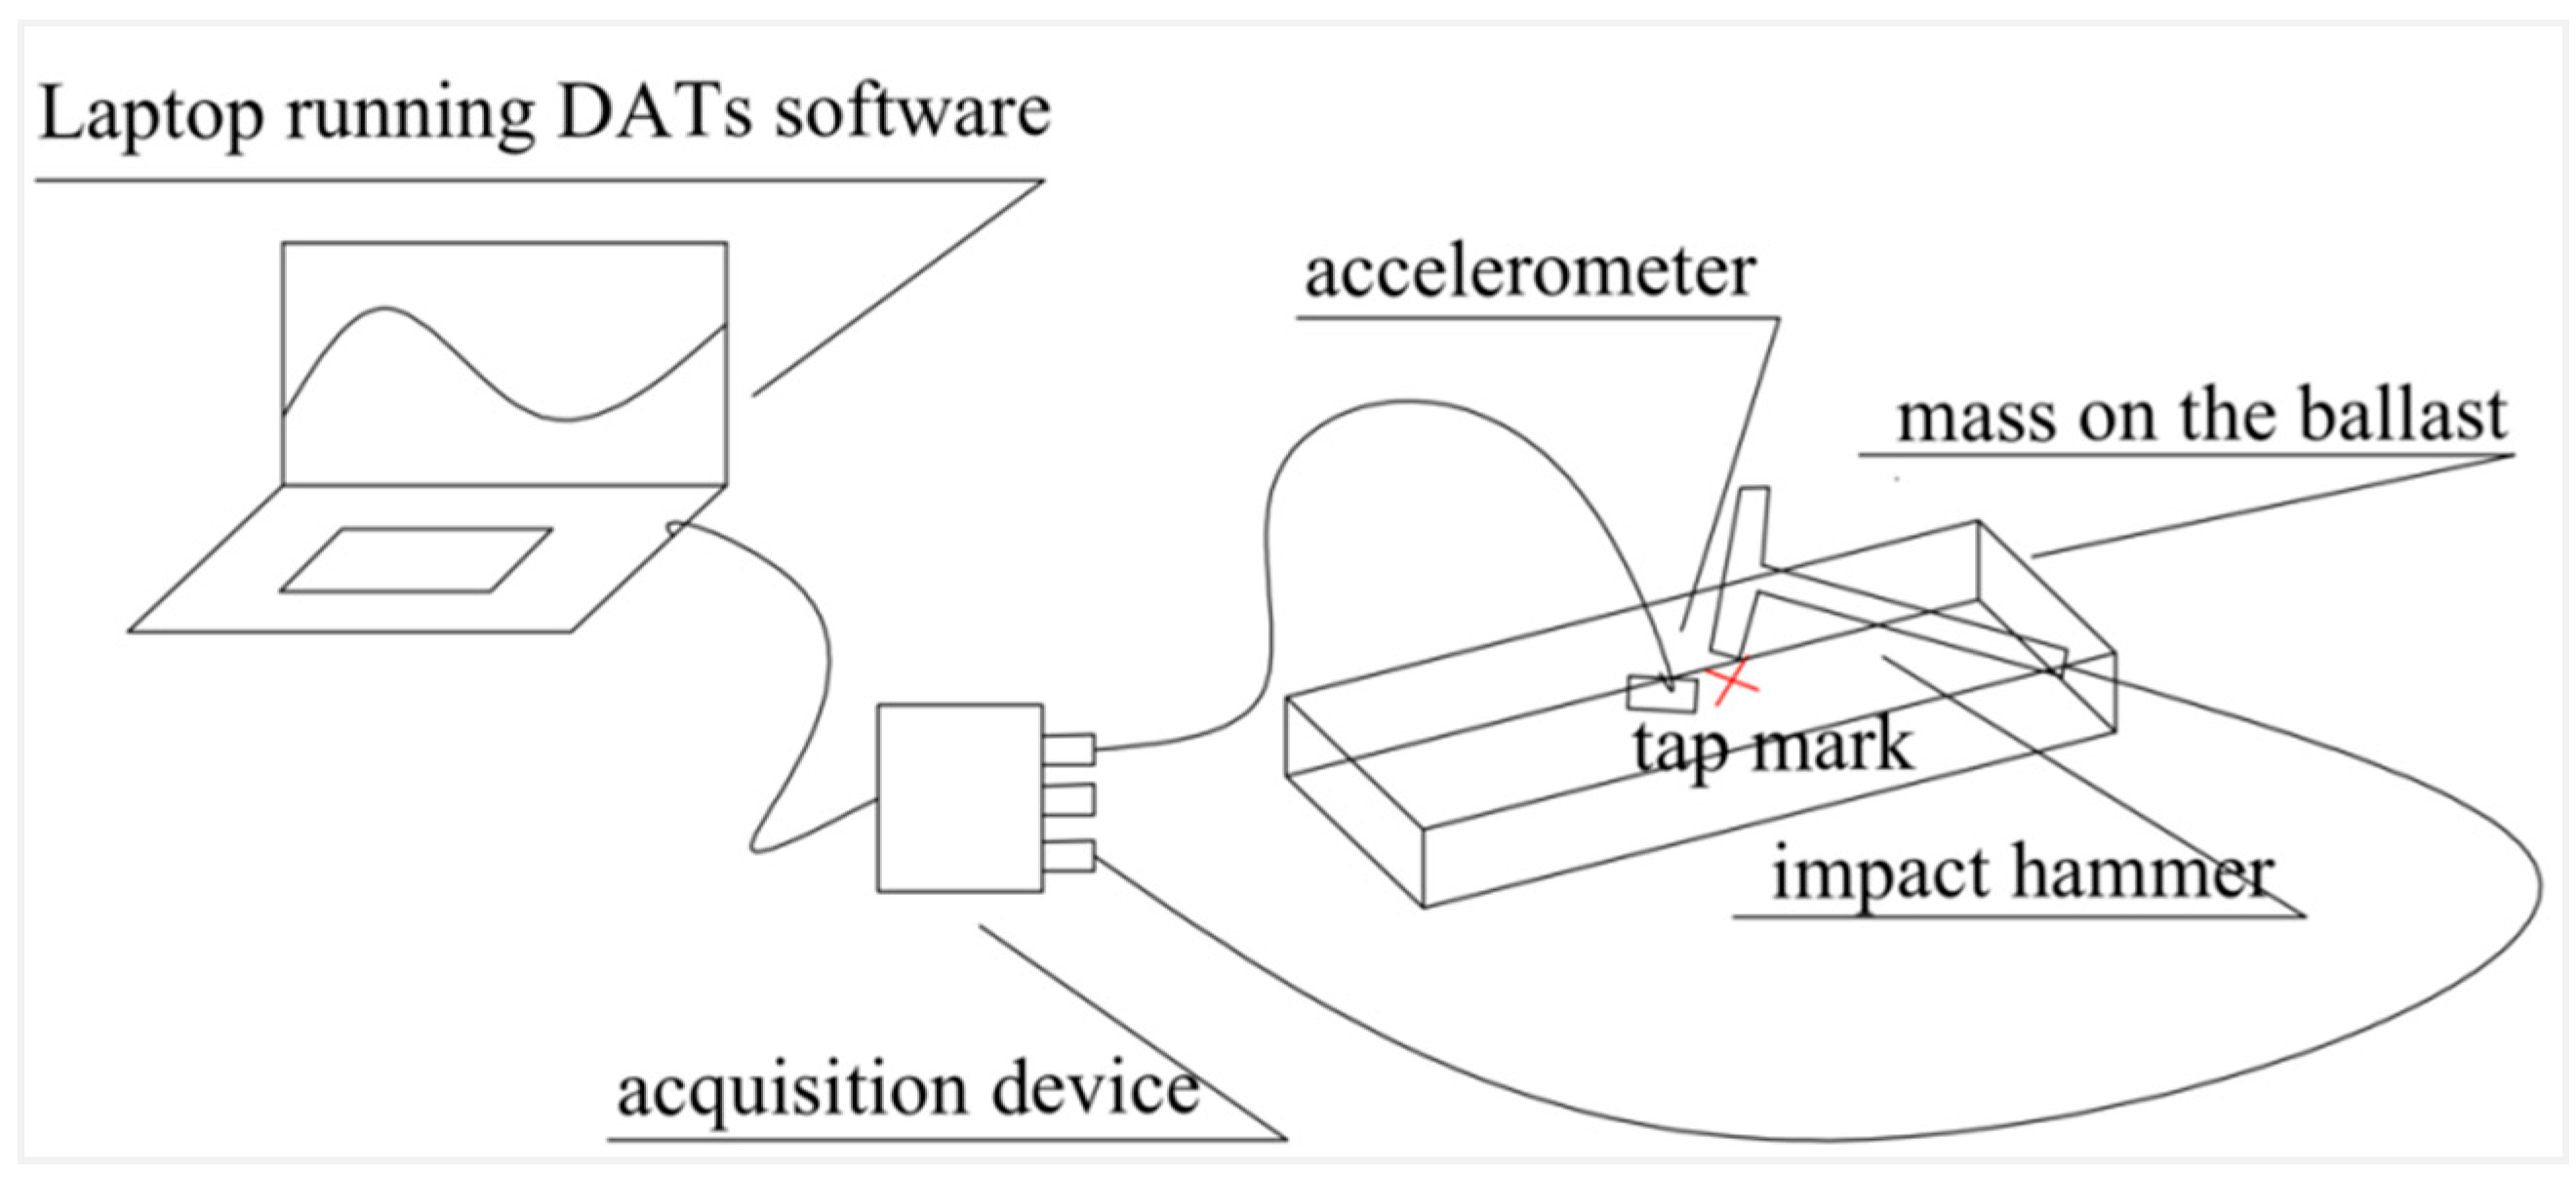
2.2.1. Identification of Dynamic Parameters Using an Instrumented Hammer
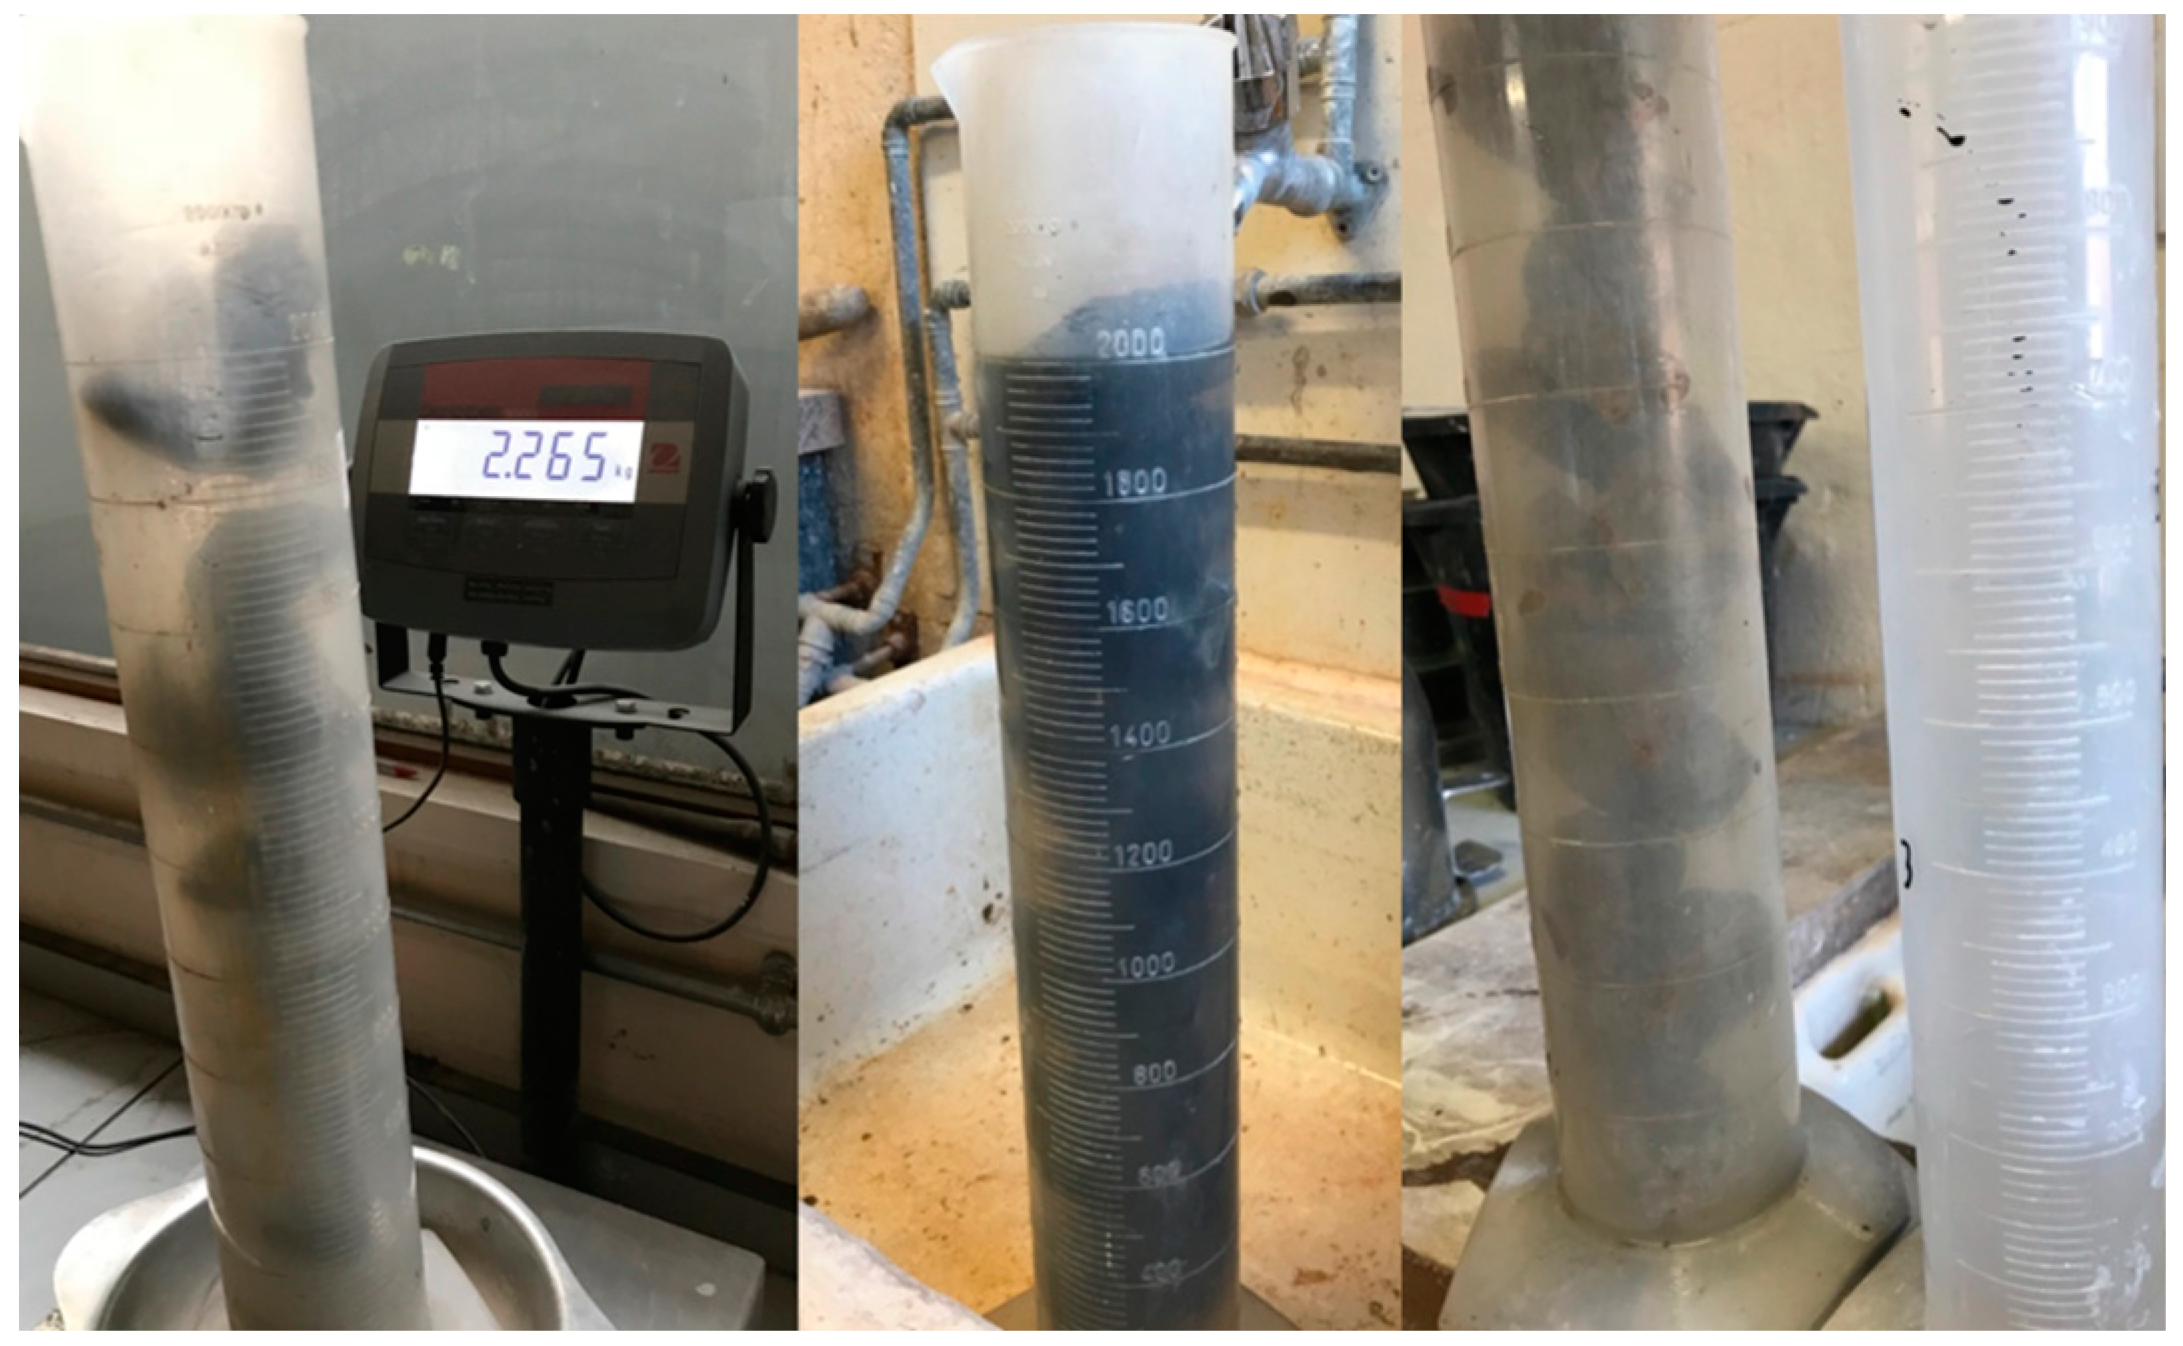
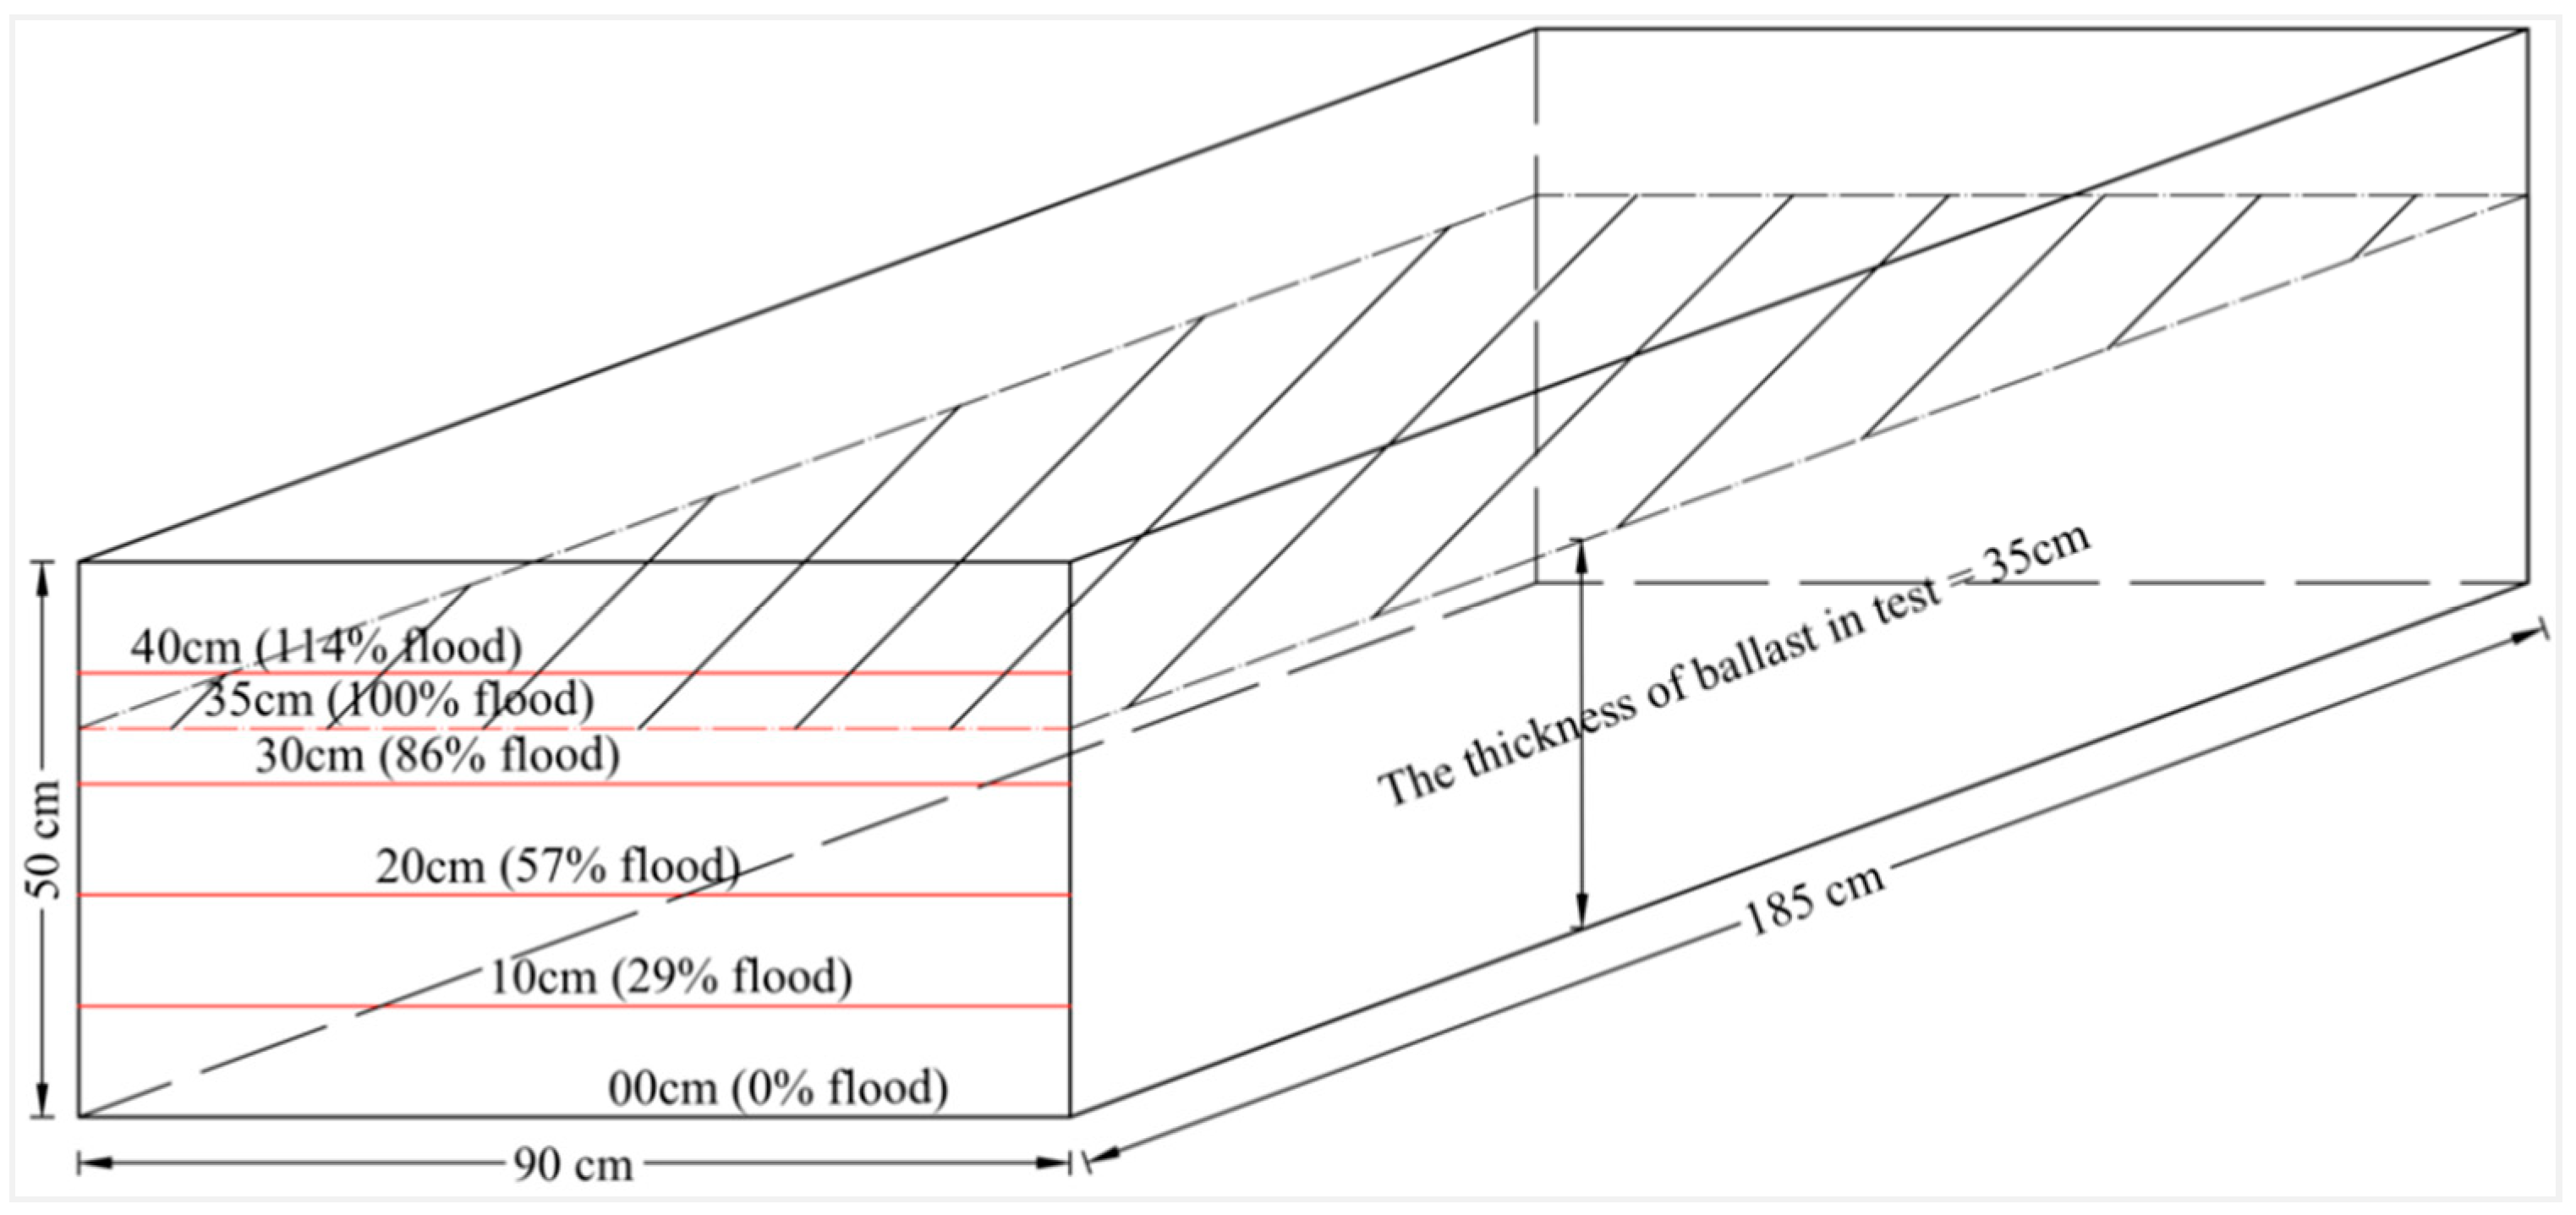
2.2.2. Simulating Floods in Ballast
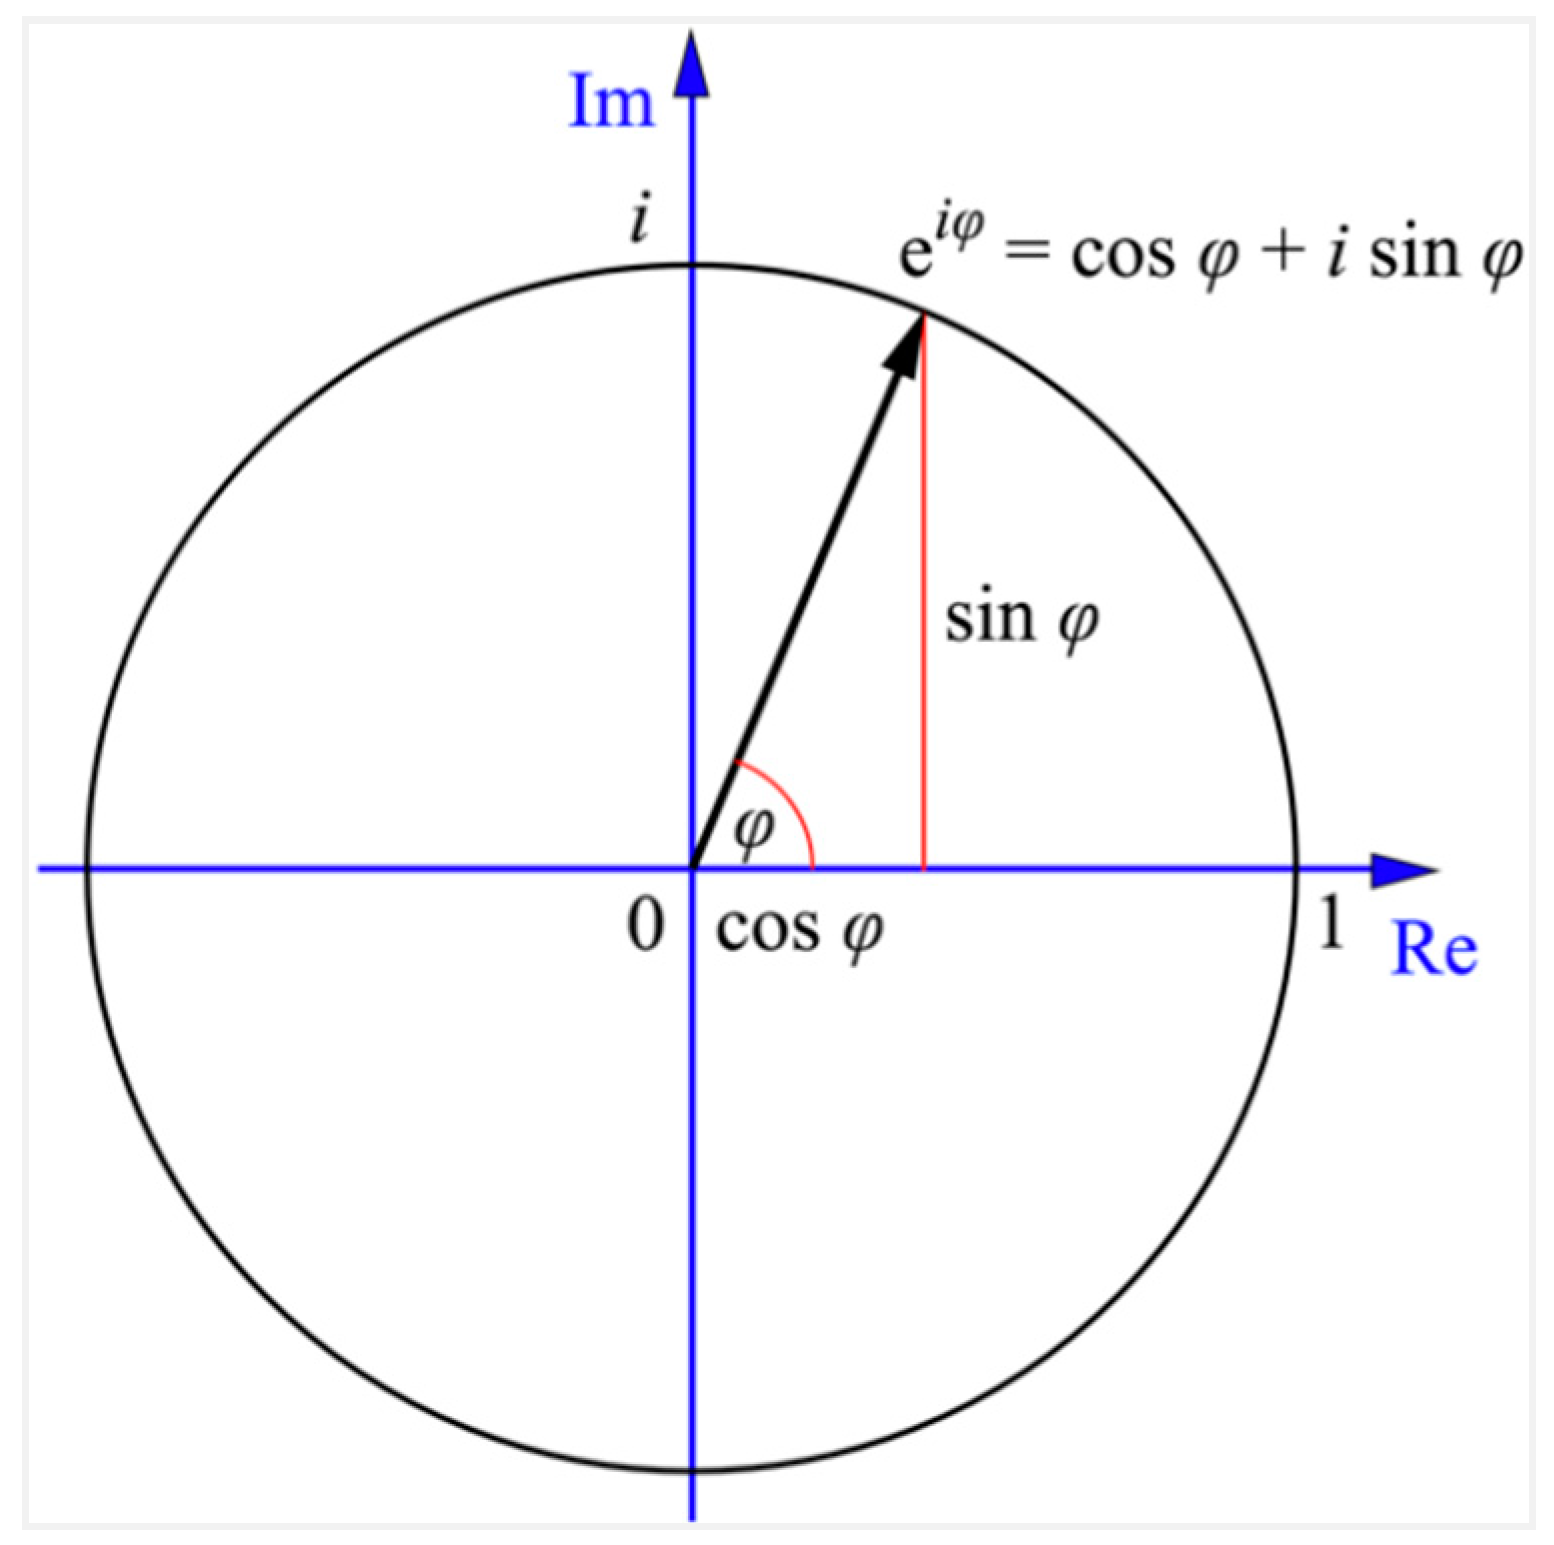
2.2.3. Model Built Using Fourier Transformation
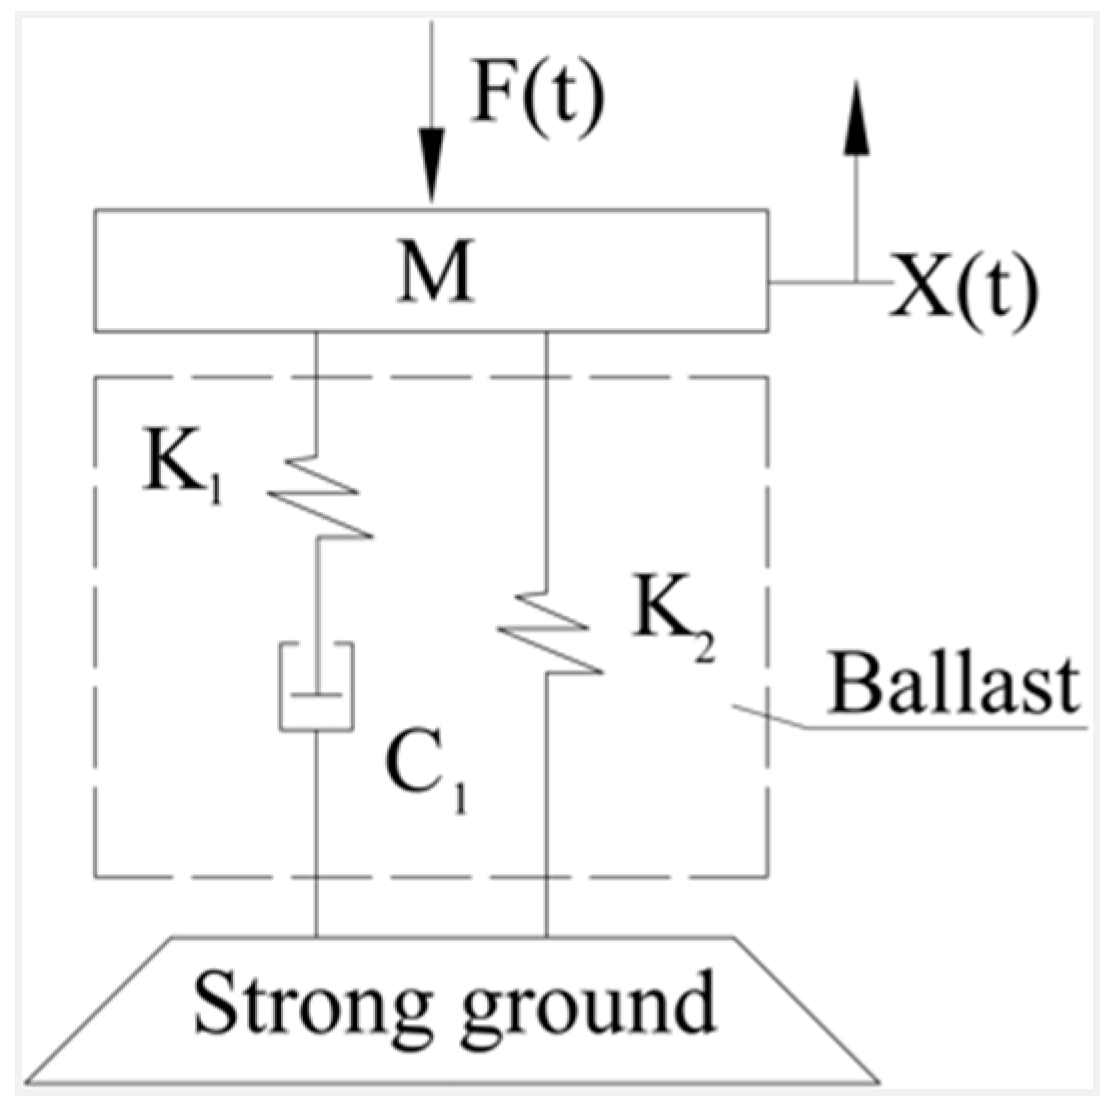
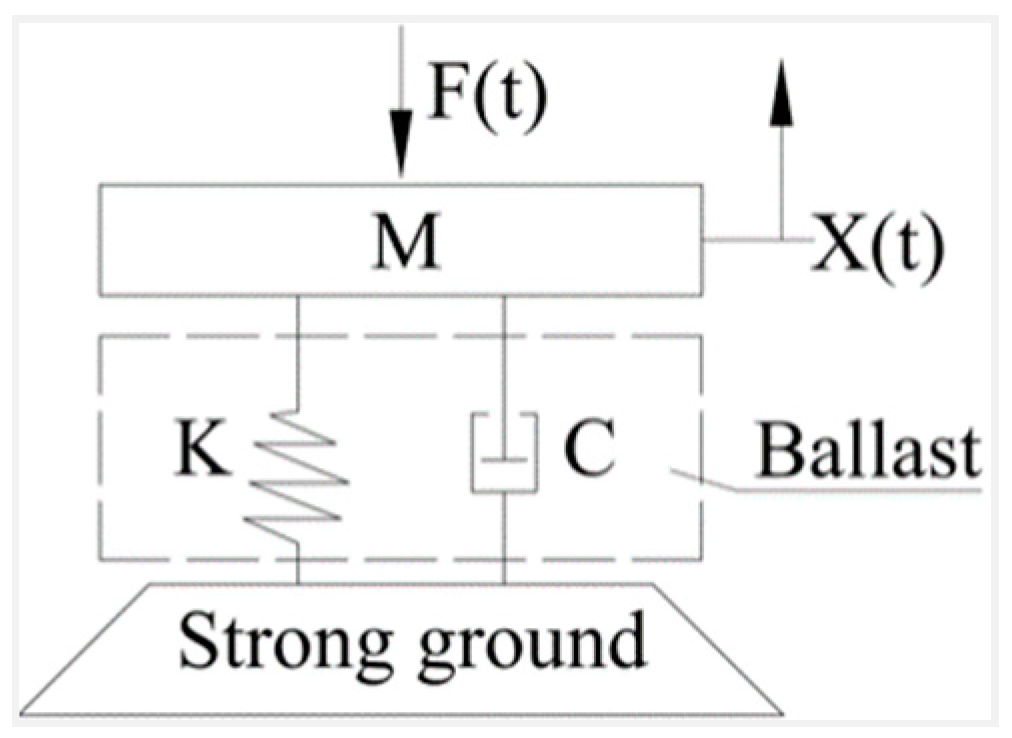
- K1 = frequency-dependent stiffness (N/m)
- K2 = frequency-independent stiffness (N/m)
- C1 = frequency-dependent viscous damping (Ns/m)
- α = stiffness fractional coefficient
- β = damping fractional coefficientwhere ω is the radial frequency (s − 1), ω = 2πf; and z is the partial inverse loss value (s − 1), z = K1/C1 [39].
2.2.4. Modal Identification by Best Curve Fitting Method
3. Results
3.1. Experimental Results and Justification
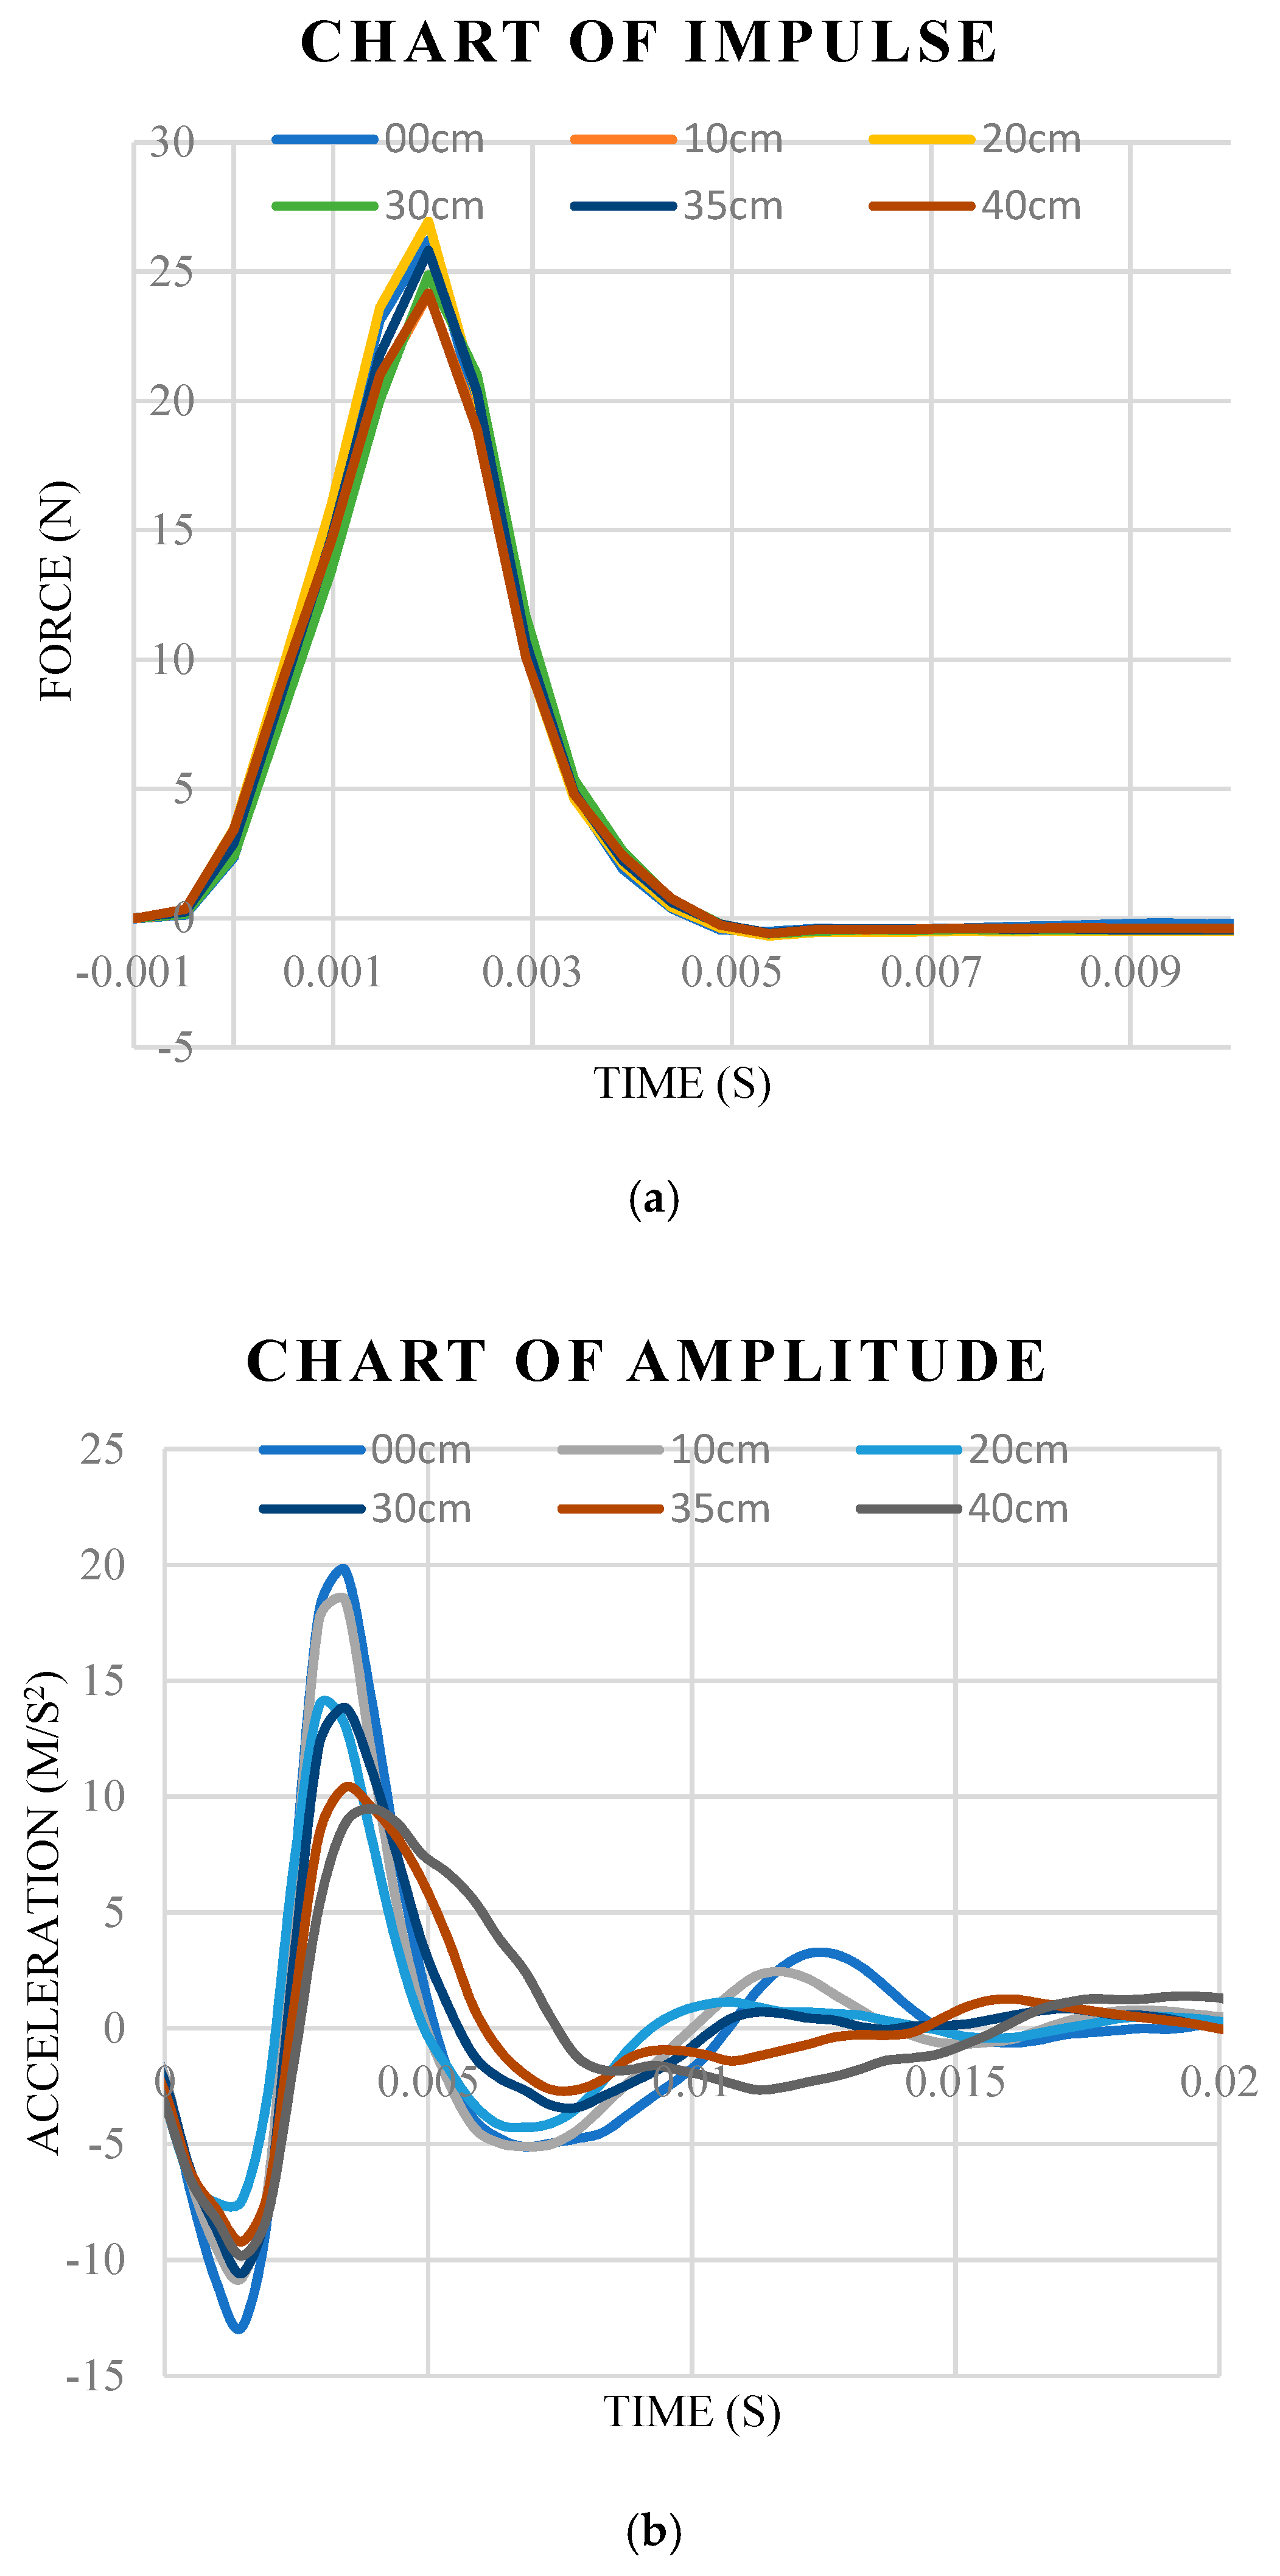
3.1.1. The Transient Forces
3.1.2. The Changed Acceleration
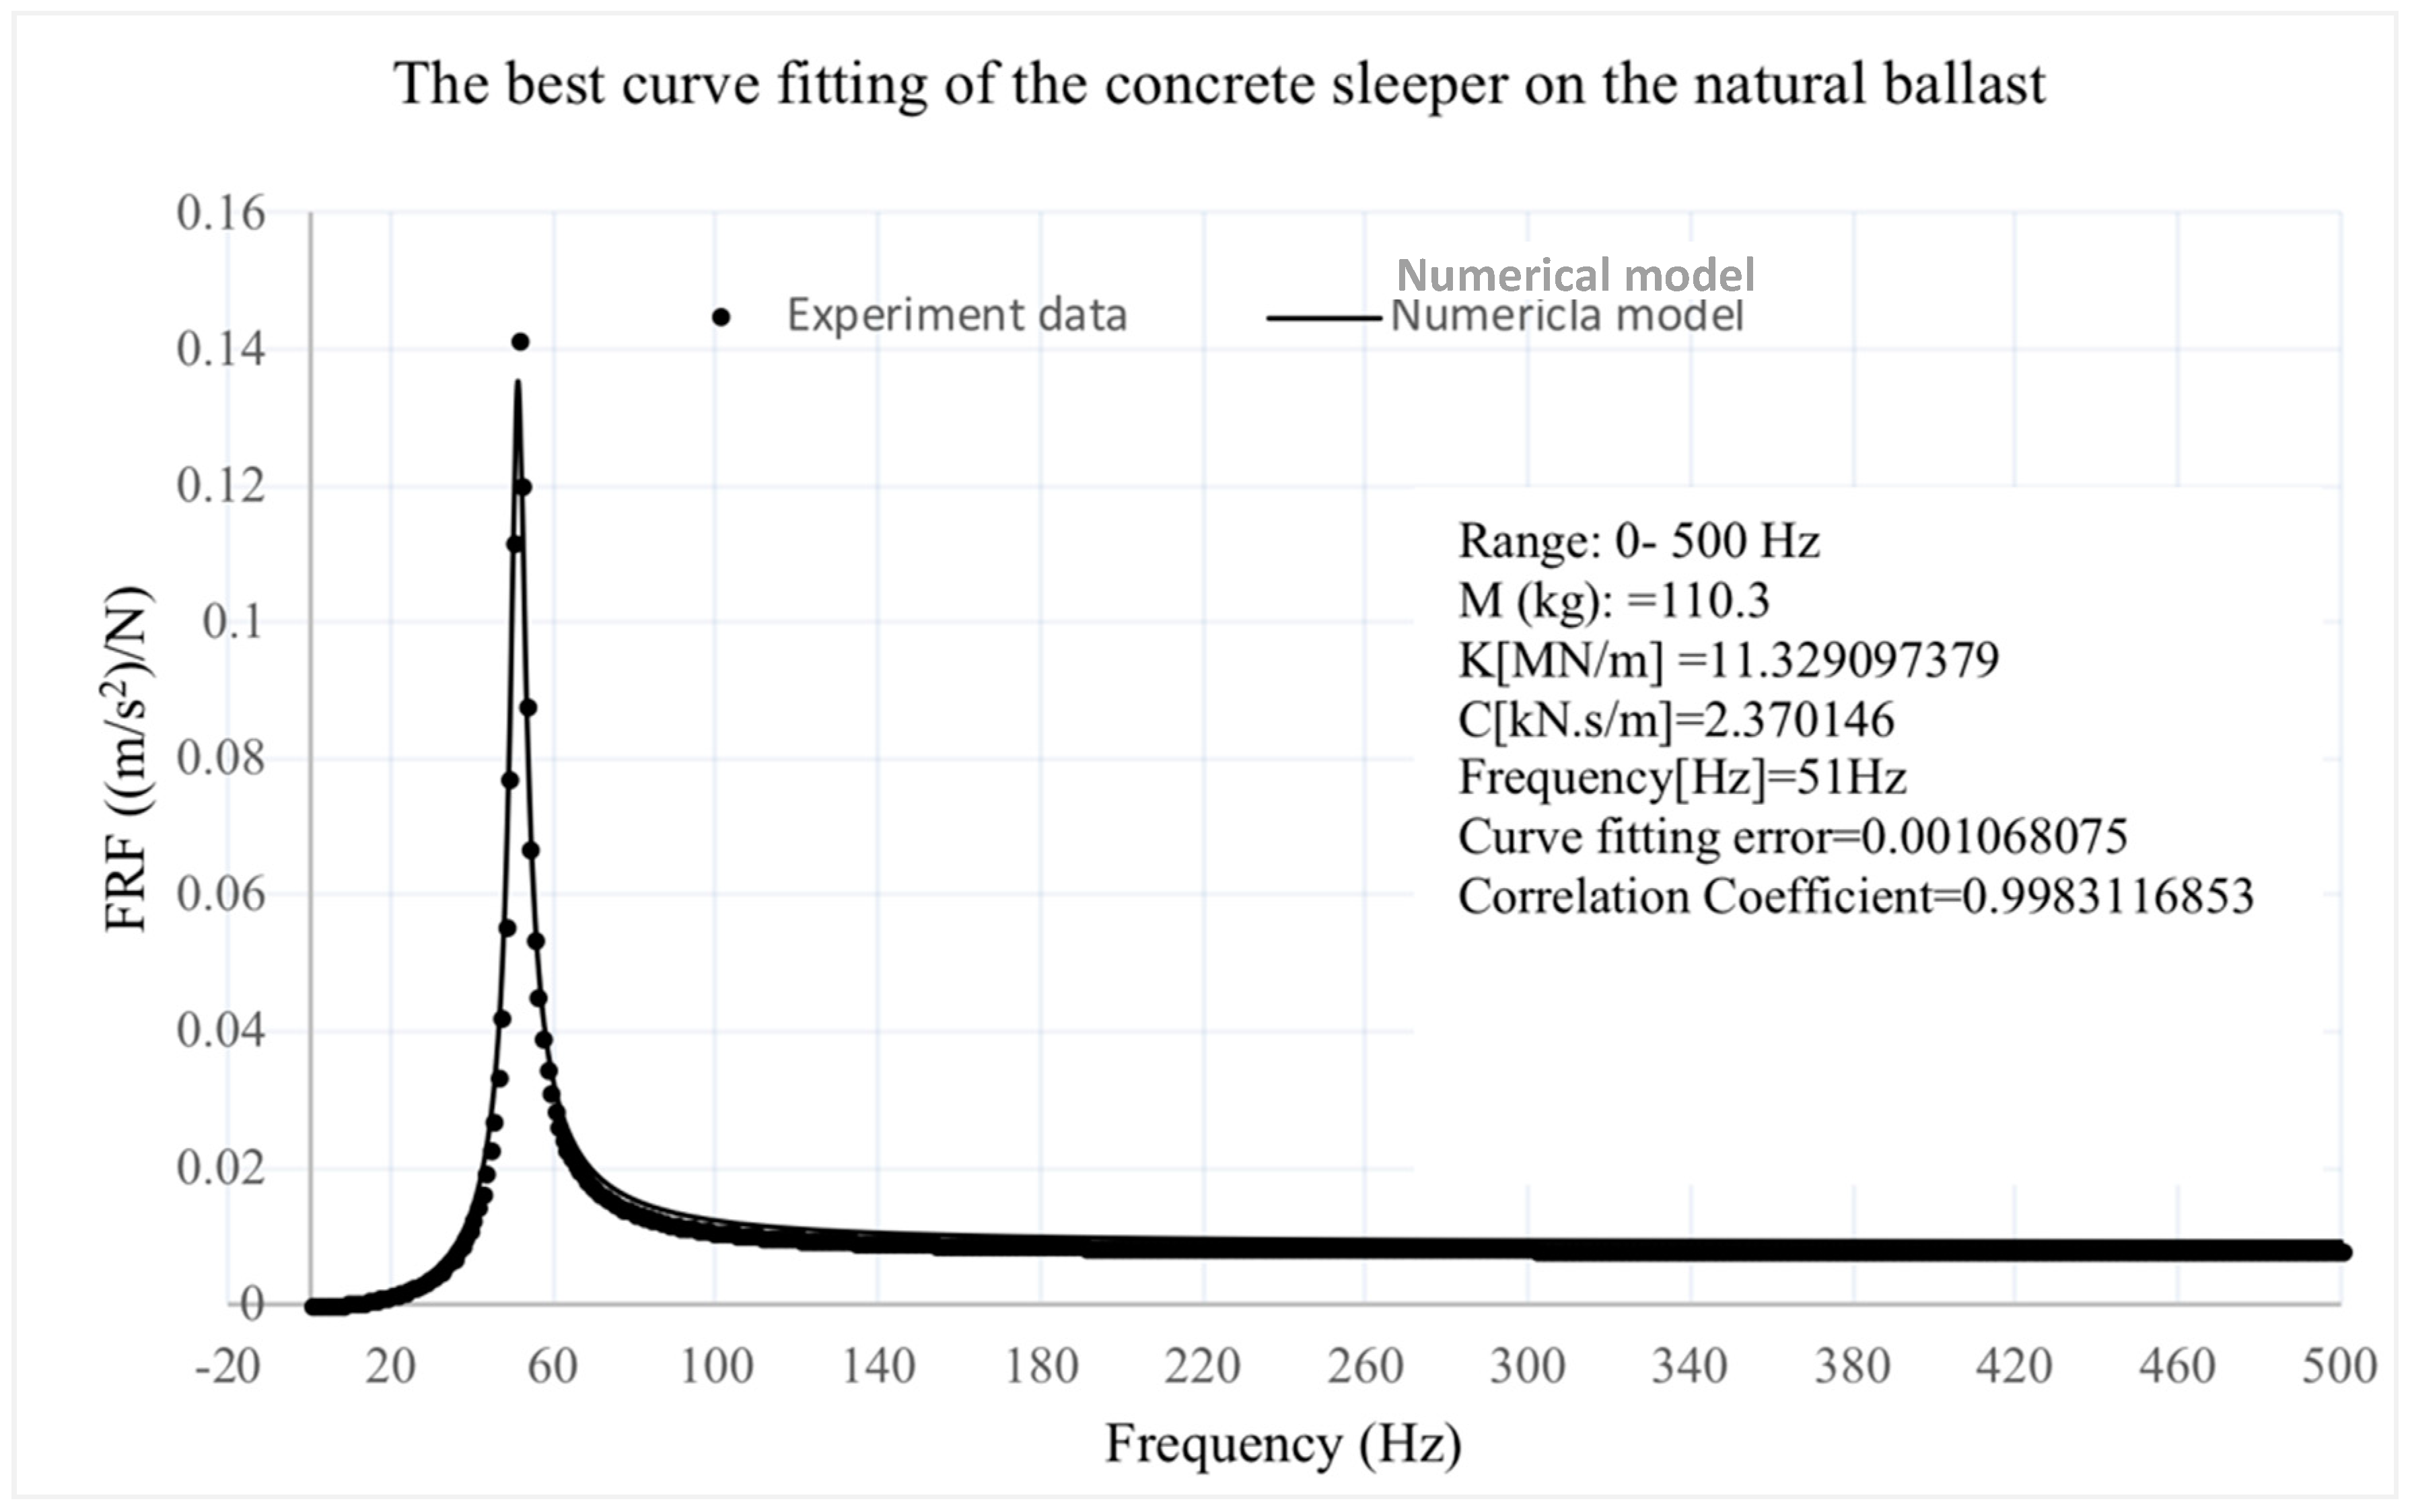
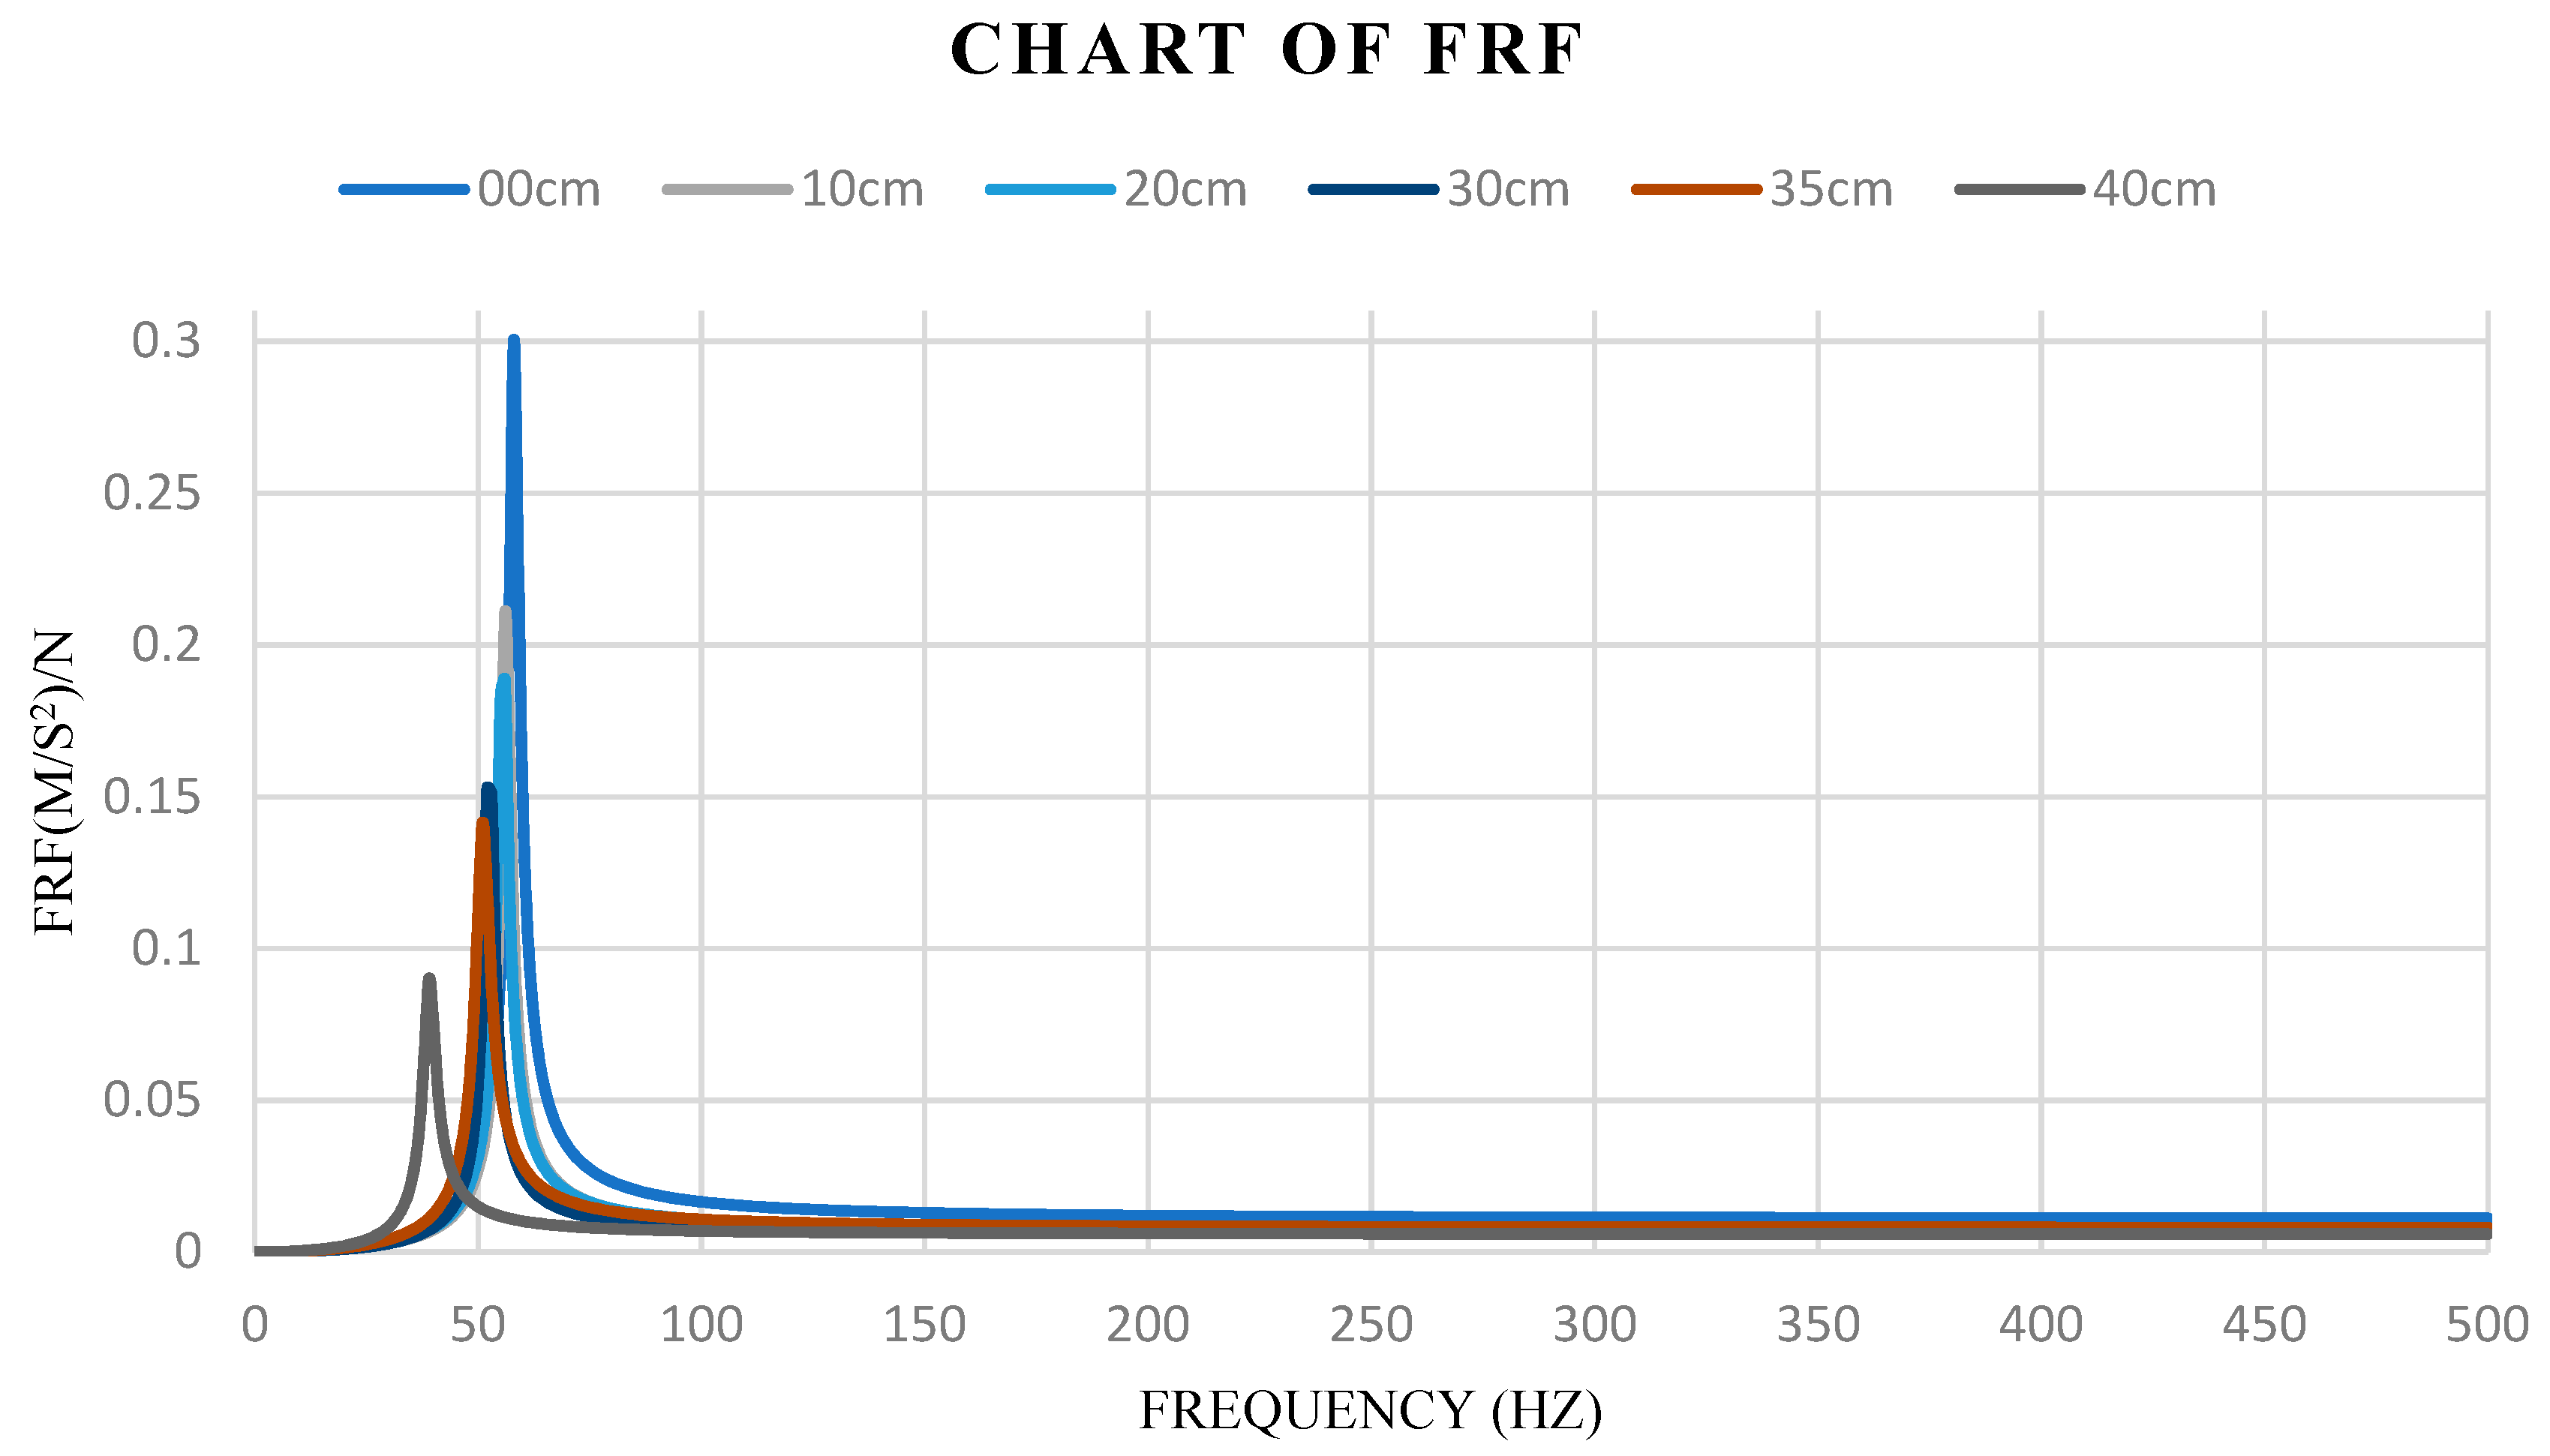
3.1.3. The Changed Frequency Response Function (FRF)
3.1.4. Discussion
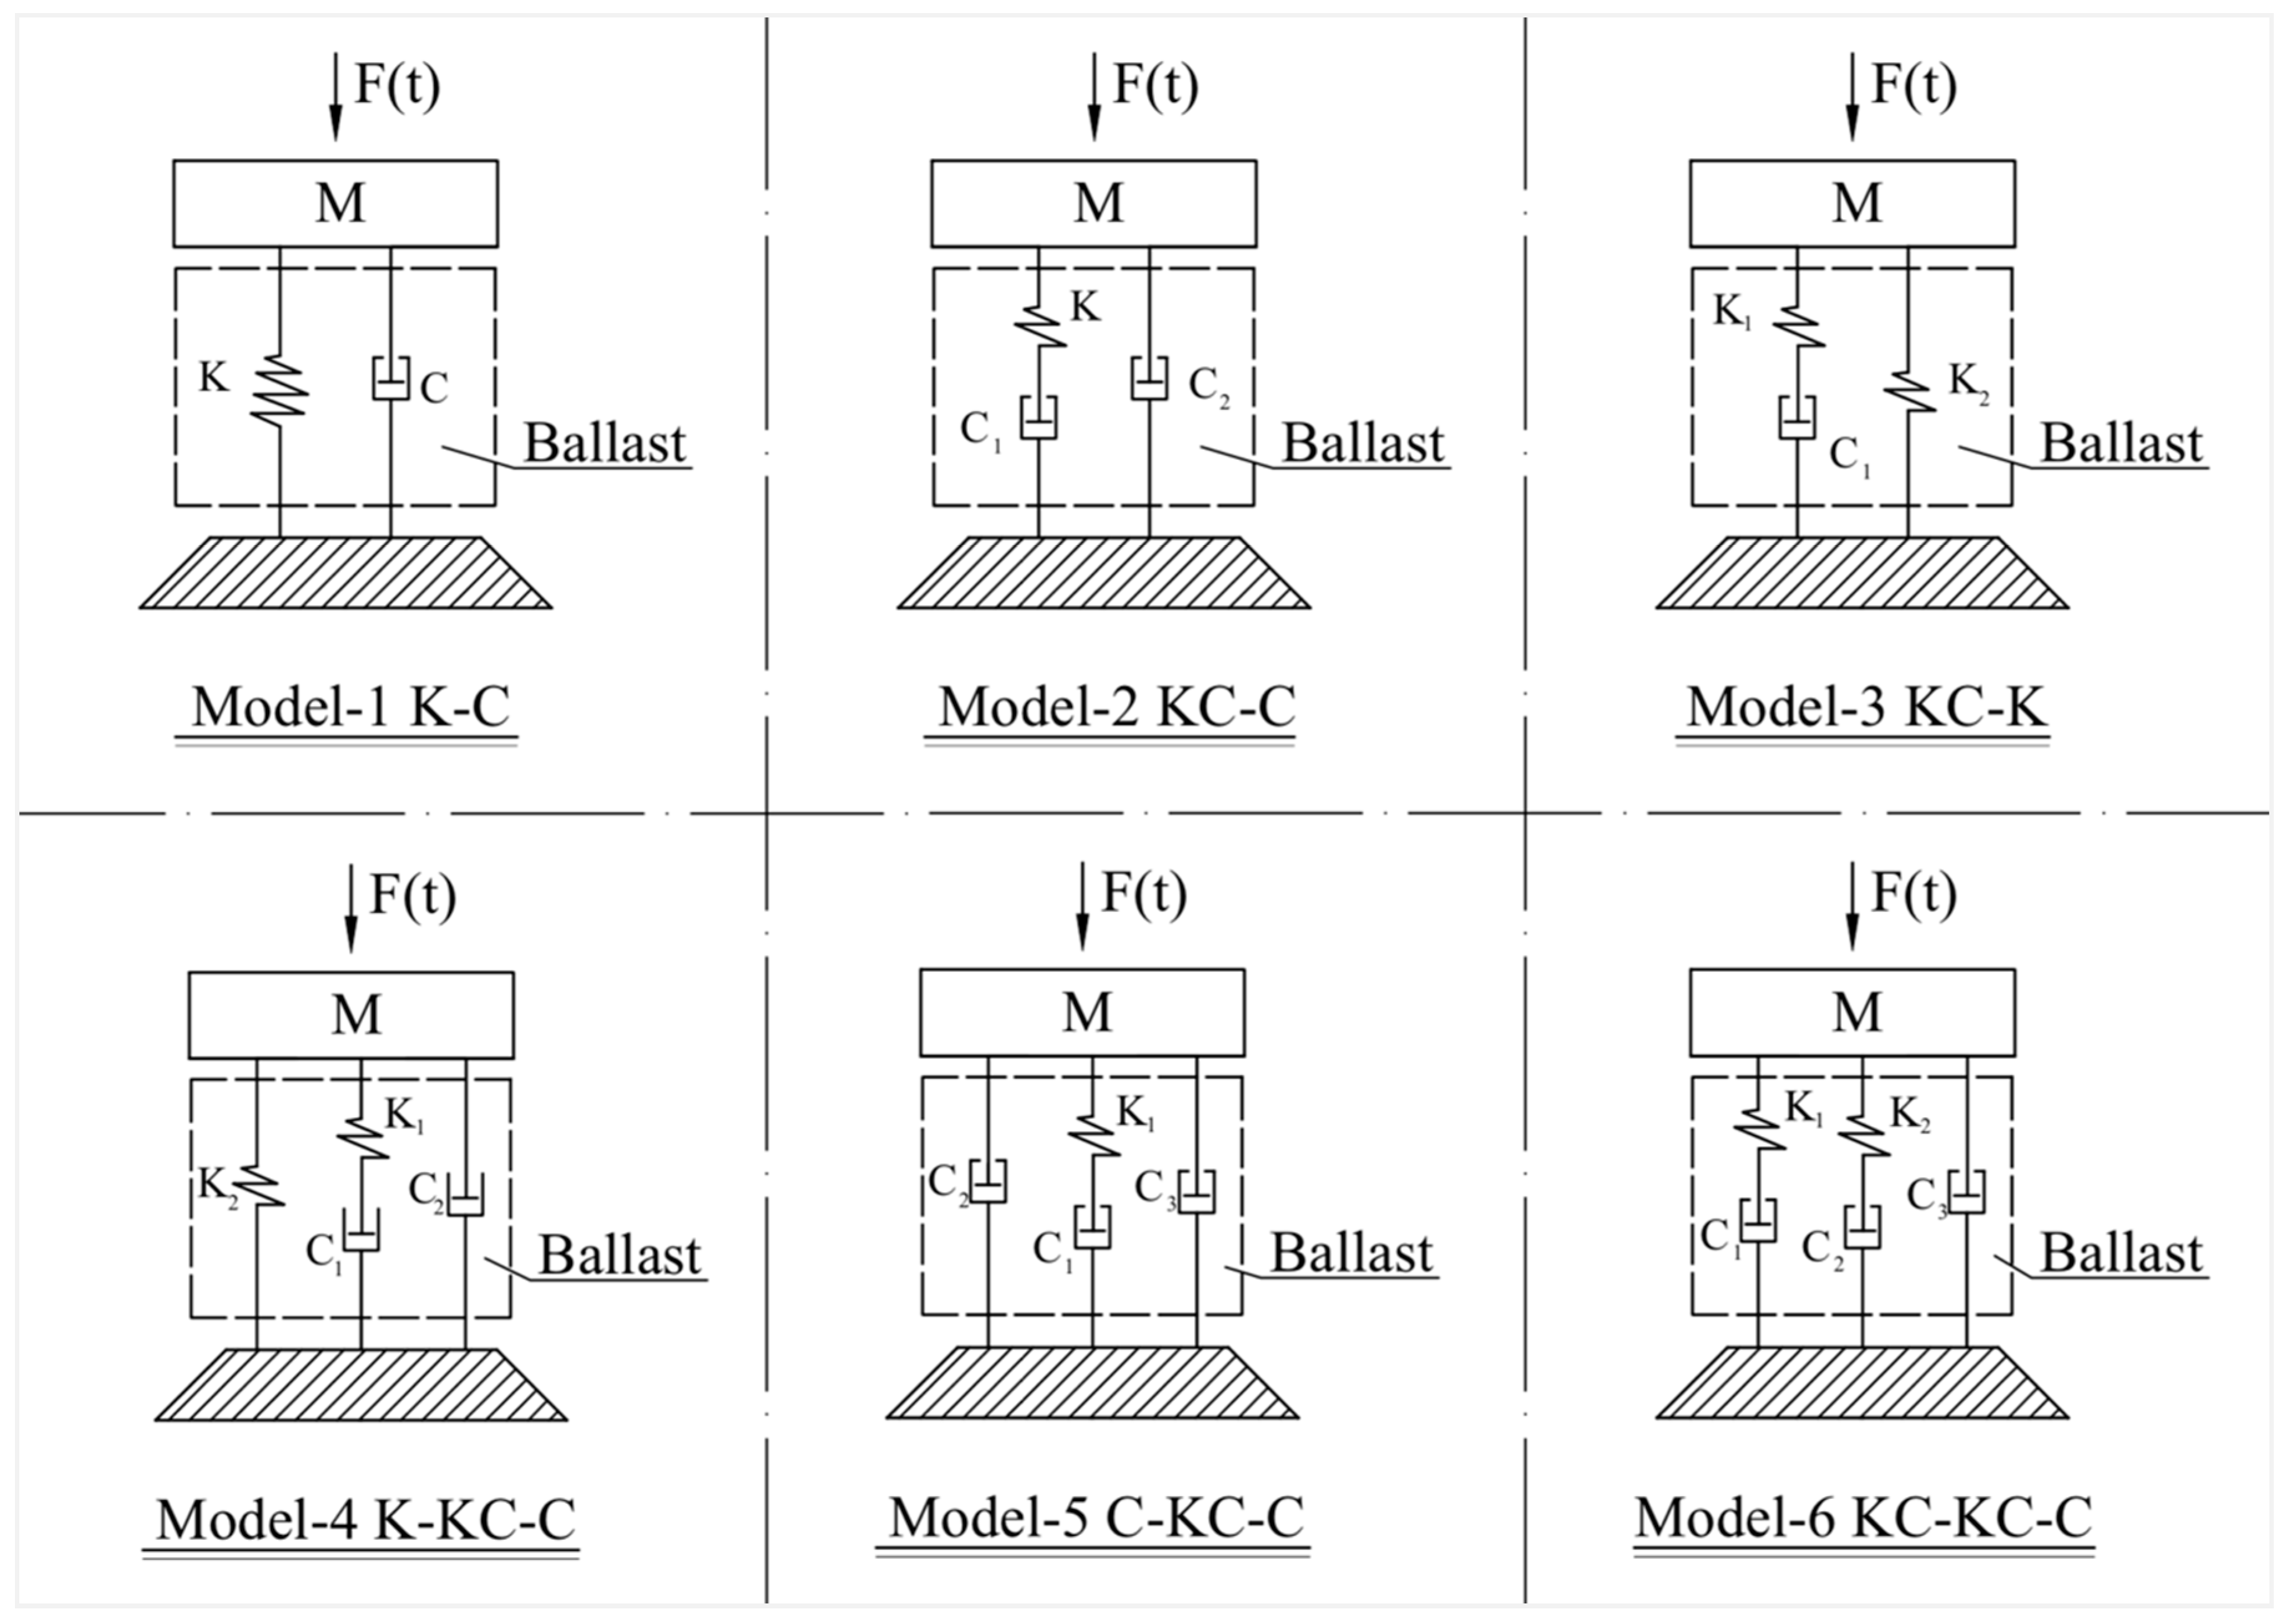
3.2. Modal Idealisation Concepts
3.2.1. Model-1 ‘K-C’
3.2.1.1. Model Building
3.2.1.2. The Model Result
3.2.1.3. Discussion of Model-1
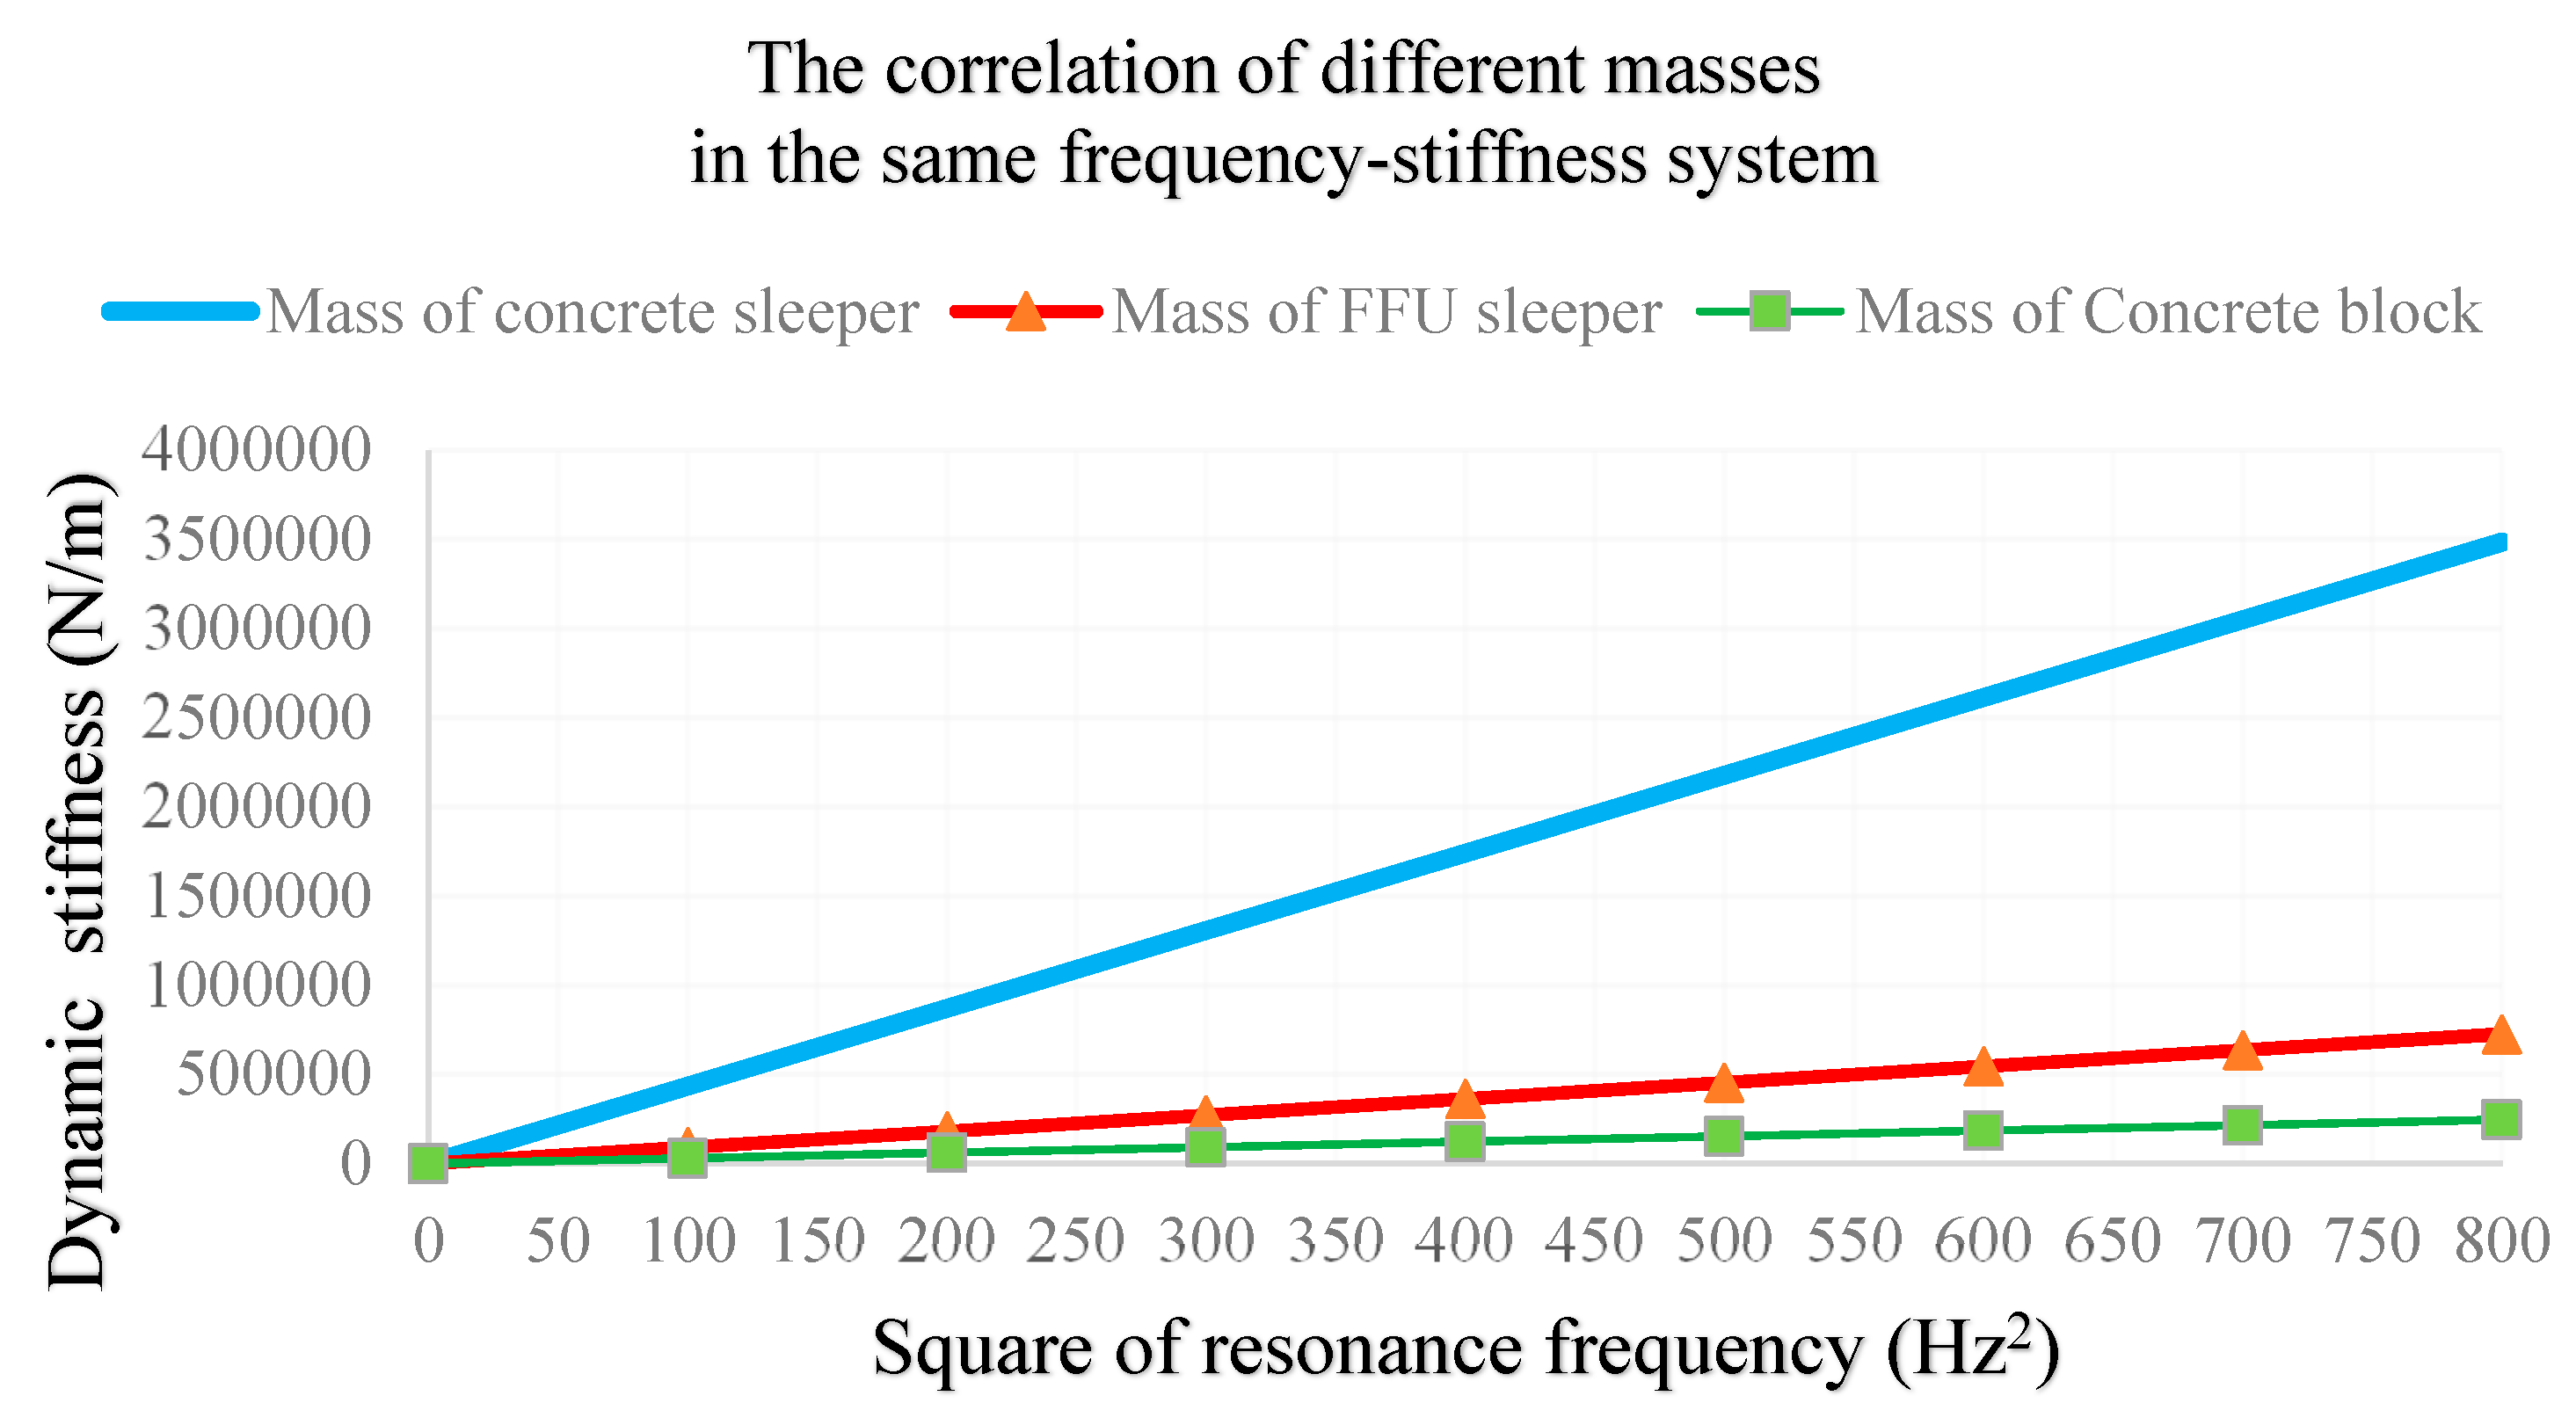
3.2.1.4. The Fixed Relationship between Different Masses
- γ: Correlation coefficient of different mass.
- M: The effective quality of this system, 7.815 kg, 23 kg, and 110.3 kg respectively.
- K: Different dynamic stiffness.
- f: The resonant frequency.
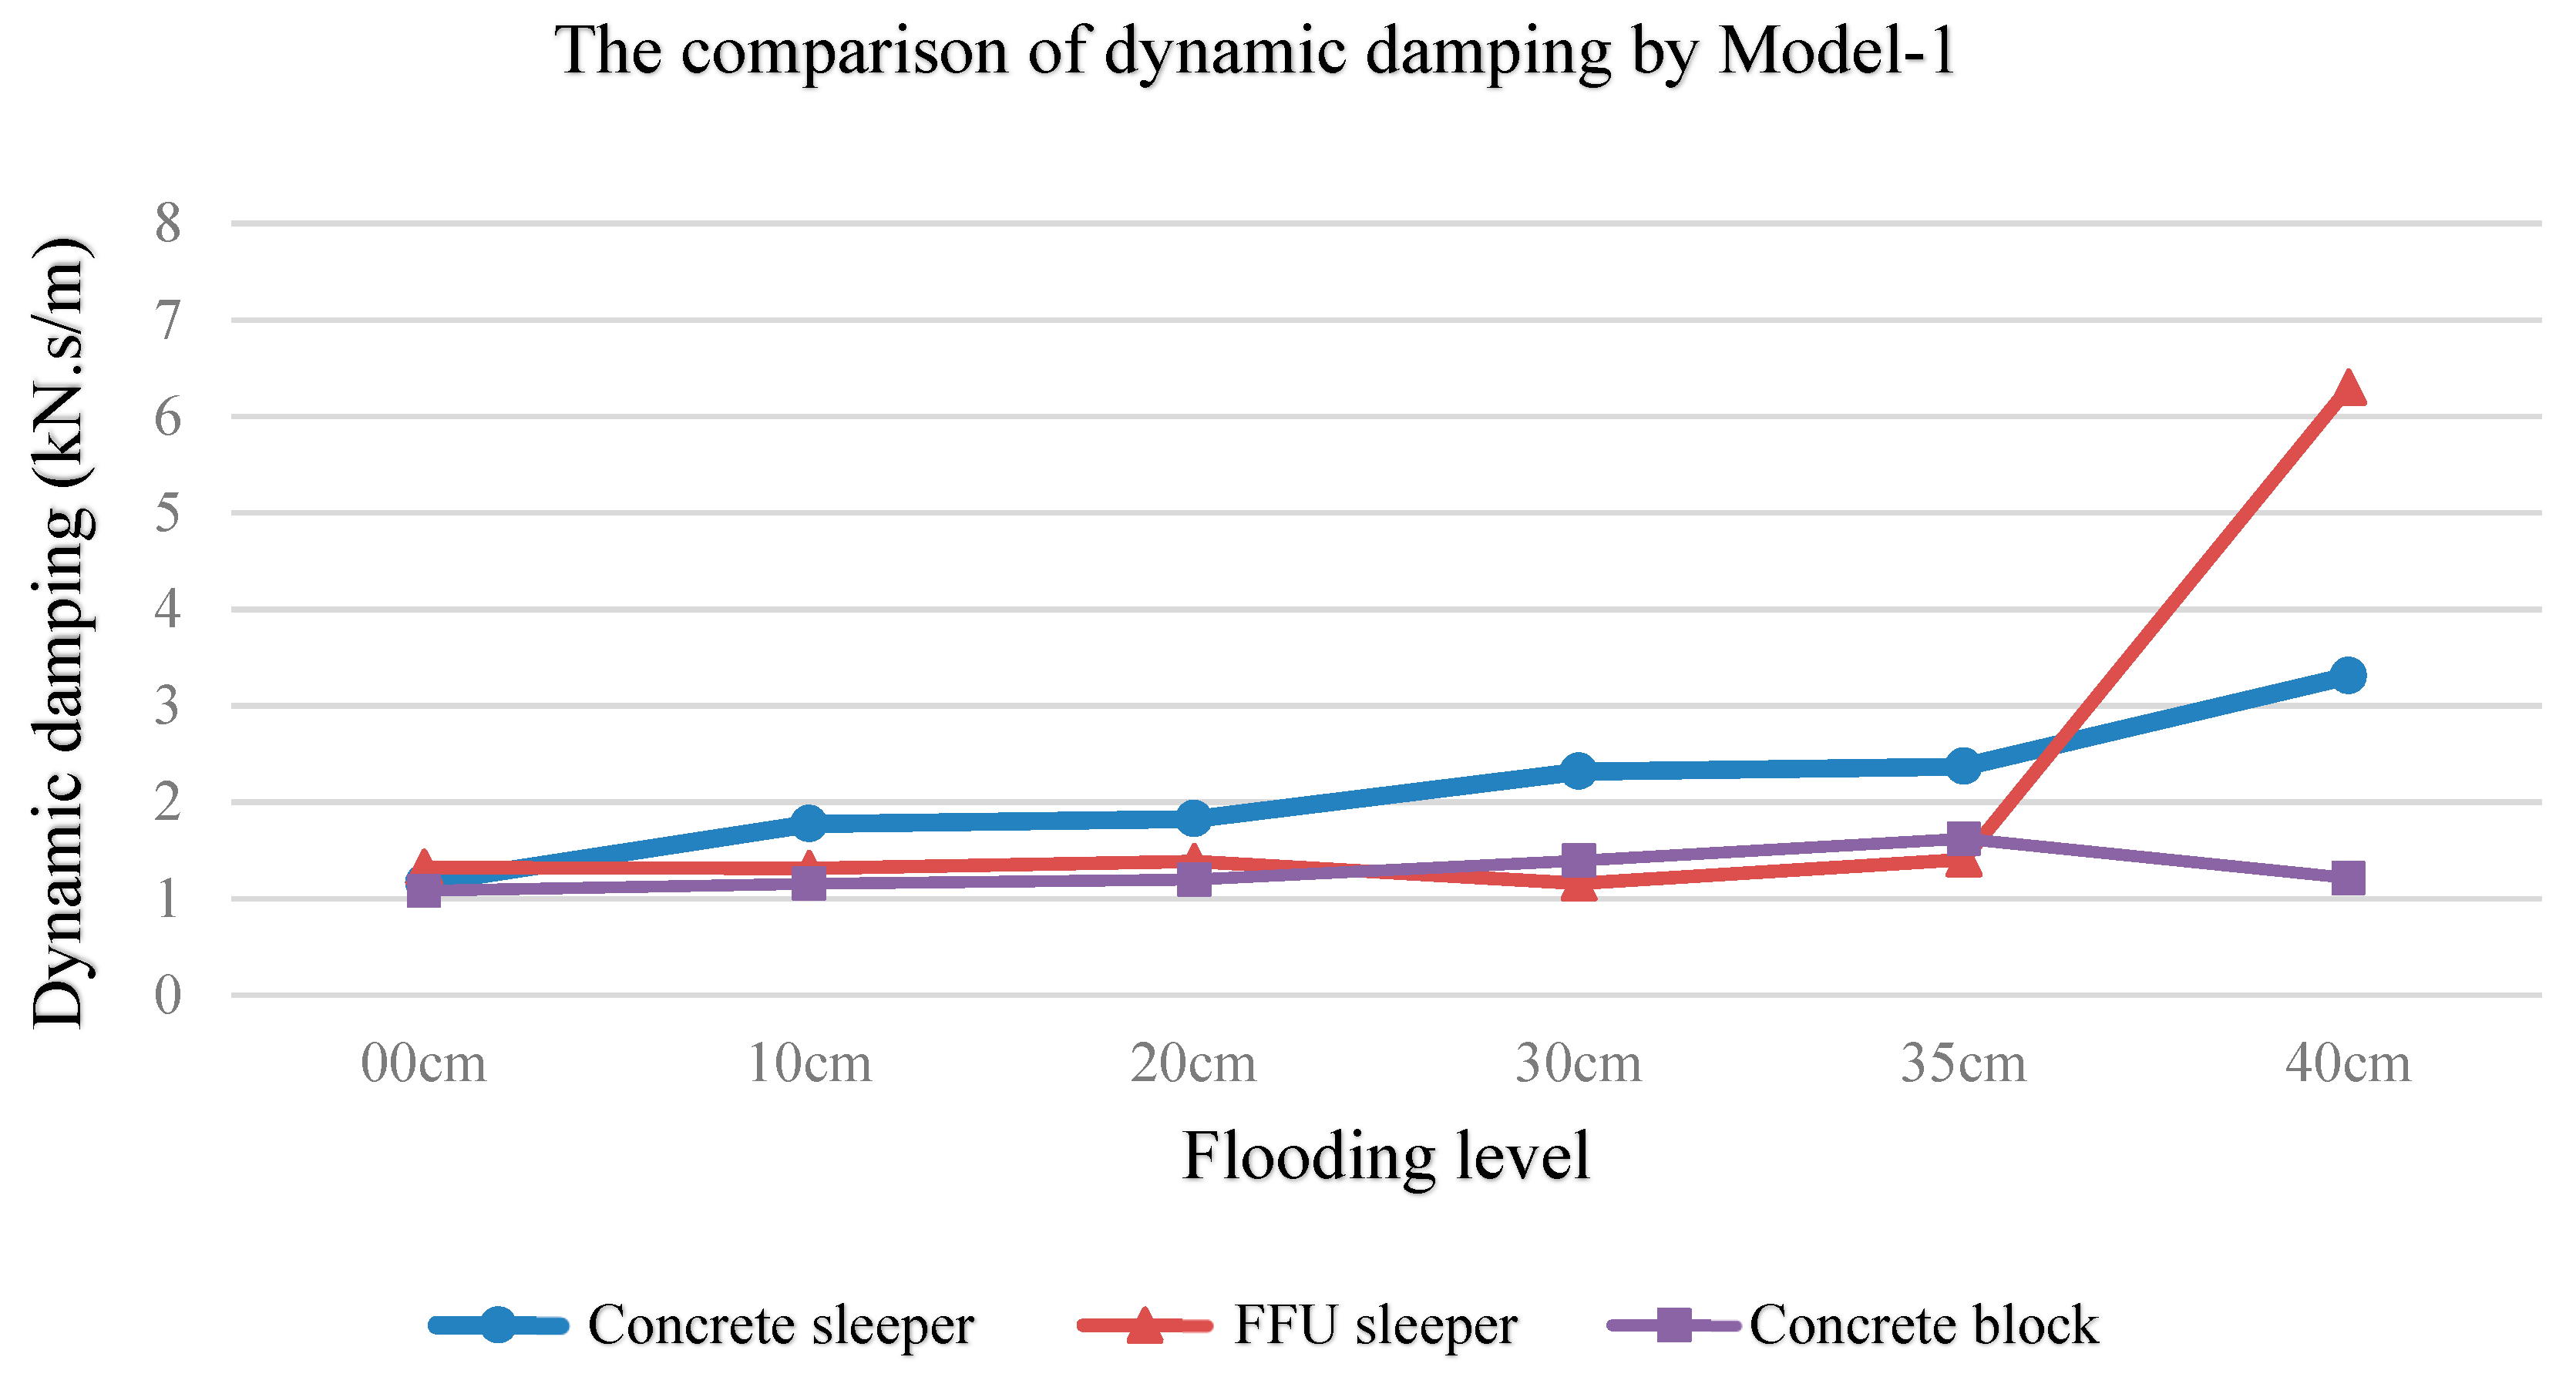
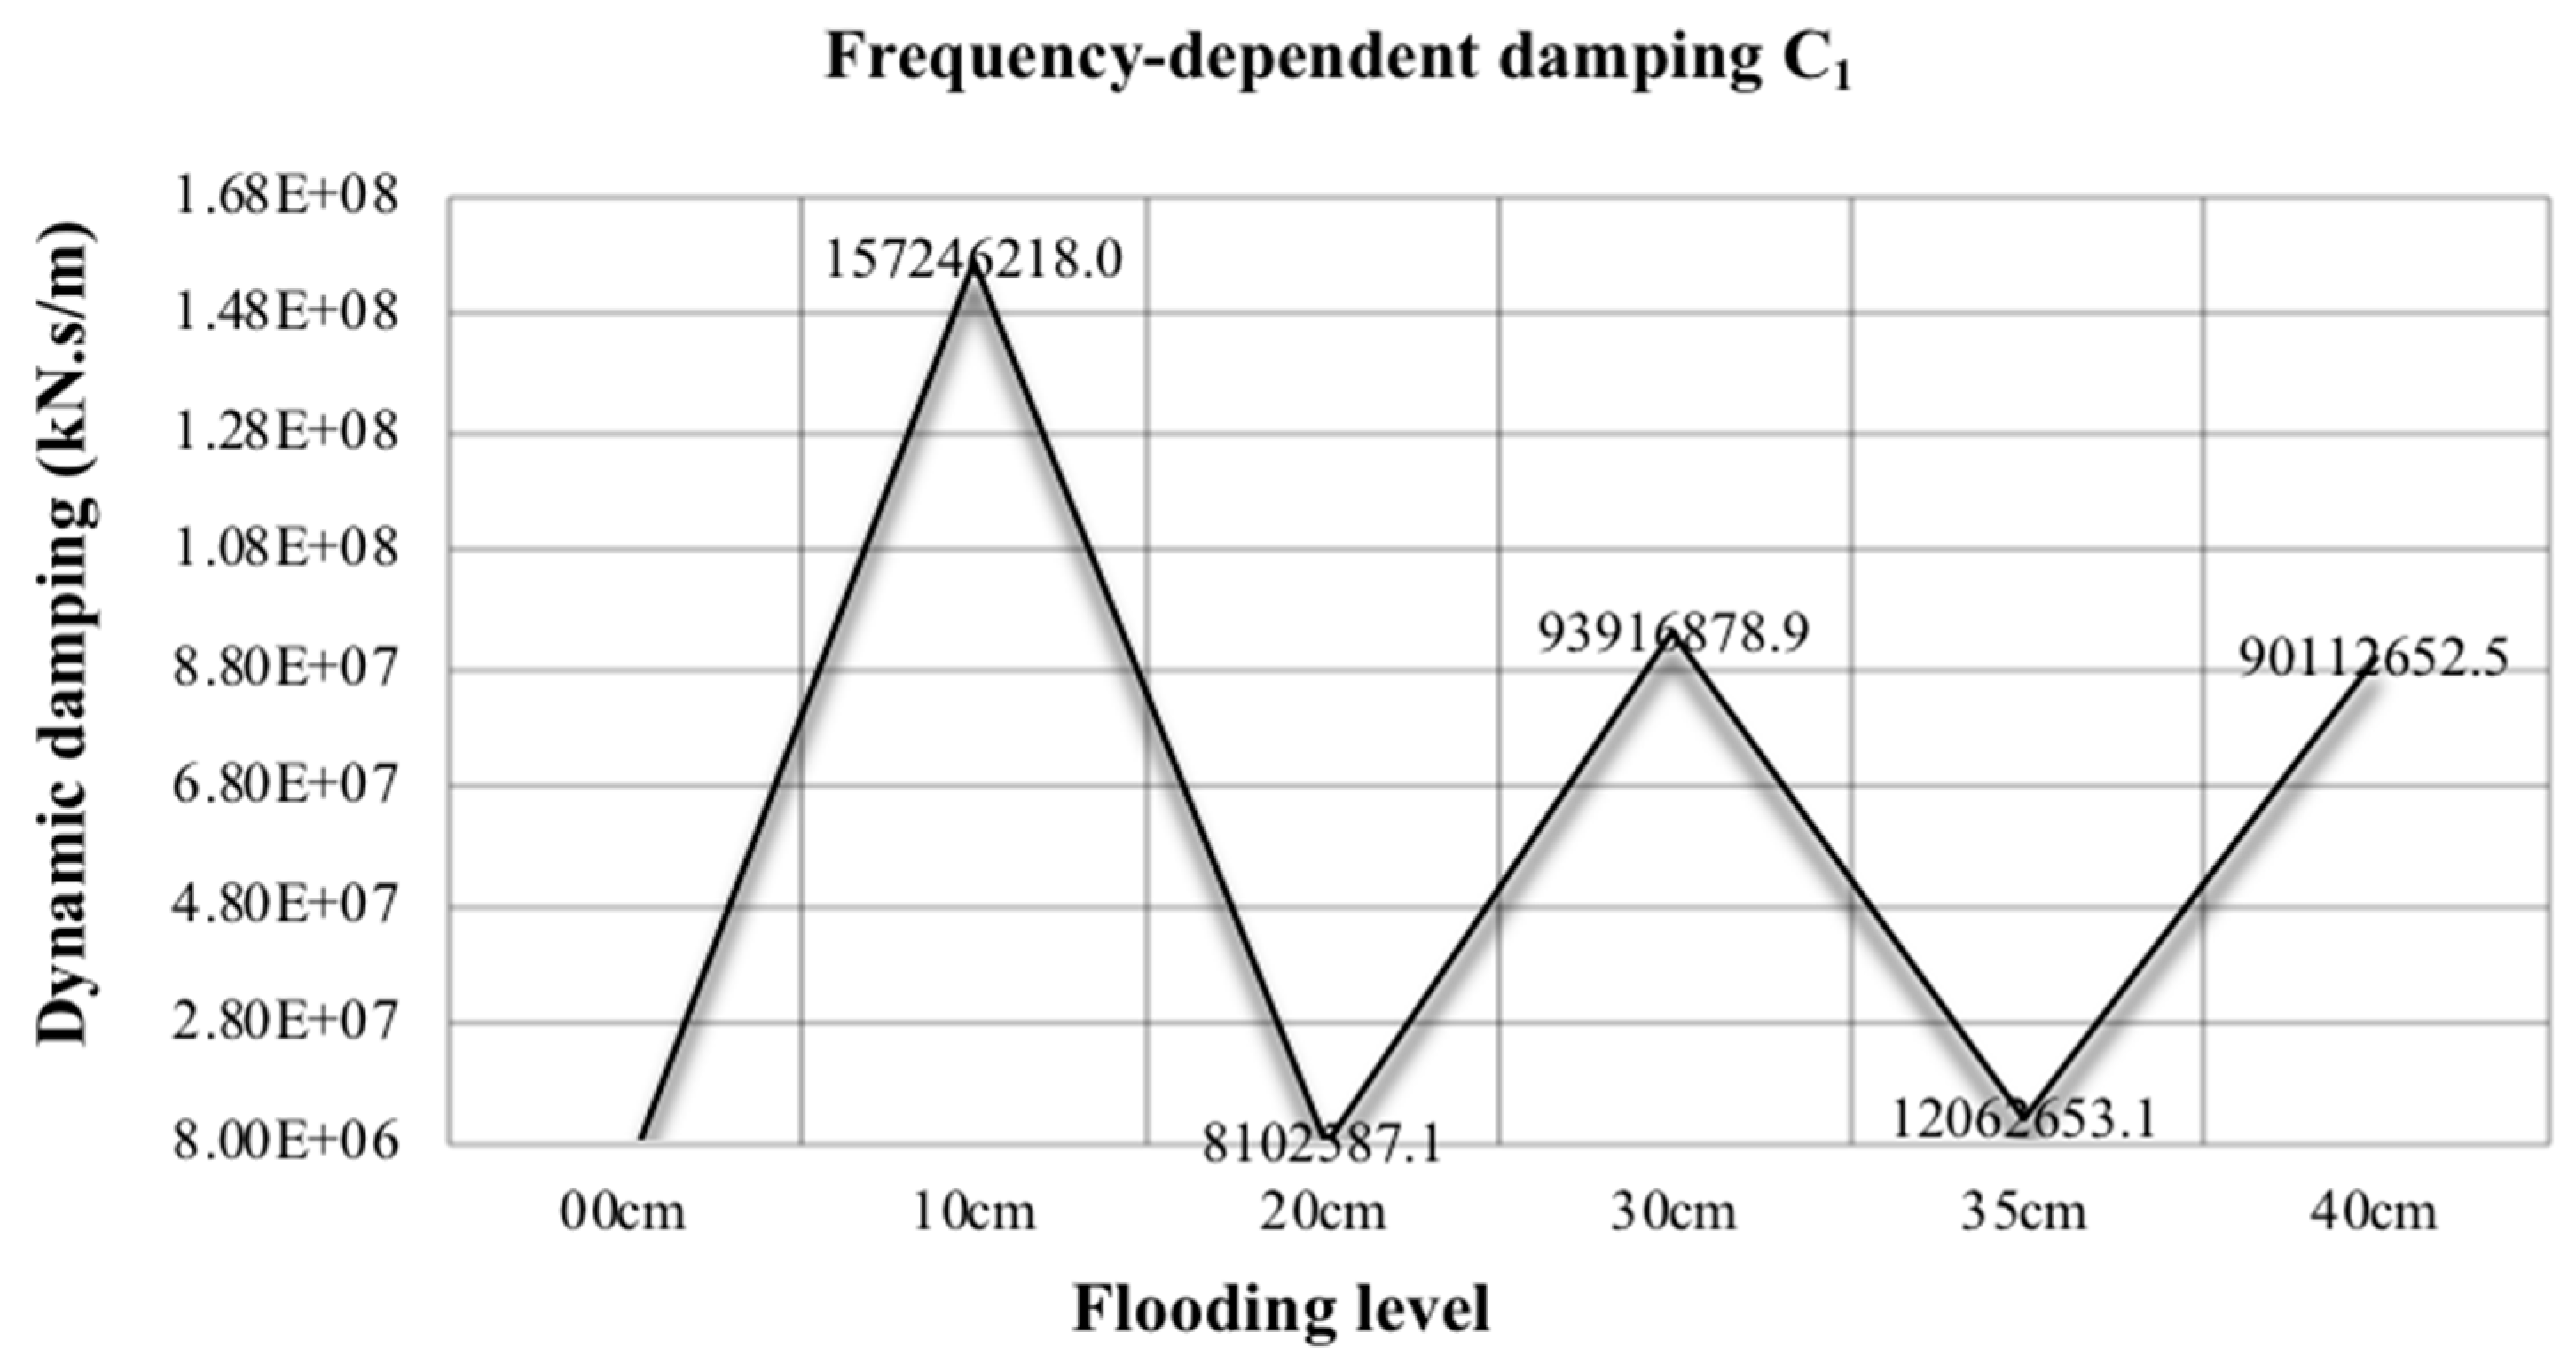
3.2.1.5. The Change of Dynamic Damping
- Overall, the dynamic damping tends to increase with the increasing flood level as illustrated in Figure 18. In particular, after the ballast is submerged, the damping tends to be affected and probably disturbed by buoyancy. After experiencing the flood environment, the dynamic characteristics of the identical ballast under different masses are different. Although the growth trend continues, the magnitude of the change is rather different. This can be because the water buoyancy could indirectly affect frequency changes, which in turn affects the identification of dynamic properties of ballast.
- Under dry conditions, the damping value of the ballast material is constant and is not affected by the difference in masses. The damping of natural ballast is somewhat stable at 1 kN·s/m.
3.3. Model-2 ‘KC-C’
3.3.1. Model Building
3.3.2. Model Result
3.3.3. Remark of Model-2
3.4. Model-3 ‘KC-K’
3.4.1. Model Building
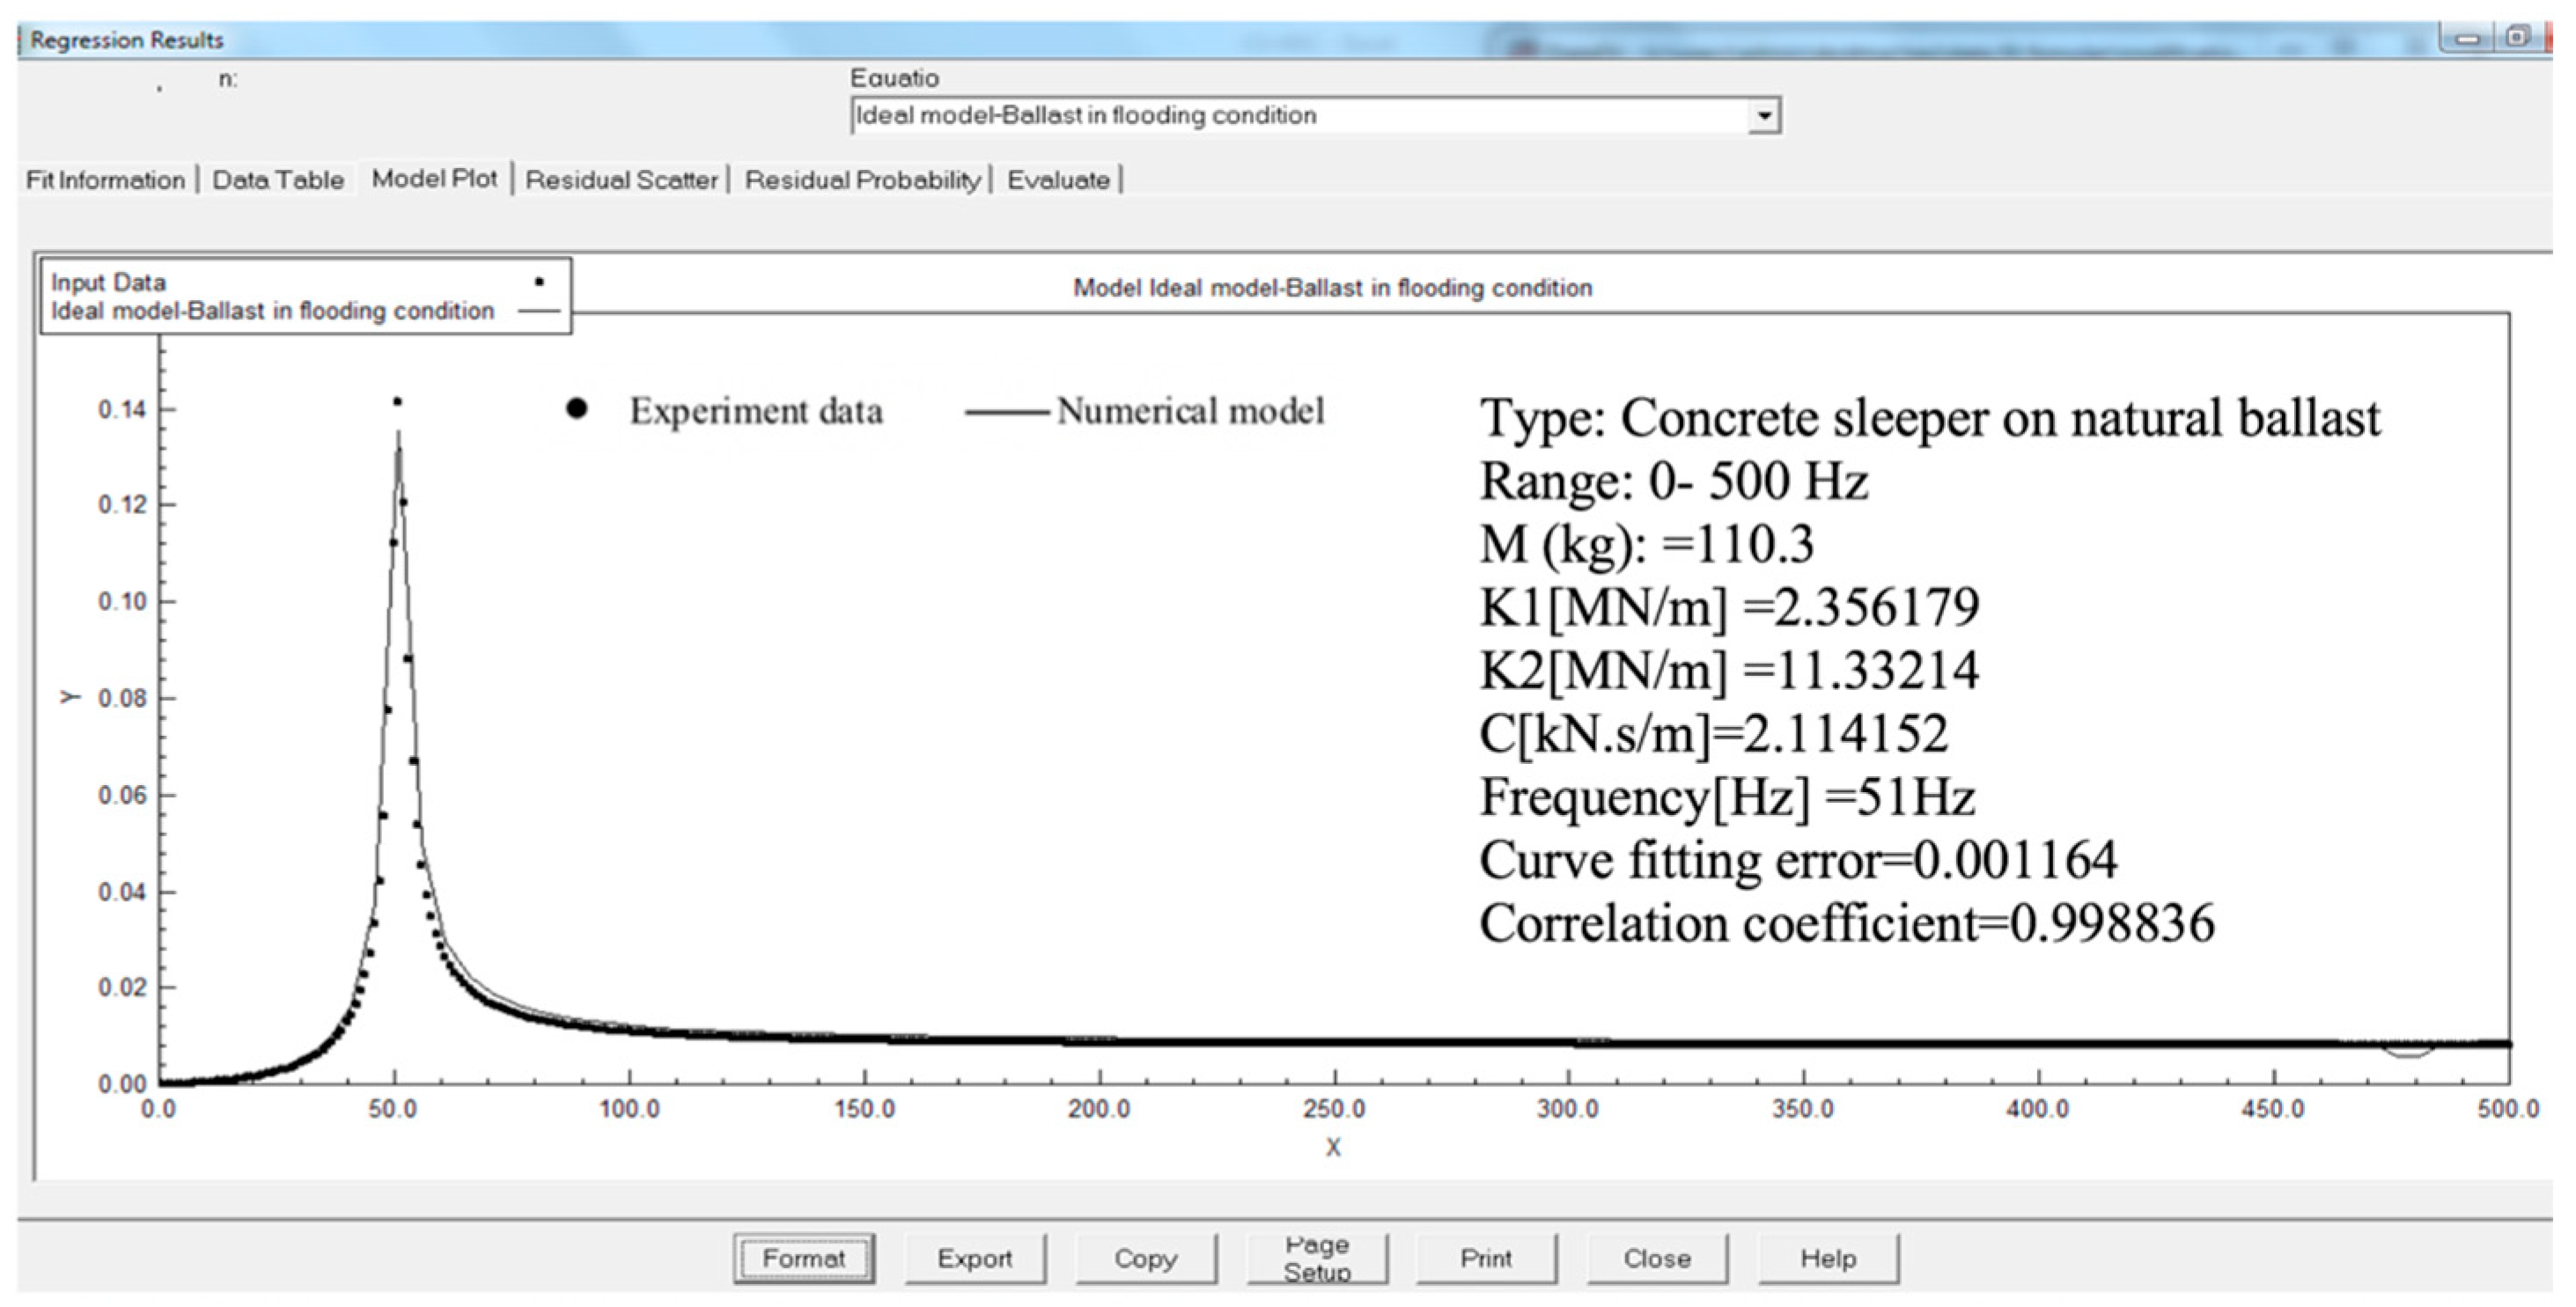
3.4.2. Test Results in Model-3 and Justification
- The results of all four experiments show that the curve fitting error based on Model-1 is the least compared with those of other models, and the errors are especially higher in smaller-scale experiments.
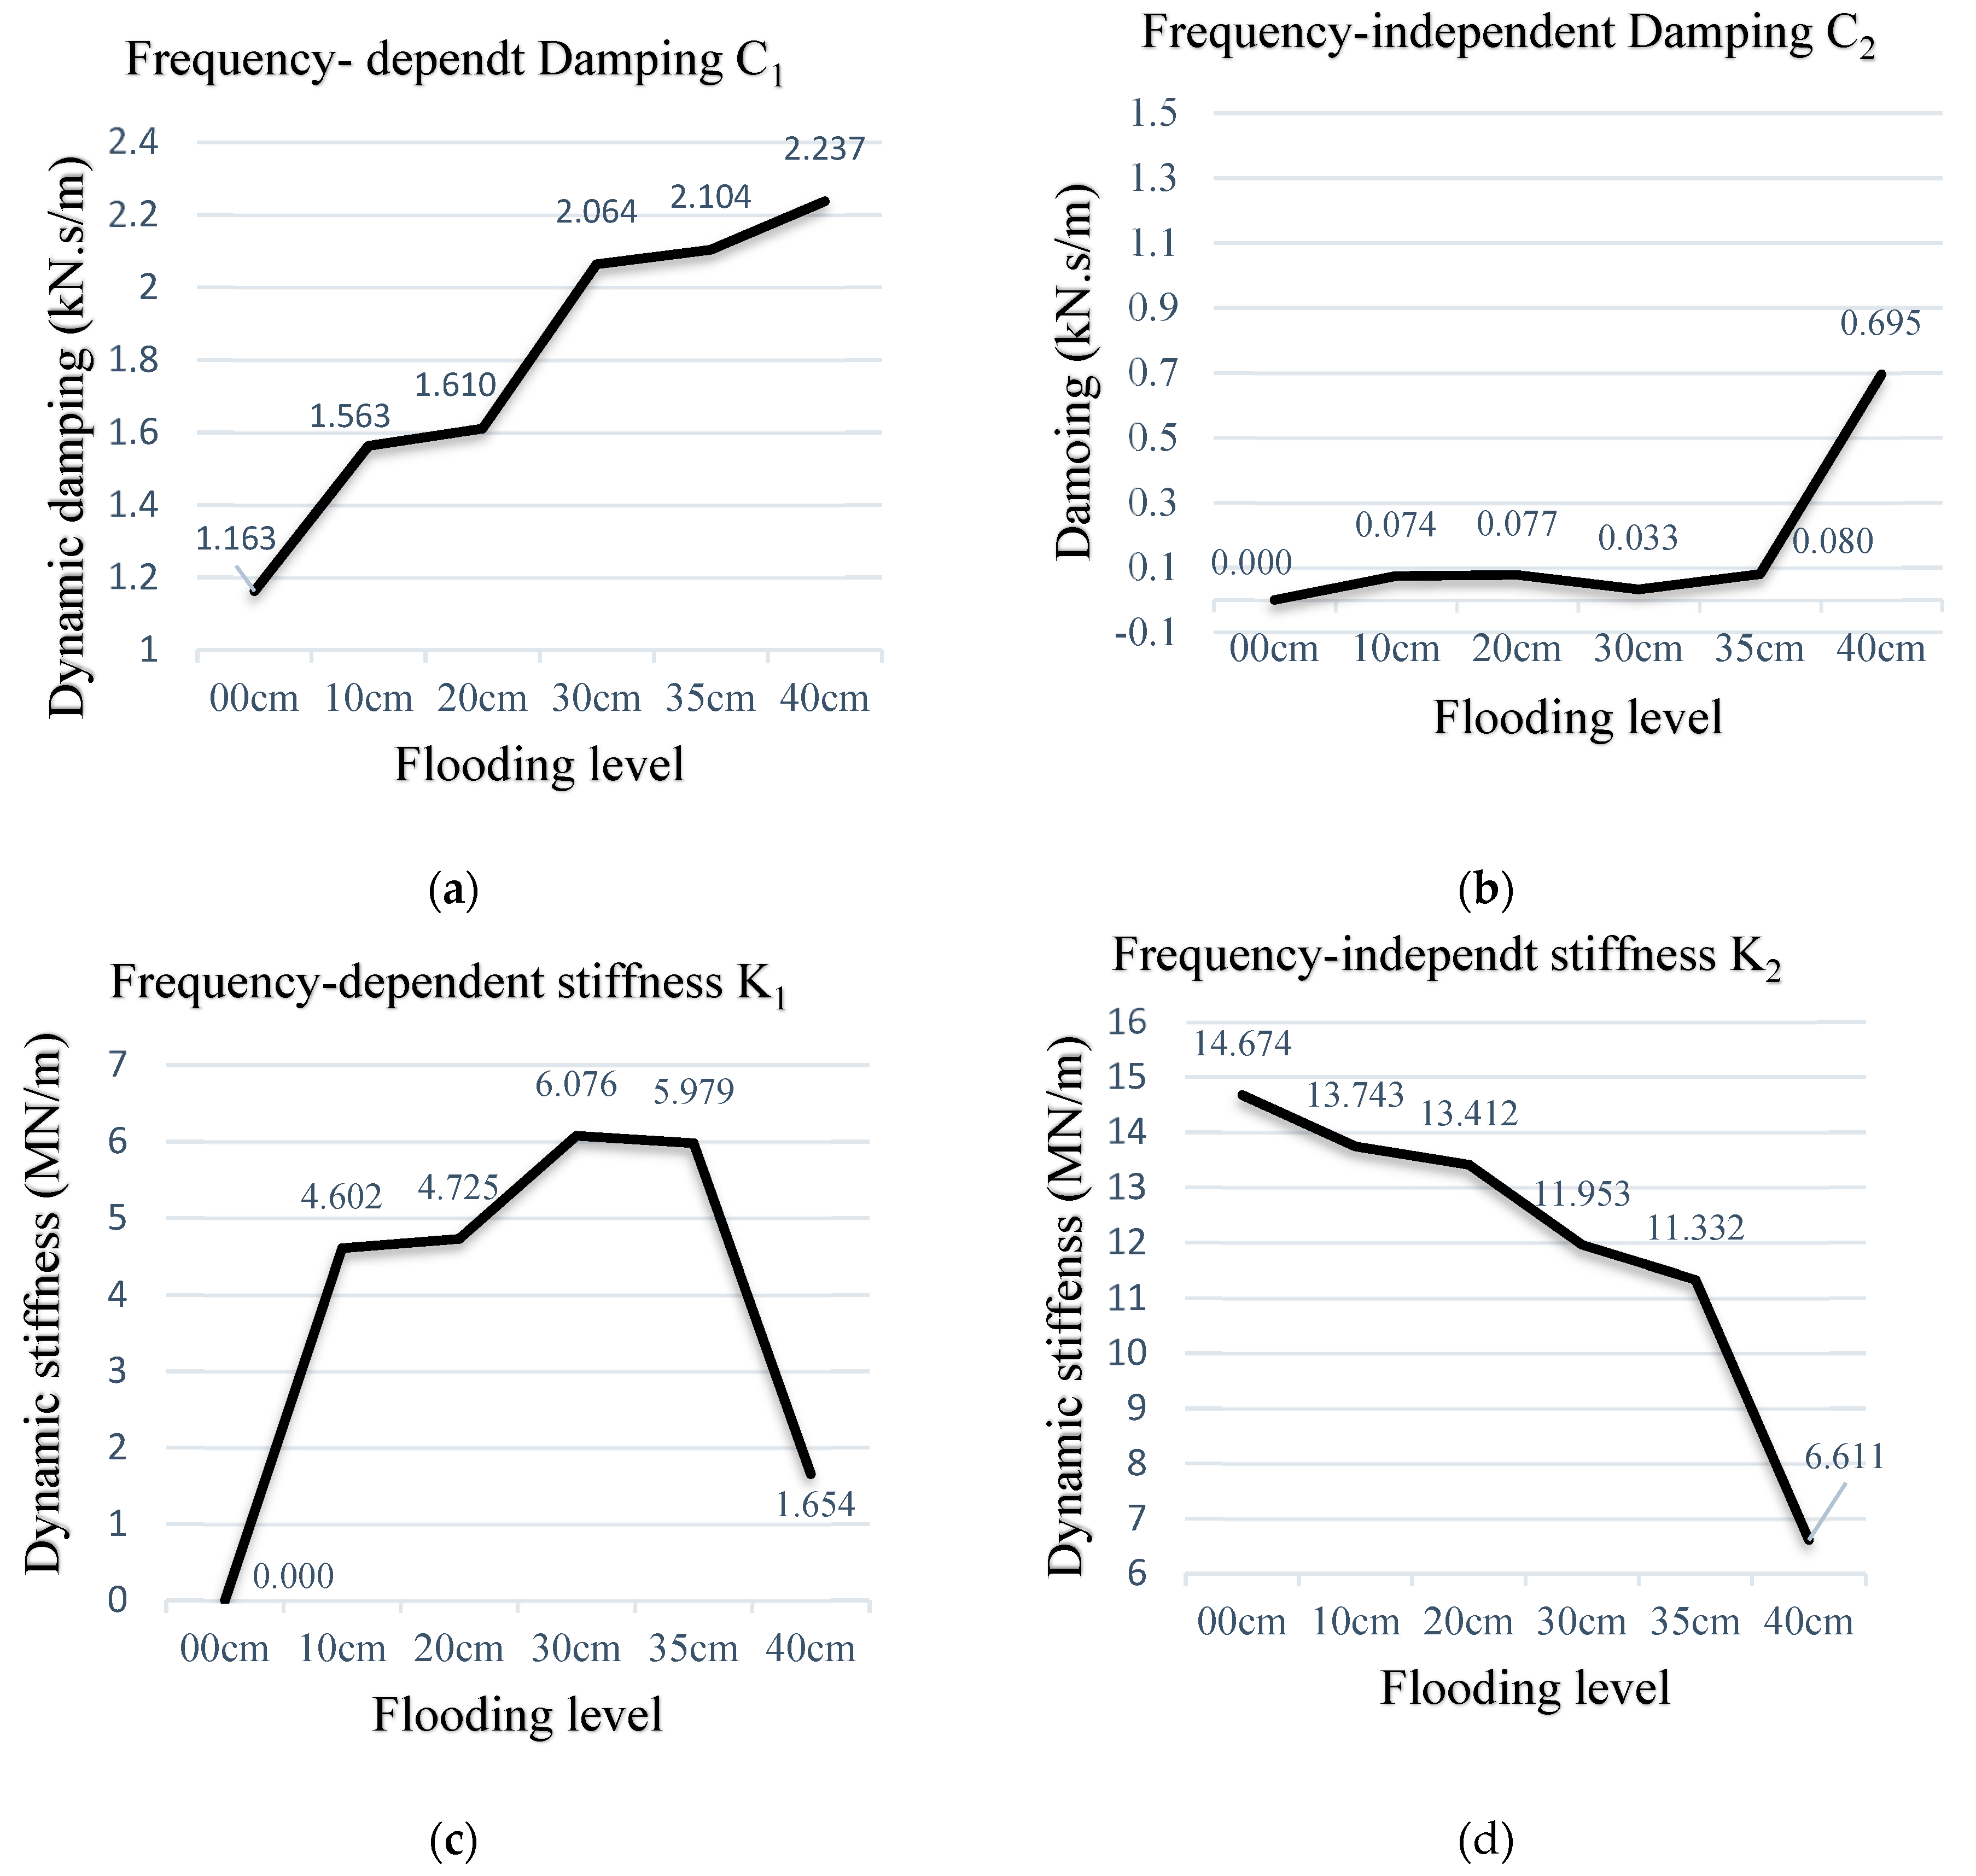
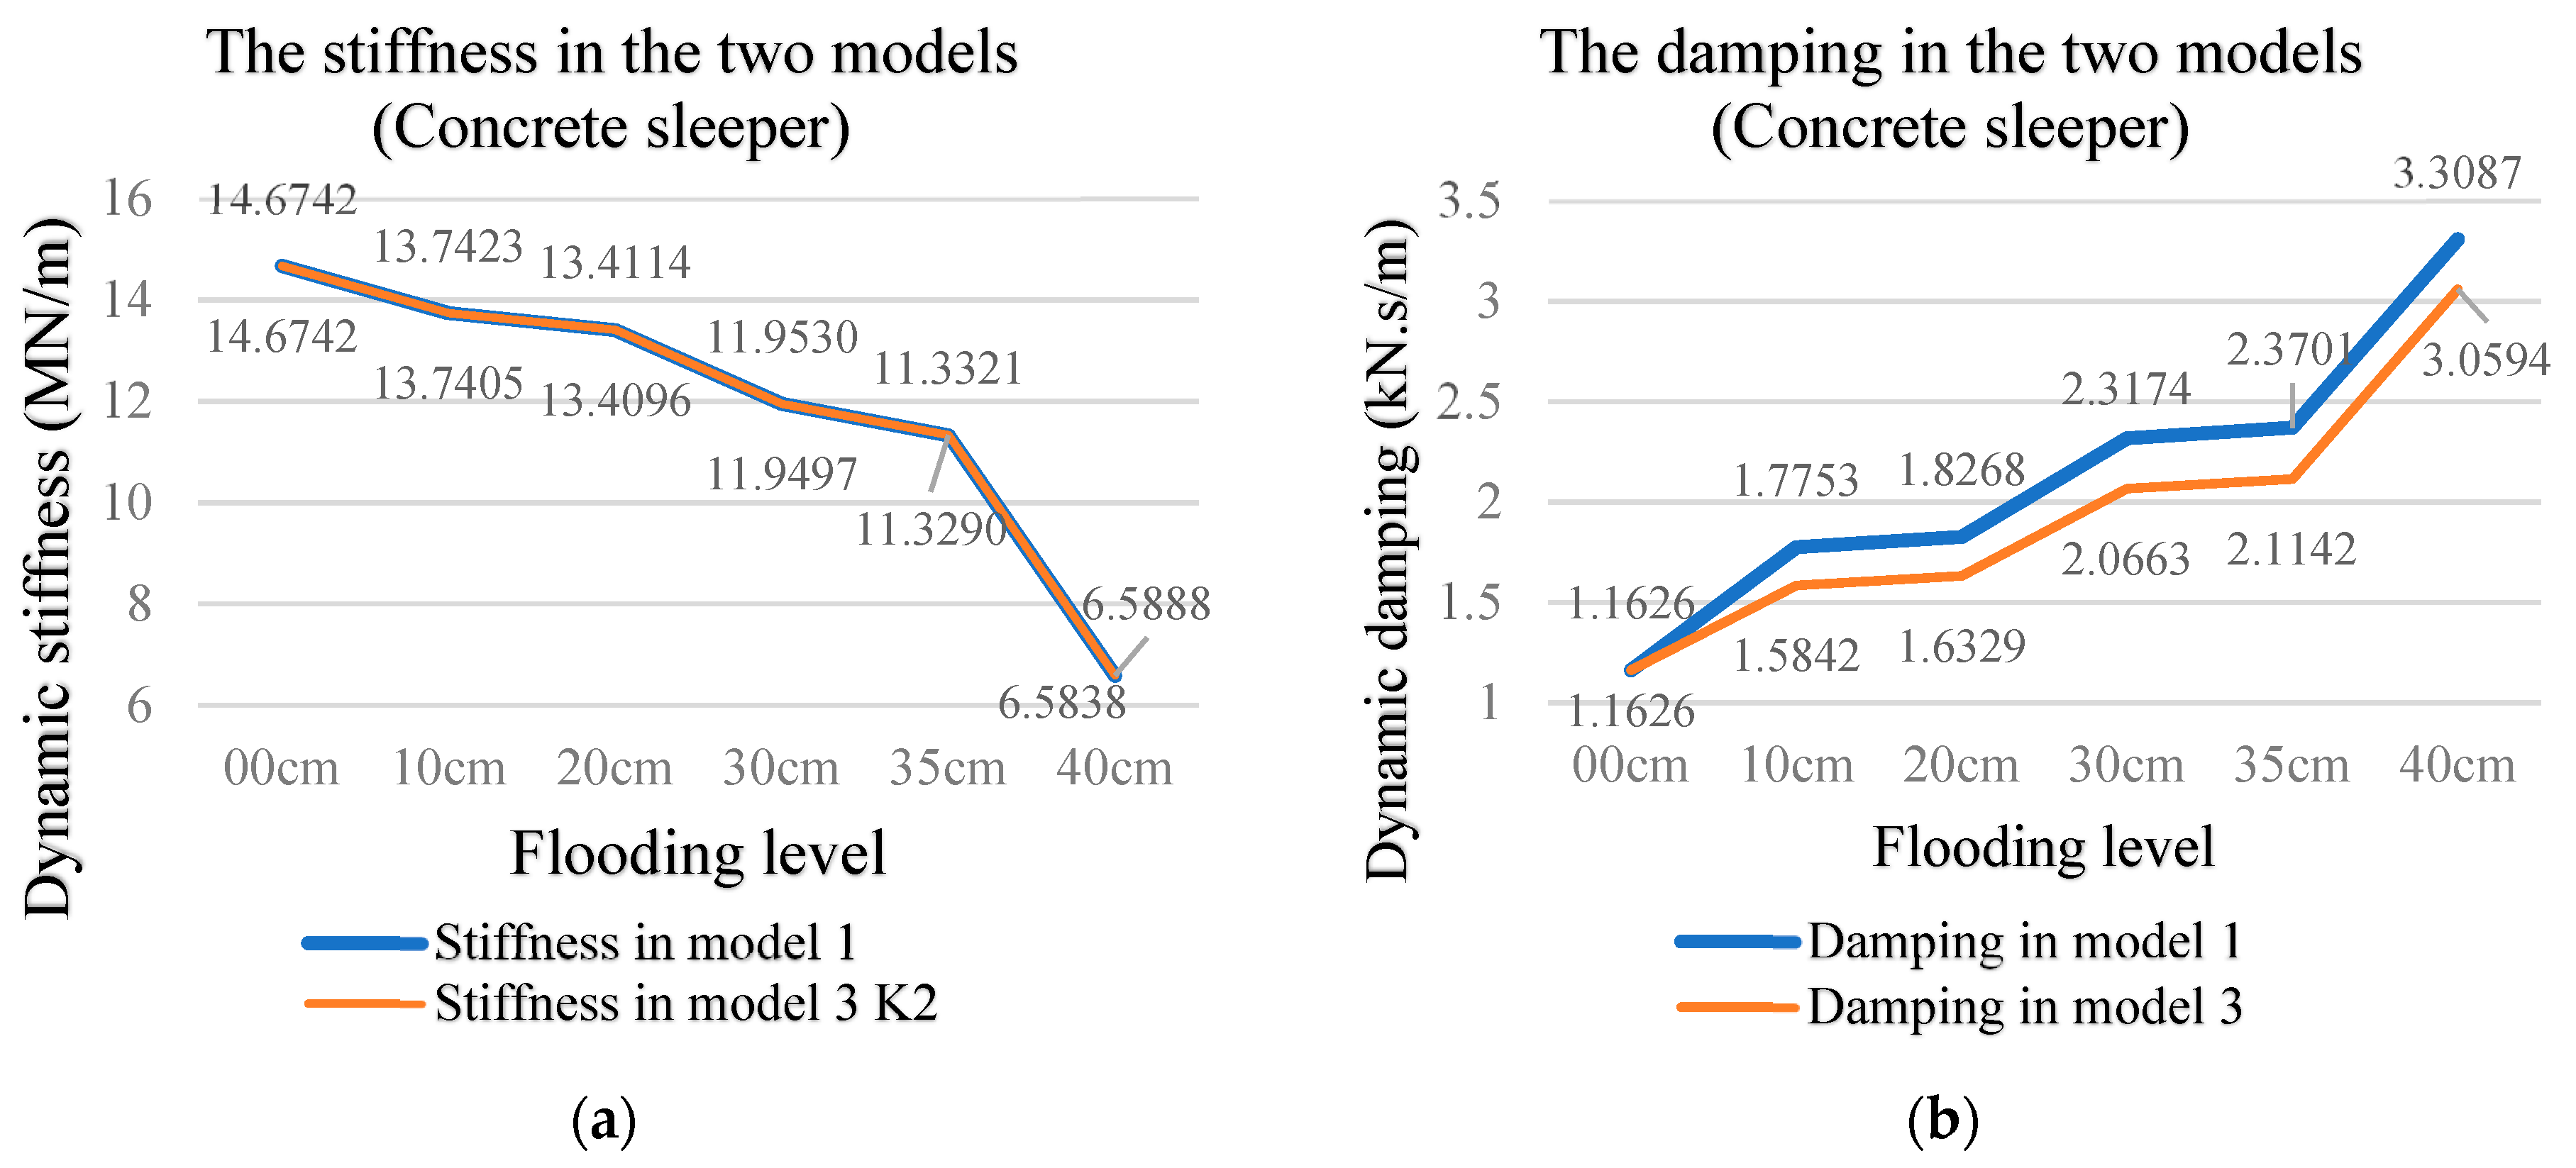
- Based on Model-3, there is no significant change in frequency-independent stiffness. It can be seen from Figure 21a that the dynamic stiffness traits of the two models are very consistent.
- Figure 21b shows that the variation of the damping in Model-3 displays the same trend as Model-1. This model does not significantly change the original damping, but there is an almost constant gap.
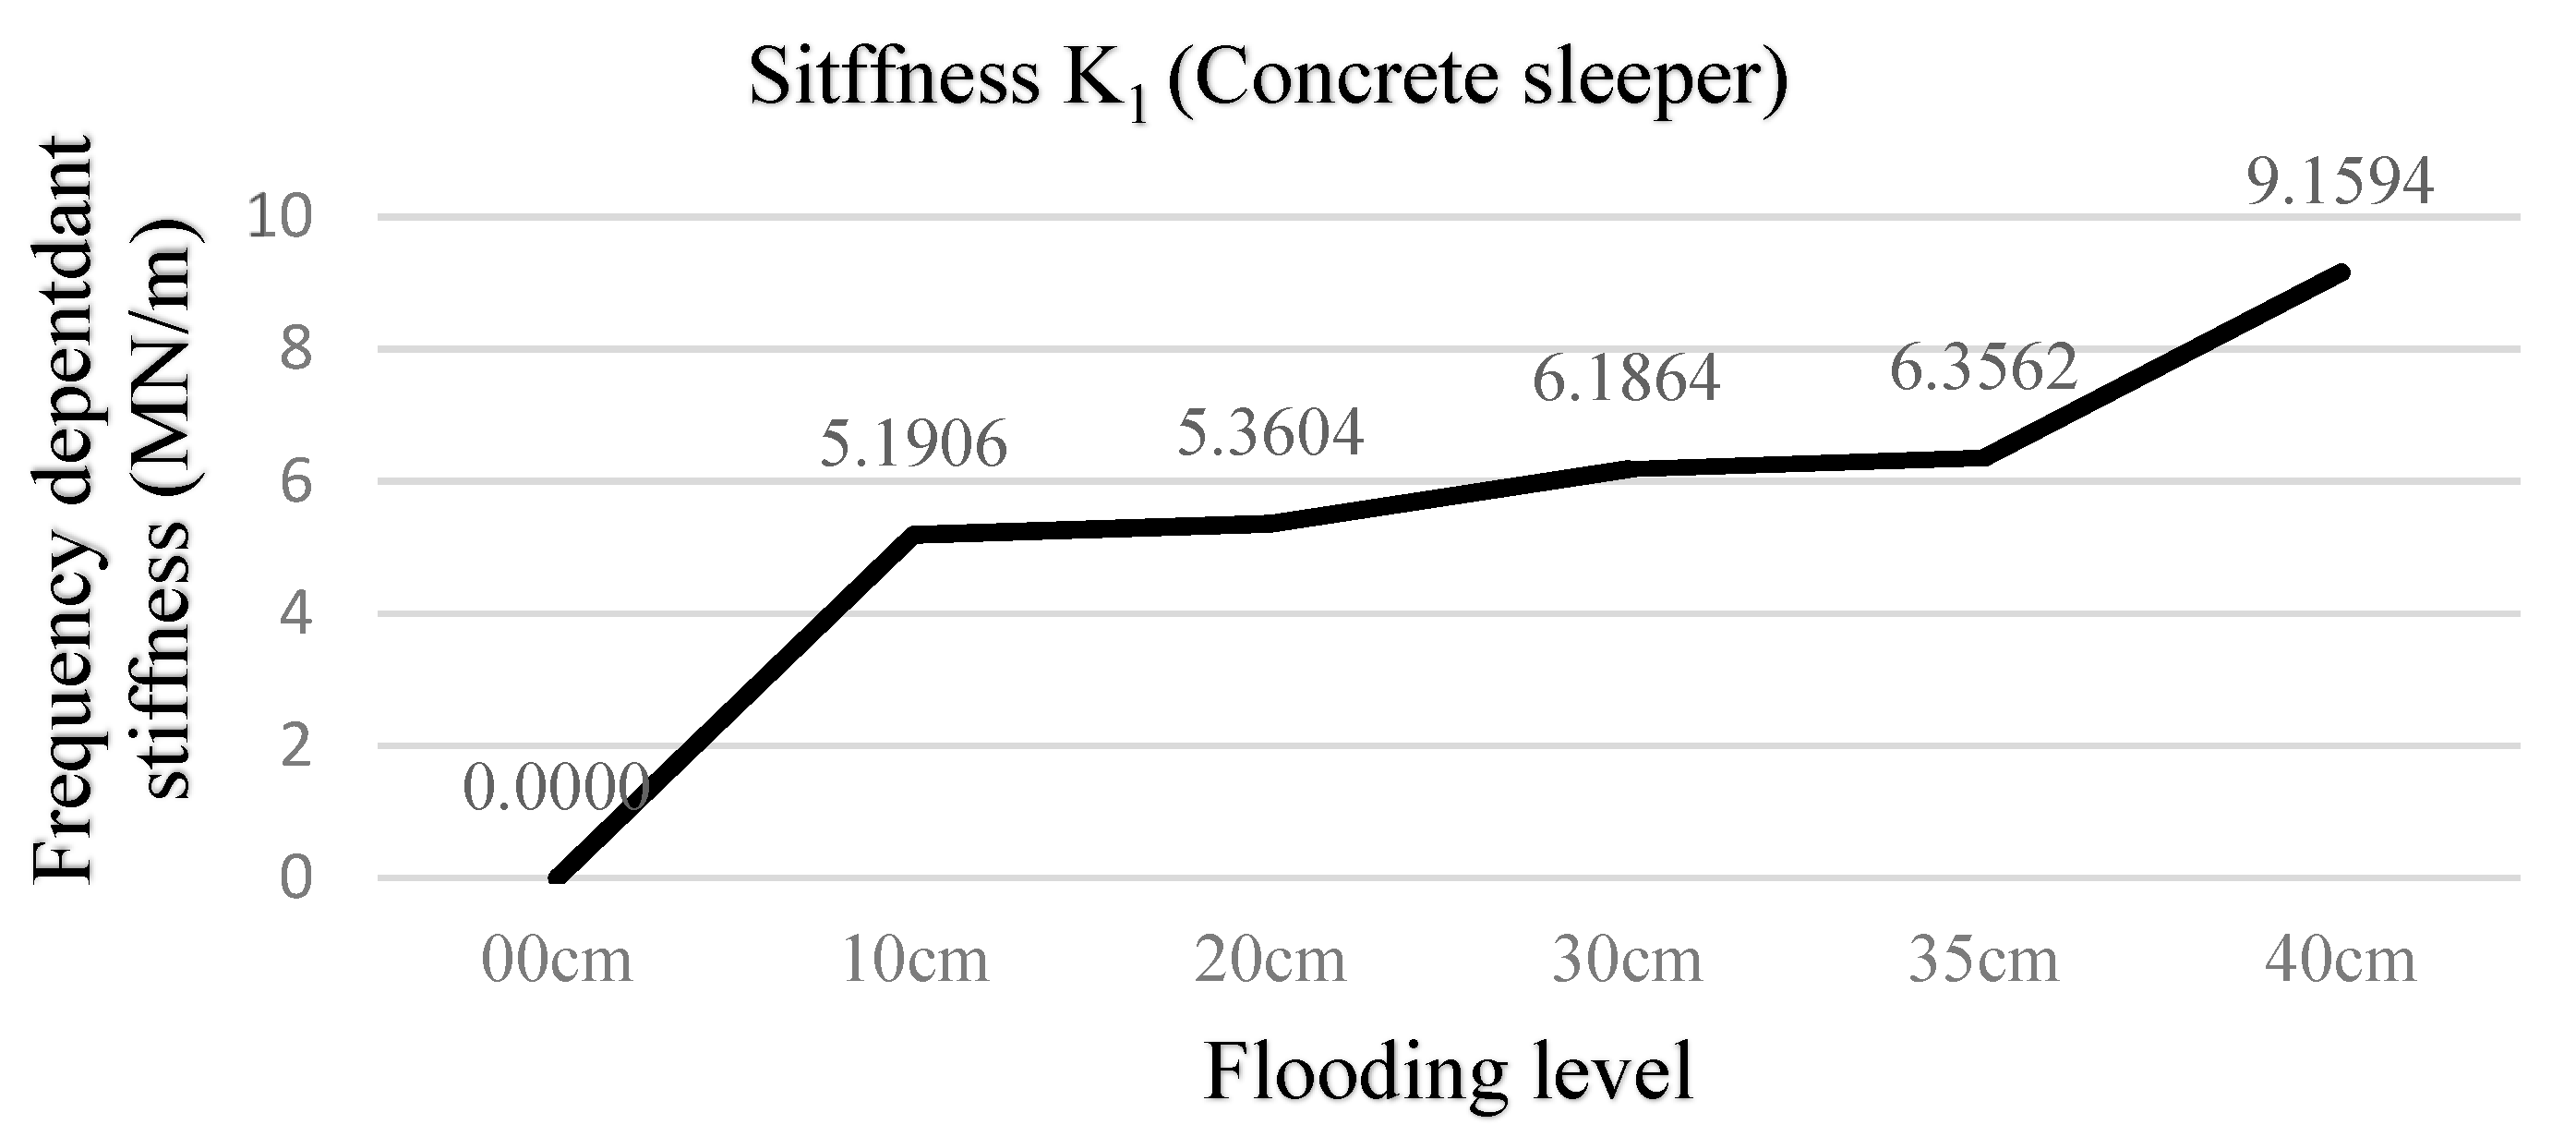
- The frequency-dependent stiffness K1 presents a similar variation of damping as shown in Figure 22. The trend is basically consistent with the trend of damping. The combination of spring with the dashpot is a subtractive relationship, so the combination with frequency-independent stiffness will reduce the total stiffness value (Kt) of the system.
3.4.3. Remark of Model-3
3.5. Further Models
3.5.1. Model-4 ‘K-KC-C’
3.5.2. Model-5 ‘C-KC-C’
3.5.3. Model-6 ‘KC-KC-C’
3.6. Study of Water Buoyancy
- B—buoyancy force in N
- ρf—fluid density in kg/m3
- Vf—displacement volume of water in m3
- g—9.81 m/s2.
4. Discussion on Suitability of Ballast Idealisation
4.1. Introduction to the Railway Ballast
4.2. Past Investigations into Ballast
4.3. Methods in This Study
4.3.1. Single-Degree-of-Freedom System
4.3.2. Frequency Response Function (FRF)
4.3.3. The Frequency Domain
4.4. Research Gap and Problems to Be Resolved
5. Conclusions
- This research explored the dynamic properties of the railway ballast under various conditions, and identified that their dynamic properties can change significantly under flood conditions compared with a dry state.
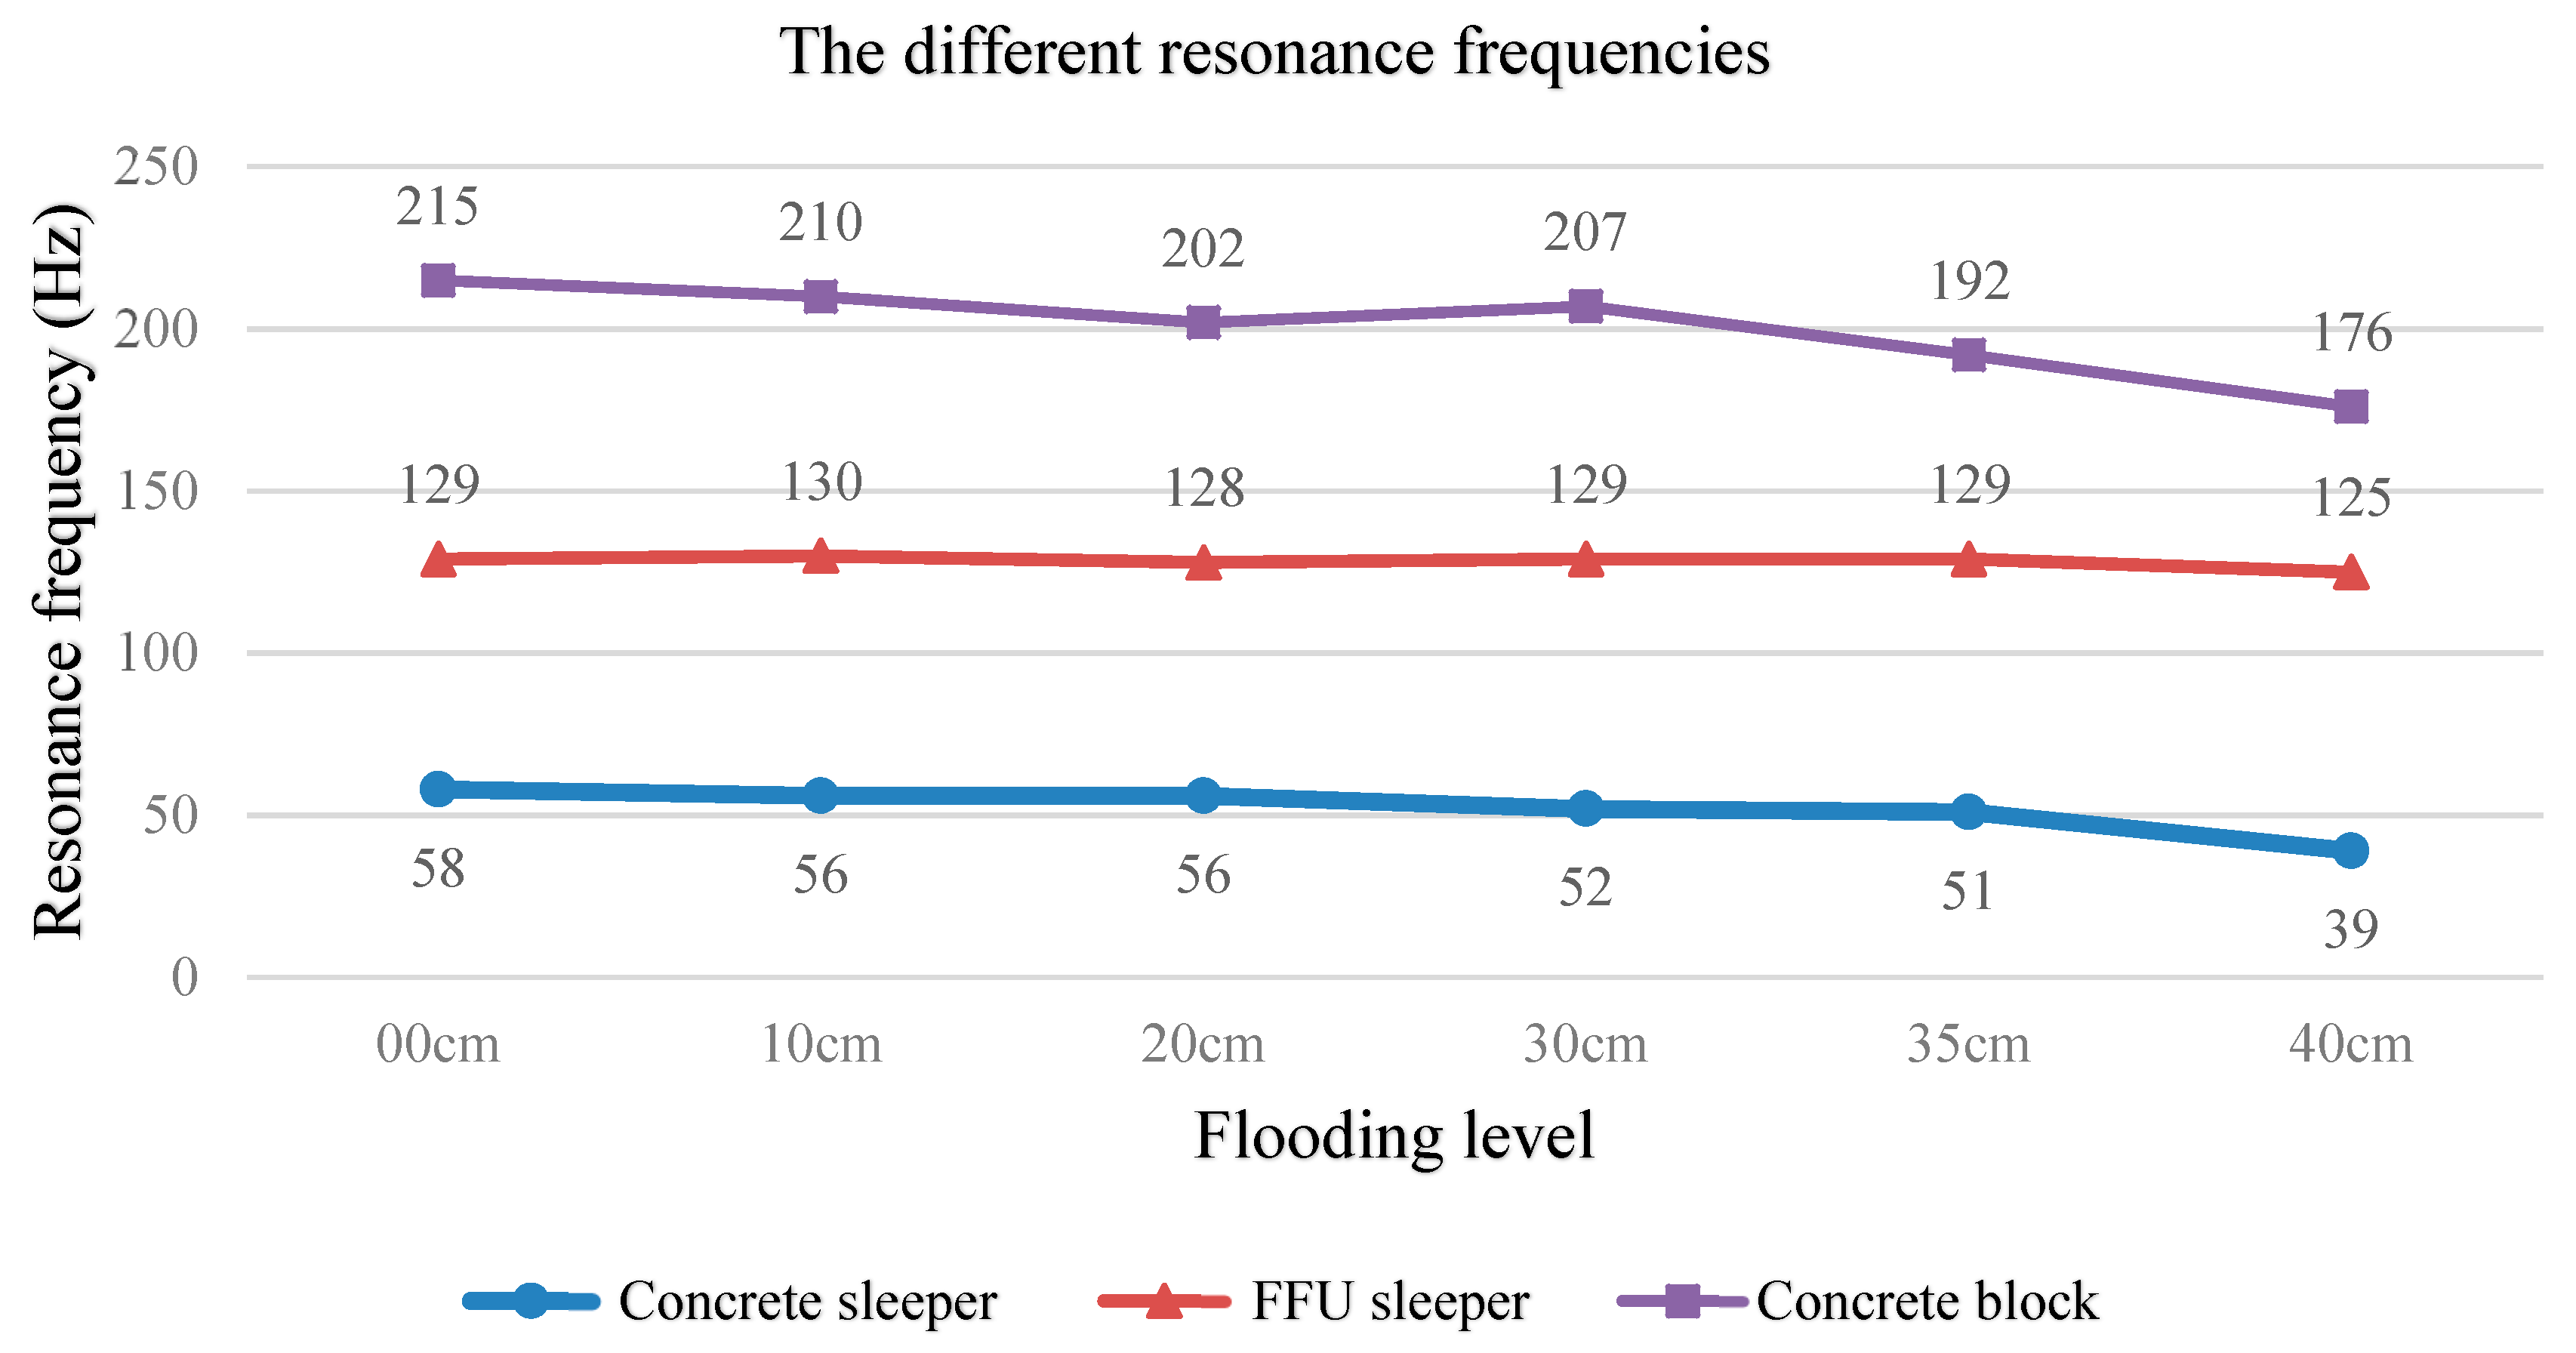
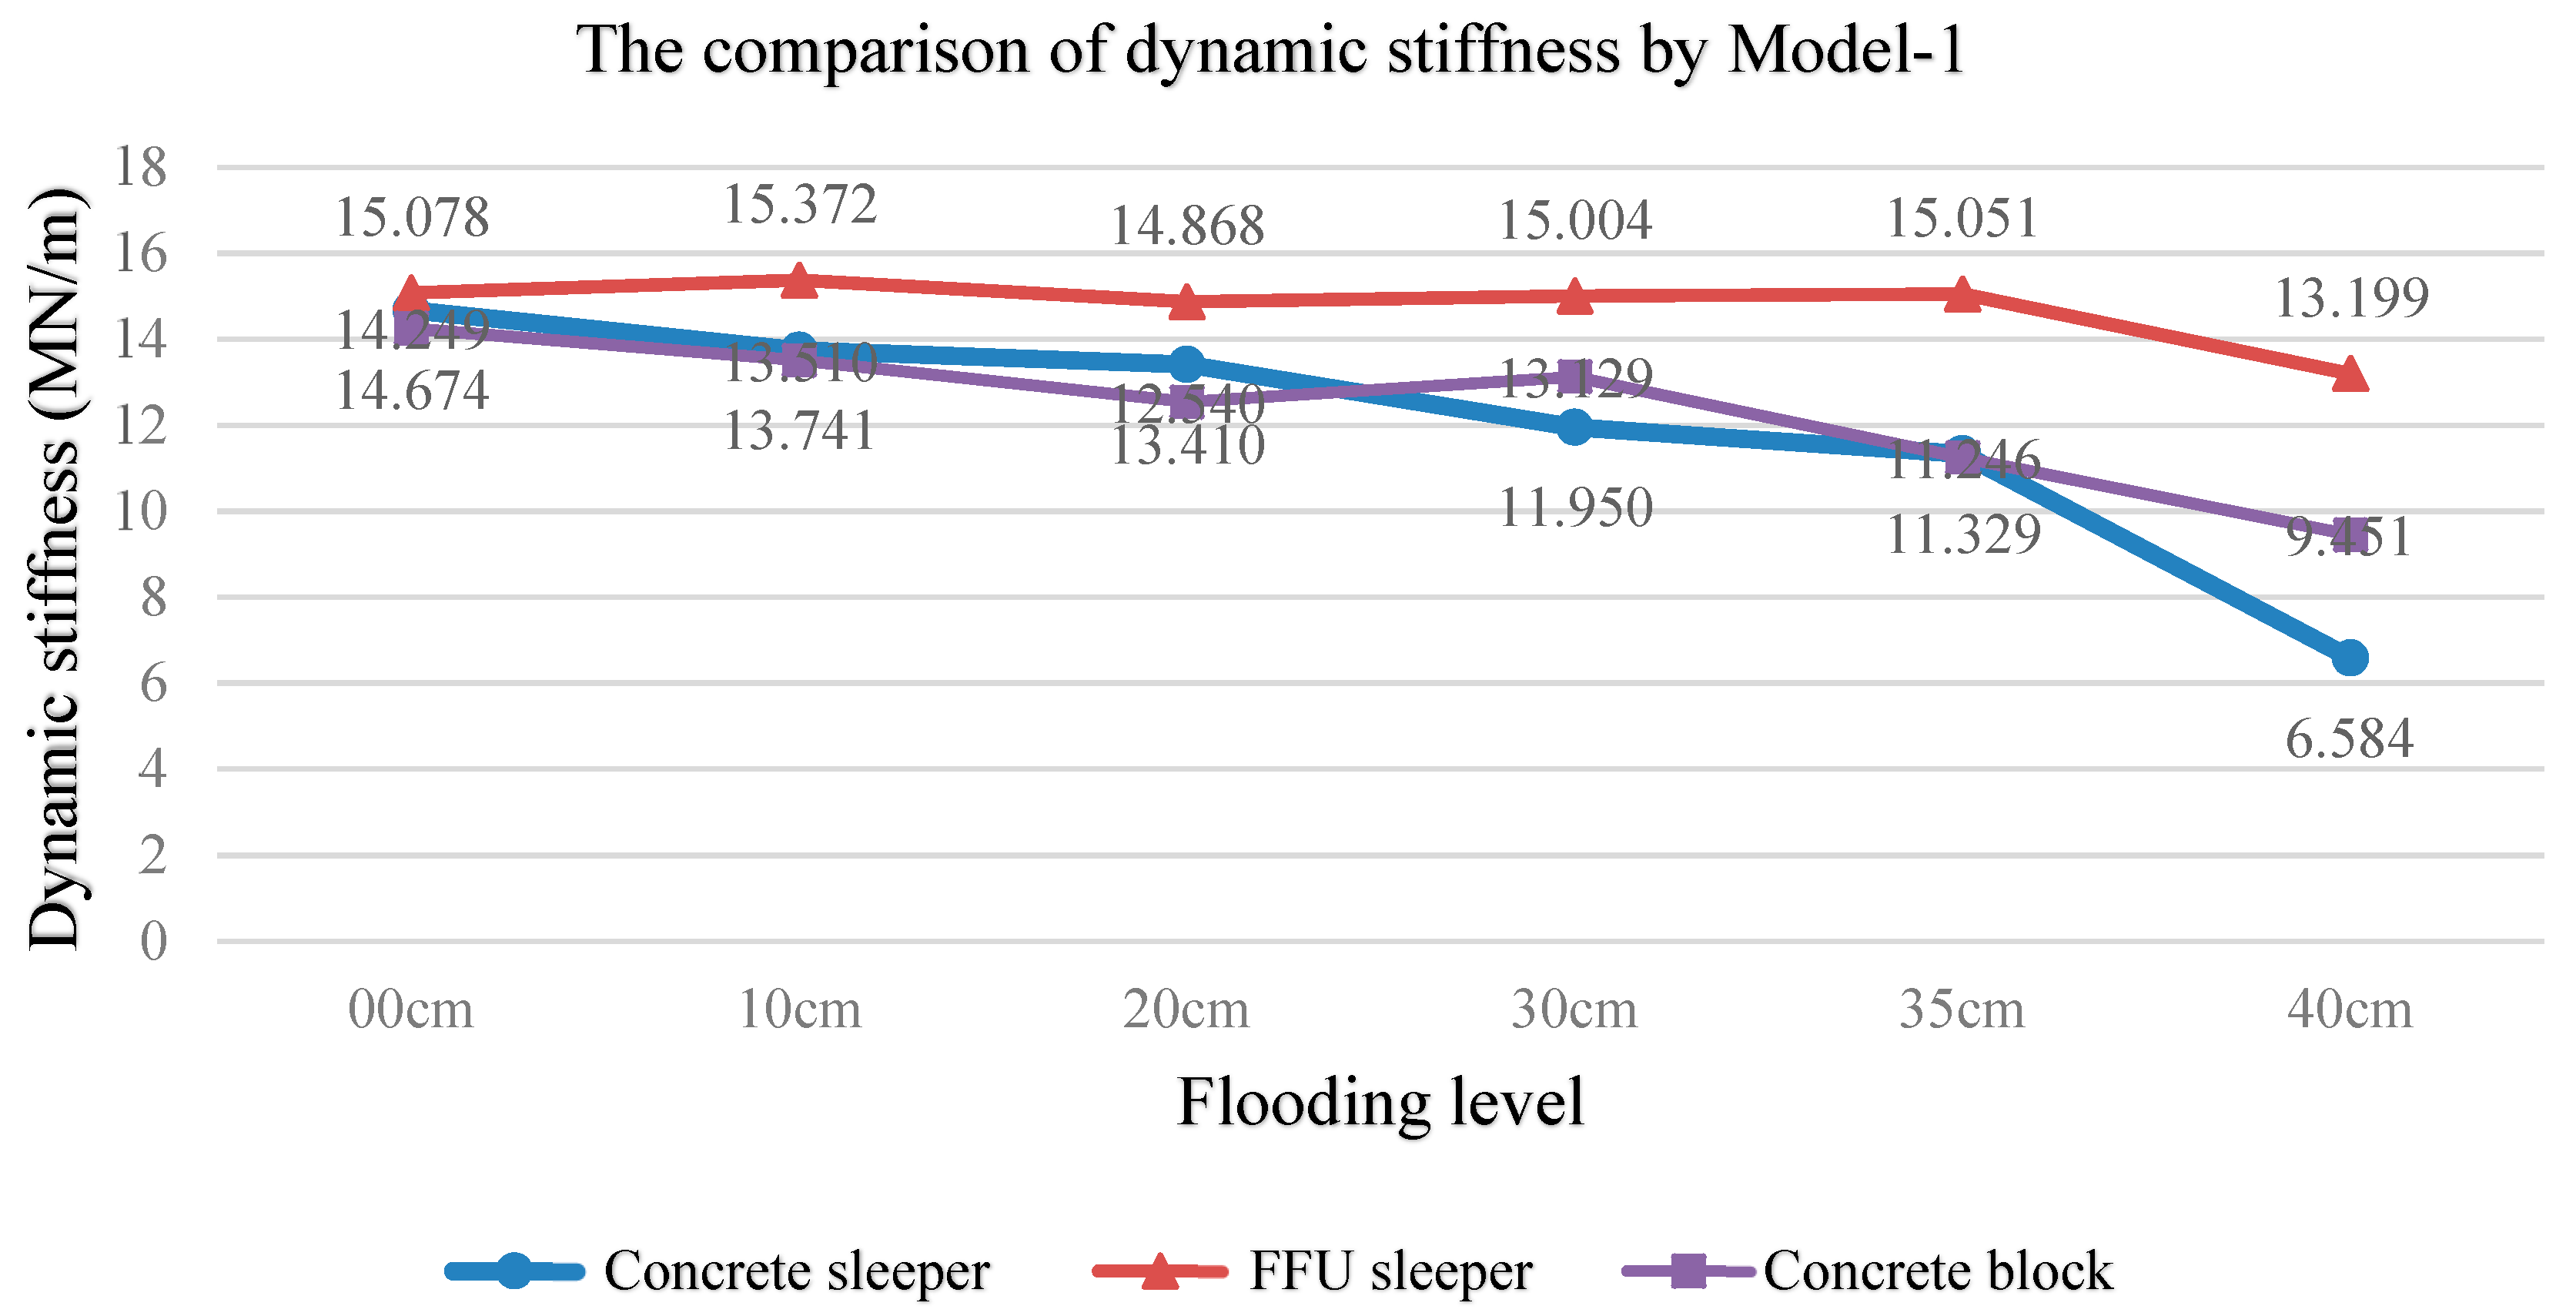
- The dynamic modal parameters of the identical ballast material in the dry state are consistently the same regardless of the scale of track masses. Under flood conditions, the resonance frequency shifts are relatively small, the damping increases with the increase of the flooding level, and the stiffness exhibits a decreasing trend. This phenomenon is especially obvious when the conventional concrete sleeper is used for testing the natural ballast.
- The changes in water temperature can slightly affect the test results, high temperature can decrease the dynamic stiffness, and low temperature can increase the dynamic stiffness, then the resonance frequency will change as well.
- The correlation between different masses has a proportional relationship to their dynamic stiffness divided by the square of the natural frequency.
- The small mass resonance frequency occurs in the high-frequency band, and the larger resonance occurs in the low-frequency band. The experimental results show that the low-frequency band data is more accurate.
- The increase in the flooding level will change natural frequency and decrease the FRF. The system stiffness will decrease with the decrease of the natural frequency.
- The properties of the material have different effects on the dynamic characteristics of the study. Meanwhile, the buoyancy will also have an interference effect on the system, especially where the test is conducted by using a lighter track mass.
- In order to obtain data for the experiment, a total of six dynamic models were established for this study, and the first three were discussed in detail, among which two reasonable models (Models 1 and 3) were found. The mean values of the experimental data curve fittings in Model-1 and Model-3 were 97.45% and 96.95%, respectively. The state-dependent model (Model 3) is found to be reasonable but needs further optimisation.
- This experiment is the world’s first investigation into railway ballast behaviour in flood conditions. The insights into modal parameters and idealisation of ballast in flood conditions provide a new reference for the numerical train–track simulations in practice.
Author Contributions
Funding
Acknowledgments
Conflicts of Interest
Appendix A

| Types | Flooding Level | Resonant Frequency (Hz) | Model 1 | Model 3 | ||||||||
|---|---|---|---|---|---|---|---|---|---|---|---|---|
| Damping (kN·s/m) | Stiffness (MN/m) | Correlation Coefficient | Damping (kN·s/m) | Frequency-Dependent K1 (MN/m) | Frequency-Independent K2 (MN/m) | Correlation Coefficient | Total Damping Ct (kN·s/m) | Total Stiffness Kt (MN/m) | Damping Ratio ζ | |||
| concrete sleeper on natural ballast (23 °C–26 °C) | 00 cm | 58 | 1.163 | 14.674 | 99.26% | 1.020 | 0.000 | 14.674 | 99.26% | 1.163 | 14.674 | 0.01 |
| 10 cm | 56 | 1.775 | 13.741 | 99.43% | 1.584 | 5.191 | 13.742 | 99.60% | 1.755 | 13.683 | 0.02 | |
| 20 cm | 56 | 1.827 | 13.410 | 99.55% | 1.633 | 5.360 | 13.411 | 99.70% | 1.806 | 13.351 | 0.02 | |
| 30 cm | 52 | 2.317 | 11.950 | 98.44% | 2.066 | 6.186 | 11.953 | 98.98% | 2.290 | 11.880 | 0.03 | |
| 35 cm | 51 | 2.370 | 11.329 | 99.83% | 2.114 | 6.356 | 11.332 | 99.88% | 2.344 | 11.261 | 0.03 | |
| 40 cm | 39 | 3.309 | 6.584 | 98.75% | 3.059 | 9.159 | 6.589 | 99.31% | 3.287 | 6.528 | 0.06 | |
| FFU sleeper on natural ballast (21 °C –23 °C) | 00 cm | 129 | 1.324 | 15.078 | 93.04% | 1.324 | 0.000 | 15.078 | 93.04% | 1.324 | 15.078 | 0.04 |
| 10 cm | 130 | 1.312 | 15.372 | 93.85% | 0.975 | 3.097 | 15.386 | 95.69% | 1.231 | 15.194 | 0.03 | |
| 20 cm | 128 | 1.386 | 14.868 | 99.95% | 1.036 | 3.299 | 14.883 | 99.89% | 1.303 | 14.685 | 0.04 | |
| 30 cm | 129 | 1.158 | 15.004 | 97.33% | 0.864 | 2.748 | 15.015 | 98.10% | 1.088 | 14.847 | 0.03 | |
| 35 cm | 129 | 1.407 | 15.051 | 99.40% | 1.049 | 3.343 | 15.065 | 99.40% | 1.322 | 14.862 | 0.04 | |
| 40 cm | 125 | 6.300 | 13.199 | 99.56% | 4.808 | 16.092 | 13.556 | 99.68% | 5.971 | 12.716 | 0.17 | |
| Types | Flooding Level | Resonant Frequency (Hz) | Model 1 | Model 3 | ||||||||
|---|---|---|---|---|---|---|---|---|---|---|---|---|
| Damping (kN·s/m) | Stiffness (MN/m) | Correlation Coefficient | Damping (kN·s/m) | Frequency-Dependent K1 (MN/m) | Frequency-Independent K2 (MN/m) | Correlation Coefficient | Total Damping Ct (kN·s/m) | Total Stiffness Kt (MN/m) | Damping Ratio ζ | |||
| concrete block on natural ballast (24 °C–25 °C) | 00 cm | 215 | 1.082 | 14.249 | 96.84% | 1.082 | 0.000 | 14.249 | 96.84% | 1.082 | 14.249 | 0.05 |
| 10 cm | 210 | 1.156 | 13.510 | 95.00% | 0.680 | 2.181 | 13.574 | 93.23% | 0.989 | 13.259 | 0.05 | |
| 20 cm | 202 | 1.197 | 12.540 | 98.53% | 0.722 | 2.321 | 12.605 | 94.22% | 1.036 | 12.292 | 0.05 | |
| 30 cm | 207 | 1.394 | 13.129 | 99.07% | 0.829 | 2.676 | 13.221 | 93.28% | 1.200 | 12.847 | 0.06 | |
| 35 cm | 192 | 1.621 | 11.246 | 97.38% | 1.014 | 3.290 | 11.359 | 92.87% | 1.424 | 10.960 | 0.08 | |
| 40 cm | 176 | 1.213 | 9.451 | 94.87% | 0.794 | 2.554 | 9.506 | 93.64% | 1.084 | 9.235 | 0.06 | |
References
- Esveld, C. Modern Railway Track, 2nd ed.; MRT-Productions Press: Groenwal, The Netherlands, 2001; p. 653. [Google Scholar]
- Indraratna, B.; Rujikiatkamjorn, C.; Salim, W. Advanced Rail Geotechnology—Ballasted Track; CRC Press: London, UK, 2011. [Google Scholar]
- Kaewunruen, S. Ballast and Ballast Mat, Rail Engineering Course Topic 2.8; RailCorp NSW: Sydney, Australia, 2012; pp. 1–13. [Google Scholar]
- Kaewunruen, S.; Remennikov, A.M. Non-Destructive Testing (NDT): A Tool for Dynamic Health Monitoring of Railway Track Structures; Materials Australia: North Melbourne, Australia, 2006; Volume 39, pp. 14–16. [Google Scholar]
- Remennikov, A.M.; Kaewunruen, S. A review on loading conditions for railway track structures due to train and track vertical interaction. Struct. Control Health Monit. 2008, 15, 207–234. [Google Scholar] [CrossRef]
- Kaewunruen, S.; Remennikov, A.M. Experimental simulation of the railway ballast by resilient materials and its verification by modal testing. Exp. Tech. 2008, 32, 29–35. [Google Scholar] [CrossRef]
- Kaewunruen, S.; Remennikov, A.M. Nonlinear finite element modeling of railway prestressed concrete sleeper. In Proceedings of the 10th East Asia-Pacific Conference on Structural Engineering and Construction, EASEC 2010, Bangkok, Thailand, 3–5 August 2006; Volume 4, pp. 323–328. [Google Scholar]
- Vu, M.; Kaewunruen, S.; Attard, M. Nonlinear 3D finite-element modeling for structural failure analysis of concrete sleepers/bearers at an urban turnout diamond. In Handbook of Materials Failure Analysis with Case Studies from the Chemicals, Concrete and Power Industries; Elsevier: Amsterdam, The Netherlands, 2016; Chapter 6; pp. 123–160. Available online: http://dx.doi.org/10.1016/B978-0-08-100116-5.00006-5 (accessed on 26 April 2019).
- Remennikov, A.M.; Murray, M.H.; Kaewunruen, S. Reliability-based conversion of a structural design code for railway prestressed concrete sleepers. Proc. Inst. Mech. Eng. Part F J. Rail Rapid Transit 2012, 226, 155–173. [Google Scholar] [CrossRef]
- Kaewunruen, S.; Ishida, T.; Remennikov, A.M. Dynamic performance of concrete turnout bearers and sleepers in Railway Switches and Crossings. Adv. Civ. Eng. Mater. 2018, 7. [Google Scholar] [CrossRef]
- AREMA. AREMA-Manual for Railway Engineering; American Railway Engineering and Maintenance-of-Way Association: Lanham, MD, USA, 2012; Chapter 30. [Google Scholar]
- Kaewunruen, S.; Remennikov, A.M. Sensitivity analysis of free vibration characteristics of an in-situ railway concrete sleeper to variations of rail pad parameters. J. Sound Vib. 2006, 298, 453–461. [Google Scholar] [CrossRef]
- Kaewunruen, S.; Kimani, S.K. Damped frequencies of precast modular steel-concrete composite railway track slabs. Steel Compos. Struct. 2017, 25, 427–442. [Google Scholar]
- Kimani, S.K.; Kaewunruen, S. Free vibrations of precast modular steel-concrete composite railway track slabs. Steel Compos. Struct. Int. J. 2017, 24, 113–128. [Google Scholar] [CrossRef]
- Kaewunruen, S.; Remennikov, A.M. State dependent properties of rail pads. Transp. Eng. Aust. 2009, 12, 17–24. [Google Scholar]
- Gamage, E.K.; Kaewunruen, S.; Remennikov, A.M.; Ishida, T. Toughness of Railroad Concrete Crossties with Holes and Web Openings. Infrastructures 2017, 2, 3. [Google Scholar] [CrossRef]
- Gamage, E.K.; Kaewunruen, S.; Remennikov, A.M.; Ishida, T. Reply to Giannakos, K. Comment on: Toughness of Railroad Concrete Crossties with Holes and Web Openings. Infrastructures 2017, 2, 5. [Google Scholar]
- Kaewunruen, S.; Lopes, L.M.C.; Papaelias, M.P. Georisks in railway systems under climate uncertainties by different types of sleeper/crosstie materials. Lowl. Technol. Int. 2018, 20, 67–76. [Google Scholar]
- Binti Sa’adin, S.L.; Kaewunruen, S.; Jaroszweski, D. Risks of Climate Change with Respect to the Singapore-Malaysia High Speed Rail System. Climate 2016, 4, 65. [Google Scholar] [CrossRef]
- Binti Sa’adin, S.L.; Kaewunruen, S.; Jaroszweski, D. Heavy rainfall and flood vulnerability of Singapore-Malaysia high speed rail system. Aust. J. Civ. Eng. 2016, 14, 123–131. [Google Scholar] [CrossRef]
- Binti Sa’adin, S.L.; Kaewunruen, S.; Jaroszweski, D. Operational readiness for climate change of Malaysia high-speed rail. Proc. Inst. Civ. Eng. Transp. 2016, 169, 308–320. [Google Scholar] [CrossRef]
- Dindar, S.; Kaewunruen, S.; Min, A.; Sussman, J.M. Bayesian Network-based probability analysis of train derailments caused by various extreme weather patterns on railway turnouts. Saf. Sci. 2018, 110, 20–30. [Google Scholar] [CrossRef]
- Ngamkhanong, C.; Kaewunruen, S.; Costa, B.J.A. State-of-the-Art Review of Railway Track Resilience Monitoring. Infrastructures 2018, 3, 3. [Google Scholar] [CrossRef]
- Kaewunruen, S.; Wu, L.; Goto, K.; Najih, Y.M. Vulnerability of Structural Concrete to Extreme Climate Variances. Climate 2018, 6, 40. [Google Scholar] [CrossRef]
- Binti Sa’adin, S.L.; Kaewunruen, S.; Jaroszweski, D. Climate change vulnerability and adaptation for the Singapore-Malaysia high speed rail system. INGENIEUR—Off. J. Board Eng. Malays. 2016, 66, 44–54. [Google Scholar]
- Dindar, S.; Kaewunruen, S.; An, M.; Osman, M.H. Natural hazard risks on railway turnout systems. Procedia Eng. 2016, 161, 1254–1259. [Google Scholar] [CrossRef]
- Kaewunruen, S. Impact Damage Mechanism and Mitigation by Ballast Bonding at Railway Bridge Ends. Int. J. Railw. Technol. 2014, 3, 1–22. [Google Scholar] [CrossRef]
- De Man, A.P. DYNATRACK: A survey of dynamic railway track properties and their quality. Ph.D. Thesis, Faculty of Civil Engineering, Delft University of Technology, Delft, The Netherlands, 2002. [Google Scholar]
- Fenander, A. A fractional derivative railpad model included in a railway track model. J. Sound Vib. 1998, 212, 889–903. [Google Scholar] [CrossRef]
- Cai, Z. Modelling of rail track dynamics and wheel/rail interaction. Ph.D. Thesis, Department of Civil Engineering, Queen’s University, Kingston, ON, Canada, 1992. [Google Scholar]
- Kaewunruen, S.; Remennikov, A.M. Effect of improper ballast tamping/packing on dynamic behaviors of on-track railway concrete sleeper. Int. J. Struct. Stab. Dyn. 2007, 7, 167–177. [Google Scholar] [CrossRef]
- Kaewunruen, S.; Remennikov, A.M. Current state of practice in railway track vibration isolation: An Australian overview. Aust. J. Civ. Eng. 2016, 14, 63–71. [Google Scholar] [CrossRef]
- Remennikov, A.M.; Kaewunruen, S. Impact resistance of reinforced concrete columns: Experimental studies and design considerations. In Proceedings of the 19th Australasian Conference on the Mechanics of Structures and Materials, ACMSM19, Christchurch, New Zealand, 29 November–1 December 2006. [Google Scholar]
- FFU. Synthetic Wood Railway Sleepers. 2019. Available online: https://www.sekisui-rail.com/en/technology.html (accessed on 1 April 2019).
- Prosig. Manual on Experimental Model Analysis Using Impact Hammer Excitation; Prosig Ltd.: Southfield, MI, USA, 2017. [Google Scholar]
- Remennikov, A.; Kaewunruen, S. Determination of Dynamic properties of rail pads using an instrumented hammer impact technique. Acoust. Aust. 2005, 33, 63–67. [Google Scholar]
- Kaewunruen, S.; Remennikov, A. Application of Experimental Modal Testing for Estimating Dynamic Properties of Structural Components. In Proceedings of the Australian Structural Engineering Conference 2005 (ASEC 2005), Newcastle, Australia, 1–14 September 2005. [Google Scholar]
- Kaewunruen, S.; Remennikov, A.M. An alternative rail pad tester for measuring dynamic properties of rail pads under large preloads. Exp. Mech. 2008, 48, 55–64. [Google Scholar] [CrossRef]
- Rasmussen, S.; De Man, A. Two new techniques for measurement of vertical track stiffness of railway tracks. In Proceedings of the 3rd International Railway Engineering Conference, Edinburg, Scotland, UK, 3–4 July 2000. [Google Scholar]
- Kaewunruen, S. Monitoring in-service performance of fibre-reinforced foamed urethane sleepers/bearers in railway urban turnout systems. Struct. Mor. Main. 2014, 1, 131–157. [Google Scholar] [CrossRef]
- Kaewunruen, S.; Remennikov, A. Dynamic Properties of Railway Track and Its Components: A State-of-the-Art Review; University of Wollongong: New South Wales, Australia, 2008. [Google Scholar]
- Van’t Zand, J. Assessment of dynamic characteristics of rail pads. Rail Eng. Int. 1994, 23, 15–17. [Google Scholar]
- Rezaei, E. Vibrations of Partly Supported Concrete Railway Sleeper. Master’s Thesis, Department of Management and Engineering, Linköping University, Linköping, Sweden, 2010. [Google Scholar]
- Ripke, B.; Knothe, K. Simulation of high frequency vehicle-track interactions. Veh. Syst. Dyn. 1995, 24 (Suppl. 1), 72–85. [Google Scholar] [CrossRef]
- Indraratna, B.; Khabbaz, H.; Salim, W.; Christie, D. Geotechnical properties of ballast and the role of geosynthetics. In Institution of Civil Engineers. Proceedings. Ground 3; ICE Publishing: London, UK, 2006. [Google Scholar]
- Indraratna, B.; Salim, W.; Rujikiatkamjorn, C. Advanced Rail Geotechnology–Ballasted Track; CRC Press: Boca Raton, FL, USA, 2011. [Google Scholar]
- Civilstagram. Track Ballast. Available online: http://civilstagram.blogspot.com/2016/02/track-ballast.html# (accessed on 25 February 2016).
- Witt, S. The Influence of under Sleeper Pads on Railway Track Dynamics. Master’s Thesis, Department of Management and Engineering, Linköping University, Linköping, Sweden, 2008. [Google Scholar]
- Kaewunruen, S.; Remennikov, A. Field trials for dynamic characteristics of railway track and its components using impact excitation technique. NDT E Int. 2007, 40, 510–519. [Google Scholar] [CrossRef]
- Peeters, B.; Van der Auweraer, H.; Guillaume, P.; Leuridan, J. The PolyMAX frequency-domain method: A new standard for modal parameter estimation. Shock Vib. 2004, 11, 395–409. [Google Scholar] [CrossRef]
- Datafit. User’s Manual; Oakdale Engineering: Oakdale, PA, USA, 2006. [Google Scholar]
- Paixão, A.; Alves Ribeiro, C.; Pinto, N.; Fortunato, E.; Calçada, R. On the use of under sleeper pads in transition zones at railway underpasses: Experimental field testing. Struct. Infrastruct. Eng. 2015, 11, 112–128. [Google Scholar] [CrossRef]
- Powrie, W.; Yang, L.A.; Clayton, C.R. Stress changes in the ground below ballasted railway track during train passage. Proc. Inst. Mech. Eng. Part F J. Rail Rapid Transit 2007, 221, 247–262. [Google Scholar] [CrossRef]
- Herron, D.; Jones, C.; Thompson, D.; Rhodes, D. Characterising the high-frequency dynamic stiffness of railway ballast. In Proceedings of the 16th International Congress on Sound and Vibration: Recent Developments in Acoustics (Noise and Vibration (ICSV16)), Krakow, Poland, 5–9 July 2009; pp. 5–9. [Google Scholar]
- Esmaeili, M.; Aela, P.; Hosseini, A. Experimental assessment of cyclic behaviour of sand-fouled ballast mixed with tire derived aggregates. Soil Dyn. Earthq. Eng. 2017, 98, 1–11.4. [Google Scholar] [CrossRef]
- De Bold, R.P. Non-Destructive Evaluation of Railway Track Bed Ballast. Ph.D. Thesis, School of Engineering, The University of Edinburgh, Edinburgh, UK, 2011. [Google Scholar]
- Gavin, H.P. Vibrations of Single Degree of Freedom Systems; Class Note CEE201; Department of Civil and Environmental Engineering, Duke University: Dehan, NC, USA, 2014. [Google Scholar]
- Chopra, A.K.; Chintanapakdee, C. Inelastic deformation ratios for design and evaluation of structures: Single-degree-of-freedom bilinear systems. J. Struct. Eng. 2004, 130, 1309–1319. [Google Scholar] [CrossRef]
- Zola, M. Data Acquisition, Processing, Release to the Designers for Design Assessment; No. INIS-XA-584; Nuclear Power Institute of China: Chengdu, China, 2001. [Google Scholar]
- Warburton, G.B. Optimum absorber parameters for various combinations of response and excitation parameters. Earthq. Eng. Struct. Dyn. 1982, 10, 381–401. [Google Scholar] [CrossRef]
- Agilent Technologies. The Fundamentals of Modal Testing; Agilent Technologies: Santa Clara, CA, USA, 2000. [Google Scholar]
- Molodova, M. Detection of Early Squats by Axle Box Acceleration. Ph.D. Thesis, Department of Road and Railway Engineering, Delft University of Technology, Delft, The Netherlands, 2013. [Google Scholar]
- Ganesan, A.; Seshia, A.A. Tracking the Resonant Frequency of a Micromechanical Resonator Using Phononic Frequency Combs. arXiv 2017, arXiv:1710.07058. [Google Scholar]
- BBC News. Kerala Floods: Monsoon Waters Kill Hundreds in Indian State. Available online: https://www.bbc.co.uk/news/world-asia-india-45216671 (accessed on 21 August 2018).
- Kellermann, P.; Schönberger, C.; Thieken, A.H. Large-scale application of the flood damage model Railway Infrastructure Loss (RAIL). Nat. Hazards Earth Syst. Sci. 2016, 16, 2357–2371. [Google Scholar] [CrossRef]
- Irazábal González, J. Numerical Analysis of Railway Ballast Behaviour Using the Discrete Element Method. Ph.D. Thesis, Department of Civil Engineering, Polytechnical University of Catalunya, Barcelona, Spain, 2017. [Google Scholar]
- Freimanis, A.; Kaewunruen, S. Peridynamic Analysis of Rail Squats. Appl. Sci. 2018, 8, 2299. [Google Scholar] [CrossRef]
- Network Rail. Flooding. Available online: https://www.networkrail.co.uk/running-the-railway/looking-after-the-railway/delays-explained/flooding/ (accessed on 30 March 2017).
- Wikipedia. Buoyancy. Available online: https://en.wikipedia.org/wiki/Buoyancy (accessed on 10 August 2018).
- Liu, P.; Tang, B.-J.; Kaewunruen, S. Vibration-Induced Pressures on a Cylindrical Structure Surface in Compressible Fluid. Appl. Sci. 2019, 9, 1403. [Google Scholar] [CrossRef]
- Liu, P.; Kaewunruen, S.; Tang, B.-J. Dynamic Pressure Analysis of Hemispherical Shell Vibrating in Unbounded Compressible Fluid. Appl. Sci. 2018, 8, 1938. [Google Scholar] [CrossRef]
- Kaewunruen, S.; Sussman, J.M.; Matsumoto, A. Grand Challenges in Transportation and Transit Systems. Front. Built Environ. 2016, 2, 4. [Google Scholar] [CrossRef]


| Mass Types | Concrete Block | Concrete Sleeper | FFU Sleeper |
|---|---|---|---|
| Size (mm3) | 150 × 150 × 150 | 900 × 250 × 160 (average) | 820 × 260 × 160 |
| Contact area (mm2) | 22,500 | 225,000 | 213,200 |
| Mass (kg) | 7.815 | 110.3 | 23.0 |
| Property | Kelvin Model | Poyning-Thomson Model |
|---|---|---|
| Kt | K | = αΚ1 + Κ2 |
| Ct | C | = αβC1 |
| Types of Test | Flooding Level | Damping (kN·s/m) | Stiffness (MN/m) | Frequency (Hz) | Curve Fitting Error | Correlation Coefficient |
|---|---|---|---|---|---|---|
| Concrete sleeper on natural ballast (23 °C–26 °C) | 00 cm | 1.1626 | 14.6742 | 58 | 0.74% | 99.26% |
| 10 cm | 1.7753 | 13.7405 | 56 | 0.57% | 99.43% | |
| 20 cm | 1.8268 | 13.4096 | 56 | 0.45% | 99.55% | |
| 30 cm | 2.3174 | 11.9497 | 52 | 1.56% | 98.44% | |
| 35 cm | 2.3701 | 11.329 | 51 | 0.17% | 99.83% | |
| 40 cm | 3.3087 | 6.5838 | 39 | 1.25% | 98.75% | |
| FFU sleeper on natural ballast (21 °C–23 °C) | 00 cm | 1.3239 | 15.0783 | 129 | 6.96% | 93.04% |
| 10 cm | 1.3123 | 15.3719 | 130 | 6.15% | 93.85% | |
| 20 cm | 1.3859 | 14.8682 | 128 | 0.05% | 99.95% | |
| 30 cm | 1.1585 | 15.0044 | 129 | 2.67% | 97.33% | |
| 35 cm | 1.4073 | 15.0508 | 129 | 0.60% | 99.40% | |
| 40 cm | 6.3001 | 13.1991 | 125 | 0.44% | 99.56% | |
| Concrete block on natural ballast (24 °C–25 °C) | 00 cm | 1.0815 | 14.2493 | 215 | 3.16% | 96.84% |
| 10 cm | 1.156 | 13.51 | 210 | 5.00% | 95.00% | |
| 20 cm | 1.1975 | 12.5404 | 202 | 1.47% | 98.53% | |
| 30 cm | 1.3944 | 13.1293 | 207 | 0.93% | 99.07% | |
| 35 cm | 1.6208 | 11.2456 | 192 | 2.62% | 97.38% | |
| 40 cm | 1.2125 | 9.4513 | 176 | 5.13% | 94.87% |
| Water Level | C1 (kN·s/m) | C2 (kN·s/m) | K (MN/m) | Frequency (Hz) | Error | Correlation Coefficient |
|---|---|---|---|---|---|---|
| 00 cm | / | 1.1626 | 14.6742 | 58 | 0.544% | 99.456% |
| 10 cm | 157246218.0 | 1.7757 | 13.7406 | 56 | 0.401% | 99.599% |
| 20 cm | 8102587.1 | 1.8268 | 13.4097 | 56 | 0.305% | 99.695% |
| 30 cm | 93916878.9 | 2.3175 | 11.9499 | 52 | 1.033% | 98.967% |
| 35 cm | 12062653.1 | 2.3701 | 11.3291 | 51 | 0.107% | 99.893% |
| 40 cm | 90112652.5 | 3.3086 | 6.5844 | 39 | 0.713% | 99.287% |
| Types | Flooding Level | Damping C1 (kN·s/m) | Stiffness K1 (MN/m) | Stiffness K2 (MN/m) | Frequency (Hz) | R2 | Ct | Kt |
|---|---|---|---|---|---|---|---|---|
| Concrete sleeper on natural ballast (23 °C–26 °C) | 00 cm | 1.1626 | / | 14.6742 | 58 | 99.259% | 1.16 | 14.67 |
| 10 cm | 1.5842 | 5.1906 | 13.7423 | 56 | 99.600% | 1.76 | 13.80 | |
| 20 cm | 1.6329 | 5.3604 | 13.4114 | 56 | 99.695% | 1.81 | 13.47 | |
| 30 cm | 2.0663 | 6.1864 | 11.9530 | 52 | 98.981% | 2.29 | 12.03 | |
| 35 cm | 2.1142 | 6.3562 | 11.3321 | 51 | 99.884% | 2.34 | 11.40 | |
| 40 cm | 3.0594 | 9.1594 | 6.5888 | 39 | 99.307% | 3.29 | 6.65 | |
| FFU sleeper on natural ballast (21 °C–23 °C) | 00 cm | 1.3239 | / | 15.0783 | 129 | 93.040% | 1.32 | 15.08 |
| 10 cm | 0.9748 | 3.0967 | 15.3856 | 130 | 95.694% | 1.23 | 15.58 | |
| 20 cm | 1.0355 | 3.2988 | 14.8826 | 128 | 99.886% | 1.30 | 15.08 | |
| 30 cm | 0.8643 | 2.7483 | 15.0147 | 129 | 98.099% | 1.09 | 15.18 | |
| 35 cm | 1.0489 | 3.3429 | 15.0655 | 129 | 99.396% | 1.32 | 15.27 | |
| 40 cm | 4.8084 | 16.0920 | 13.5564 | 125 | 99.680% | 5.97 | 14.40 | |
| concrete block on natural ballast (24 °C–25 °C) | 00 cm | 1.0815 | / | 14.2493 | 215 | 96.840% | 1.08 | 14.25 |
| 10 cm | 0.6797 | 2.1809 | 13.5743 | 210 | 93.230% | 0.99 | 13.89 | |
| 20 cm | 0.7222 | 2.3210 | 12.6049 | 202 | 94.220% | 1.04 | 12.92 | |
| 30 cm | 0.8292 | 2.6763 | 13.2210 | 207 | 93.275% | 1.20 | 13.59 | |
| 35 cm | 1.0136 | 3.2896 | 11.3589 | 192 | 92.866% | 1.42 | 11.76 | |
| 40 cm | 0.7944 | 2.5542 | 9.5055 | 176 | 93.639% | 1.08 | 9.78 |
| Type of Ballast | Measured Density (kg/m3) | The Unit Bulk Weight (N/m3) | Unit Volume of Displaced Water (m3/m3) |
|---|---|---|---|
| Natural ballast | 1492.806 | 14644.43 | 0.5346 |
| Types | Flooding Level | Volume of Ballast (m3) | Volume of Discharged Water (m3) | Buoyancy (N) | Self-Weight (N) |
|---|---|---|---|---|---|
| Large-scale ballast bed (natural ballast) | 00 cm | 0.00 | 0.00 | 0.00 | 0 |
| 10 cm | 0.17 | 0.09 | 873.22 | 2438.30 | |
| 20 cm | 0.33 | 0.18 | 1746.44 | 4876.59 | |
| 30 cm | 0.50 | 0.27 | 2619.67 | 7314.89 | |
| 35 cm | 0.58 | 0.31 | 3056.28 | 8534.04 | |
| 40 cm | 0.67 | 0.36 | 3056.28 | 8534.04 | |
| Small-scale ballast bed (natural ballast) | 00 cm | 0.00 | 0.00 | 0.00 | 0.00 |
| 10 cm | 0.03 | 0.02 | 164.69 | 459.87 | |
| 20 cm | 0.06 | 0.03 | 329.39 | 919.74 | |
| 30 cm | 0.09 | 0.05 | 494.08 | 1379.61 | |
| 35cm | 0.11 | 0.06 | 576.42 | 1609.55 | |
| 40 cm | 0.13 | 0.07 | 576.42 | 1609.55 |
© 2019 by the authors. Licensee MDPI, Basel, Switzerland. This article is an open access article distributed under the terms and conditions of the Creative Commons Attribution (CC BY) license (http://creativecommons.org/licenses/by/4.0/).
Share and Cite
Kaewunruen, S.; Tang, T. Idealisations of Dynamic Modelling for Railway Ballast in Flood Conditions. Appl. Sci. 2019, 9, 1785. https://doi.org/10.3390/app9091785
Kaewunruen S, Tang T. Idealisations of Dynamic Modelling for Railway Ballast in Flood Conditions. Applied Sciences. 2019; 9(9):1785. https://doi.org/10.3390/app9091785
Chicago/Turabian StyleKaewunruen, Sakdirat, and Tao Tang. 2019. "Idealisations of Dynamic Modelling for Railway Ballast in Flood Conditions" Applied Sciences 9, no. 9: 1785. https://doi.org/10.3390/app9091785
APA StyleKaewunruen, S., & Tang, T. (2019). Idealisations of Dynamic Modelling for Railway Ballast in Flood Conditions. Applied Sciences, 9(9), 1785. https://doi.org/10.3390/app9091785