Article

Dye Adsorbent Materials Based on Porous Ceramics from Glass Fiber-Reinforced Plastic and Clay

1
Department of Engineering, University of Miyazaki, 1-1 Gakuen-Kibanadai-Nishi, Miyazaki 889-2192, Japan
2
Student in Engineering Department, University of Miyazaki, 1-1 Gakuen-Kibanadai-Nishi, Miyazaki 889-2192, Japan
3
Graduate School of Engineering, University of Miyazaki, 1-1 Gakuen-Kibanadai-Nishi, Miyazaki 889-2192, Japan
*
Author to whom correspondence should be addressed.
Appl. Sci. 2019, 9(8), 1574; https://doi.org/10.3390/app9081574
Submission received: 4 February 2019 / Revised: 4 April 2019 / Accepted: 12 April 2019 / Published: 16 April 2019
(This article belongs to the Special Issue Ceramic Composites and Films)

Abstract

:
We investigated the use of waste glass fiber-reinforced plastic (GFRP) to remove dye from industrial wastewater. The dye adsorbent material, based on GFRP/clay ceramics, was produced by mixing crushed GFRP with clay and firing the resulting mixture. Several types of ceramics were produced by adjusting the mixing ratio of clay, crushed 40% GF/GFRP, and firing atmosphere. Adsorption tests with methylene blue (MB) dye were performed by mixing the ceramics into an MB solution while controlling the stirring speed and measuring the decrease in MB dye concentration over time. These results showed that GFRP/clay ceramics reductively fired at 1073 K had a higher MB dye adsorption ability than that of the clay ceramic. The MB dye absorptivity of the reductively fired ceramics increased as we increased the mixing ratio of GFRP. We attribute this result to the high plastic carbide content in the ceramic, which has excellent dye absorbability. Furthermore, these particles had a comparatively high specific surface area and porosity.

1. Introduction

Glass fiber-reinforced plastic (GFRP) is used in various products, such as automobile parts and small ships, due to its light weight and high strength properties. Currently, however, most GFRP waste is sent to landfills because it is difficult to recycle with existing recycling technologies [1,2]. Fine glass fiber dust and leachates from this process may cause serious health and environmental damage [3]. To reduce this environmental burden, the development of an effective technique to dispose of waste GFRP is desirable.
Hence, previous studies have produced porous glass fiber-reinforced ceramics by mixing crushed waste GFRP with clay and then firing the resulting mixture to generate GFRP/clay ceramics [4,5,6,7]. Such ceramics are highly water permeable and strong; therefore, we have used these ceramics as a filtering material for turbid water treatment [6]. The ceramic filtering materials can remove various sizes of suspended matter in turbid water and ceramics with different pore size distributions are producible by adjusting the mixing ratio of GFRP with clay, the particle size of crushed GFRP, and the ceramic firing temperature. However, at present, GFRP/clay ceramic filtering materials are not able to easily remove nanometer-sized suspended particles and the purification of wastewater containing harmful substances remains challenging, which results in a need for ceramics that have an improved purification ability.
Currently, clothing fibers and leather goods are dyed during manufacturing processes. As a result, factories produce a large amount of dye wastewater. The dye wastewater must be purified by the proper treatment methods to avoid adverse environmental effects at the discharge site. Activated carbon treatments [8,9] and Fenton’s reagent-based methods [10,11] are mainly used to purify dye wastewater. However, activated carbon treatments are expensive and approaches using Fenton’s reagent also require additional treatments to remove sludge produced during the purification process.
GFRP/clay ceramics are porous clay-based ceramics. Clay minerals have excellent absorbability for dyes [12]. If GFRP/clay ceramics were used as dye adsorbents, it might be possible to effectively use waste GFRP to address issues involved with current dye wastewater treatments. In this study, we investigate the possibility of using GFRP/clay ceramics as adsorbent materials to remove dyes from wastewater effluent.
First, various specimens were fabricated by adjusting the mixing ratio of clay and crushed 40% GF/GFRP, as well as the firing atmosphere. We examined the apparent porosity, specific surface area, and carbon content of the ceramic as factors that are likely to influence the dye adsorption ability. Next, we performed adsorption tests with methylene blue (MB) dye with several types of GFRP/clay ceramics by modifying the MB solution stirring speed. Decreases in the MB dye concentration were compared with that of a ceramic produced from only clay (i.e., a clay ceramic). Based on these results, we evaluated the MB dye adsorption ability of the GFRP/clay ceramics and investigated the mechanisms that occur during MB dye adsorption.

2. Materials and Methods

2.1. GFRP/Clay Ceramic Specimens Used for MB Dye Adsorption Tests
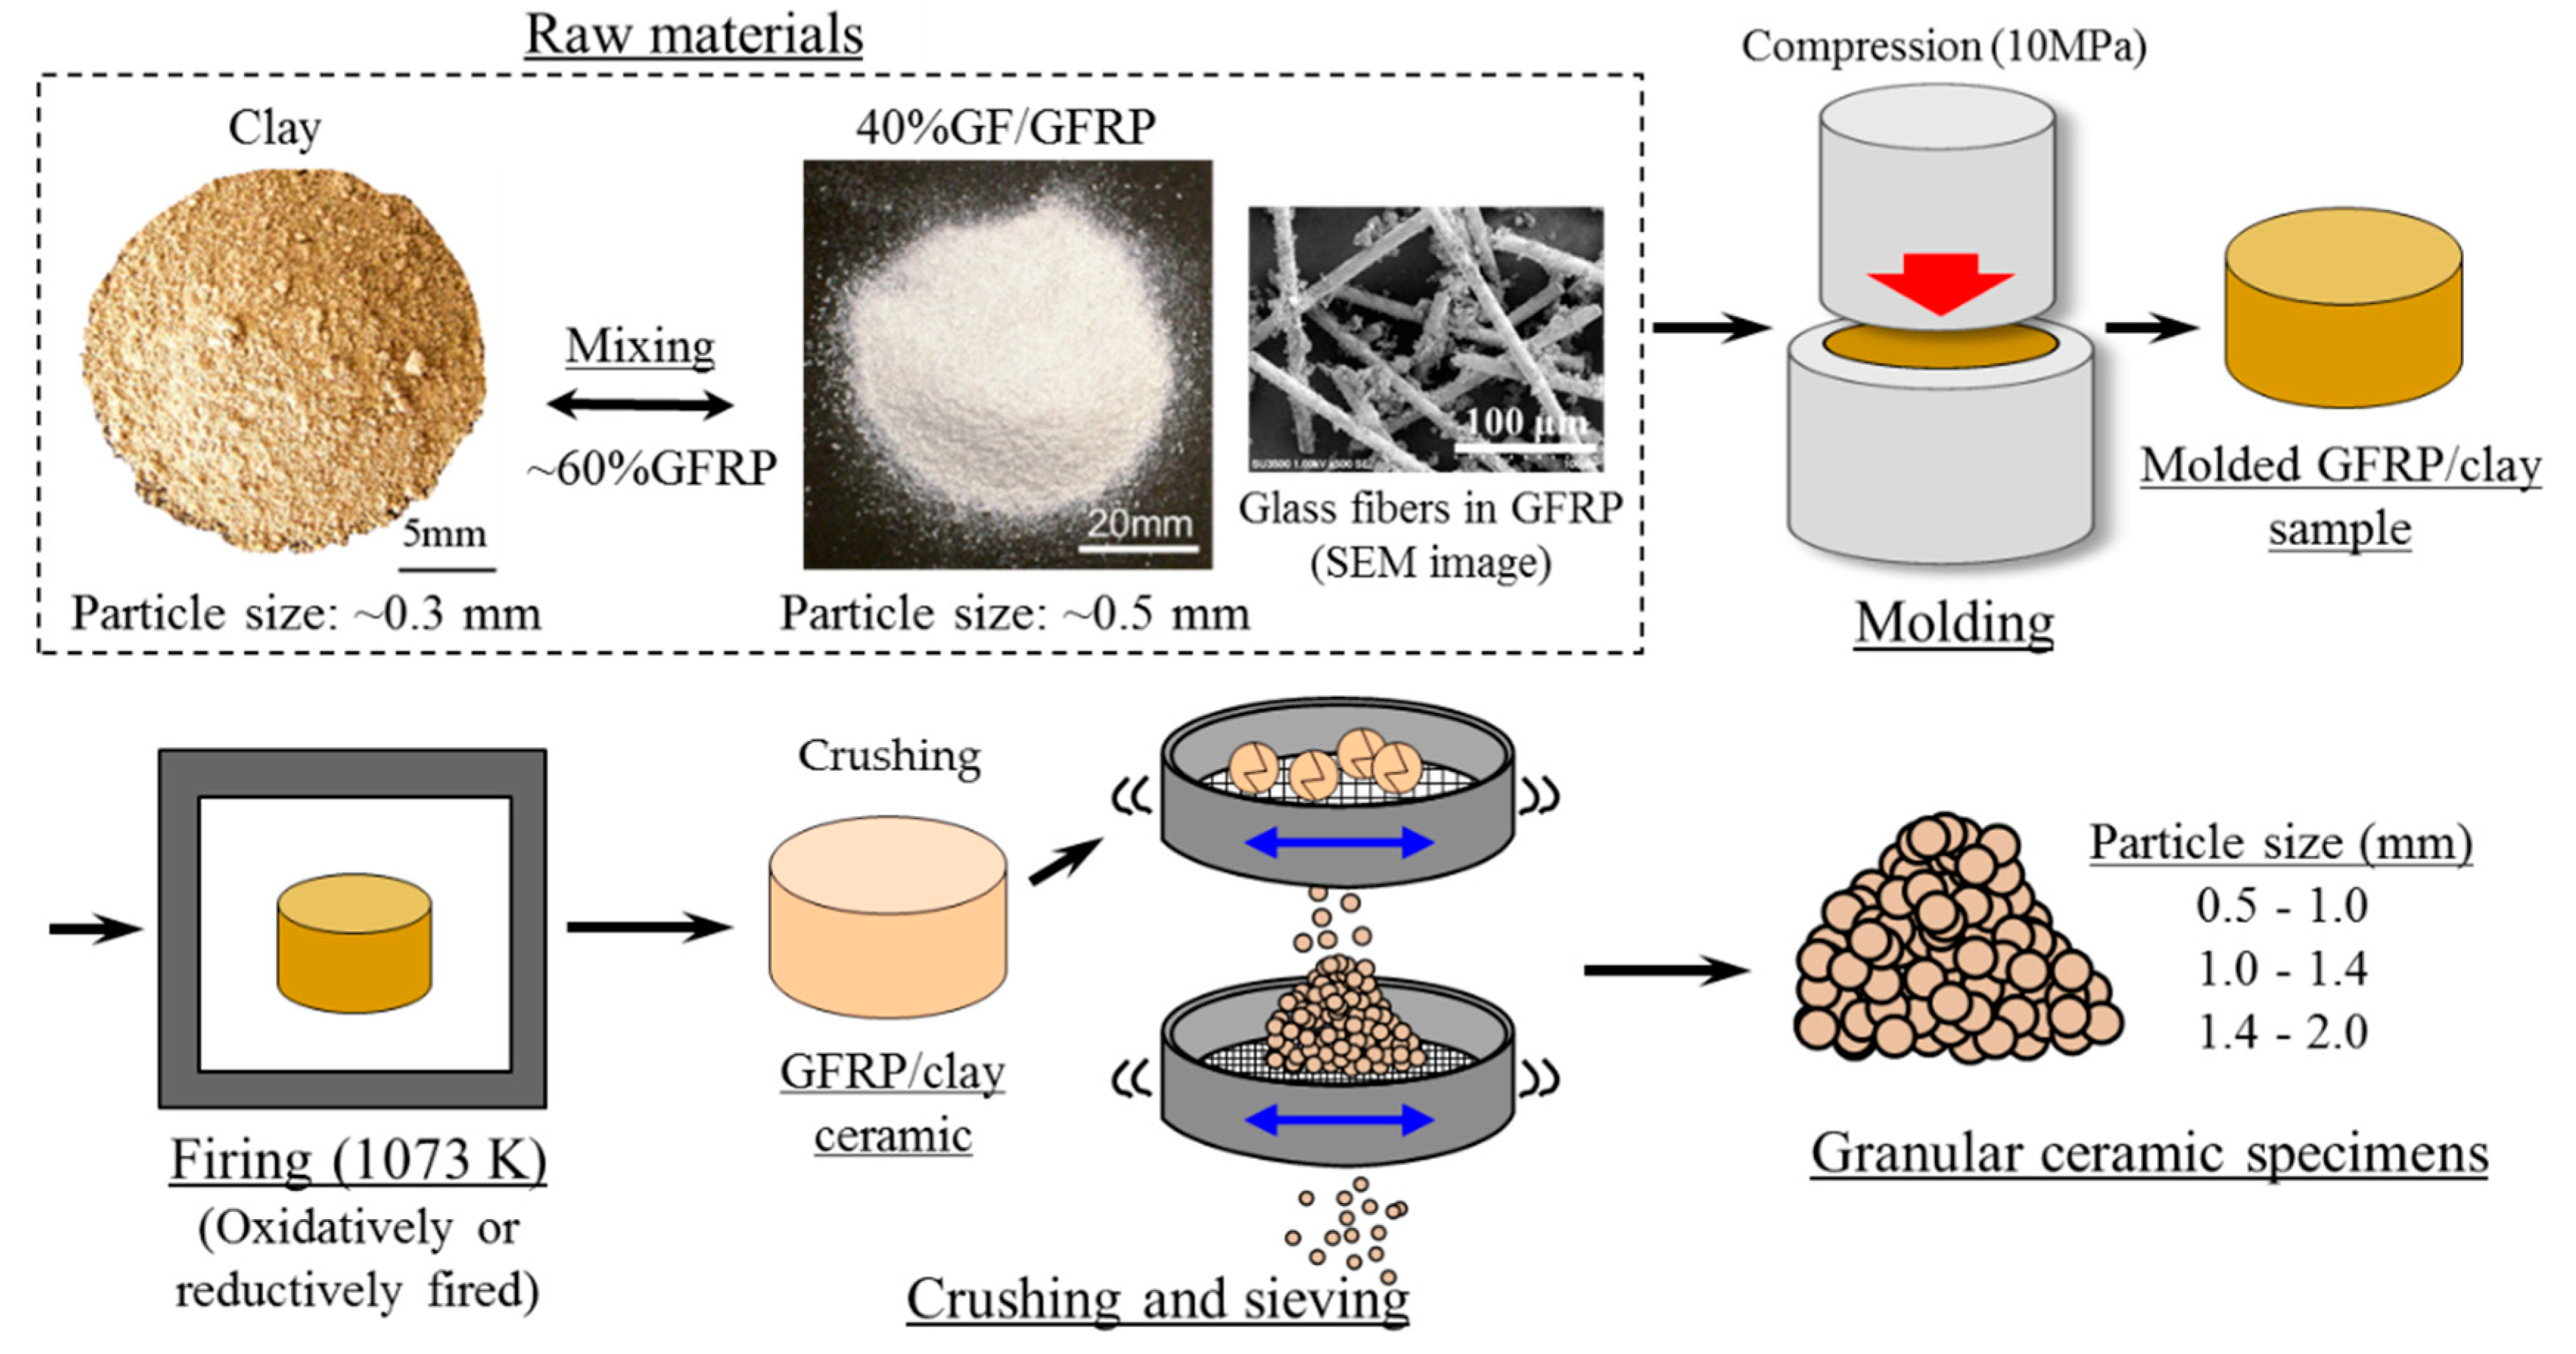
Figure 1 shows the process used to prepare GFRP/clay ceramic specimens, which were used for the MB dye adsorption tests. Polyamide (PA) thermoplastic pellets (Renny, Mitsubishi Engineering-Plastics Co., Tokyo, Japan), which contain glass fibers at approximately 40% by mass, were used as a surrogate for waste GFRP. Scanning electron microscope (SEM, SU3500, Hitachi High-Technologies Corporation, Tokyo, Japan) images of the glass fibers are shown in Figure 1. The images show the residues after heating the 40% GF/GFRP pellets at 673 K. Based on these images, we estimated that the GFRP contains glass fibers with diameters of approximately 10 µm and lengths of ~1.0 mm. The clay used in this study was produced in Miyazaki, Japan, and is typically used in brick or tile manufacturing. The major minerals in the clay derive from the chlorite group.
Table 1 shows the inorganic chemical compositions of the GFRP and clay after firing at 1073 K. The inorganic chemical compositions were measured with an energy dispersive X-ray analyzer (EDX-720, Shimadzu Corporation, Kyoto, Japan) by using a fundamental parameter method. The type of the glass fibers included in GFRP is compatible with E glass type family within broad error bars. However, the glass fibers might include a contribution from another source (e.g., a CaCO3 polymer filler) because CaO content is too high.
Table 2 shows the manufacturing conditions of the GFRP/clay ceramic specimens. The GFRP/clay ceramic specimens were prepared with the following process.
(1)
Clay was crushed using a rotary mill (New Power Mill ABS-W, Osaka Chemical Co., Ltd., Osaka, Japan) and then sifted using a 0.3-mm mesh screen.
(2)
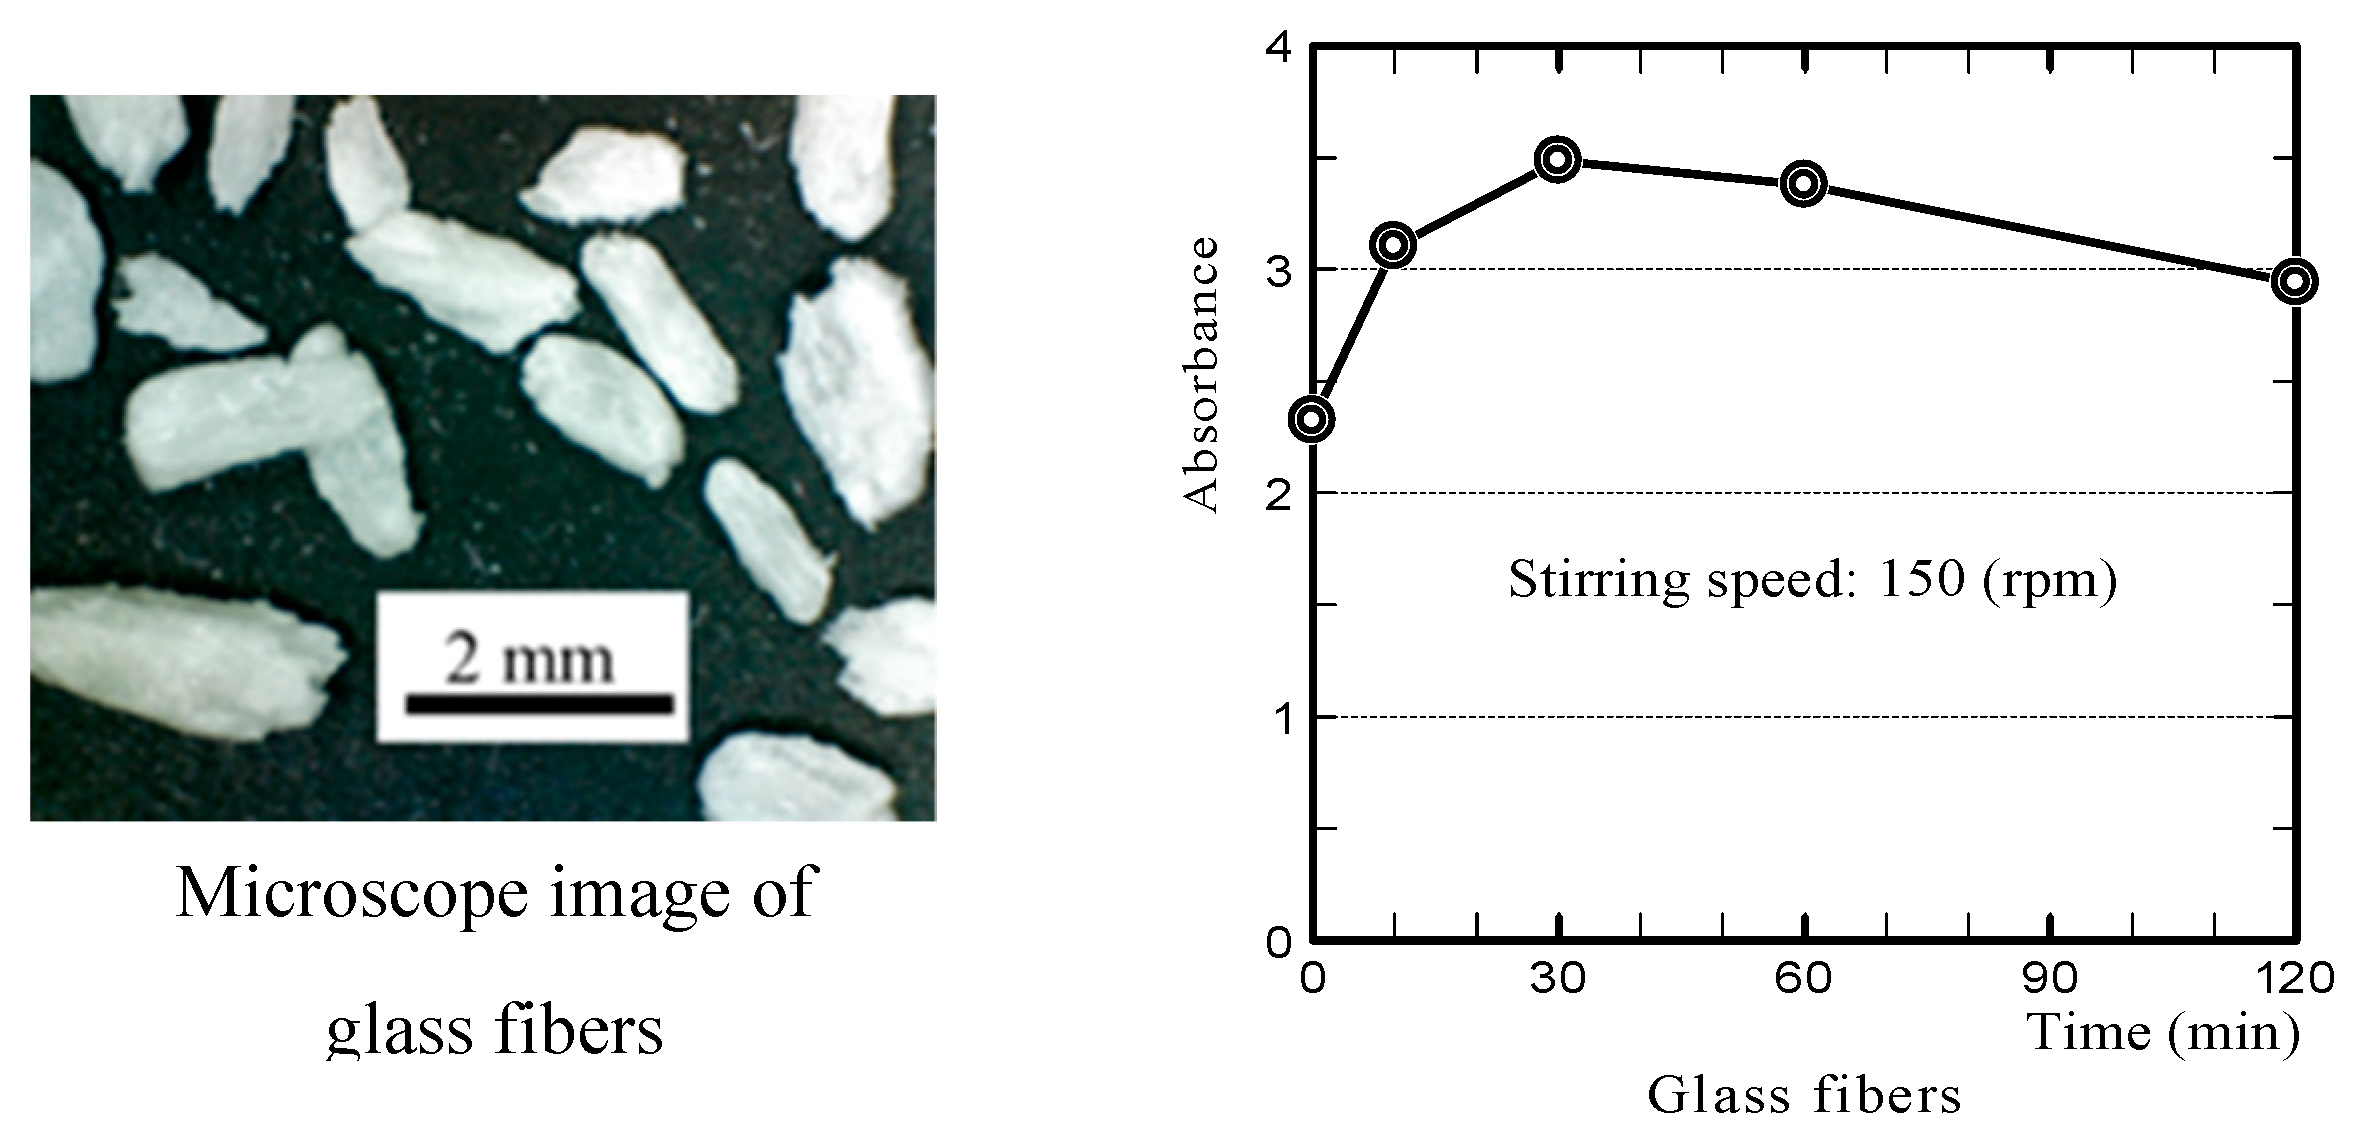
GFRP was also crushed in the rotary mill and then sifted with a 0.5 mm-mesh screen. Here, the maximum length of the glass fibers in GFRP, which were sifted with the 0.5 mm-mesh screen, was approximately 150 µm [7].
(3)
The crushed GFRP was mixed with the clay in the mass ratios listed in Table 2.
(4)
The GFRP and clay mixture was solidified by pressing into a mold at 10 MPa. The molded samples had a diameter of 74 mm and a thickness of 50–60 mm.
(5)
The molded samples were heated in an oxidizing or reducing atmosphere at a firing temperature of 1073 K in an electric furnace (KY-4N, Kyoei Electric Kilns Co., Ltd., Tajimi, Japan). The samples were then held at the firing temperature for 1 h and allowed to cool to room temperature in the furnace. For oxidative firing, samples were heated at 100 K h−1 to the firing temperature. In reductive firing, the samples were heated at 400 K h−1.
(6)
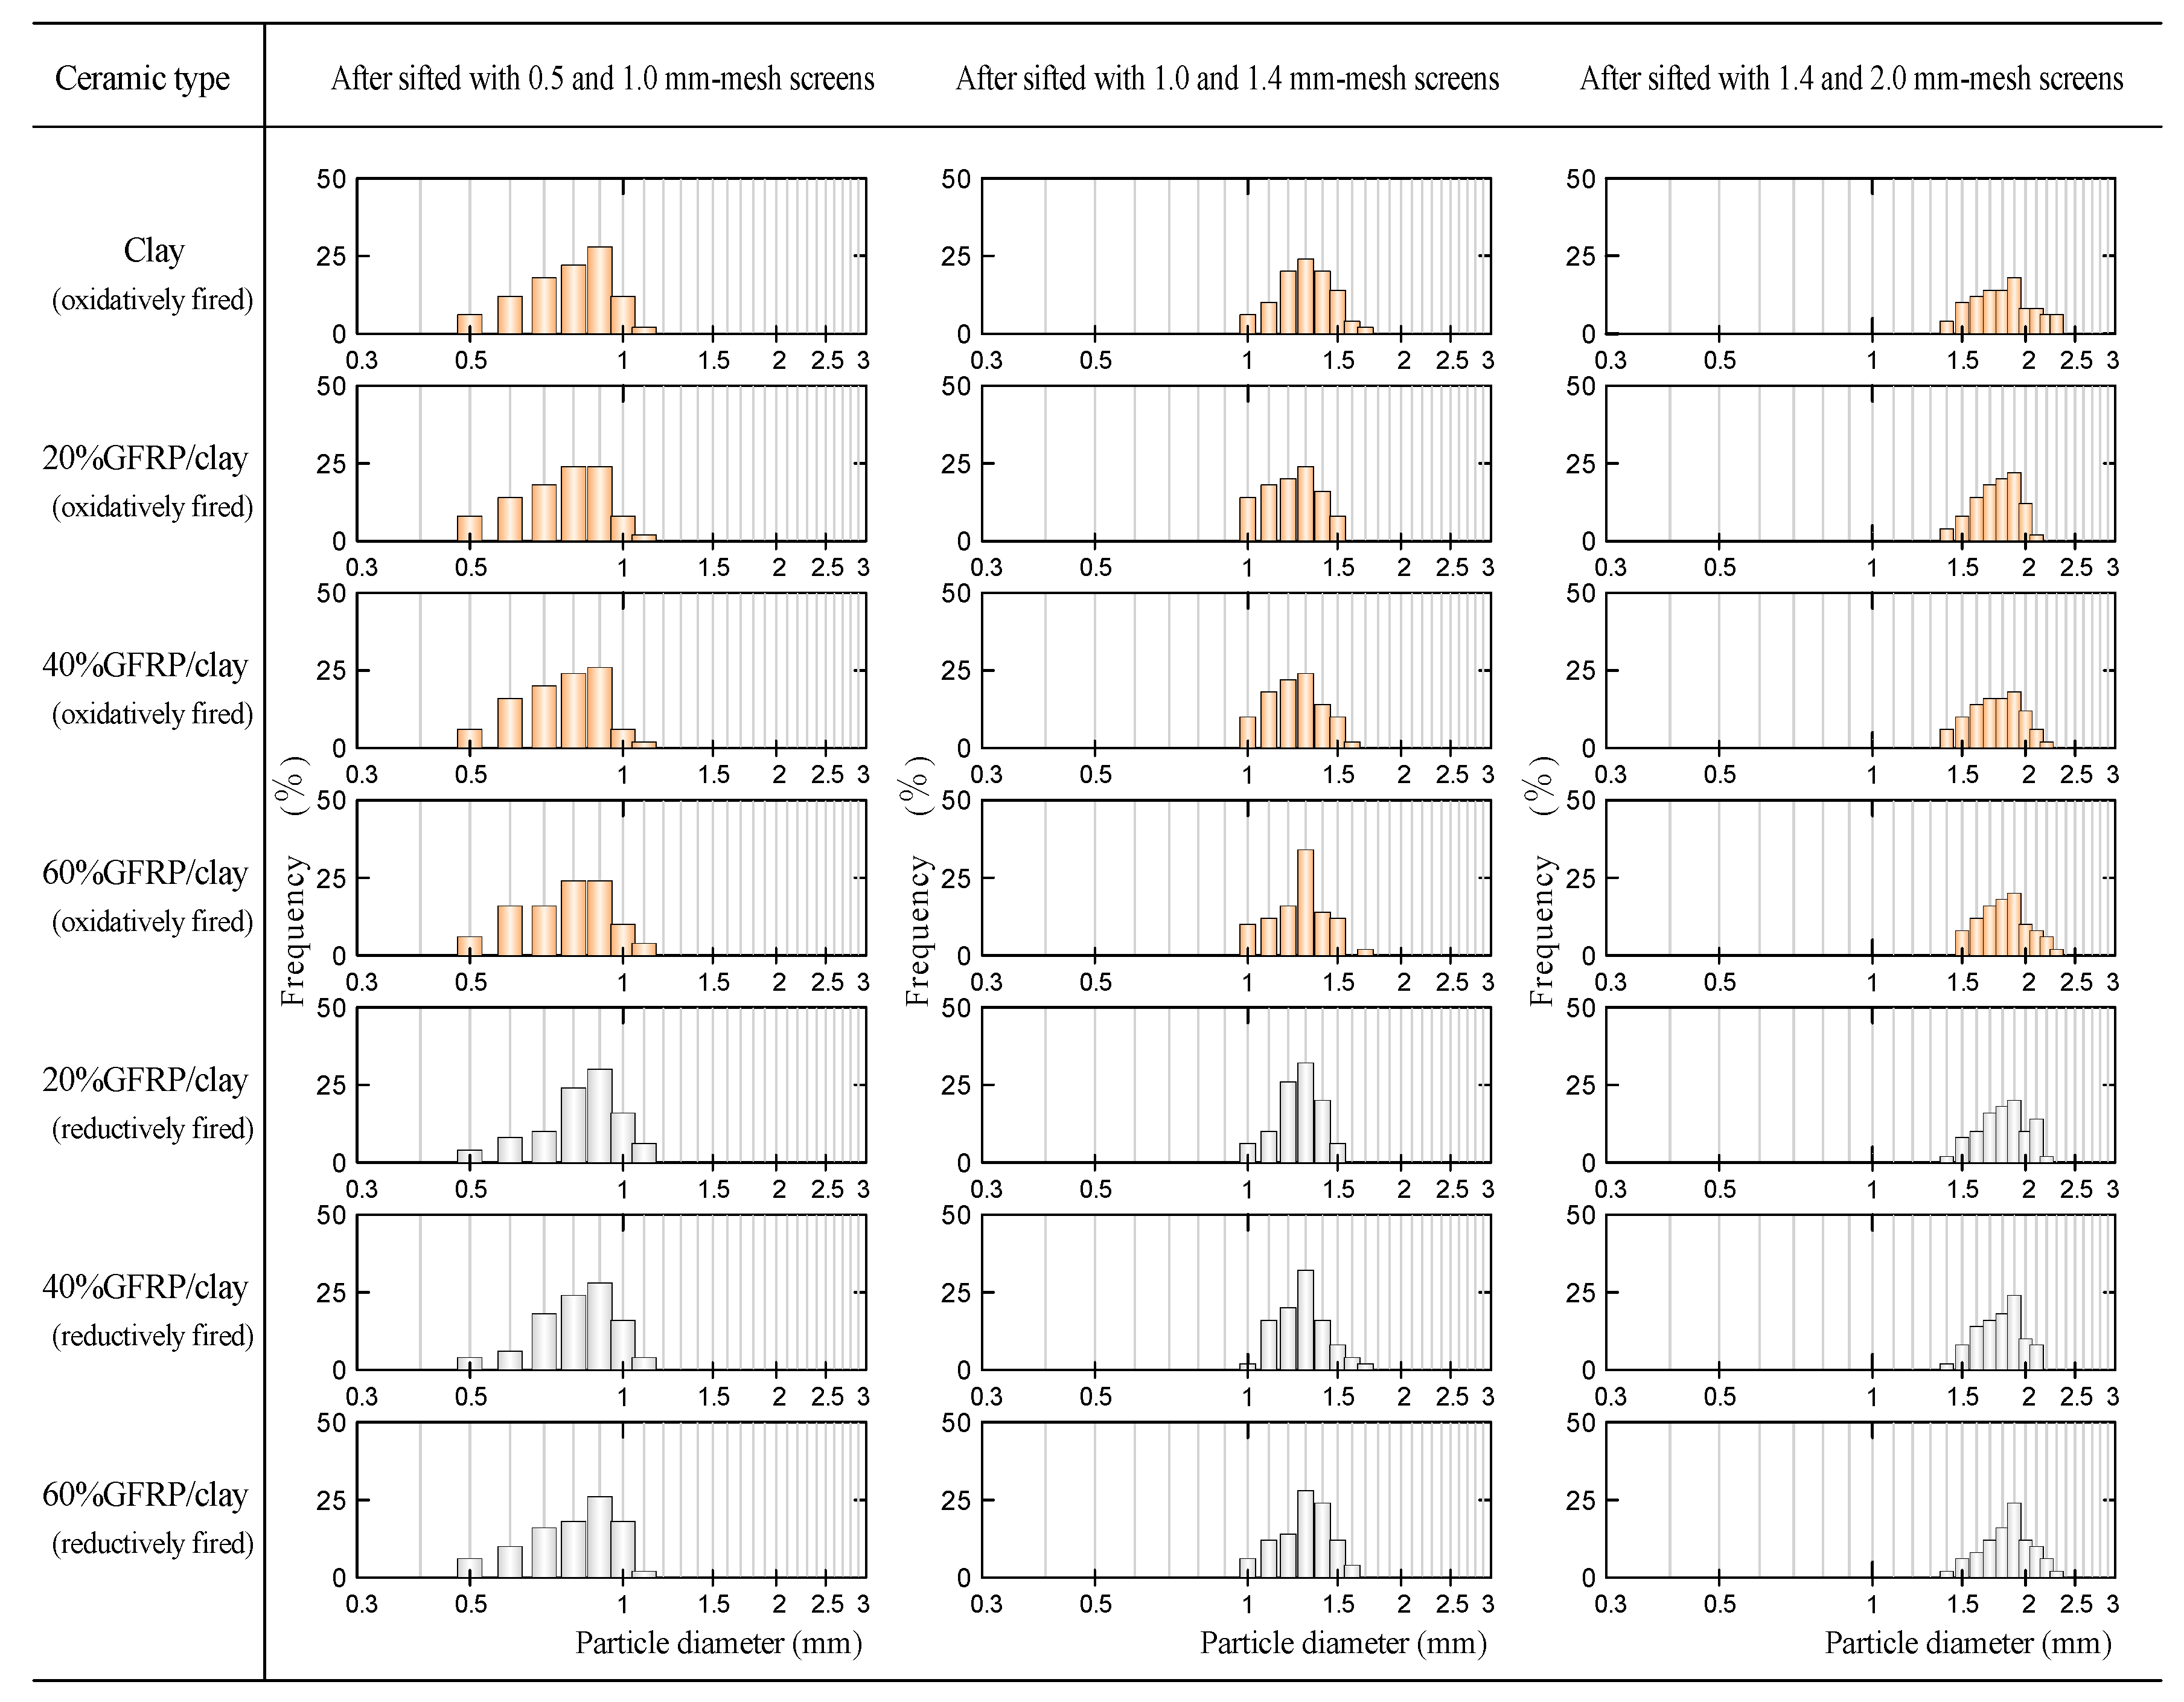
The produced GFRP/clay ceramics were then crushed with a hammer and selected to yield a predetermined particle size, as shown in Table 2.
In addition, to evaluate the MB dye adsorption ability of the GFRP/clay ceramics, we produced a ceramic control sample, in which only clay was fired in an oxidizing atmosphere. Figure 2 shows microscope (SZX10, Olympus Corporation, Tokyo, Japan) images of the granular ceramic specimens, which were produced with exposure to the conditions listed in Table 2, and scanning electron microscope (SEM, S5500, Hitachi High-Technologies Corporation, Tokyo, Japan) images of their surface structures. The ceramic specimens fired oxidatively were brown, whereas the specimens fired reductively were black because a part of the GFRP resin component was not decomposed and remained in the clay structure as carbides. In both ceramics fired oxidatively and reductively, glass fibers in the structure were partially sintered [7].
Figure 3 shows the particle size distributions of ceramic specimens. Here, the particle size distribution was obtained by the following methods. First, 50 samples were randomly selected from the sieved samples, and the maximum diameter of each sample was measured with a microscope (SMZ800, NIKON Instech Co., Ltd., Tokyo, Japan). Next, the maximum diameter distribution on the 50 samples was determined statistically.
From Figure 3, the maximum length of the ceramic specimens sifted with 0.5 and 1.0 mm, 1.0 and 1.4 mm, and 1.4 and 2.0 mm mesh screens were approximately 1.1 mm, 1.7 mm, and 2.4 mm, respectively.
Table 3 shows the inorganic chemical compositions of the ceramic specimens. The main chemical components of the clay ceramic were SiO2 and AlO3. The GFRP/clay ceramics had similar chemical components to those of the clay ceramic; however, the GFRP/clay had a larger CaO component. The ratio of the CaO component to total ceramic mass increased as the GFRP mixing ratio increased due to increasing glass fiber contents.
Figure 4 lists the compressive strengths of the GFRP/clay ceramics. Here, cylindrical specimens, with a diameter of 14 mm and length of approximately 30 mm, were used for the compressive tests. Cylindrical specimens were compressed using a universal testing machine (AG-X50kN, Shimadzu Corporation, Kyoto, Japan) with a crosshead speed of 0.5 mm min−1. Load cell capacity of the machine was 50 kN, and the precision of the test force was within ±1% of displayed test force for 1/1 to 1/1000 of the load cell capacity, which conforms to JIS B7721 Class 1 and ISO 7500-1 Class 1. Compressive strength was determined by dividing the measured maximum compressive load by the specimen cross-sectional area. The data points are the average compressive strengths calculated from measurements of the four specimens.
The compressive strength of the GFRP/clay ceramics decreased as the GFRP mixing ratio increased because the ceramic porosity increased as the GFRP mixing ratio increased, as shown in Table 4. However, the ceramics possessed a certain degree of strength and were capable of granulation. The ceramics fired reductively had a slightly lower strength than ceramics fired oxidatively. When a mixture of plastic particles without glass fibers and clay was fired at 1073 K, the produced ceramic possessed a very low strength and was brittle because glass fibers had not reinforced the clay structure [7]. Therefore, crushing the ceramic into granules posed difficulties.

2.2. Measurements of Apparent Porosity, Pore-Size Distribution, Specific Surface Area, and Carbide Content of the GFRP/Clay Ceramic

For porous materials, a large specific surface area is typically linked to excellent fine particle absorptivity [13,14] and porous carbide also possesses excellent absorptivity for specific substances [15]. Therefore, we measured the apparent porosities and pore-size distributions of GFRP/clay ceramics.
The apparent porosity of each ceramic and the pore-size distribution of 0.01 μm or more were measured with a mercury porosimeter (Auto Pore IV 9500, Micromeritics Instrument Corporation, Norcross, GA, USA). The pore size distribution of sub-micron or less and the specific surface area of each granular ceramic specimen were measured with a high precision gas and vapor adsorption measurement instrument (BELSORP-max, MicrotracBEL Corp., Osaka, Japan). The carbon content of the ceramic specimen was measured with an elemental analyzer (CHNS/O Analyzer 2400, PerkinElmer Inc., Waltham, MA, USA).

2.3. MB Dye Adsorption Tests

Figure 5 shows a schematic diagram of the MB dye adsorption testing based on the granular GFRP/clay ceramics. An aqueous MB solution was used as a surrogate dye wastewater. The MB dye adsorption tests were performed with the following procedures.
(1)
Ceramic specimens were washed with distilled water, and were dried in an electric furnace at 378 K for over 24 h before MB dye adsorption test.
(2)
MB dye powder (molecular formula: C16H18N3SCl, Fujifilm Wako Pure Chemical Corporation, Osaka, Japan) was dissolved in distilled water to produce an MB solution with a concentration of 1 × 10⁻⁴ mol/L (32 ppm).
(3)
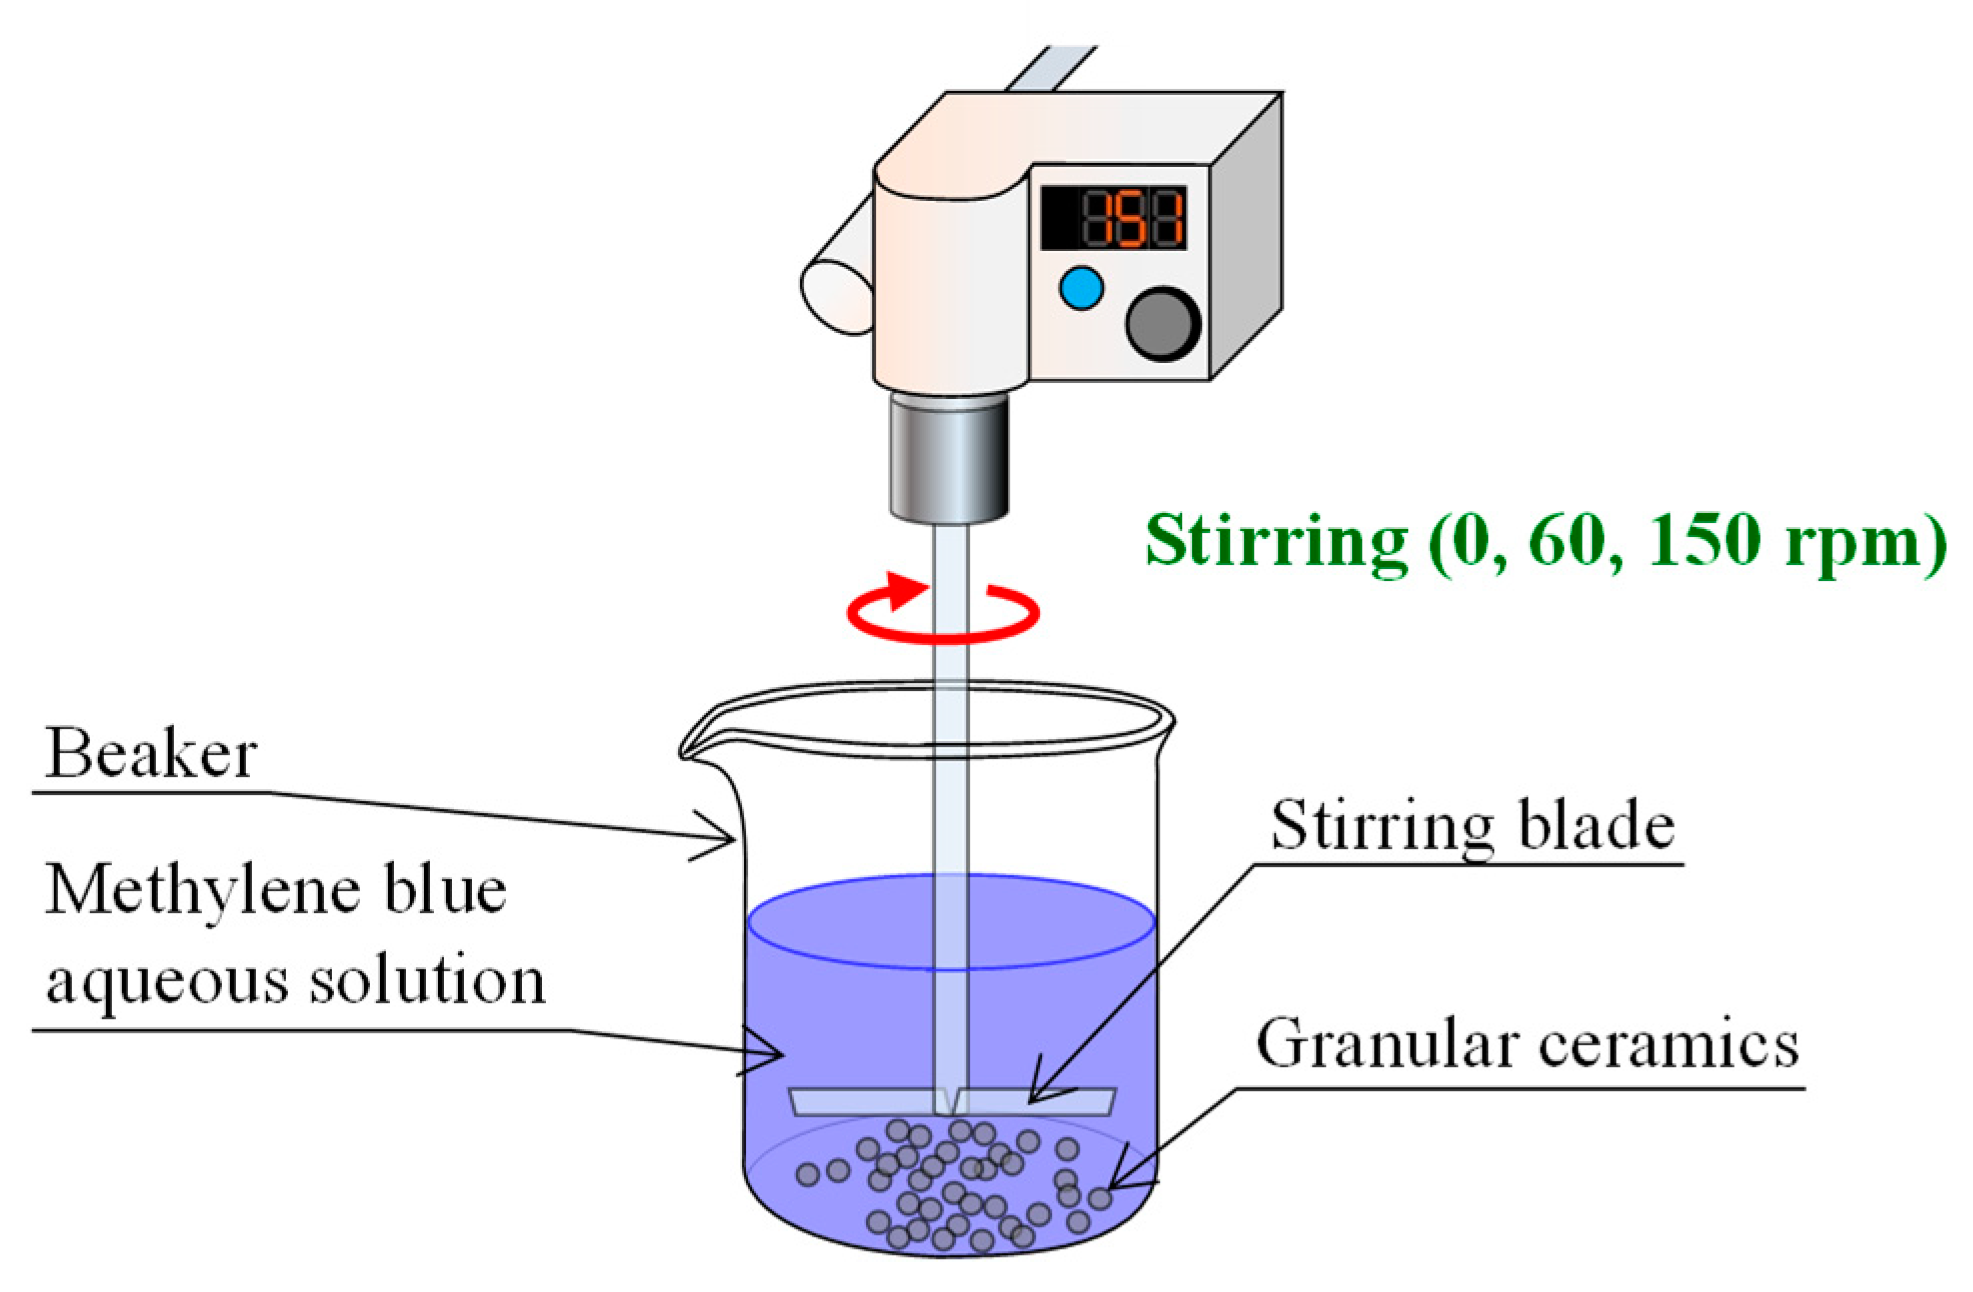
A 1-g portion of the granular ceramic specimen was placed into a beaker containing 50 mL of MB solution and the MB solution was stirred with a stirring device (EYLA ZZ-1010, Tokyo Rikakikai Co., Ltd., Tokyo, Japan) at speeds of 0, 60, and 150 rpm.
(4)
The MB dye concentration and pH value in the aqueous solution were measured after 1, 10, 30, 60, and 120 min.
During MB dye concentration measurements in the aqueous solution, we first analyzed the absorbance of the MB solution with a drainage analyzer (NDR-2000, Nippon Denshoku Industries Co., Ltd., Tokyo, Japan). Then, the MB dye concentration was calculated from a calibration curve, which expresses the relationship between the absorbance and MB dye concentration of the aqueous solution. The pH of the MB solutions was measured with a pH meter (HM-25R, DKK-TOA Corporation, Tokyo, Japan).

3. Results and Discussion

3.1. Preliminary Experiments

In this study, granular ceramics were used as adsorbents to remove the MB dyes. We considered that ceramics with smaller particle sizes have an increased MB dye adsorption ability due to a larger ceramic surface area [13]. However, when we excessively reduced the particle size of the ceramic, the ceramic particles themselves increased the turbidity of the aqueous solution due to fine ceramic particle floatation in the aqueous solution. Such fine particles floating in the aqueous solution require an additional step for removal. Hence, we limited the minimum ceramic particle size. We first examined the relationship between ceramic particle size and water turbidity by performing a preliminary experiment and determined the appropriate GFRP/clay ceramic particle size.
Figure 6 shows the turbidity and pH of the aqueous solution after 1 and 60 min when 50 mL of distilled water, which contained 1 g of ceramics with particle sizes of 0.1–0.3 and 0.3–0.5 mm, was stirred in at 150 rpm. Here, Kaolin was used for calibrating the turbidity of the aqueous solution, and the turbidity was measured with a drainage analyzer based on the Testing Methods for Industrial Water of Japanese Industrial Standard JIS K0101: 1998.
The turbidity of the water, in which the clay ceramic without glass fibers and the 20% GFRP/clay ceramic fired oxidatively or reductively were soaked, was higher than others. Comparing water turbidity, in which GFRP/clay ceramics were soaked, the turbidity decreased with an increasing GFRP mixing ratio. These results indicate that the clay ceramic component increased the turbidity of water. Clay is hydrophilic, whereas glass fibers and carbide are hydrophobic. The hydrophilic nature of the substances contained in water markedly affects its turbidity.
When using ceramics with particle sizes in the range of 0.1–0.3 mm, all ceramic types formed turbid mixtures, and for particles in the range of 0.3–0.5 mm, certain ceramic types caused turbidity. Ceramics with particles of 0.5 mm or larger did not cause turbidity in the water (turbidity data not shown). Based on the above results, granular ceramics with a particle size of 0.5–1.0 mm or larger were used for the MB dye adsorption tests.
The pH value of water, in which the clay ceramics without glass fibers were soaked, was weakly acidic, and that of water, in which oxidatively fired GFRP/clay ceramic was soaked, was alkali. The alkalinity of the water raised as the GFRP mixing ratio was increased. We attribute the alkalinity of the water to the dissolution of the calcium component in the glass fibers into the water, which decreased the concentration of hydrogen ions. The pH of the water, in which reductively fired GFRP/clay ceramic was soaked, was weakly alkali. The alkalinity of the water was slightly lower than that of the oxidatively fired GFRP/clay ceramic.

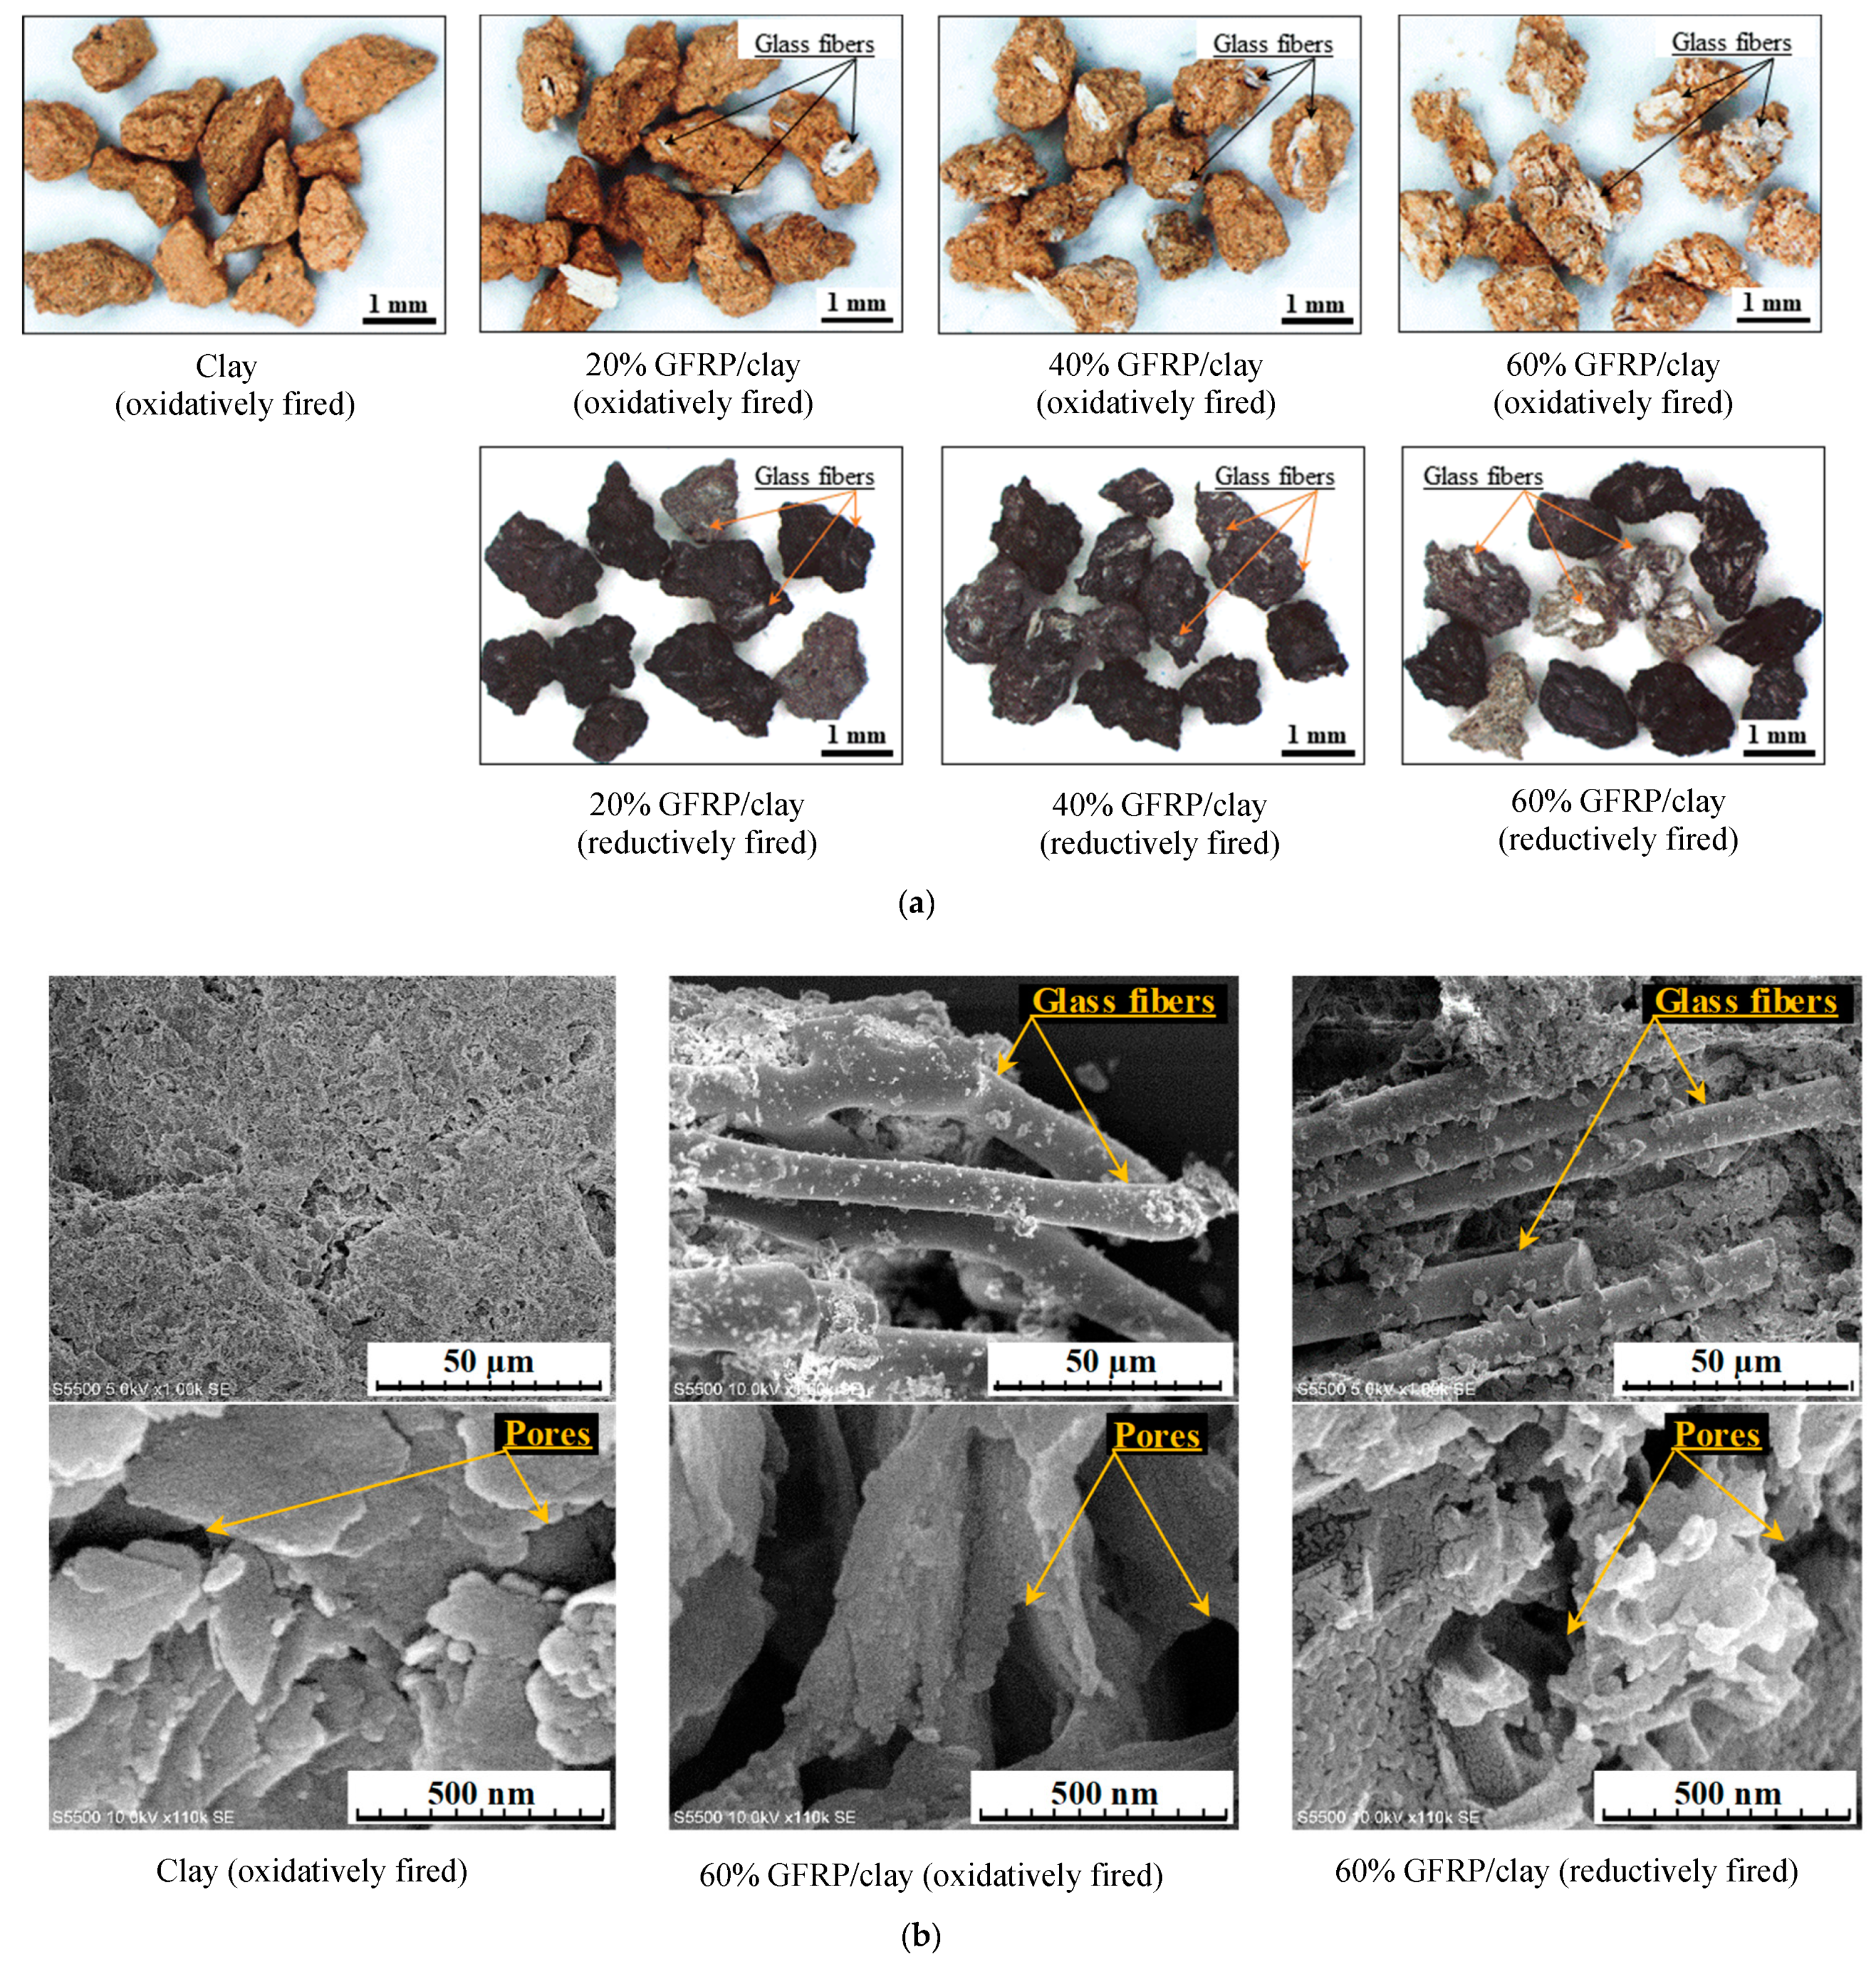
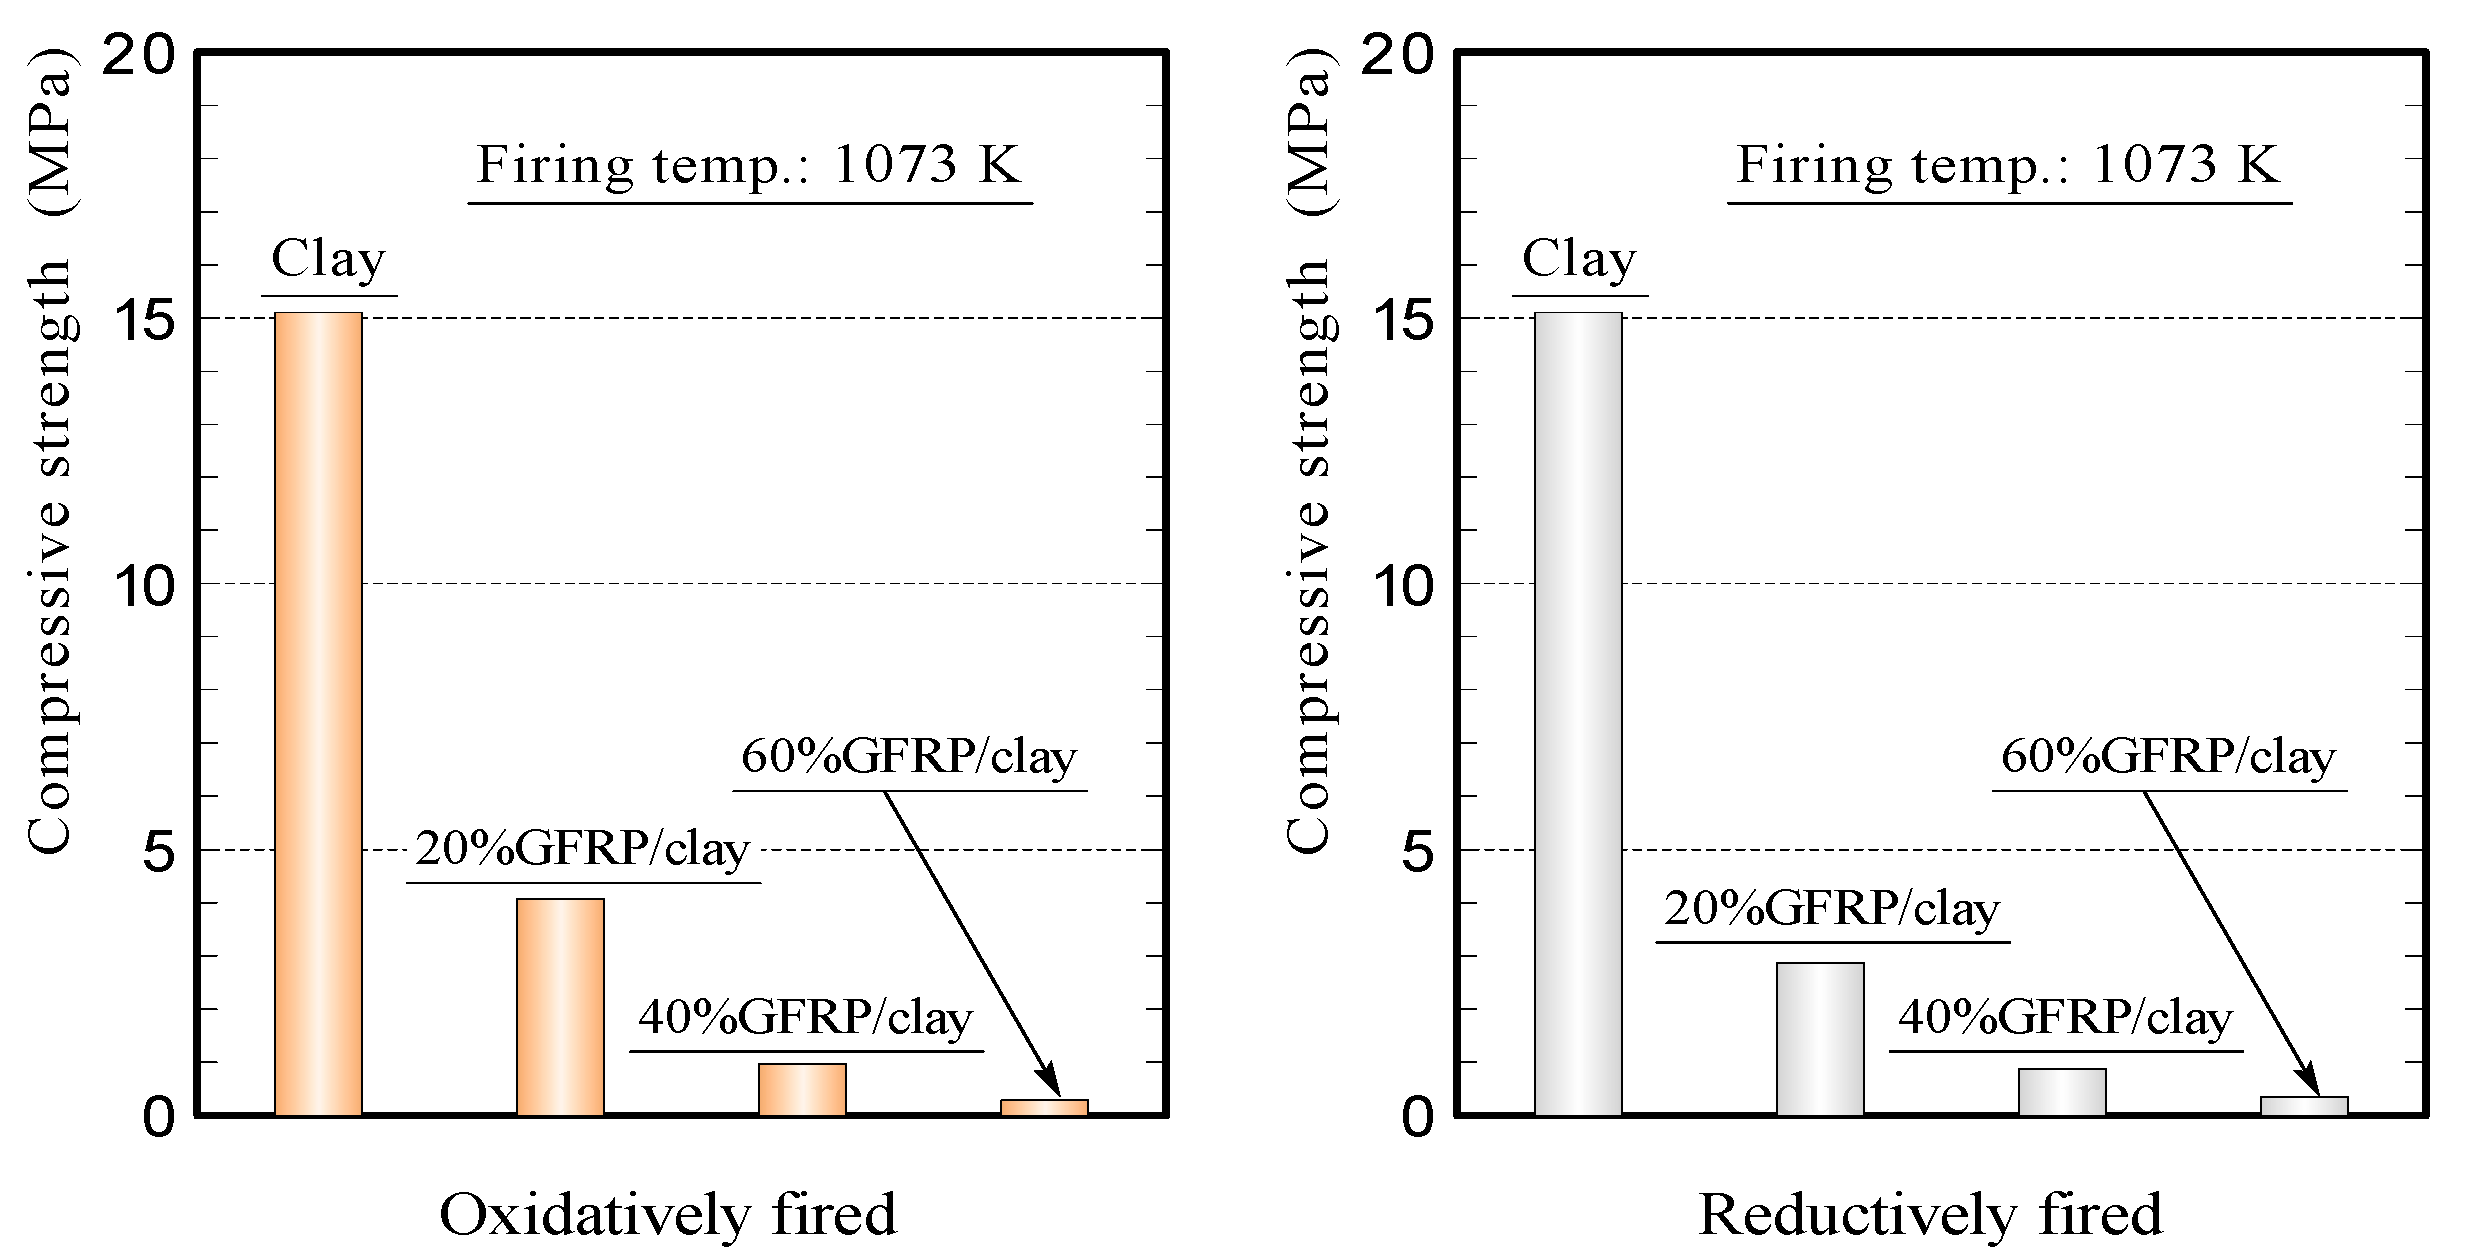
3.2. Apparent Porosities, Specific Surface Areas, and Carbide Contents of the GFRP/Clay Ceramic Specimens

Table 4 lists the apparent porosities, specific surface areas, and carbon contents of the GFRP/clay ceramics. Here, as mentioned earlier, for the apparent porosities of the ceramics, the values which were measured by using a mercury intrusion technique are listed, and for the specific surface areas, the values which were measured by using a gas adsorption method are listed.
The clay ceramic had a porosity of approximately 32%, whereas the GFRP/clay ceramics had porosities in the range of 38–66%. The porosities of the GFRP/clay ceramics increased nearly linearly with an increasing GFRP mixing ratio [7]. We attribute this result to increases in the amount of resin as the GFRP mixing ratio was increased. The resin component decomposes during firing to create voids in the ceramic structure. Thus, ceramics with a high porosity were produced by mixing GFRP with clay. When plastic particles without glass fibers were mixed with clay, the production of ceramics with identical high porosity as the GFRP/clay ceramics was difficult. The strength of the ceramic without glass fibers markedly decreased as the amount of resin increased because its structure is not reinforced by glass fiber [7], as previously mentioned.
Figure 7 shows the pore size distributions of the GFRP/clay ceramics. Here, in the two figures on each ceramic, the pore size distribution, which is shown in the figure on the left, was measured by using a gas adsorption method, and that in the figure on the right was measured by using a mercury intrusion technique. For the oxidatively fired GFRP/clay ceramics, the nano-sized pores in the structure decreased as the GFRP mixing ratio was increased, and 60% GFRP/clay ceramic had few of them. We presume that the clay and glass fibers or regions between glass fibers sintered, so that nano-sized pores disappeared. The specific surface areas of the ceramics also decreased as the GFRP mixing ratio was increased, as shown in Table 4.
While the reductively fired GFRP/clay ceramics had nano-sized pores, and the specific surface areas were comparable to that of clay ceramic. Therefore, it is considered that the structure having a large number of nano-sized pores possessed a high specific surface area, and the plastic carbide residue in the ceramic structure contributed to the increase in the specific surface area.
We confirmed that the reductively fired GFRP/clay ceramics contained approximately 1% carbide, which was greater than that for the ceramics fired oxidatively. The carbide content increased as the GFRP mixing ratio was increased.

3.3. MB Dye Adsorption Ability of the GFRP/Clay Ceramics
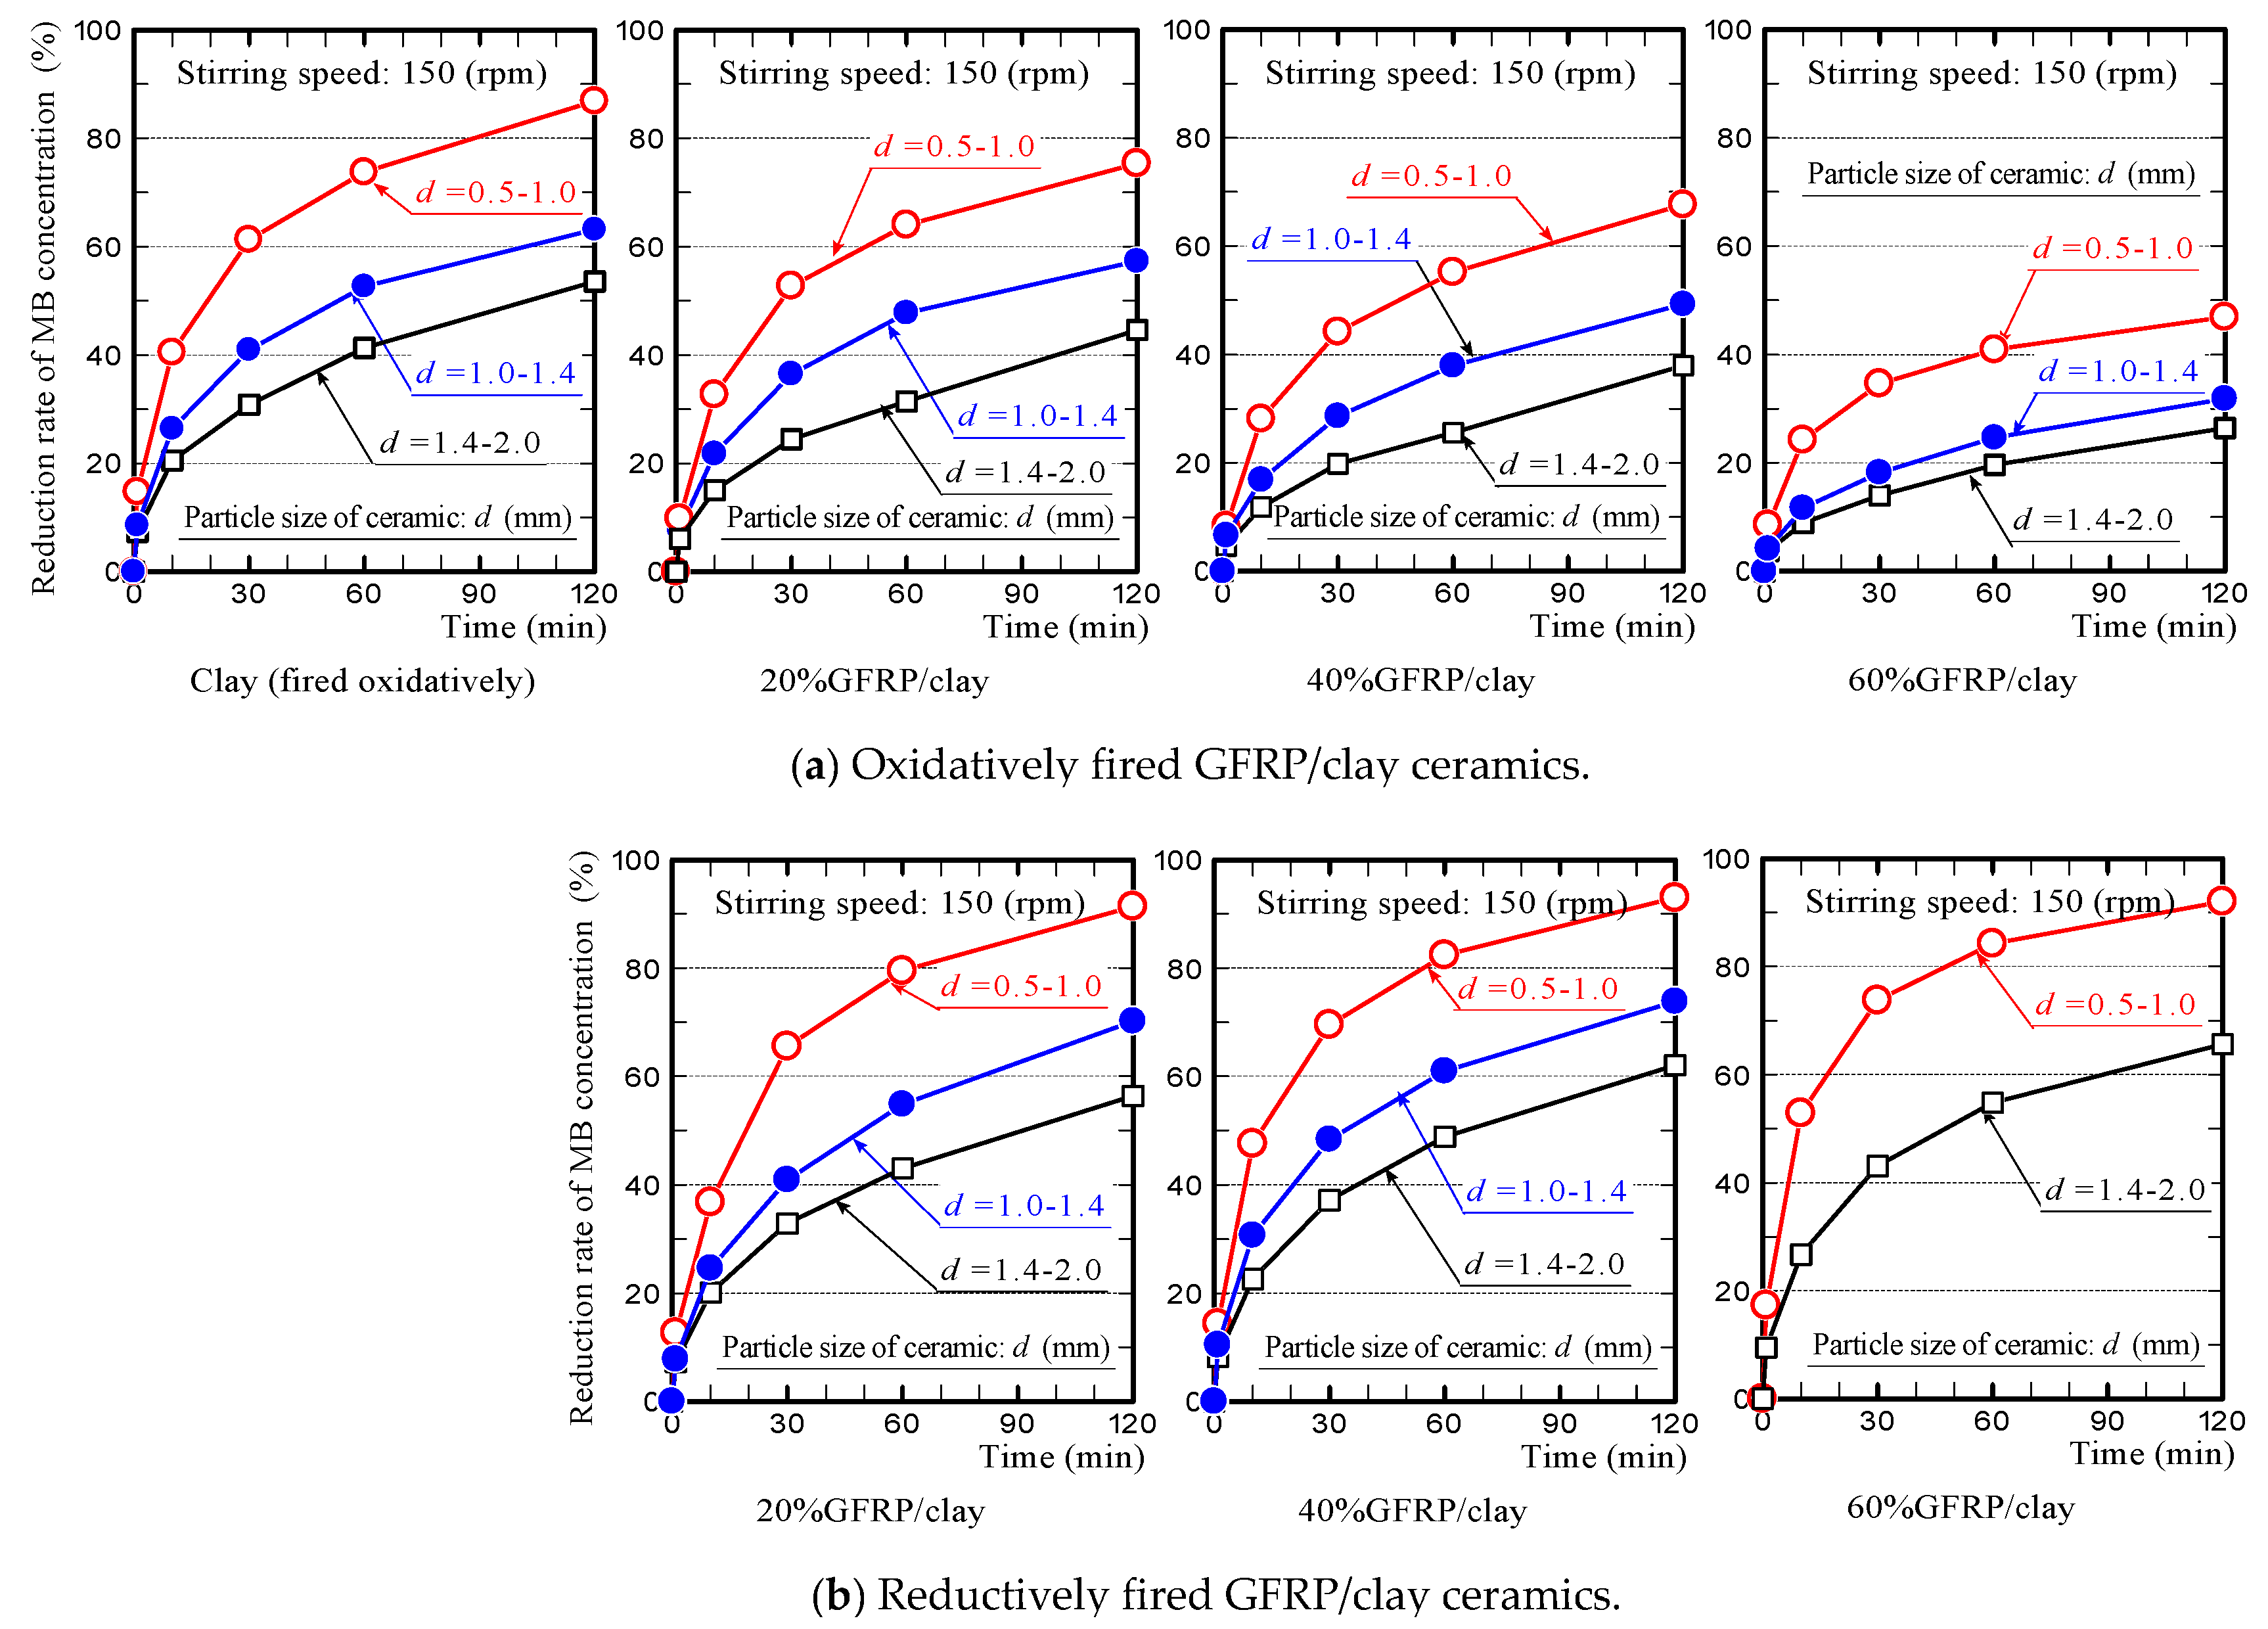
Figure 8 shows the reduction rate in the MB dye concentration for each granular ceramic specimen. The reduction rate for the MB dye concentration increased as the MB solution stirring speed increased for all ceramic types. These results confirmed that the agitation of the MB solution increased the ceramic’s ability to adsorb MB. Kamemoto et al. [16] have reported on the adsorption phenomena of activated carbon and liquid-phase phenol, indicating that phenol adsorption initially occurs mainly on the outer surface of an activated carbon body, followed by the inside of the body over longer periods of time. Furthermore, they reported that the film coefficient of material transfer between the activated carbon body and liquid-phase phenol, at an early stage, is proportional to the stirring speed of the liquid. Similarly, based on the adsorption phenomena of the activated carbon and liquid-phase phenol, we suggest that agitation of the MB solution accelerates MB dye movement to the outer surface and inside of the ceramic body, which promotes MB dye adsorption to the ceramic.
By comparing the rate of the decrease in the MB concentration for each ceramic, the reductively fired 60% GFRP/clay ceramic possessed the highest MB dye adsorption ability and that of the oxidatively fired 60% GFRP/clay ceramic was the lowest. The rate of decrease in the MB concentration for the reductively fired GFRP/clay ceramics slightly increased with an increase in the GFRP mixing ratio.
Furthermore, to investigate the influence that glass fibers have on the MB dye adsorption ability for the GFRP/clay ceramics, we performed MB dye adsorption testing of the glass fiber, which was prepared by heating 40% GF/GFRP pellets in an oxidizing atmosphere at 673 K.
Figure 9 shows a microscope image of the glass fibers and the temporal change in MB solution absorbance. Here, the absorbance value of the MB solution was 2.3, which corresponds to an MB dye concentration of 1 × 10⁻⁴ mol/L. The increase in absorbance of the MB solution indicates an increase in the turbidity of the solution.
This result indicates that the MB dye was not adsorbed by glass fibers because the absorbance of the MB solution did not decrease over time. Hence, the components that adsorbed the MB dye were the clay and carbide in the GFRP/clay ceramic. Furthermore, we assume that carbide adsorbed a larger amount of MB dye than the clay because the MB concentration reduction rate for the reductively fired ceramics was higher than that of the clay ceramic.
Based on the above experimental results, we can summarize the MB dye adsorption characteristics of the ceramics as follows.
(1)
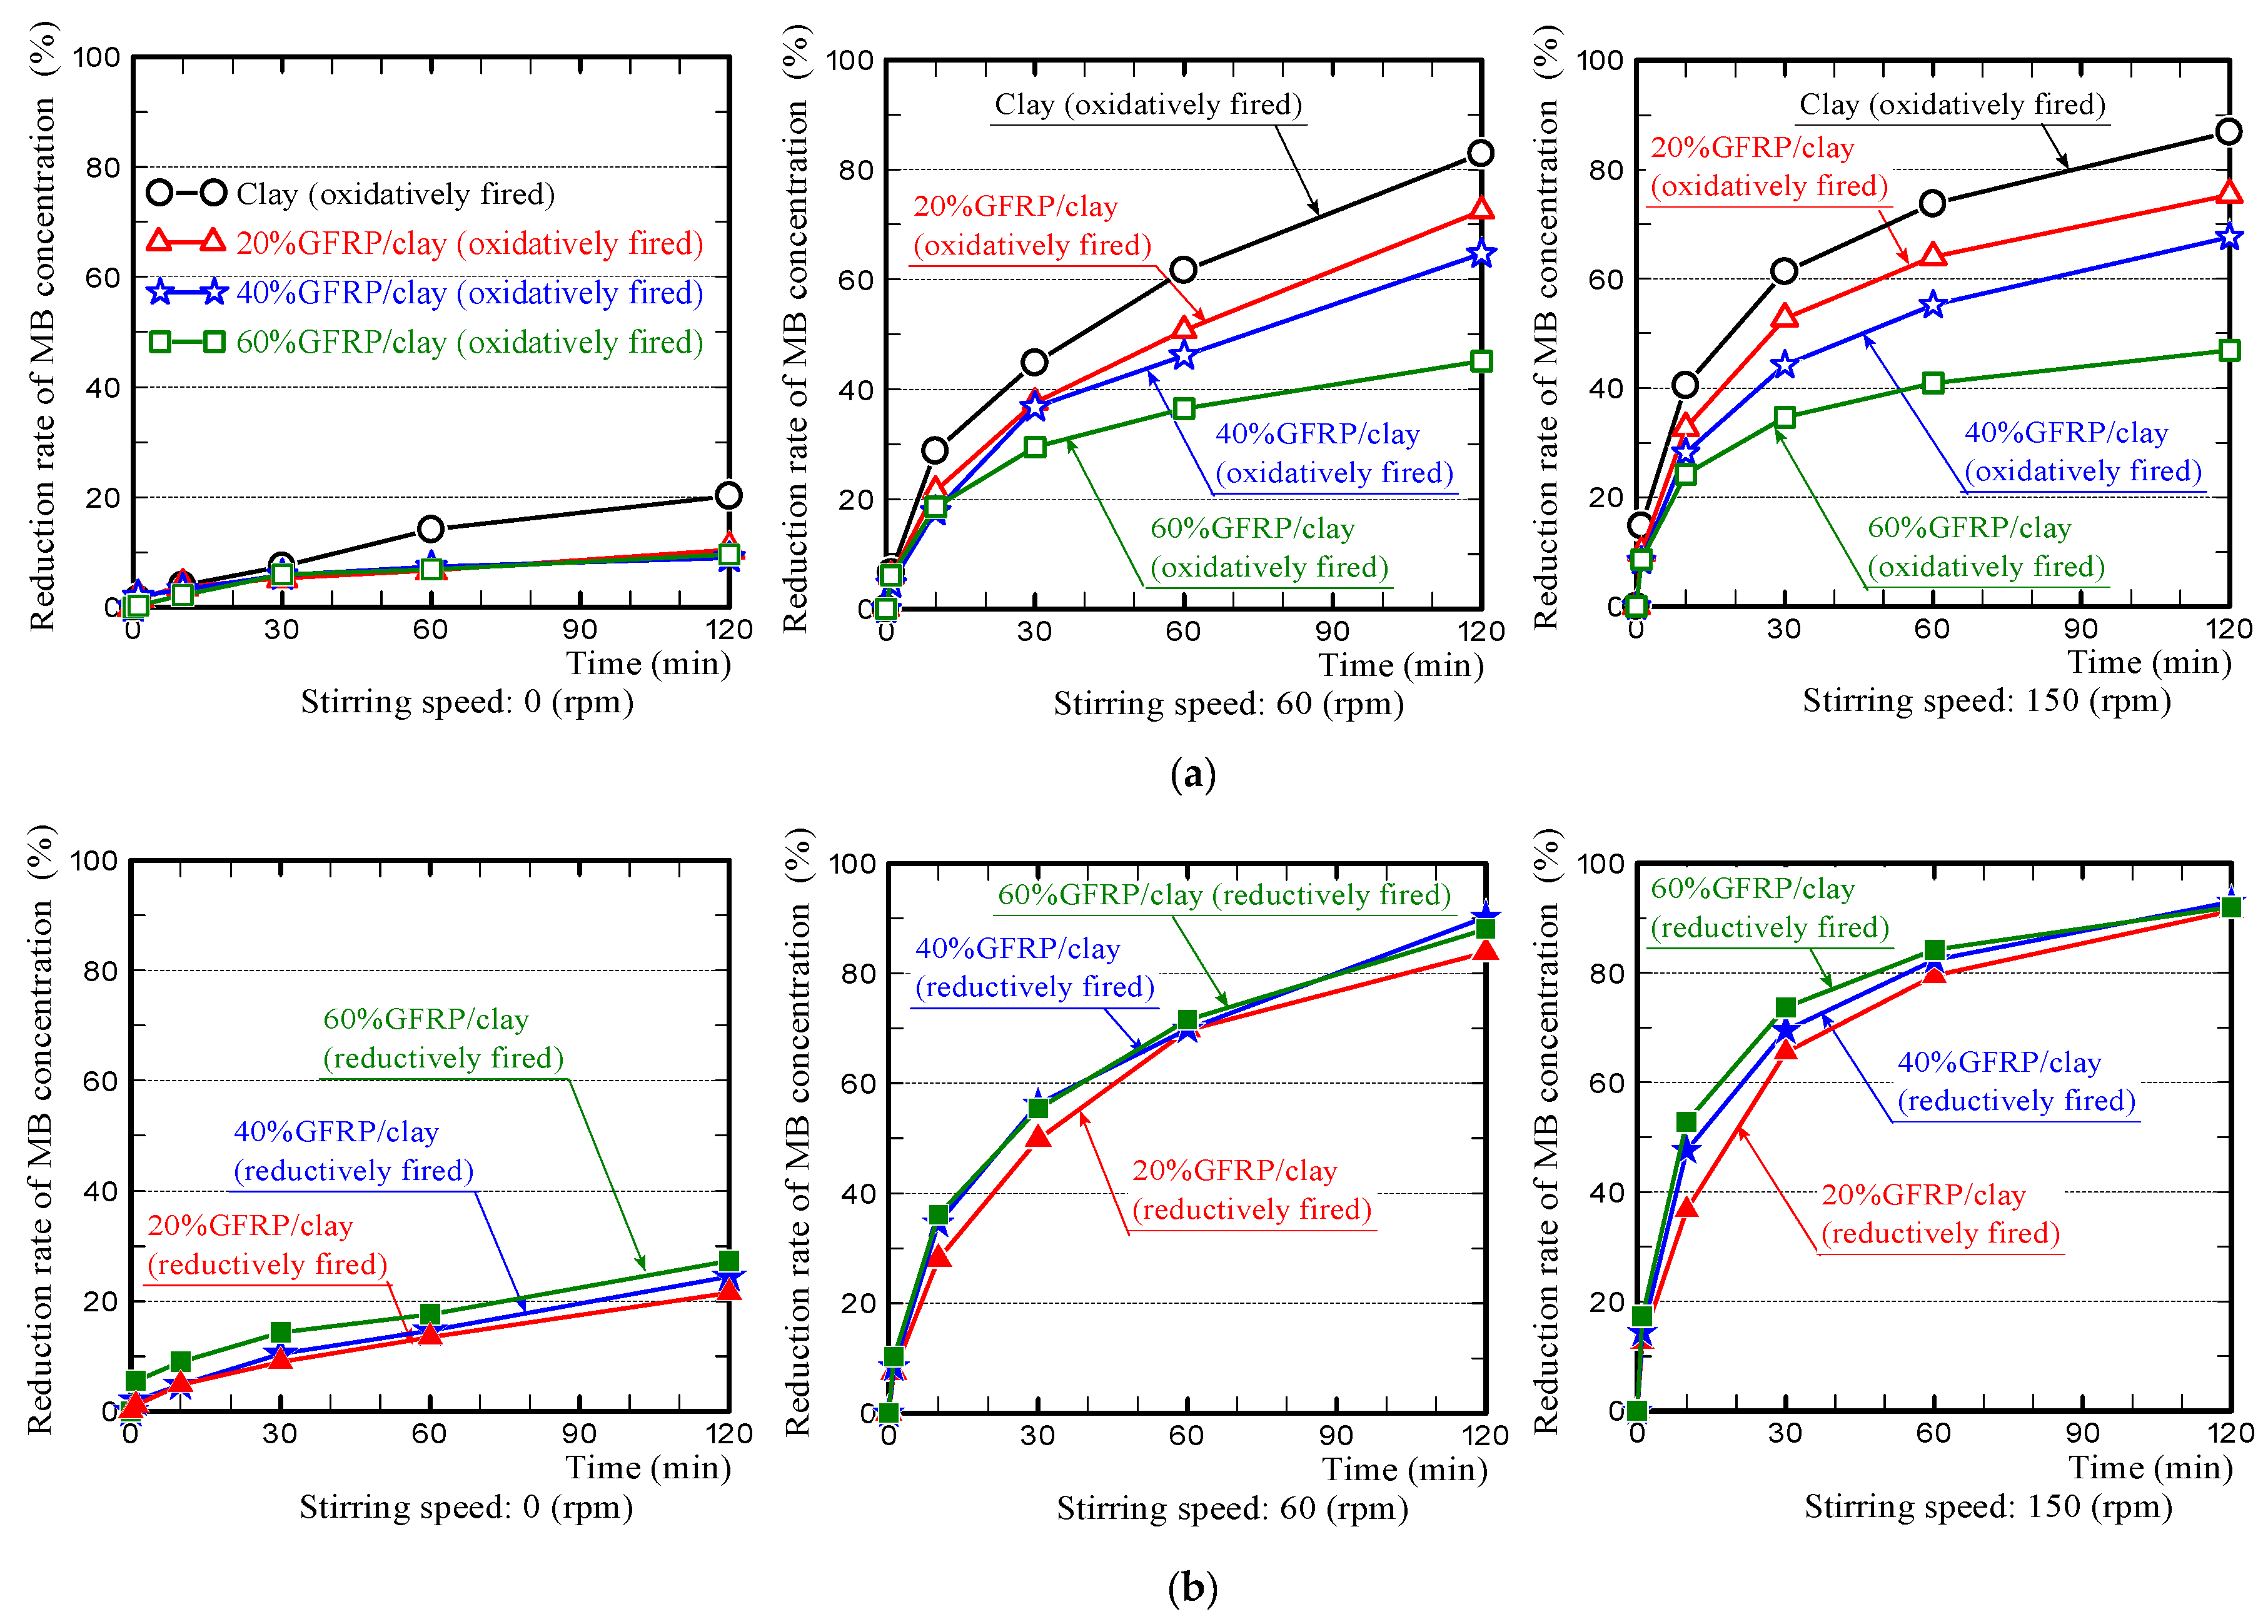
The MB dye adsorption ability of the oxidatively fired 60% GFRP/clay ceramic was the lowest due to it having the largest glass fiber content, which had no ability to adsorb MB dye. In addition, this ceramic possessed the smallest specific surface area, as shown in Table 3.
(2)
In contrast, the MB dye adsorption ability of the reductively fired 60% GFRP/clay ceramic was the highest. We attribute this result to the ceramic because it contains a larger carbide proportion, a comparatively high specific surface area, and high porosity; however, this ceramic also contained the joint-largest glass fiber content.
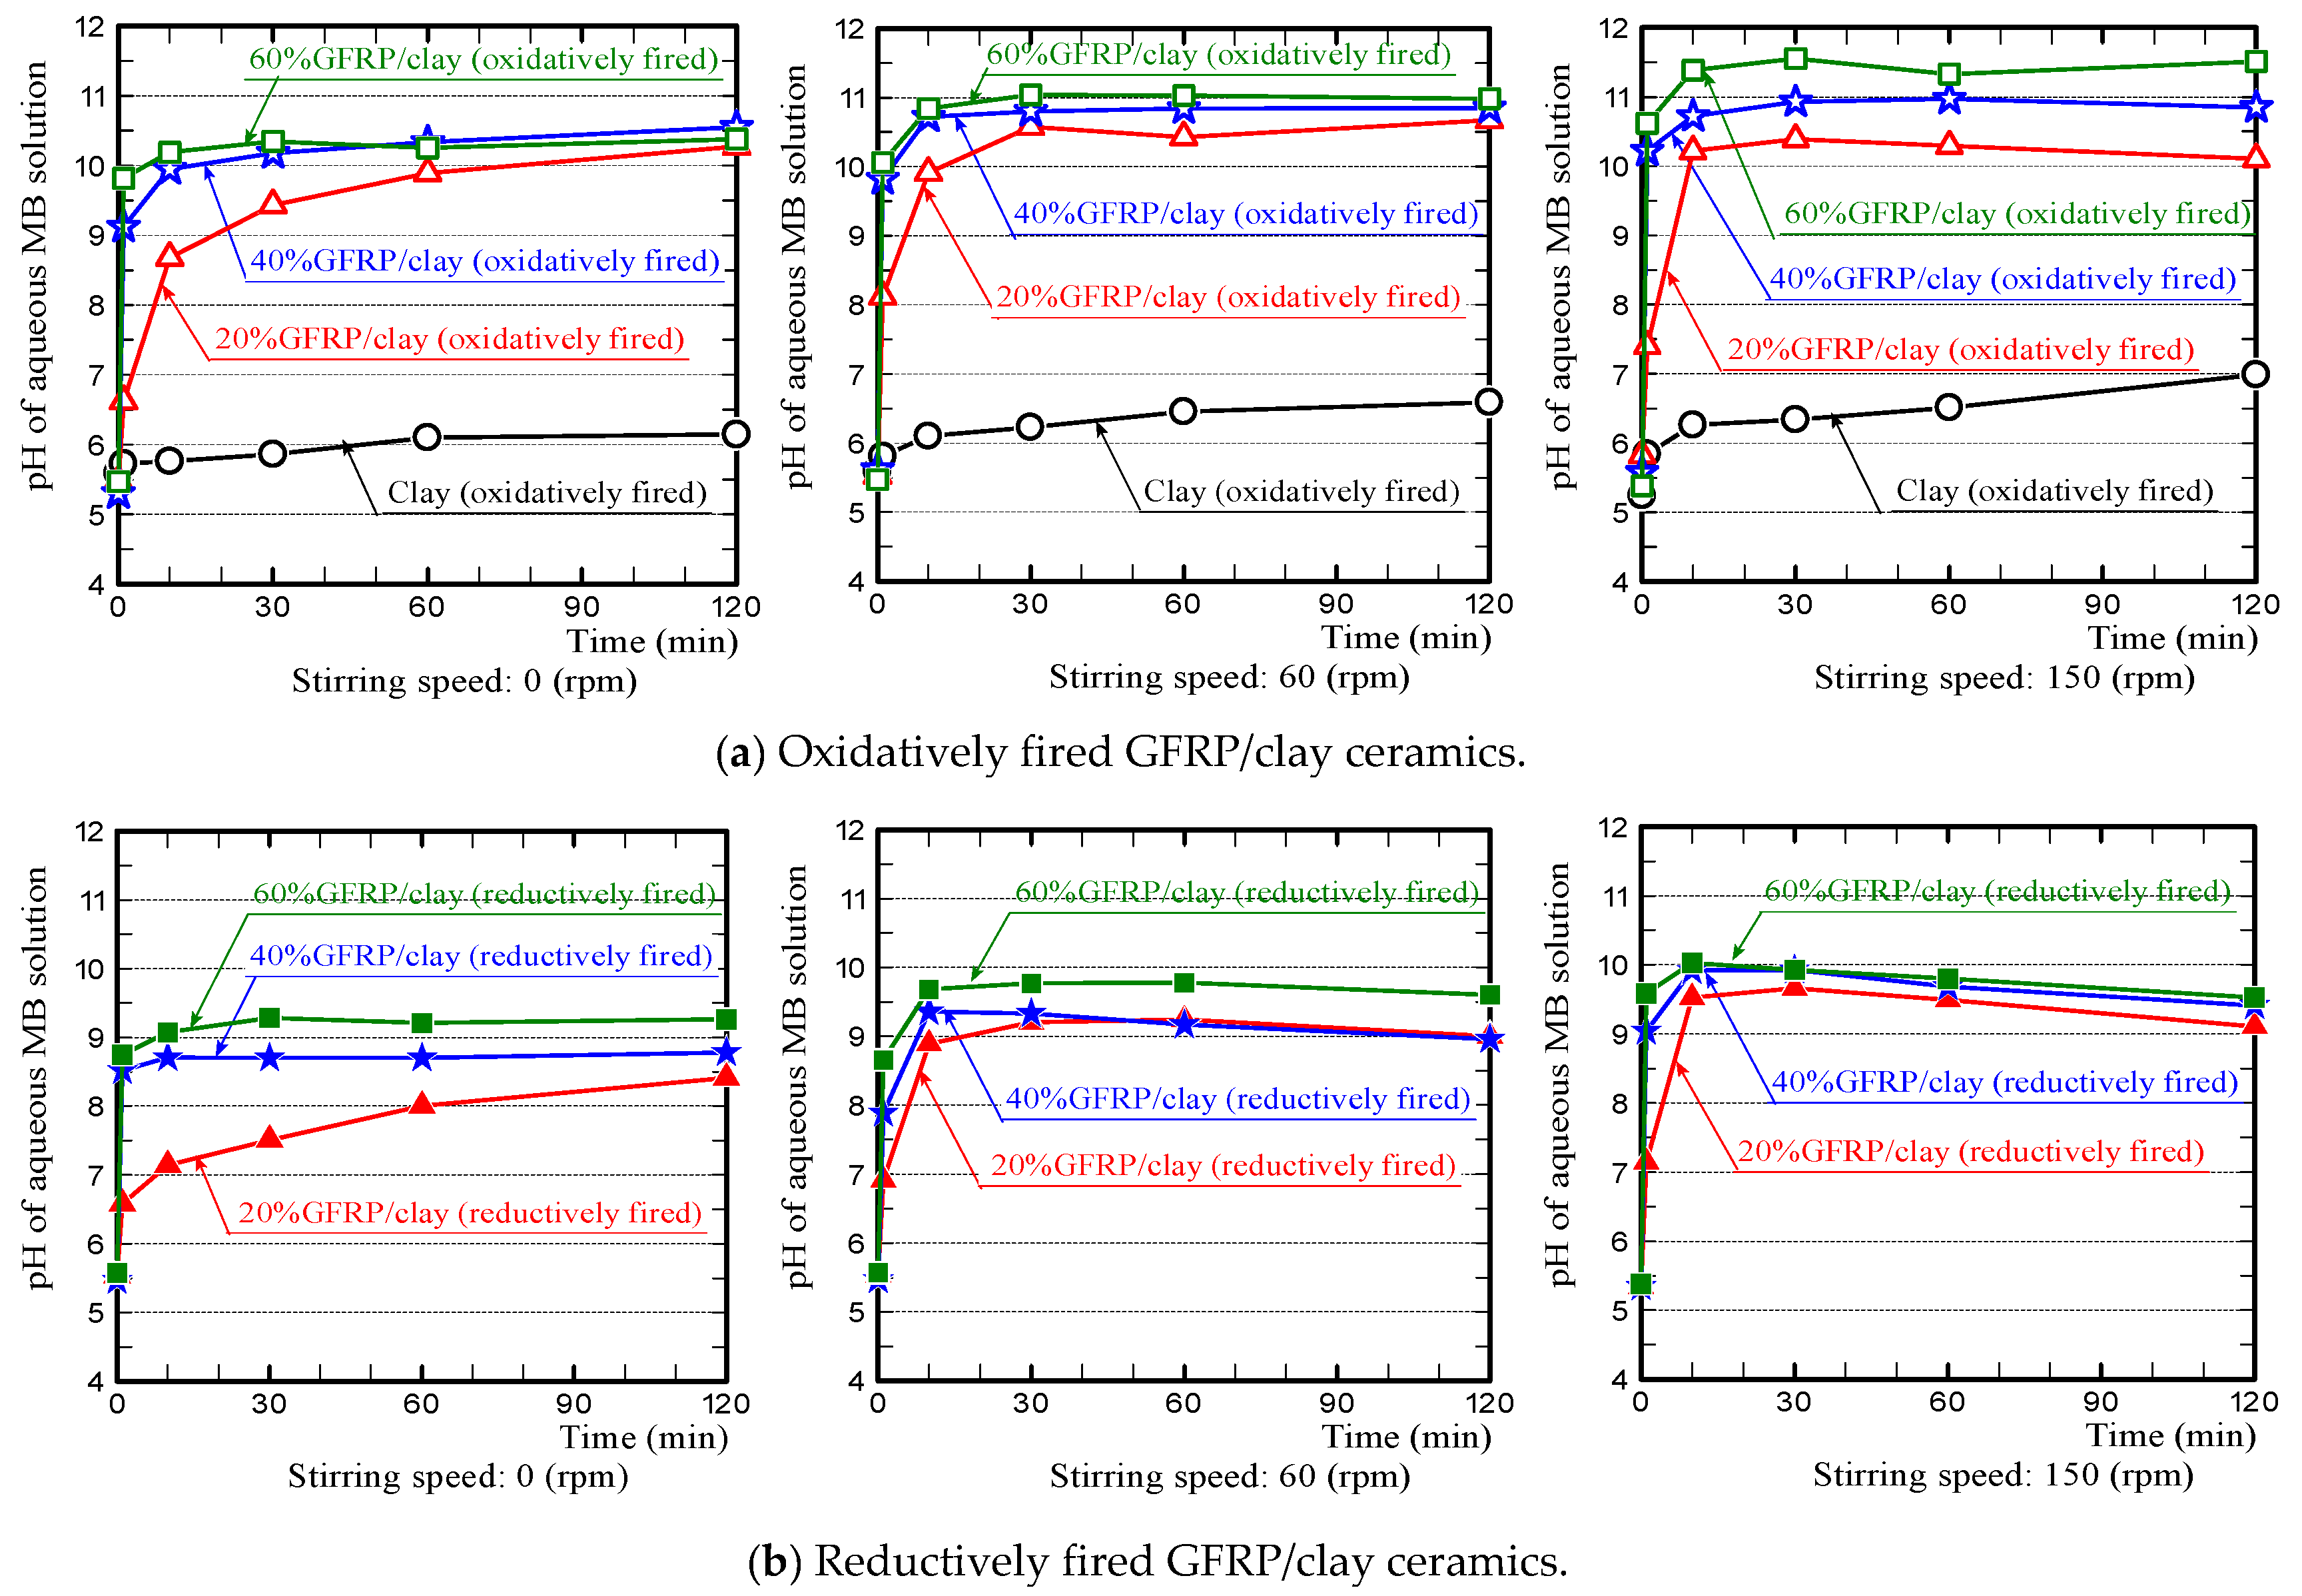
We suggest that the high specific surface area of the ceramic promoted the physical adsorption of the MB dye via Van der Waals forces. The high porosity facilitated MB dye movement into the ceramic body. The clay component adsorbed MB dye via both cation exchange and physical adsorption through Van der Waals forces [12]. For the carbide component, physical adsorption is likely the main adsorption mechanism [15].
Figure 10 shows the change in the pH value of a MB solution where each ceramic specimen was soaked. For all ceramic types, the pH values increased as the MB solution stirring speed was increased. The pH value of the MB solution, in which the oxidatively fired GFRP/clay ceramic was soaked, increased as the GFRP mixing ratio was increased, and that of 60% GFRP/clay ceramic was the highest. The pH value of the MB solution, in which reductively fired GFRP/clay ceramic was soaked, was lower than that of the oxidatively fired GFRP/clay ceramic. The pH value of the MB solution, in which the clay ceramic without glass fibers was soaked, was the lowest. Furthermore, we noted the following differences in pH changes for the MB solution.
For the MB solution, in which the oxidatively fired GFRP/clay ceramic was soaked, the pH increased sharply from the start of the test and then became nearly constant. For the MB solution, in which the reductively fired GFRP/clay ceramic was soaked, the pH value increased sharply in an identical fashion; however, the pH had a tendency to decrease gradually over time after the initial sharp rise. In contrast, the pH of the MB solution, in which the clay ceramic without glass fibers was soaked, increased gradually over time and eventually became nearly neutral. We interpret these results as follows.
(1)
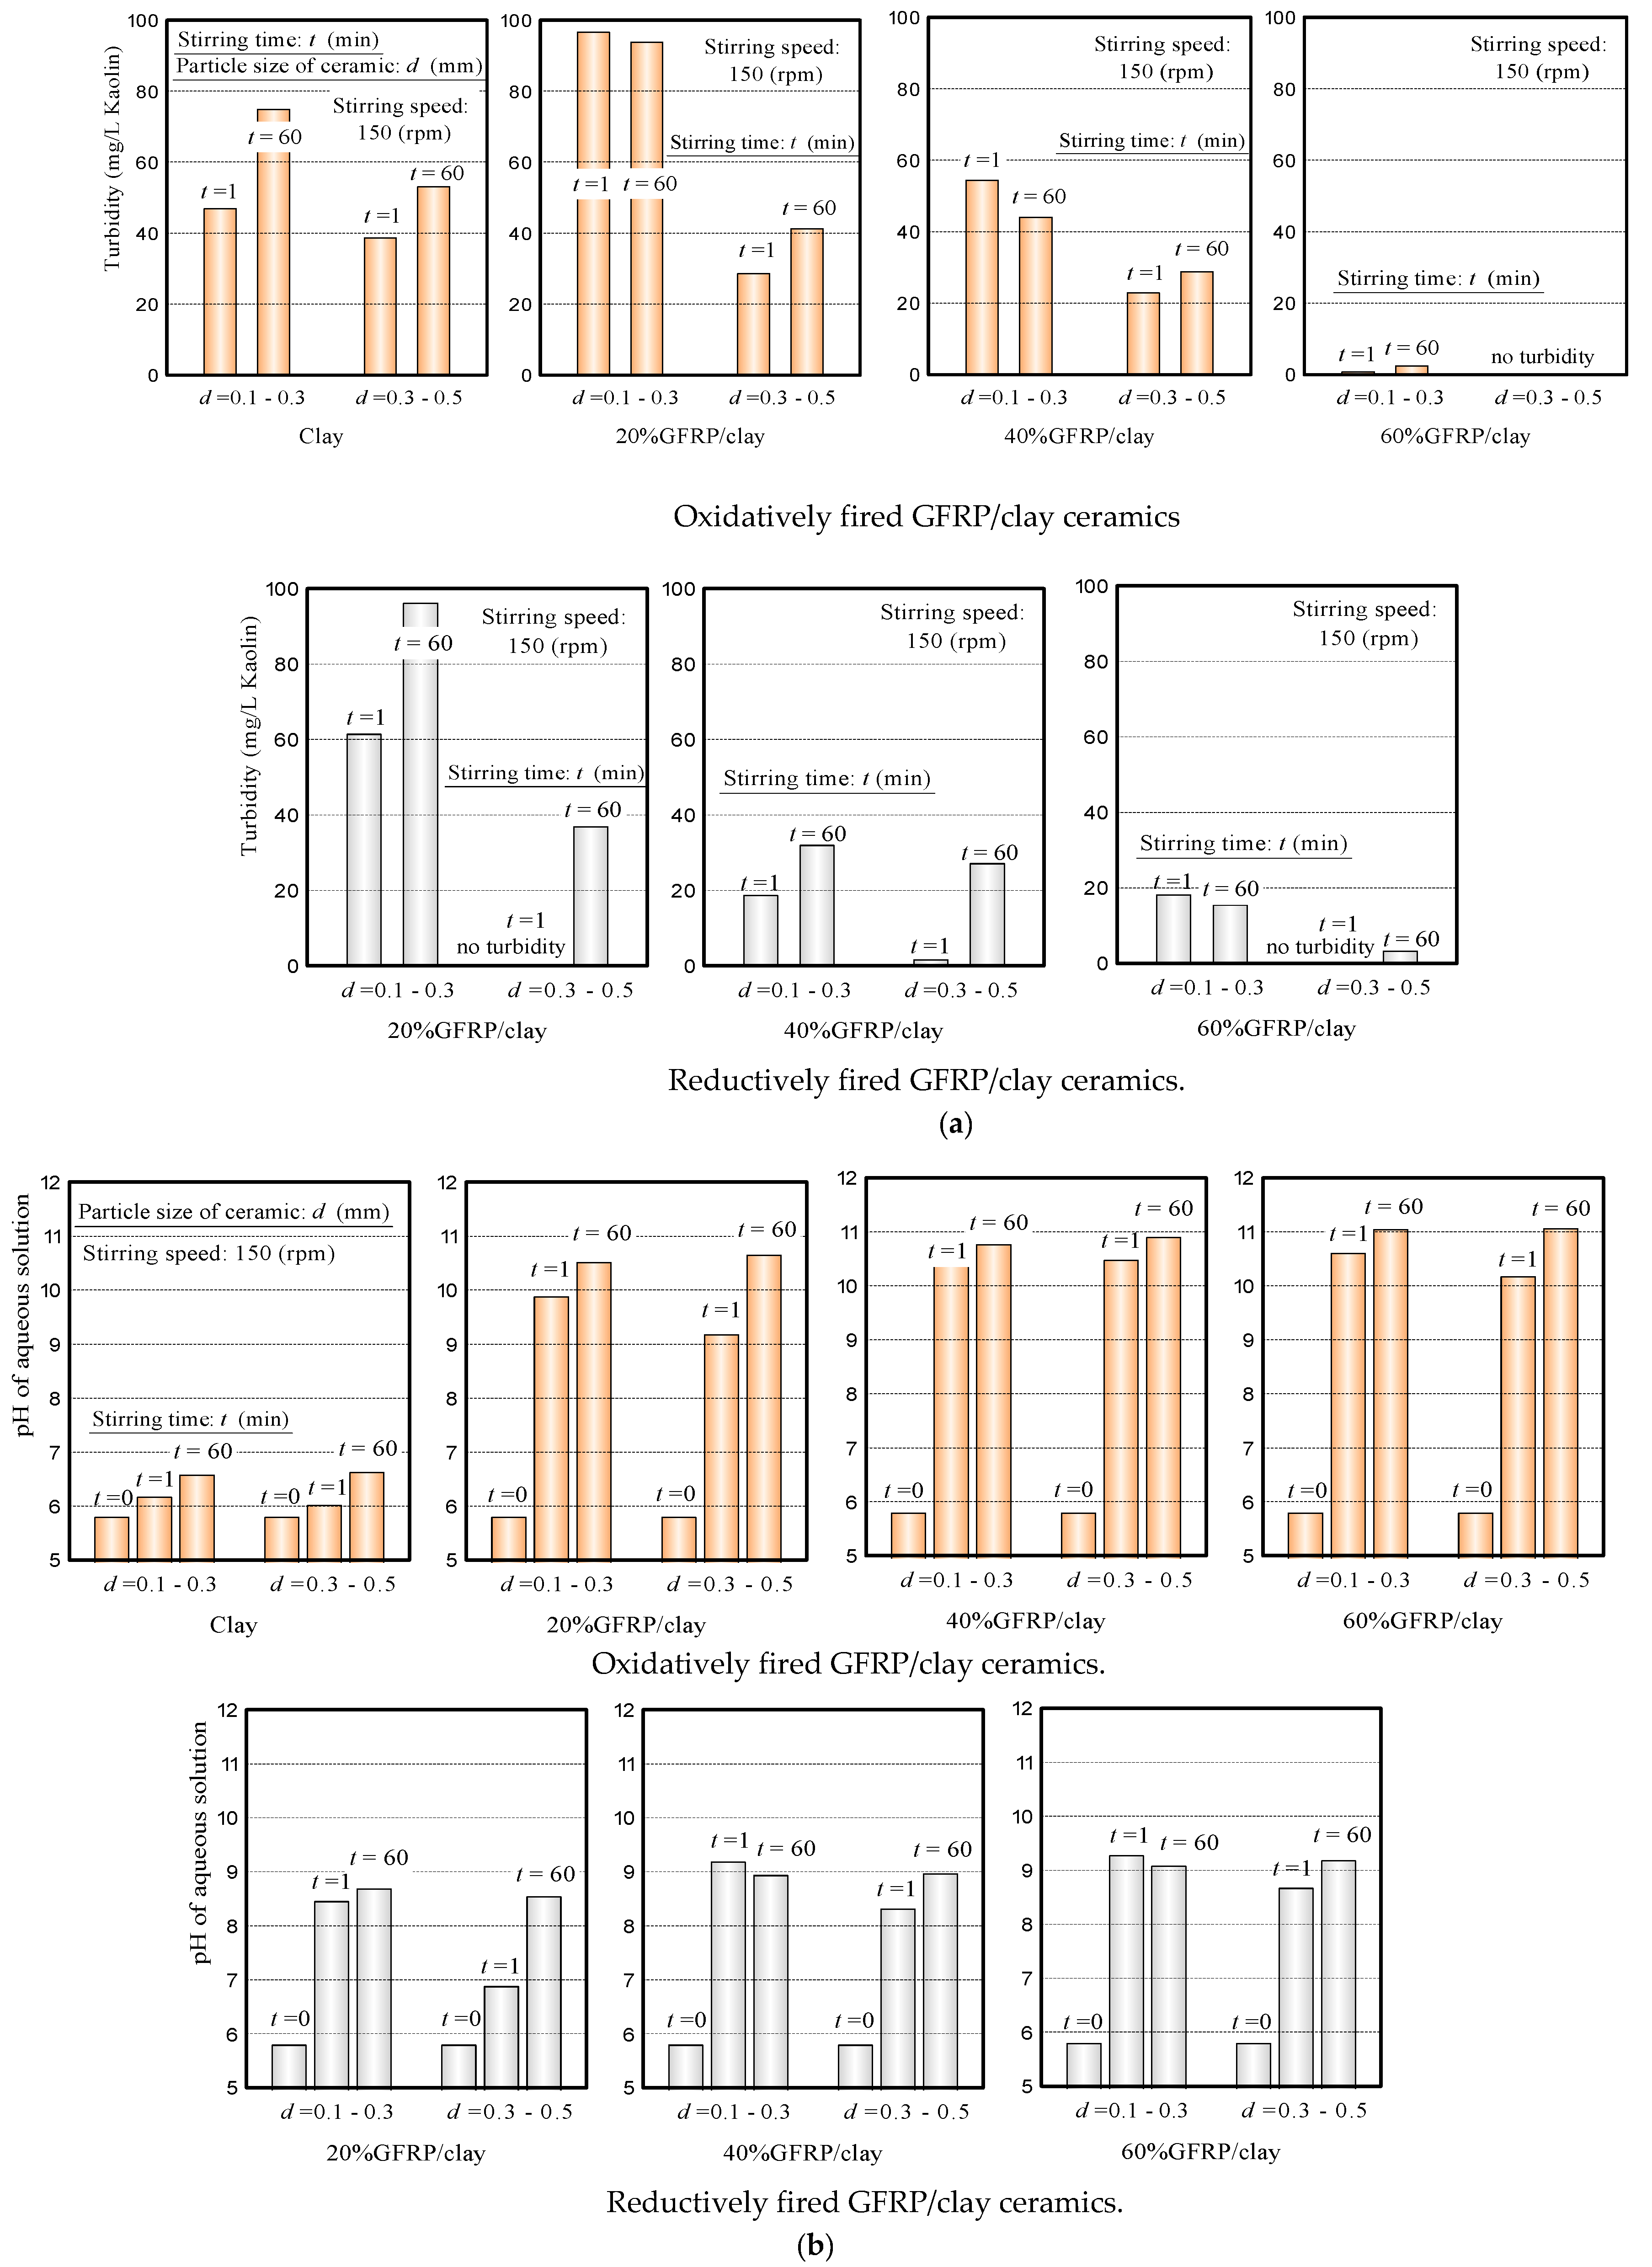
The pH value of the MB solution, in which the GFRP/clay ceramic was soaked, initially increased sharply because the glass fibers in the ceramic structure released calcium ions. This phenomenon is similar to the results of our preliminary experiments (see Figure 6b in Section 3.1).
(2)
For the phenomenon where the pH value of the MB solution, in which the reductively fired GFRP/clay ceramic was soaked, decreased gradually after an initial sharp rise. We assume the following: The color of MB solution turns from blue to colorless when the cations of MB dye in the aqueous solution are reduced. Therefore, MB dye cations were reduced by adsorption to the plastic carbide in the ceramic, such that there was a decrease in the hydroxide ion concentration in the aqueous solution.
(3)
The pH value of the MB solution, in which the clay ceramic without glass fibers was soaked, increased gradually over time and eventually changed from weakly acidic to nearly neutral. Since the MB dye cations exchanged with other cations in the aqueous solution, this gradually neutralized the aqueous solution.

3.4. Influence of Particle Size on the MB Dye Adsorption Ability of GFRP/Clay Ceramic

Figure 11 shows the relationship between the ceramic specimen particle size and the rate of decrease in the MB dye concentration when the aqueous solution was stirred at a speed of 150 rpm. Here, in the graph for the reductively fired 60% GFRP/clay ceramic, the rate of decrease in the MB concentration for a specimen with a particle size of 1.0–1.4 mm is not shown because it was difficult to prepare samples with this particle size.
For all ceramic types, the rate of decrease in the MB dye concentration decreased significantly with an increase in particle sample size. Therefore, to effectively remove the MB dye from the aqueous solution, we suggest that it is desirable to reduce the ceramic particle size as much as possible so that the ceramic itself does not cause turbidity in the aqueous solution.

4. Conclusions

To effectively use waste GFRP and purify dye effluent, we investigated the possibility of using GFRP/clay ceramics as a dye adsorbent. We examined MB dye adsorption based on several types of GFRP/clay ceramics, which were made by adjusting the mixing ratio of clay and crushed GFRP, as well as the firing atmosphere. The GFRP/clay ceramics reductively fired at 1073 K possessed a higher MB dye adsorption ability than that of the clay ceramic. The MB dye absorptivity of the reductively fired ceramics increased with an increasing GFRP mixing ratio. These ceramics contained plastic carbide, which has excellent dye absorbability. Together with particles having a comparatively high specific surface area and porosity, we obtained high adsorption performance. We expect that the reductively fired GFRP/clay ceramics could be used as adsorbent materials to remove dye from wastewater.

5. Patents

Kinoshita H, Kaizu K., Ikeda K., (2013) Manufacturing method of porous ceramics using waste glass fiber reinforced plastic, Japanese Patent No. 5167520 (in Japanese).

Author Contributions

K.Y. devised the experimental method and analyzed the experimental result data. K.S. and N.I. performed the experiments. H.K. interpreted the results and wrote the paper.

Funding

This work was founded by the Japan Society for the Promotion of Science (JSPS) KAKENHI [16K00614].

Acknowledgments

The authors would like to thank Enago for the English language review.

Conflicts of Interest

The authors declare no conflict of interest.

References

  1. Nagaoka, T. Value-Added Recycling of Disposal Plastics. J. Jpn. Soc. Technol. Plast. 2008, 49, 175–179. [Google Scholar] [CrossRef]
  2. Yang, Y.; Boom, R.; Irion, B.; Heerden, D.; Kuiper, P.; Wit, H. Recycling of Composite Materials. Chem. Eng. Process. 2012, 51, 53–68. [Google Scholar] [CrossRef]
  3. Materials Science Society of Japan. Global Environment and Materials; Shokabo Co., Ltd.: Tokyo, Japan, 1999; pp. 61–74. [Google Scholar]
  4. Kinoshita, H.; Kaizu, K.; Hasegawa, S.; Ando, T.; Kawamura, R.; Ikeda, K.; Kobayashi, T.; Fukuyama, H. Production and Material Properties of Ceramic From Waste Glass Fiber Reinforced Plastic. J. Environ. Eng. 2013, 8, 27–40. [Google Scholar] [CrossRef]
  5. Yasuda, Y.; Kinoshita, H.; Yasui, K.; Yuji, T.; Okamura, Y.; Sezaki, M.; Kawamura, R. Ceramics utilizing glass fiber-reinforced plastic as civil engineering materials to counteract the heat island phenomenon. Mech. Eng. J. 2016, 3, 16-00078. [Google Scholar] [CrossRef]
  6. Yasui, K.; Goto, S.; Kinoshita, H.; Kamiunten, S.; Yuji, T.; Okamura, Y.; Mungkung, N.; Sezaki, M. Ceramic waste glass fiber-reinforced plastic-containing filtering materials for turbid water treatment. Environ. Earth Sci. 2016, 75, 1135. [Google Scholar] [CrossRef]
  7. Yasuda, Y.; Iwasaki, H.; Yasui, K.; Tanaka, A.; Kinoshita, H. Development of walkway blocks with high water permeability using waste glass fiber-reinforced plastic. AIMS Energy 2018, 6, 1032–1049. [Google Scholar] [CrossRef]
  8. Fatima, M.; Farooq, R.; Lindström, R.W.; Saeed, M. A review on biocatalytic decomposition of azo dyes and electrons recovery. J. Mol. Liq. 2017, 246, 275–281. [Google Scholar] [CrossRef]
  9. Herrera-González, A.M.; Caldera-Villalobos, M.; Peláez-Cid, A.-A. Adsorption of textile dyes using an activated carbon and crosslinked polyvinyl phosphonic acid composite. J. Environ. Manag. 2019, 234, 237–244. [Google Scholar] [CrossRef]
  10. Lucas, M.; Dias, A.A.; Sampaio, A.; Amaral, C.; Peres, J.A. Degradation of a textile reactive Azo dye by a combined chemical–biological process: Fenton’s reagent-yeast. Water Res. 2007, 41, 1103–1109. [Google Scholar] [CrossRef]
  11. Robinson, T.; McMullan, G.; Marchant, R.; Nigam, P. Remediation of dyes in textile effluent: A critical review on current treatment technologies with a proposed alternative. Bioresour. Technol. 2001, 77, 247–255. [Google Scholar] [CrossRef]
  12. Sato, T. Characteristics and Applications of clays. Clay Sci. 2001, 41, 26–33. (In Japanese) [Google Scholar]
  13. Iimura, K. Adsorption of Mechyren blue by various clays and zeorite. Clay Sci. 1966, 6, 14–21. [Google Scholar]
  14. Lowell, S.; Shields, J.E.; Thomas, M.A.; Thommes, M. Characterization of Porous Solids and Powders: Surface Area, Pore Size and Density; Springer: Dordrecht, The Netherlands, 2004. [Google Scholar]
  15. Liu, L.; Tan, S.J.; Horikawa, T.; Do, D.D.; Nicholson, D.; Liu, J. Water adsorption on carbon—A review. Adv. Colloid Interface Sci. 2017, 250, 64–78. [Google Scholar] [CrossRef] [PubMed]
  16. Kamemoto, T.; Yano, M.; Harano, Y. Phenol Adsorption on Active Carbon in Liquid Phase. Kagaku Kogaku Ronbunshu 1977, 3, 289–295. (In Japanese) [Google Scholar] [CrossRef]
Figure 1. The manufacturing process of granular GFRP/clay ceramics for MB dye adsorption testing.
Applsci 09 01574 g001
Figure 2. The appearance of the clay and GFRP/clay ceramics. (a) Microscope images of the granular GFRP/clay ceramics. (b) SEM images of the GFRP/clay ceramic surface structures.
Applsci 09 01574 g002
Figure 3. Particle size distribution of granular ceramics.
Applsci 09 01574 g003
Figure 4. The compressive strength of the GFRP/clay ceramics.
Applsci 09 01574 g004
Figure 5. A schematic diagram of the MB dye adsorption test based on the granular GFRP/clay ceramic specimens.
Applsci 09 01574 g005
Figure 6. (a) Turbidity and (b) pH in mixtures of distilled water containing ceramics with particle sizes in the range of 0.1–0.3 mm and 0.3–0.5 mm, stirred at 150 rpm.
Applsci 09 01574 g006
Figure 7. Ceramic pore-size distributions.
Applsci 09 01574 g007
Figure 8. The reduction rate of the MB dye concentration for various GFRP/clay ceramics. (a) Oxidatively fired GFRP/clay ceramics. (b) Reductively fired GFRP/clay ceramics.
Applsci 09 01574 g008
Figure 9. Microscope image of the glass fibers and the changes in absorbance for the MB solution.
Applsci 09 01574 g009
Figure 10. The temporal changes in pH for the MB aqueous solutions.
Applsci 09 01574 g010
Figure 11. The relationship between the ceramic specimen particle size and rate of reduction rate in the MB dye concentration.
Applsci 09 01574 g011
Table 1. Compositions of inorganic substances in the clay and GFRP.
ComponentRaw Materials
Clay (Mass %)40% GF/GFRP (Mass %)
SiO265.854.9
Al2O321.916.3
Fe2O34.790.77
K2O3.370.15
MgO1.67-
CaO1.3126.7
TiO20.870.56
Others0.290.62
Table 2. Manufacturing conditions for the granular ceramics.
No.SamplesMixing Ratio of GFRP (Mass %)Firing ConditionsParticle Size of Ceramic Specimens (mm)
1Clay0Oxidatively fired at 1073 K0.5–1.0
1.0–1.4
1.4–2.0
220% GFRP/clay20
340% GFRP/clay40
460% GFRP/clay60
520% GFRP/clay20Reductively fired at 1073 K
640% GFRP/clay40
760% GFRP/clay60
Clay particle size: ~0.3 mm, GFRP particle size: ~0.5 mm
Table 3. The inorganic chemical compositions of the ceramic specimens.
ComponentOxidatively FiredReductively Fired
Clay20% GFRP/Clay40% GFRP/Clay60% GFRP/Clay20% GFRP/Clay40% GFRP/Clay60% GFRP/Clay
SiO263.562.659.150.062.261.256.2
Al2O323.922.120.717.718.59.134.79
Fe2O35.134.874.164.096.137.567.34
K2O3.763.262.912.003.733.773.11
MgO1.791.661.751.512.242.432.14
CaO0.514.029.9323.25.3412.922.7
TiO21.110.860.801.031.211.561.49
Others0.270.580.710.450.651.462.22
Table 4. Apparent porosity, specific surface area, and carbon content of the ceramics.
No.SamplesApparent Porosity (%)Specific Surface Area (m2/g)Carbon Content (%)
1Clay (Oxidatively fired)31.911.00.06
220% GFRP/clay (Oxidatively fired)38.27.050.24
340% GFRP/clay (Oxidatively fired)52.75.740.25
460% GFRP/clay (Oxidatively fired)62.92.830.26
520% GFRP/clay (Reductively fired)43.114.90.85
640% GFRP/clay (Reductively fired)53.814.20.99
760% GFRP/clay (Reductively fired)66.211.31.12

