Article

Identifying Key Sources of City Air Quality: A Hybrid MCDM Model and Improvement Strategies

1
Department of Business Administration, Cheng Shiu University, No. 840, Chengcing Rd., Niaosong Dist., Kaohsiung City 83347, Taiwan
2
Department of Business Administration, University of Kang Ning, No. 188, Sec. 5, Anchung Rd., Annan Dist., Tainan City 70970, Taiwan
3
School of Business, Macau University of Science and Technology, Avenida Wai Long, Taipa, Macau 999078, China
4
Kaohsiung Municipal Linyuan Senior High School, No. 481, Linyuan N. Rd., Linyuan Dist., Kaohsiung City 83252, Taiwan
5
Center for Environmental Toxin and Emerging-Contaminant Research, Cheng Shiu University, Kaohsiung 83347, Taiwan
6
Super Micro Mass Research and Technology Center, Cheng Shiu University, Kaohsiung 83347, Taiwan
*
Author to whom correspondence should be addressed.
Appl. Sci. 2019, 9(7), 1414; https://doi.org/10.3390/app9071414
Submission received: 28 January 2019 / Revised: 28 March 2019 / Accepted: 30 March 2019 / Published: 4 April 2019
(This article belongs to the Special Issue Air Pollution)

Abstract

:

Featured Application

A systematic and combined approach to assess air pollution factors and generate managing strategies.

Abstract

Improvements for air quality were prioritized according to gaps between criteria. Existing improvement strategies for air quality often focus on a single criterion, without considering associations among criteria. Moreover, solutions are often temporary, failing to provide long-term improvement. Therefore, this study employed a multiple-criteria decision-making model and a substitution method based on causal relationships to analyze potential improvement strategies for air quality in Kaohsiung, Taiwan. Results revealed that coal-fired power plants and factory emissions are the major sources of pollution in Kaohsiung. This study suggests that environmental authorities in Kaohsiung should facilitate plants to improve energy efficiency with anti-pollution facilities.

1. Introduction

The greenhouse effect continues to make the environment deteriorate, and air pollution has become a topic of concern for everyone. Air pollution increases social and economic costs and leads to shortened life expectancy [1,2]. According to a World Health Statistics report [3], the number of premature deaths caused by air pollution is twice as high as a previous estimate, and air pollution has caused the death of nearly seven million people worldwide, becoming the greatest health hazard for human beings [4,5,6,7]. Air pollution has been classified as a major environmental carcinogen, with the most resultant deaths in developing countries in the Asia–Pacific region. Even at low concentrations, fine particles can have adverse health effects [8,9,10].
According to the air quality monitoring report of the Environmental Protection Administration (EPA) of Taiwan’s Executive Yuan in 2018 [11], the annual average concentration of fine particulate matter (PM2.5) in Taiwan is 2.5 times higher than the standard limit suggested by the World Health Organization. Statistics released by the Ministry of Health and Welfare [12] state seven of the top ten cancer-related causes of death in Taiwan may be related to air pollution, and these diseases have been prevalent for more than 20 years. In December 2017, an unprecedented phenomenon occurred on the streets of Taiwan—people marched on the streets to protest the rapidly deteriorating air quality. This indicates that environmental protection authorities have not taken sufficient measures to improve air quality. Therefore, the theoretical and practical significance of air quality can be further emphasized to ensure its sustainable development.
Air pollution sources are diverse and interrelated; therefore, this study used a hybrid multiple-criteria decision-making (MCDM) model, which simultaneously considers rankings and evaluations to help decision-makers to resolve practical problems when faced with complicated and interdependent attributes [13,14]. Unlike extant research, this study empirically evaluated and improved the dimensions and criteria of enforcement activities performed by environmental regulators. The main purpose of this study was to develop a model that proposes a strategy to improve air quality through sustainable environment development.

2. Literature Review

Environmental protection units have been typically assessing the effectiveness of air pollution control through performance evaluations to improve overall air quality. However, oversimplified assessment indicators with mutual effects on one another are frequently used because of insufficient information and limited resources, thus resulting in distorted evaluation results. To gain a more comprehensive understanding of air pollution sources, this study used materials from both government environmental agencies and academic literature. According to the Environmental Protection Administration of Taiwan [15], air pollutants are divided into two categories—stationary and mobile pollution sources. This study used these two categories of air pollution sources to discover causal relationship among their attributes.

2.1. Stationary Air Pollution Sources

The air pollution generated from existing coal-fired power plants has a significantly negative effect on human health and the environment and necessitates upgrades for existing power plant equipment [16,17]. The emission concentration of pollutants dramatically decreased because of flue gas desulfurization facilities installed at power plants [18].
Through investments in the reduction of pollutant emissions, boiler room parameters have been changed to correspond to environmental regulations [19]. Organic pollutants in machine-dismantling factories have indicated potential harmful effects in human and other in vivo studies [20]. Incidents of allergic symptoms have been significantly higher in children living in high-pollutant-exposure areas than those in the low-exposure areas [21].
Farmers burn crops to prepare biochar to increase soil fertility [22]. Field incineration of crop residues is a common practice in many parts of the world, with potential effects on air quality, the atmosphere, and climate [23]. The main pollutant in agricultural activities is ammonia, which is mainly derived from livestock farming and related manure treatment. Agricultural smoke emissions lead to PM2.5, which has a major influence on human health [24].
A large amount of dust is generated during the construction of big projects. Because it is difficult to disperse, it poses a serious threat to human health [24,25]. Determining the source of urban smog is complex; some of the main causes are rapid urbanization and increasing dust emissions [26,27]. Urbanization has led to a significant increase in waste disposal, and the ash produced by incinerators has increased dramatically [28]. The Chinese method of cooking food gives rise to a large number of carcinogenic soot chemicals [29]. Volatile organic compounds (VOCs) are released from the exhaust pipes of restaurants [30].
Joss paper burning is another source of toxic substances [31,32]. Burning joss paper is a common tradition at temples in Asian countries, and this tradition is used for ceremonial purposes in the Buddhist and Taoist religions [33]. The Hungry Ghost Festival, which is celebrated during the seventh month of the Chinese calendar, is a festival where people typically burn joss paper and incense as a sacrifice. This open-air joss paper burning has a negative effect on air quality [34]. Exposure to high levels of river dust caused by severe weather or environmental conditions also triggers physiological diseases and anxiety [35]. Aeolian river dust has a significantly negative effect on air quality in Taiwan [36].

2.2. Mobile Air Pollution Sources

Controlling diesel vehicle emissions can effectively improve air quality and reduce deaths caused by cardiovascular disease [37]. Diesel buses have a negative effect on the city’s air quality [38]. Conventional diesel vehicles cause more pollution than natural gas and hybrid vehicles [39]. Air pollution also poses a serious and immediate threat to the lives of citizens; therefore, the ban on diesel vehicles in city is a reasonable and effective policy [40]. A pilot laboratory study conducted in Tokyo observed that controlling diesel vehicle emissions can improve air quality and reduce deaths caused by cardiovascular diseases [37].
Two-stroke scooters, which emit more VOCs than do other vehicles, are popular worldwide, particularly in Asia, Africa, and Southern Europe [41]. Large cities with two-stroke scooters as the main means of transportation have become the main cause of air pollution [42,43].
Seaports are a crucial factor in the emission of air pollutants in marine and coastal areas [44]. The pollution of coastal cities increases from the internal plume transport caused by inland sea breezes [45]. Ship emissions contribute significantly to PM2.5 concentrations because of their significant influence on air quality and the potential adverse effects on human health [46]. Disconcerting levels of polycyclic aromatic hydrocarbons and heavy metals were found in soil and plant samples collected from areas near railway junctions [47]. Pollutants produced by transformers, capacitors, and electric locomotives used in railway equipment are released into the atmosphere and cause pollution through rainwater. Numerous polychlorinated biphenyls are found in the soil near railway tracks [48].

3. Methodology

Conceptual Explanation of The Series of Integrative Methodologies

The purpose of this section is to offer an overview of the whole analytical process, since it was combined with several procedures and methods. This study constructed a hybrid MCDM model. The decision-making trial and evaluation laboratory (DEMATEL) technique is used to build an influential network relation map (INRM); through the analytic network process (ANP), this DEMATEL-based ANP (DANP) was used to obtain influential weights (IWs). Finally, Vlse Kriterijuska Optimizacija Komoromisno Resenje (VIKOR, “Optimization of Compression Resistance”), combined with IWs to determine how to reduce gaps to achieve an ideal level, were used to assess the effectiveness of the enforcement of air pollution improvement by the Environmental Protection Bureau of Kaohsiung City Government (see Section 4.2. for a detailed description of this location and data collection).
The hybrid MCDM model used in this study is the concept of “gap” [49]. This model believes that people will naturally pursue a level of aspiration, which is the concept of a perfect score. As a result, decision makers can clearly understand the gaps that need to be improved for each indicator and the need to achieve continuous improvement at the expected level. The second concept of the model explains how to systematically develop a strategy [50]. After realizing the problem, the decision maker must develop an improvement strategy to achieve the goal. Traditionally, the multivariate analysis model assumes that the factors are independent of each other, so the decision makers will be guided to look at each problem individually rather than looking at the relationship between all the indicators, so they can only address the obvious problems—improve, not solve the root cause of the problem. In the real world, the cause of the problem is not simple and often involves complex systems. In the system, each factor has more or less the influence of the target, and the analyst often deliberately ignores the inconspicuous relationship in order to simplify the analysis process. Therefore, this research model recognizes that all factors are causally related to each other and then finds the root cause of the problem and discusses how to improve to achieve the goal.
In that vein, this study used a hybrid MCDM study model to perform analysis tools, composed of three technologies. The first is the decision-making trial and evaluation laboratory (DEMATEL), which uses an expert questionnaire to assess the relationship between each factor and expresses the interaction relationship through a pairwise comparison matrix to find the total impact relationship matrix [51,52].
The second technique is the analytic network process (ANP), which is designed to loosen the independence assumptions of factors in the analytic hierarchy process (AHP) system to reflect real-world conditions [53,54]. Then, the results of DEMATEL are combined with ANP (also known as DEMATEL-based ANP), and the influential weights (IWs) are derived from the calculation program. IWs are mainly used to express the relative importance of factors between the factors. The third technique is VIKOR. This study used modified VIKOR, which combines IWs with VIKOR. Its purpose is to shorten the gap between factors and expected level and find out where the problem lies, in order to refer back to the INRM drawn by DEMATEL. The INRM is used to identify the root cause of the problem and develop a systematic improvement strategy to prioritize the improvement strategy [55,56].
The MCDM model has fully demonstrated its advantages in various research fields. Some scholars have optimized sustainable energy alternatives in the planning and development of renewable energy [57]. Some scholars assess and build sustainable housing affordability on various complex factors that affect the quality of family life [58]. Some scholars have provided continuous improvement strategies for the establishment of creative cities [59]. In the field of air pollution, some scholars have used MCDM to carry out an assessment of the impact of air pollution on the sustainable economic development of cities [60].
This study used a research method that optimized the analytical procedures of the above three hybrid analysis techniques [61]. Due to the largely reduced number of traditional questionnaire items which allow more time for each question to be answered by experts, the quality of the answers for questions could be ensured. Its operating procedures are divided into 11 steps. The first step to the fifth step can obtain the total influence matrix through the DEMATEL method and obtain the data required to draw the INRM. Steps 6 through 7 obtain the local weights of the facets and criteria through the DANP method. The global weights for all criteria can be obtained through step 8, which can be used to understand the message across the facets. Gain the gap between each factor through modified VIKOR through steps 9 through 11. The operating procedures are as follows.
Step 1: Establish the direct relation matrix D of each expert.
The direct relation matrix is established through a pair-wise comparison method to evaluate the degree to which factor i affects factor j of each of the H experts, as shown in Formula (1). It can be expressed as D = [ d i j h ] n × n for h = 1, 2, …, H, and n is the number of criteria. The evaluation scale is divided into 0, 1, 2, 3 or 4, which represent the magnitude of the different influences, ranging from no effect (0) to extremely high influence (4) [62].
D = [ d 11 d 1 j d i 1 d i j d 1 n d i n d n 1 d n j d n n ]
Step 2: Calculate the average direct relation matrix A.
The average direct relation matrix A can be obtained by integrating the matrix D of the H-expert with an arithmetic averaging method. a i j = 1 H h = 1 H d i j h indicates the degree to which the criterion i affects the criterion j, as shown in Equation (2).
A = [ a 11 a 1 j a i 1 a i j a 1 n a i n a n 1 a n j a n n ]
Step 3: Calculate the normalized relation matrix X.
The average direct relation matrix A is normalized to obtain the normalized relation matrix X, as shown in Equations (3) and (4).
X = A / s
s = max [ max 1 i n j = 1 n a i j , max 1 j n i = 1 n a i j ]
Step 4: Calculate the total relation matrix T.
Through Formula (5), the multiple influences and indirect influence values of the criterion, that is, the total influence value, can be calculated. The degree of influence between the criteria in matrix X is directly or indirectly affected by itself and other criteria, T = [ t i j ] n × n ,   i ,   j = 1 ,   2 ,   ,   n ; I is the identity matrix.
T = X + X 2 + X 3 + + X e = X ( I X ) 1   for   lim e X e = [ 0 ] n × n
Step 5: Draw the facet and criteria of the INRM.
Adding each column and each row of matrix T to obtain the value of o and p, o means the total degree of the criterion affecting other criteria, as shown in Formula (6); p means that the criterion is affected by other criteria. The total extent is shown in Equation (7).
o = [ j = 1 n t i j ] n × 1   for   i , j = 1 ,   2 ,   , n
p = [ i = 1 n t i j ] 1 × n   for   i , j = 1 ,   2 ,   , n
( o + p ) is called prominence, which indicates the extent to which the criteria affect and the sum of the impacts and represents the importance of this criterion in the system. ( o p ) is called relation, which indicates the degree of net impact of the criterion and represents the relative intensity of influence of this criterion in the system. Using the coordinate plot, with ( o + p ) as the X-axis and ( o p ) as the Y-axis, we can get the INRM [63]. The criteria have an influential relationship between the two. The criterion with stronger influence will have another criterion with weaker ray pointing. In the questionnaire input stage, two questionnaires, dimensions and criteria, are used respectively [61].
Step 6: Transpose and normalize the total relation matrix.
The normalized total relation matrix T α can be obtained by normalizing the matrix T by Formula (8), and then the transposed total influence relation matrix W α can be obtained by Formula (9).
T α = [ t i j ] n × n / o
W α = ( T α ) 1
Step 7: Obtain local weights of dimensions w d l and criteria w d _ c l .
W α is multiplied by Formula (10) until it converges, and z represents the power of the self. The local weights of dimension w d l and criteria w d _ c l within the dimension are obtained; the local weights in the DANP model is called influential weights (IWs).
W = lim z ( W α ) z
Step 8: Get global weights of all criteria W c g .
Global weights of all criteria W c g are obtained by integrating the local weights of dimensions with criteria, as shown in Formula (11).
W c g = W D _ c l × W D l
Step 9: Obtain the aspiration levels and worst value.
This study defines the criteria for assessing satisfaction by ranging from the worst (0) to the best (4). That is, f a s p i r e d is 4, and f w o r s t is 0.
Step 10: Normalize performance of k alternatives and calculate the gap.
By normalizing the difference between the performance value f k j of the scheme k and the aspiration level, r k j can be obtained, as shown in Formula (12).
r k j = ( | f a s p i r e d f k j | ) / ( | f a s p i r e d f w o r s t | )
Step 11: Obtain the mean group utility S k for the gap.
This study aimed to develop an improvement strategy to achieve the aspiration level, so the modified VIKOR was used instead of the traditional VIKOR [55,64]. Therefore, the total gap of this study is based on the mean group utility S k , as shown in Equation (13).
S k = j = 1 n w c j g r k j

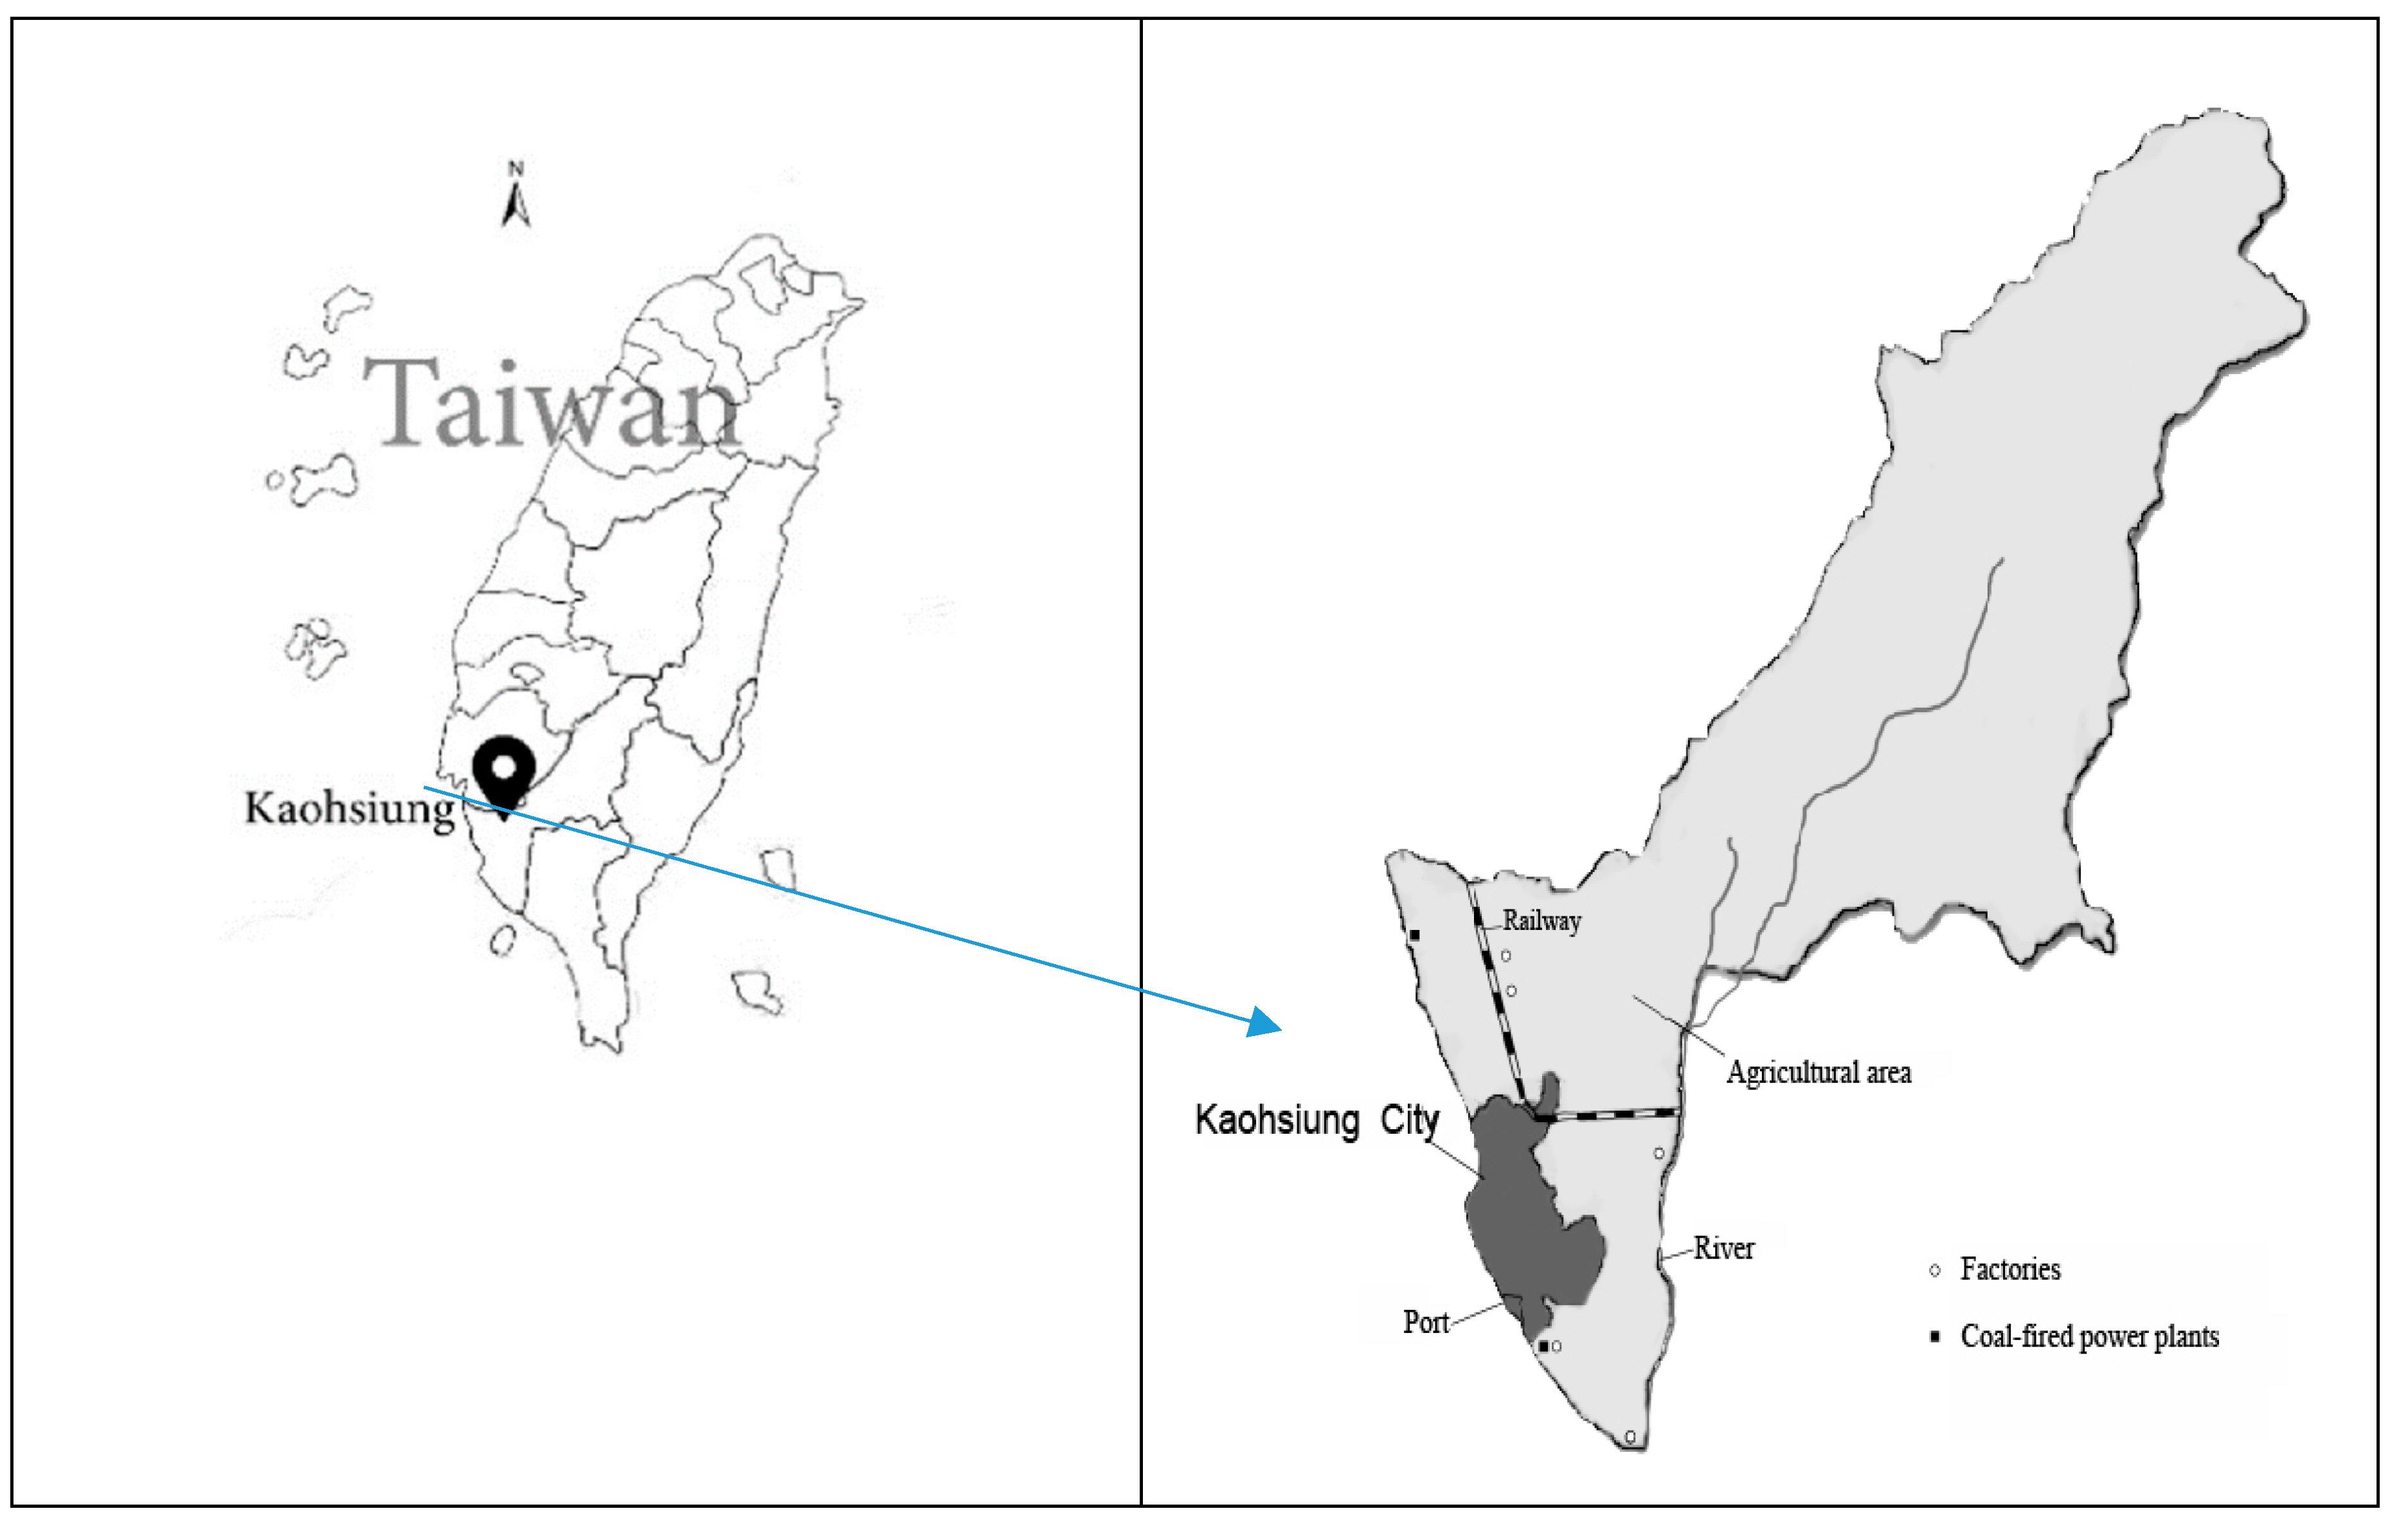
4. Empirical Case of a Metropolitan Area of Taiwan

4.1. Background and Problem Descriptions

Taiwan’s air pollution is severe, especially in the Central and Southern regions. The Environmental Protection Administration [11] compared the pollution situation in various cities and counties in Taiwan in Spring 2018 and Kaohsiung was the most polluted city. See Kaohsiung’s location in Figure 1 below. In addition to natural pollution factors, such as its topography and climate, Kaohsiung has many highly polluting heavy industries, factories, and coal-fired power plants. The study used the highly industrialized and commercialized Kaohsiung as an empirical case because it is also a crucial agriculture area and has the largest metropolitan area in the southern Taiwan, with a population of approximately 2.77 million people. This study sought to evaluate air pollution control measures and offer suggestions to improve their effectiveness using a hybrid MCDM model combining DANP with VIKOR.

4.2. Data Collection

This study reviewed existing research to develop an evaluation model for an empirical case and provided textural refinements and corrections for the pretest questionnaire for these dimensions and criteria undertaken by a committee compromising five experts, including three civil servants from the Environmental Protection Bureau of Kaohsiung City Government and two academic experts in relevant professional fields regarding air pollution sources. A heterogeneous group of at least five experts is favorable for an expert questionnaire survey to achieve group consensus [50]. Therefore, the crucial dimensions and criteria that were adopted for the final questionnaire were suggested by the nine including aforementioned experts. The results are shown in Table 1.
The location of Kaohsiung is indicated in the following map in Figure 1.

4.3. Analysis of Results

In this study, the DEMATEL structure was established and 2 dimensions and 11 criteria of domestic air pollution sources for Kaohsiung were analyzed. Based on the experts’ consensus, the total influence matrices T D and T c were obtained. The sums of influences given and received for constructing the INRM are shown in Table 2 and the INRM is shown in Figure 2. The direction of the arrow in the INRM represents the direction of influence.
The matrix W α is the transposed matrix of T α . Subsequently, the matrix W was obtained. The IWs of the DANP could be obtained by limiting the power of W until it reaches a steady state. The global weights and local weights of the dimensions and criteria were obtained based on the IWs from the DANP; subsequently, the DANP was combined with the VIKOR method to assess the effectiveness of existing air pollution control measures in Kaohsiung, as shown in Table 3.

5. Discussion

According to the results, the air quality of Kaohsiung needs to be improved by identifying key pollutants, then making effective strategies. In summary, the gap value of mobile air pollution sources (D2) is the largest, with Scooters (C22) and Diesel vehicles (C21) listed in the first and second places. There are many scooters and diesel vehicles in the city, leading to a high degree of historical reliance on such transportation tools. Encouraging electronic vehicles might be a necessary method to achieve the replacement effect. This requires the local government to invest more in subsidy for electronic vehicles for individual and industrial transportation uses.
Because there are coal-fired power plants supporting heavy industries’ growth, which is a major strategy of Kaohsiung’s economic development., the criteria gap value of coal-fired power plants (C11) and factories (C12) are the first and second largest. According to statistics [11], almost 50% of all monitored (highly pollutant) factories of Taiwan are in Kaohsiung. Moreover, the largest refinery, petrochemical industrial zone and steel plant of Taiwan are also in Kaohsiung. For a long time, policy makers often neglected the upgrading of energy-consuming industries and pollutant processing industries by sacrificing the ecological environment in exchange for economic development. However, scholars have found that energy-consuming industries can cause carbon emissions and pollute the environment, but they do not necessarily lead to economic growth [65,66]. Therefore, in the long run, policymakers should consider implementing more aggressive policies to support energy-consuming industries and power plants to improve their efficiency without affecting economic growth [67].
The improvement strategy of this study could be discussed in dimensions and criteria. In terms of dimensions, through the facet of INRM, it can be seen that mobile air pollution sources (D2) are affected by stationary air pollution sources (D1). Therefore, policymakers need to consider the impact of stationary air pollution sources on mobile air pollution sources. In terms of stationary air pollution sources, experts hope to improve coal-fired power plants (C11), but it is affected by certain factors (C12). In other words, when thinking about how to improve air quality, policy makers should not just prioritize resources to reduce the level of power plants, but they should help the factory to install anti-fouling equipment through counselling mechanisms, requiring plants to gradually improve the power saving efficiency of the machine, reducing the burden on the power plant, increasing the monitoring equipment, and strengthening the elimination of excessive factory emissions.

6. Conclusions and Limitation

A hybrid modified MCDM model was utilized to evaluate the effectiveness of air pollution control and determine feasible improvement strategies in Kaohsiung City. The main contributions of this study are as follows. The main dimensions and criteria of the evaluation model for domestic air pollution sources were constructed according to the literature review and expert panel consensus. DEMATEL was used to verify the relationships between dimensions and criteria and to construct INRMs. DANP provided the IWs of criteria and modified VIKOR was used to acquire the gaps among dimensions and criteria. We used hybrid research methods to holistically obtain key indicators to target for continuous improvement of air pollution improvement. This empirical case study verified the effectiveness of our research structure and method model. Workplace-generated air pollution is critical for workers’ and stakeholders’ health [68]. Thus, based on the study result, we recommend that the Environmental Protection Bureau prioritize coal-fired power plants as a direction for improvement, which corresponds to the finding to previous studies well [69].
There are several limitations to this study. First, the study is a case study applied specifically to Kaohsiung City, which means that results might be different due to heterogeneity in different regions and times. Second, the respondents are environmental officials of the Kaohsiung City Government and experts who long live in Kaohsiung City. There may be some bias from their answers. Additionally, we only used Kaohsiung as the sample (which might limit the generalizability of our conclusion), though it is an important and representative port city in the world. Thus, we believe that the case is still worth noting and can be implication stimulating, even every city has its own special conditions. Future studies could follow conceptual and methodological logic to create context-specific investigations of different characterized cities. Also note that there are other possible emission reduction opportunities from coal-fired power plants (not by replacement with other energy sources, but by, for example, modernizing the flue gas treatment system or by changing the coal fuel to more environmentally friendly fuel) and significant impact of mobile air pollution sources on air quality (also resulting from the analysis). Future studies could find it useful to follow such a thought and design a proper research to investigate these possible strategies.

Author Contributions

Conceptualization, K.-H.C., C.-H.C. and F.-S.T.; methodology, P.-C.T. and J.-M.Y.; validation, F.-S.T.; formal analysis, K.-H.C. and J.-M.Y.; investigation, P.-C.T.; writing—original draft preparation, K.-H.C., J.-M.Y., F.-S.T., and P.-C.T.; writing—review and editing, K.-H.C.; project administration, K.-H.C. All authors have read and approved the final manuscript.

Funding

This research received no external funding.

Conflicts of Interest

The authors declare no conflict of interest.

References

  1. OECD. The Cost of Air Pollution: Health Impacts of Road Transport. OECD Publishing, 2014. Available online: https://doi.org/10.1787/9789264210448-en (accessed on 22 October 2017).
  2. World Health Organization. Economic Cost of the Health Impact of Air Pollution in Europe: Clean Air, Health and Wealth; WHO: Geneva, Switzerland, 2017. [Google Scholar]
  3. World Health Organization. World Health Statistics. 2017. Available online: http://www.who.int/gho/publications/world_health_statistics/zh (accessed on 23 October 2017).
  4. Cai, J.; Yu, S.; Pei, Y.; Peng, C.; Liao, Y.; Liu, N.; Ji, J.; Cheng, J. Association between Airborne Fine Particulate Matter and Residents’ Cardiovascular Diseases, Ischemic Heart Disease and Cerebral Vascular Disease Mortality in Areas with Lighter Air Pollution in China. Int. J. Environ. Res. Public Health 2018, 15, 1918. [Google Scholar] [CrossRef] [PubMed]
  5. Chung, H.Y.; Hsieh, C.J.; Tseng, C.C.; Yiin, L.M. Association between the First Occurrence of Allergic Rhinitis in Preschool Children and Air Pollution in Taiwan. Int. J. Environ. Res. Public Health 2016, 13, 268. [Google Scholar] [CrossRef] [PubMed]
  6. Liu, W.; Xu, Z.; Yang, T. Health Effects of Air Pollution in China. Int. J. Environ. Res. Public Health 2018, 15, 1471. [Google Scholar] [CrossRef] [PubMed]
  7. Mad Saad, S.; Andrew, A.M.; Md Shakaff, A.Y.; Mat Dzahir, M.A.; Hussein, M.; Mohamad, M.; Ahmad, Z.A. Pollutant Recognition Based on Supervised Machine Learning for Indoor Air Quality Monitoring Systems. Appl. Sci. 2017, 7, 823. [Google Scholar] [CrossRef]
  8. Gao, G.; Zeng, X.; An, C.; Yu, L. A sustainable industry-environment model for the identification of urban environmental risk to confront air pollution in Beijing, China. Sustainability 2018, 10, 962. [Google Scholar] [CrossRef]
  9. Hossain, A.M. Unsustainability at the crossroads of climate change and air pollution sciences: Implications for sustainable development and the scholarship of sustainability. Sustain. Dev. 2018, 26, 415–421. [Google Scholar] [CrossRef]
  10. Shi, L.; Zanobetti, A.; Kloog, I.; Coul, B.A.; Koutrakis, P.; Melly, S.J.; Schwartz, J.D. Low-concentration PM2.5 and mortality: Estimating acute and chronic effects in a population-based study. Environ. Health Perspect. 2015, 124, 46–52. [Google Scholar] [CrossRef] [PubMed]
  11. Environmental Protection Administration: Taipei, Taiwan, 2018. Available online: http://www.epa.gov.tw (accessed on 20 May 2018).
  12. Ministry of Health and Welfare. 2016. Available online: https://www.mohw.gov.tw (accessed on 25 October 2017).
  13. Kleijnen, J.P.C. An overview of design and analysis of simulation experiments for sensitivity analysis. Eur. J. Oper. Res. 2005, 164, 287–300. [Google Scholar] [CrossRef]
  14. Tzeng, G.H.; Huang, C.Y. Combined DEMATEL technique with hybrid MCDM methods for creating the aspired intelligent global manufacturing & logistics systems. Ann. Oper. Res. 2012, 197, 1–32. [Google Scholar]
  15. Environmental Protection Administration: Taipei, Taiwan. 2017. Available online: https://www.epa.gov.tw (accessed on 15 October 2017).
  16. Chen, C.H.S.; Yuan, T.H.; Shie, R.H.; Wu, K.Y.; Chan, C.C. Linking sources to early effects by profiling urine metabolome of residents living near oil refineries and coal-fired power plants. Environ. Int. 2017, 102, 87–96. [Google Scholar] [CrossRef]
  17. Gingerich, D.B.; Mauter, M.S. Retrofitting the regulated power plant: Optimizing energy allocation to electricity generation, water treatment, and carbon capture processes at coal-fired generating facilities. ACS Sustain. Chem. Eng. 2018, 6, 2694–2703. [Google Scholar] [CrossRef]
  18. Cho, C.S.; Kim, M.W.; Kang, S.M.; Hong, Y.J.; Jeon, E.C. Study on the variance of N2O concentration after air pollution prevention facility in bituminous coal-firing power plant. Energy Fuels 2017, 31, 4173–4178. [Google Scholar] [CrossRef]
  19. Slavícek, P.; Vráblík, M.; Pajdla, M. Gas Installation in boiler house of Hrusovany nad Jevisovkou sugar factory. Listy Cukrovarnické a Reparské 2013, 129, 308. [Google Scholar]
  20. Gou, Y.Y.; Hsu, Y.C.; Chao, H.R.; Que, D.E.; Tayo, L.L.; Lin, C.H. Shih; S.I. (Pollution characteristics and diurnal variations in polybrominated diphenyl ethers in indoor and outdoor air from vehicle dismantler factories in southern Taiwan. Aerosol Air Qual. Res. 2016, 16, 1931–1941. [Google Scholar] [CrossRef]
  21. Chiang, T.Y.; Yuan, T.H.; Shie, R.H.; Chen, C.F.; Chan, C.C. Increased incidence of allergic rhinitis, bronchitis and asthma, in children living near a petrochemical complex with SO2 pollution. Environ. Int. 2016, 96, 1–7. [Google Scholar] [CrossRef]
  22. Abou-Shanab, R.A.; Ji, M.K.; Kim, H.C.; Paeng, K.J.; Jeon, B.H. Microalgal species growing on piggery wastewater as a valuable candidate for nutrient removal and biodiesel production. J. Environ. Manag. 2013, 115, 257–264. [Google Scholar] [CrossRef]
  23. Oanh, N.T.K.; Ly, B.T.; Tipayarom, D.; Manandhar, B.R.; Prapat, P.; Simpson, C.D.; Liu, L.J.S. Characterization of particulate matter emission from open burning of rice straw. Atmos. Environ. 2011, 45, 493–502. [Google Scholar] [CrossRef] [PubMed]
  24. Giannadaki, D.; Giannakis, E.; Pozzer, A.; Lelieveld, J. Estimating health and economic benefits of reductions in air pollution from agriculture. Sci. Total Environ. 2018, 622, 1304–1316. [Google Scholar] [CrossRef] [PubMed]
  25. Van Deurssen, E.; Pronk, A.; Spaan, S.; Goede, H.; Tielemans, E.; Heederik, D.; Meijster, T. Quartz and respirable dust in the Dutch construction industry: A baseline exposure assessment as part of a multidimensional intervention approach. Ann. Occup. Hyg. 2014, 58, 724–738. [Google Scholar]
  26. Crilley, L.R.; Lucarelli, F.; Bloss, W.J.; Harrison, R.M.; Beddows, D.C.; Calzolai, G.; Vecchi, R. Source apportionment of fine and coarse particles at a roadside and urban background site in London during the 2012 summer ClearfLo campaign. Environ. Pollut. 2017, 220, 766–778. [Google Scholar] [CrossRef] [PubMed] [Green Version]
  27. Wu, Z.; Zhang, X.; Wu, M. Mitigating construction dust pollution: State of the art and the way forward. J. Clean. Prod. 2016, 112, 1658–1666. [Google Scholar] [CrossRef]
  28. Pansuk, J.; Junpen, A.; Garivait, S. Assessment of air pollution from household solid waste open burning in Thailand. Sustainability 2018, 10, 2553. [Google Scholar] [CrossRef]
  29. Zhang, N.; Han, B.; He, F.; Xu, J.; Zhao, R.; Zhang, Y.; Bai, Z. Chemical characteristic of PM2.5 emission and inhalational carcinogenic risk of domestic Chinese cooking. Environ. Pollut. 2017, 227, 24–30. [Google Scholar] [CrossRef]
  30. Alves, C.A.; Evtyugina, M.; Cerqueira, M.; Nunes, T.; Duarte, M.; Vicente, E. Volatile organic compounds emitted by the stacks of restaurants. Air Qual. Atmos. Health. 2015, 8, 401–412. [Google Scholar] [CrossRef]
  31. Lin, M.D.; Rau, J.Y.; Tseng, H.H.; Wey, M.Y.; Chu, C.W.; Lin, Y.H.; Lee, C.H. Characterizing PAH emission concentrations in ambient air during a large-scale joss paper open-burning event. J. Hazard. Mater. 2008, 156, 223–229. [Google Scholar] [CrossRef] [PubMed]
  32. Yang, C.R.; Lin, T.C.; Chang, F.H. Particle size distribution and PAH concentrations of incense smoke in a combustion chamber. Environ. Pollut. 2007, 145, 606–615. [Google Scholar] [CrossRef]
  33. Hu, M.T.; Chen, S.J.; Huang, K.L.; Lin, Y.C.; Chang-Chien, G.P.; Tsai, J.H. Characterization of polychlorinated dibenzo-p-dioxin/dibenzofuran emissions from joss paper burned in a furnace with air pollution control devices. Sci. Total Environ. 2009, 407, 3290–3294. [Google Scholar] [CrossRef] [PubMed]
  34. Khezri, B.; Chan, Y.Y.; Tiong, L.Y.D.; Webster, R.D. Annual air pollution caused by the hungry ghost festival. Environ. Sci. Process. Impacts 2015, 17, 1578–1586. [Google Scholar] [CrossRef] [PubMed]
  35. Kuo, C.Y.; Hsieh, C.Y.; Hu, C.W.; Chen, S.C.; Yang, H.J. PM10 concentration in relation to clinic visits for anxiety disorders: A population-based study of a high river-dust episode region in Taiwan. Air Qual. Atmos. Health 2018, 11, 221–227. [Google Scholar] [CrossRef]
  36. Kuo, C.Y.; Yang, H.J.; Chiang, Y.C.; Lai, D.J.; Shen, Y.H.; Liu, P.M. Concentration and composition variations of metals in the outdoor PM10 of elementary schools during river dust episodes. Environ. Sci. Pollut. Res. 2014, 21, 12354–12363. [Google Scholar] [CrossRef] [PubMed]
  37. Yorifuji, T.; Kashima, S. Fine-particulate air pollution from diesel emission control and mortality rates in Tokyo. Epidemiology 2016, 27, 769–778. [Google Scholar] [CrossRef] [PubMed]
  38. Adheesh, S.R.; Vasisht, M.; Ramasesha, S. Air-pollution and economics: Diesel bus versus electric bus. Curr. Sci. 2016, 110, 858–862. [Google Scholar]
  39. Quiros, D.C.; Smith, J.; Thiruvengadam, A.; Huai, T.; Hu, S. Greenhouse gas emissions from heavy-duty natural gas, hybrid, and conventional diesel on-road trucks during freight transport. Atmos. Environ. 2017, 168, 36–45. [Google Scholar] [CrossRef]
  40. Shin, G.Y.; Manuel, R.J. London should ban all diesel vehicles. BMJ 2017, 358, j3288. [Google Scholar] [CrossRef] [PubMed]
  41. Platt, S.M.; Haddad, I.E.; Pieber, S.M.; Huang, R.J.; Zardini, A.A.; Clairotte, M.; Slowik, J.G. Two-stroke scooters are a dominant source of air pollution in many cities. Nat. Commun. 2014, 5, 3749. [Google Scholar] [CrossRef] [PubMed] [Green Version]
  42. Duc, K.N.; Duy, V.N. Study on performance enhancement and emission reduction of used fuel-injected motorcycles using bi-fuel gasoline-LPG. Energy Sustain. Dev. 2018, 43, 60–67. [Google Scholar] [CrossRef]
  43. Lawin, H.; Fanou, L.A.; Hinson, V.; Tollo, B.; Fayomi, B.; Ouendo, E.M. Occupational risk factors and perceptions of air pollution by motorcycle taxi drivers in Cotonou, Benin. Santé Publique 2018, 30, 125–134. [Google Scholar] [CrossRef] [PubMed]
  44. Claremar, B.; Rutgersson, A.; Haglund, K. Ship emissions and the use of current air cleaning technology: Contributions to air pollution and acidification in the Baltic Sea. Earth Syst. Dyn. 2017, 8, 901–919. [Google Scholar] [CrossRef]
  45. González, Y.; Rodríguez, S.; García, J.C.G.; Trujillo, J.L.; García, R. Ultrafine particles pollution in urban coastal air due to ship emissions. Atmos. Environ. 2011, 45, 4907–4914. [Google Scholar] [CrossRef]
  46. Chen, D.; Wang, X.; Nelson, P.; Li, Y.; Zhao, N.; Zhao, Y.; Guo, X. Ship emission inventory and its impact on the PM2. 5 air pollution in Qingdao Port, North China. Atmos. Environ. 2017, 166, 351–361. [Google Scholar] [CrossRef]
  47. Wiłkomirski, B.; Sudnik-Wójcikowska, B.; Galera, H.; Wierzbicka, M.; Malawska, M. Railway transportation as a serious source of organic and inorganic pollution. Water Air Soil Pollut. 2011, 218, 333–345. [Google Scholar] [CrossRef]
  48. Stojic, N.; Pucarevic, M.; Stojic, G. Railway transportation as a source of soil pollution. Transp. Res. D Transp. Environ. 2017, 57, 124–129. [Google Scholar] [CrossRef]
  49. Ouyang, Y.P.; Shieh, H.M.; Tzeng, G.H. A VIKOR technique based on DEMATEL and ANP for information security risk control assessment. Inf. Sci. 2013, 232, 482–500. [Google Scholar] [CrossRef]
  50. Tzeng, G.H.; Shen, K.Y. New Concepts and Trends of Hybrid Multiple Criteria Decision Making; CRC Press; Taylor and Francis Group: Boca Raton, FL, USA, 2017. [Google Scholar]
  51. Gabus, A.; Fontela, E. World Problems, an Invitation to Further Thought within the Framework of DEMATEL; Battelle Geneva Research Centre: Geneva, Switzerland, 1972. [Google Scholar]
  52. Tzeng, G.H.; Chiang, C.H.; Li, C.W. Evaluating intertwined effects in e-learning programs: A novel hybrid MCDM model based on factor analysis and DEMATEL. Expert Syst. Appl. 2007, 32, 1028–1044. [Google Scholar] [CrossRef]
  53. Ouyang, Y.P.; Shieh, H.M.; Leu, J.D.; Tzeng, G.H. A novel hybrid MCDM model combined with DEMATEL and ANP with applications. Int. J. Oper. Res. 2008, 5, 1–9. [Google Scholar]
  54. Hu, K.H.; Chen, F.H.; Tzeng, G.H. Evaluating the improvement of sustainability of sports industry policy based on MADM. Sustainability 2016, 8, 606. [Google Scholar] [CrossRef]
  55. Liou, J.J.; Tsai, C.Y.; Lin, R.H.; Tzeng, G.H. A modified VIKOR multiple-criteria decision method for improving domestic airlines service quality. J. Air Transp. Manag. 2011, 17, 57–61. [Google Scholar] [CrossRef]
  56. Chou, S.Y.; Yu, C.C.; Tzeng, G.H. A novel hybrid MCDM procedure for achieving aspired earned value project performance. Math. Probl. Eng. 2016, 2016, 9721726. [Google Scholar] [CrossRef]
  57. Kumar, A.; Sah, B.; Singh, A.R.; Deng, Y.; He, X.; Kumar, P.; Bansal, R.C. A review of multi criteria decision making (MCDM) towards sustainable renewable energy development. Renew. Sustain. Energy Rev. 2017, 69, 596–609. [Google Scholar] [CrossRef]
  58. Mulliner, E.; Malys, N.; Maliene, V. Comparative analysis of MCDM methods for the assessment of sustainable housing affordability. Omega 2016, 59, 146–156. [Google Scholar] [CrossRef] [Green Version]
  59. Xiong, L.; Teng, C.L.; Zhu, B.W.; Tzeng, G.H.; Huang, S.L. Using the D-DANP-mV model to explore the continuous system improvement strategy for sustainable development of creative communities. Int. J. Environ. Res. Public Health 2017, 14, 1309. [Google Scholar] [CrossRef]
  60. Wang, Q.; Dai, H.N.; Wang, H. A smart MCDM framework to evaluate the impact of air pollution on city sustainability: A case study from China. Sustainability 2017, 9, 911. [Google Scholar] [CrossRef]
  61. Qu, G.B.; Zhao, T.Y.; Zhu, B.W.; Tzeng, G.H.; Huang, S.L. Use of a Modified DANP-mV Model to Improve Quality of Life in Rural Residents: The Empirical Case of Xingshisi Village, China. Int. J. Environ. Res. Public Health 2019, 16, 153. [Google Scholar] [CrossRef]
  62. Ding, X.F.; Liu, H.C. A 2-dimension uncertain linguistic DEMATEL method for identifying critical success factors in emergency management. Appl. Soft Comput. 2018, 71, 386–395. [Google Scholar] [CrossRef]
  63. Bouzon, M.; Govindan, K.; Rodriguez, C.M.T. Evaluating barriers for reverse logistics implementation under a multiple stakeholders’ perspective analysis using grey decision making approach. Resour. Conserv. Recy. 2018, 128, 315–335. [Google Scholar] [CrossRef]
  64. Lu, M.T.; Lin, S.W.; Tzeng, G.H. Improving RFID adoption in Taiwan’s healthcare industry based on a DEMATEL technique with a hybrid MCDM model. Decis. Support Syst. 2013, 56, 259–269. [Google Scholar] [CrossRef]
  65. Zhang, X.P.; Cheng, X.M. Energy consumption, carbon emissions, and economic growth in China. Ecol. Econ. 2009, 68, 2706–2712. [Google Scholar] [CrossRef]
  66. Hossain, M.S. Panel estimation for CO2 emissions, energy consumption, economic growth, trade openness and urbanization of newly industrialized countries. Energy Policy 2011, 39, 6991–6999. [Google Scholar] [CrossRef]
  67. Xu, Y.; Hu, J.; Ying, Q.; Hao, H.; Wang, D.; Zhang, H. Current and future emissions of primary pollutants from coal-fired power plants in Shaanxi, China. Sci. Total Environ. 2017, 595, 505–514. [Google Scholar] [CrossRef] [PubMed]
  68. Tähtinen, K.; Lappalainen, S.; Karvala, K.; Lahtinen, M.; Salonen, H. Probability of Abnormal Indoor Air Exposure Categories Compared with Occupants’ Symptoms, Health Information, and Psychosocial Work Environment. Appl. Sci. 2019, 9, 99. [Google Scholar] [CrossRef]
  69. Fan, B.; Wen, C.; Zeng, X.; Wu, J.; Yu, X. Emission behaviors of inorganic ultrafine particles during Zhundong coal oxy-fuel combustion with characterized oxygen input fractions comparable to air combustion. Appl. Sci. 2018, 8, 1486. [Google Scholar] [CrossRef]
Figure 1. The location of Kaohsiung city in Taiwan.
Applsci 09 01414 g001
Figure 2. INRM of dimensions and criteria.
Applsci 09 01414 g002
Table 1. Dimensions and criteria for evaluating air pollution sources.
Dimensions/CriteriaDescriptions
Stationary air pollution sources (D1)
Coal-fired power plants (C11)Older power plants firing coal or oil.
Factories (C12)Factory emissions exceeding the acceptable level.
Agriculture-related emissions (C13)Agricultural waste burning.
Construction dust (C14)Dust from construction sites.
Cooking fumes (C15)Oil fumes from restaurants without recycling devices.
Customs (C16)Joss paper burning in traditional ceremonies.
River dust (C17)Dust from dry river beds.
Mobile air pollution sources (D2)
Diesel vehicles (C21)Diesel vehicle without the installation of filters.
Scooters (C22)Two-stroke scooters emitting high PM2.5 concentrations.
Ship emissions (C23)Ships emission entering and leaving the port.
Railway transportation (C24)Railway transportation equipment emissions.
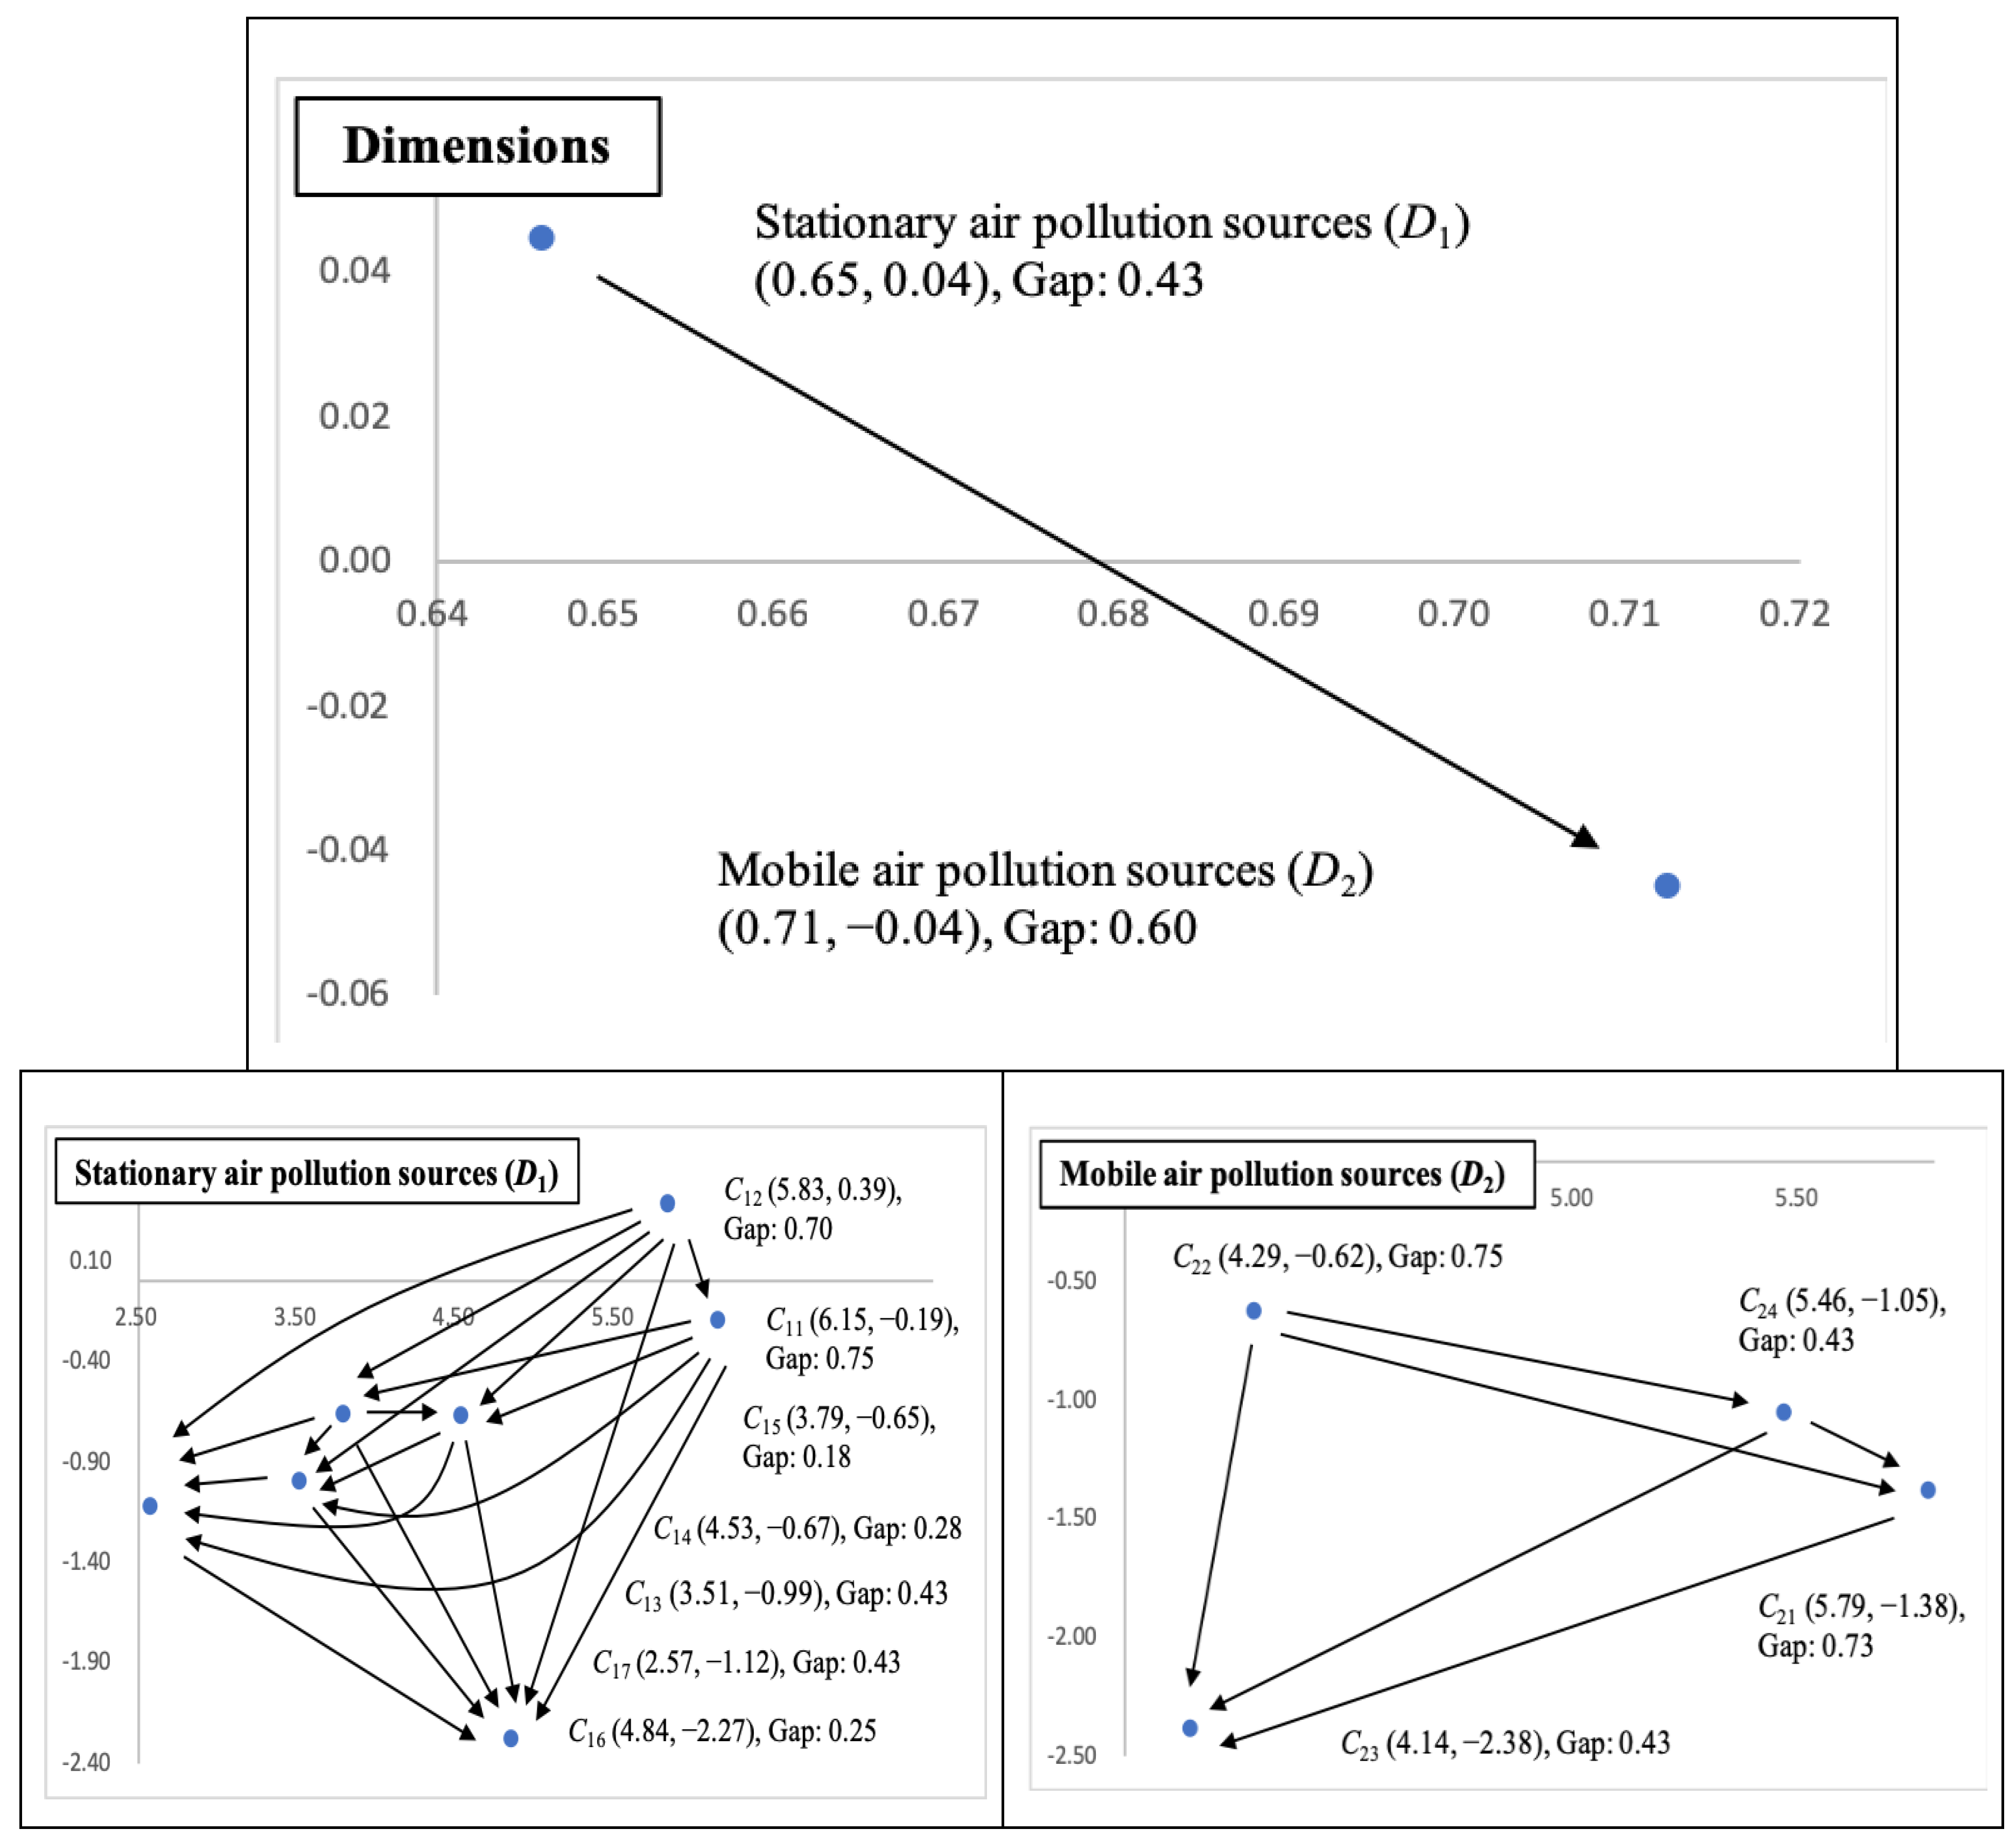
Table 2. Sum of influences given and received for constructing the influential network relation map (INRM).
Dimensions/Criteriaopo + po − p
Stationary air pollution sources (D1)0.350.300.650.04
Coal-fired power plants (C11)2.983.176.15−0.19
Factories (C12)3.112.725.830.39
Agriculture-related emissions (C13)1.262.253.51−0.99
Construction dust (C14)1.932.604.53−0.67
Cooking fumes (C15)1.572.223.79−0.65
Customs (C16)1.283.564.84−2.27
River dust (C17)0.731.852.57−1.12
Mobile air pollution sources (D2)0.330.380.71−0.04
Diesel vehicles (C21)2.203.585.79−1.38
Scooters (C22)1.832.454.29−0.62
Ship emissions (C23)0.883.264.14−2.38
Railway transportation (C24)2.213.265.46−1.05
Table 3. Performance evaluation of the empirical case using modified Vlse Kriterijuska Optimizacija Komoromisno Resenje (VIKOR).
Dimensions/CriteriaLocal WeightsGlobal WeightsPerformanceGap
Stationary air pollution sources (D1)0.44 2.270.43
Coal-fired power plants (C11)0.140.061.000.75
Factories (C12)0.160.071.200.70
Agriculture-related emissions (C13)0.130.062.300.43
Construction dust (C14)0.140.062.900.28
Cooking fumes (C15)0.140.063.300.18
Customs (C16)0.160.073.000.25
River dust (C17)0.150.072.300.43
Mobile air pollution sources (D2)0.56 1.610.60
Diesel vehicles (C21)0.220.121.100.73
Scooters (C22)0.330.181.000.75
Ship emissions (C23)0.260.152.300.43
Railway transportation (C24)0.190.112.300.43
Total performance 1.90
Total gap 0.52

