Directed Evolution of Cellobiose Dehydrogenase on the Surface of Yeast Cells Using Resazurin-Based Fluorescent Assay


 ,
,
Abstract
Featured Application
Abstract
1. Introduction
2. Materials and Methods
2.1. Materials and Strains
2.2. Enzymatic Assays
2.3. Cloning of cdh Gene in pCTCON2
2.4. Library Construction
2.5. Flow Cytometry Assay
3. Results
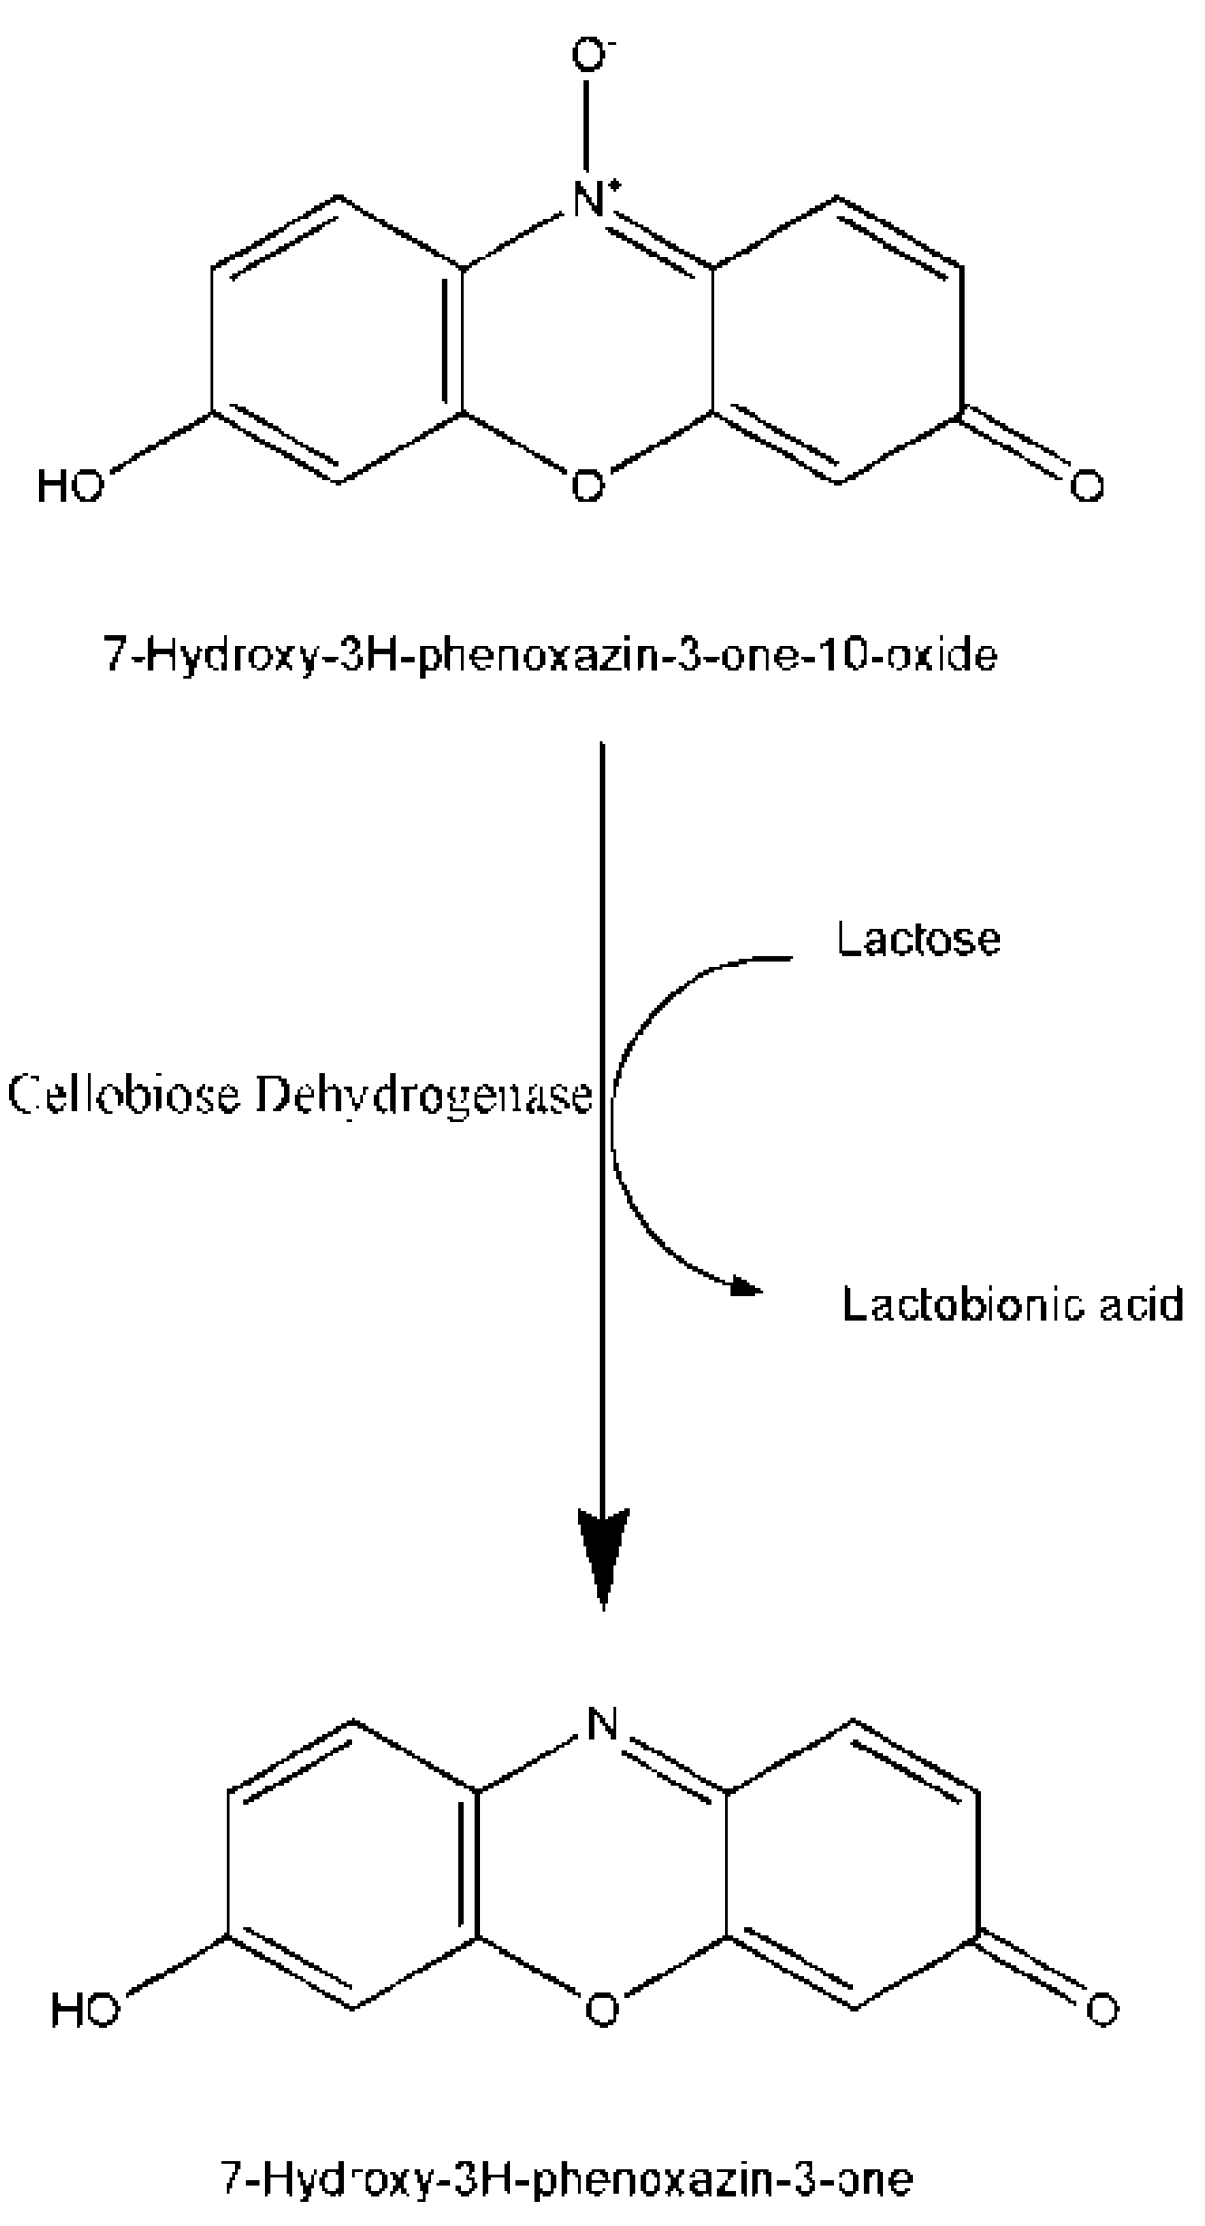
3.1. Development of Fluorescent Assay
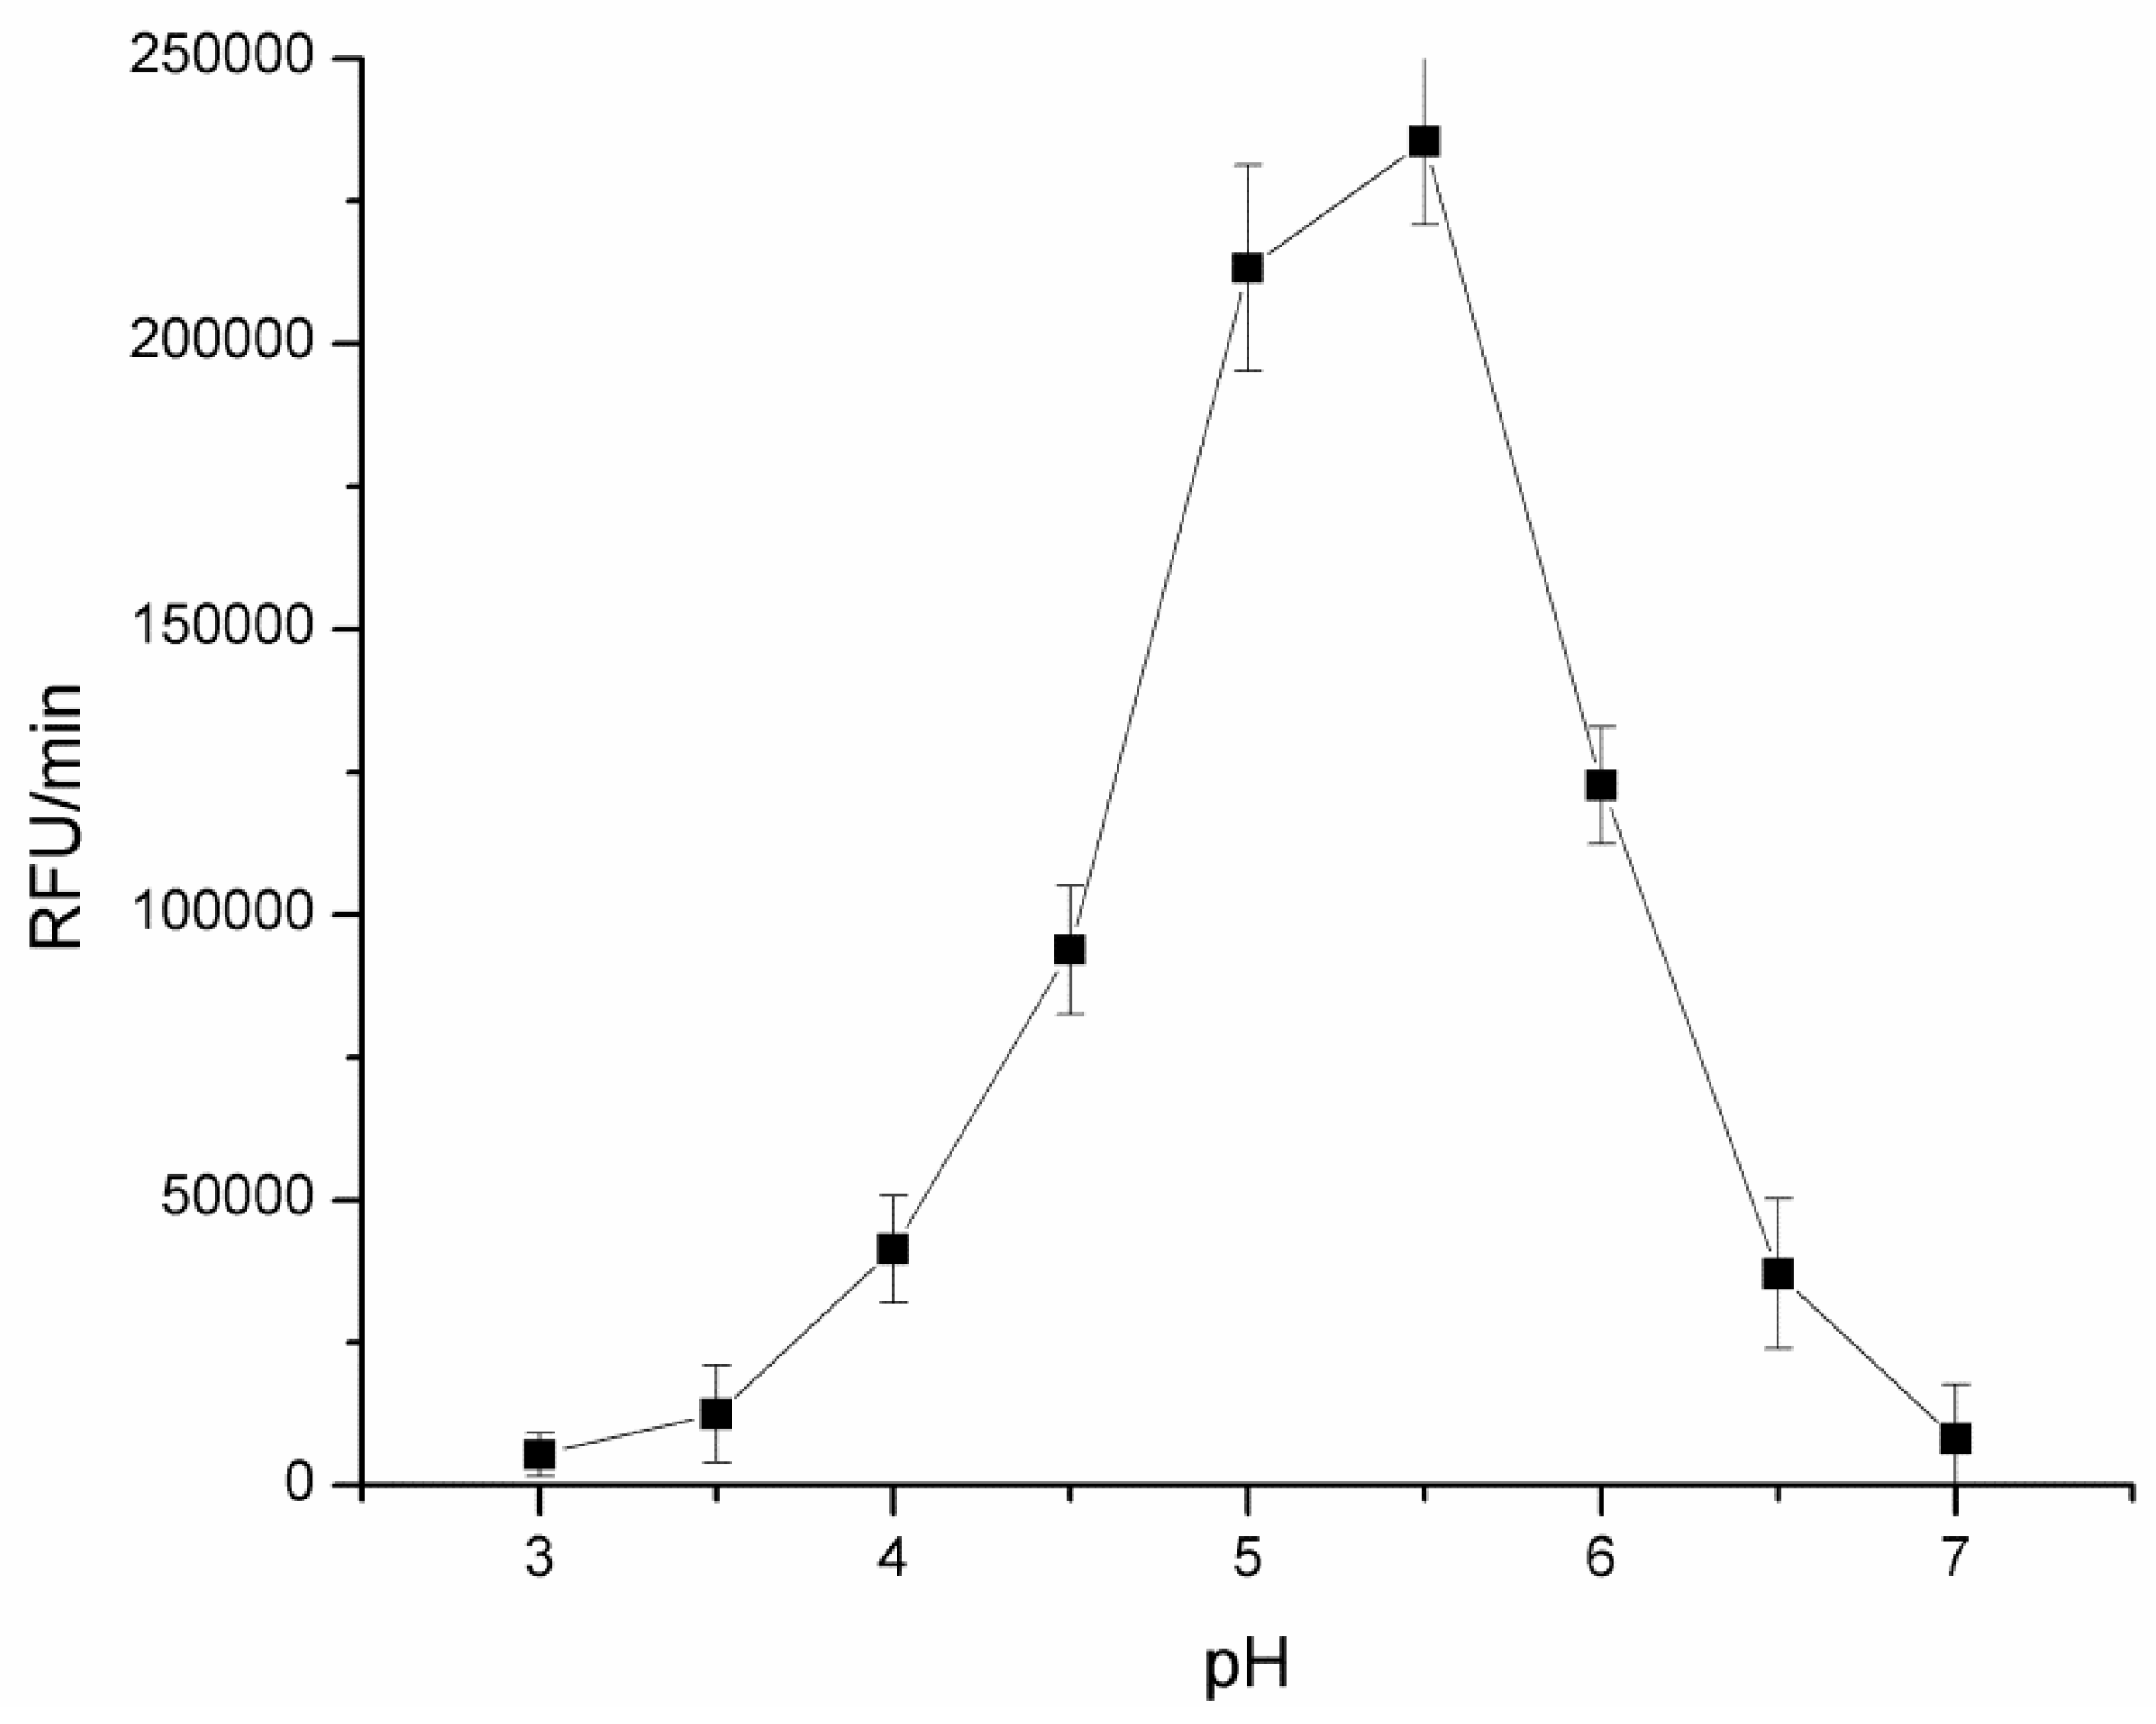
3.1.1. pH Optimization
3.1.2. Optimization of Resazurin Concentration
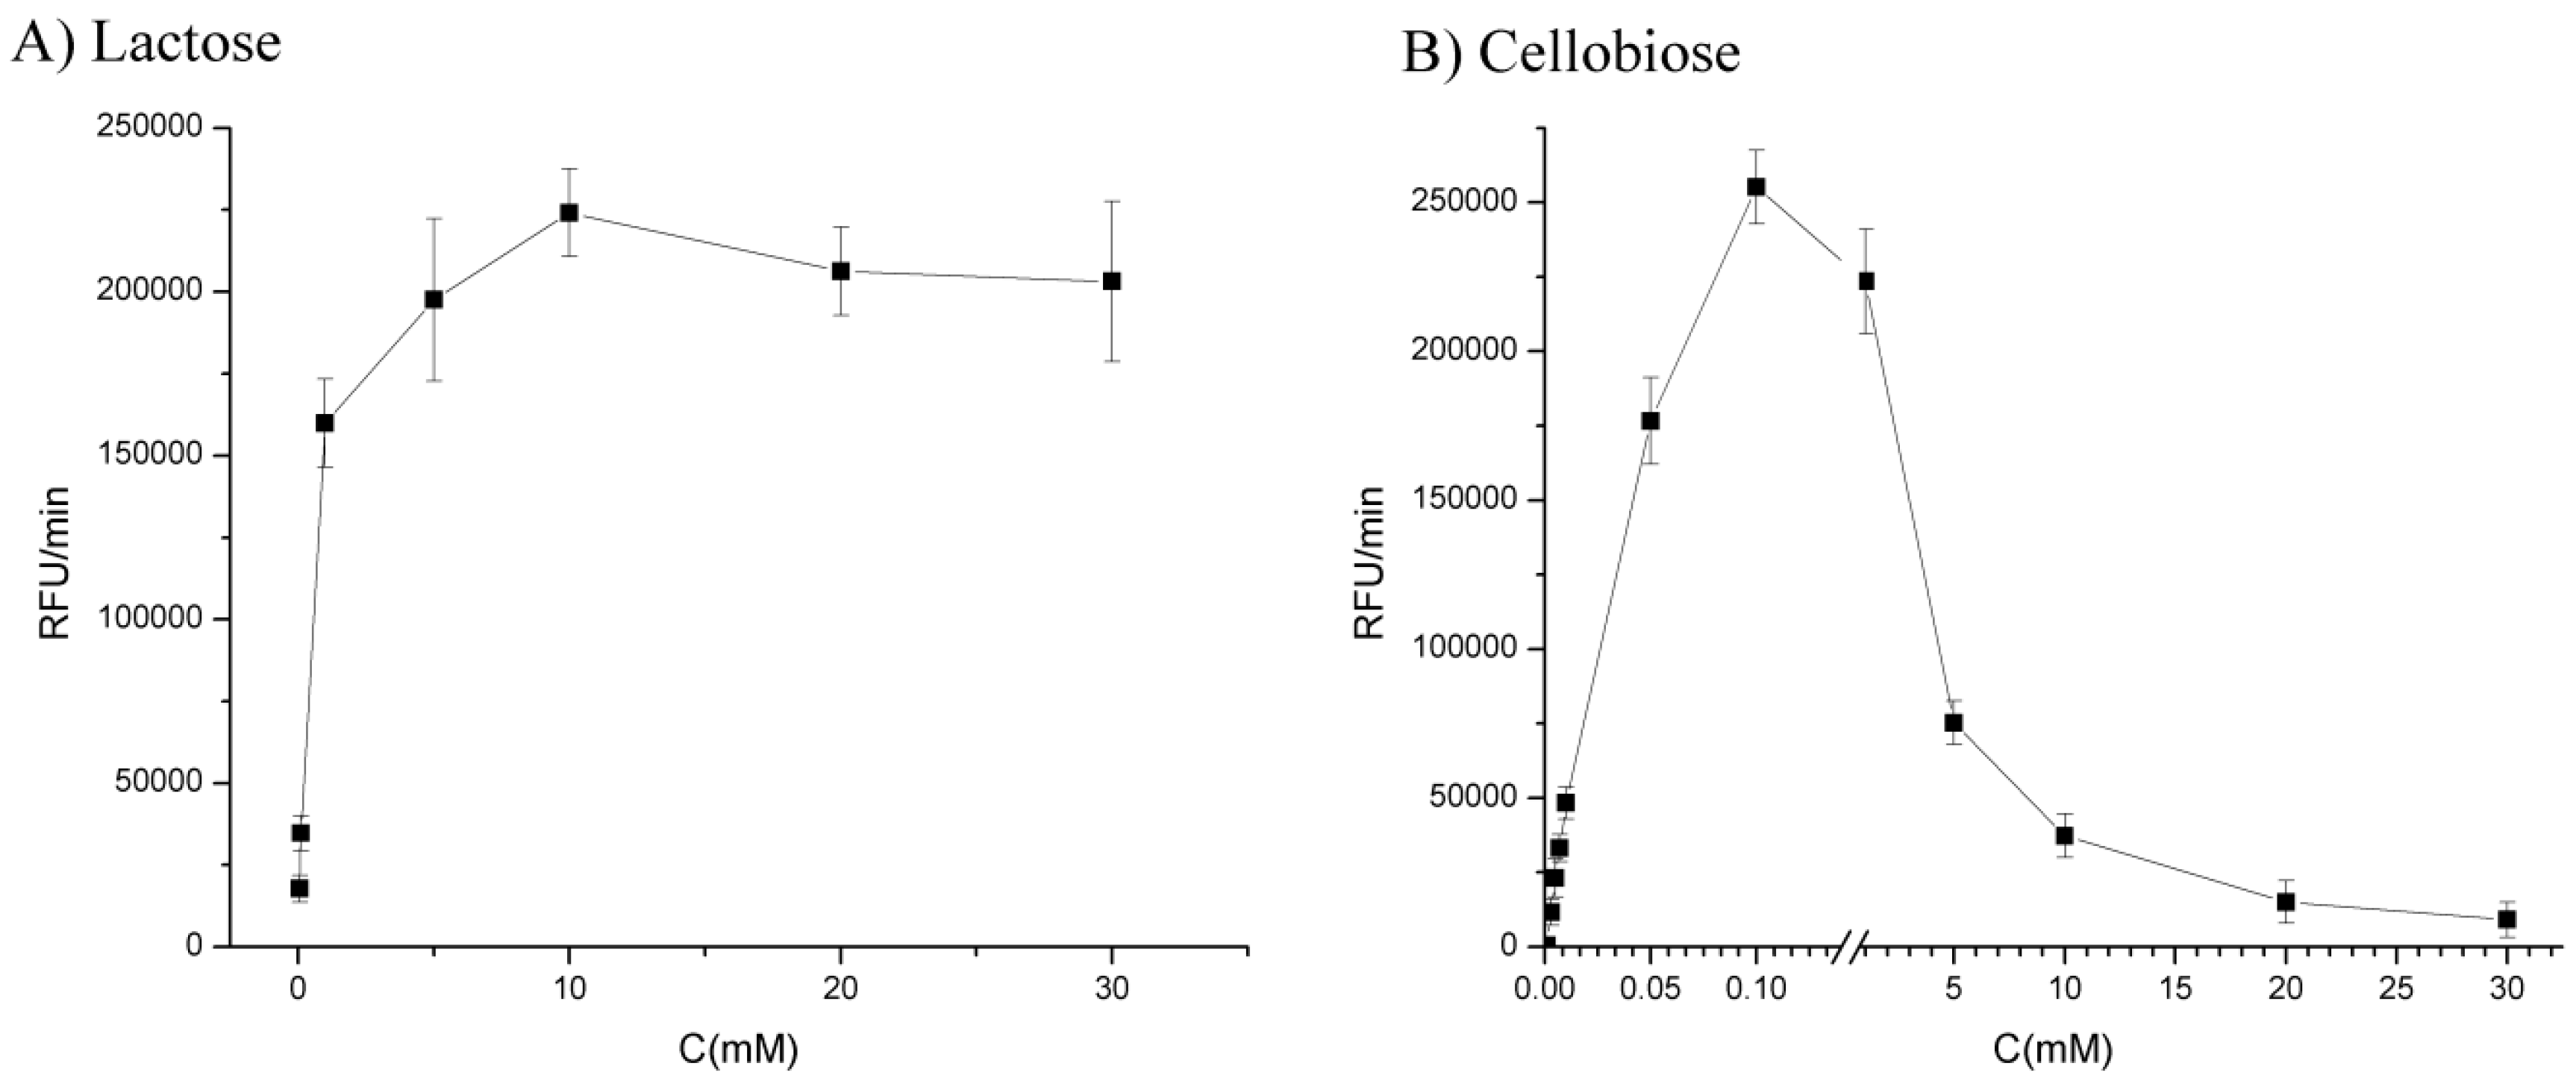
3.1.3. Optimization of Substrate Concentration
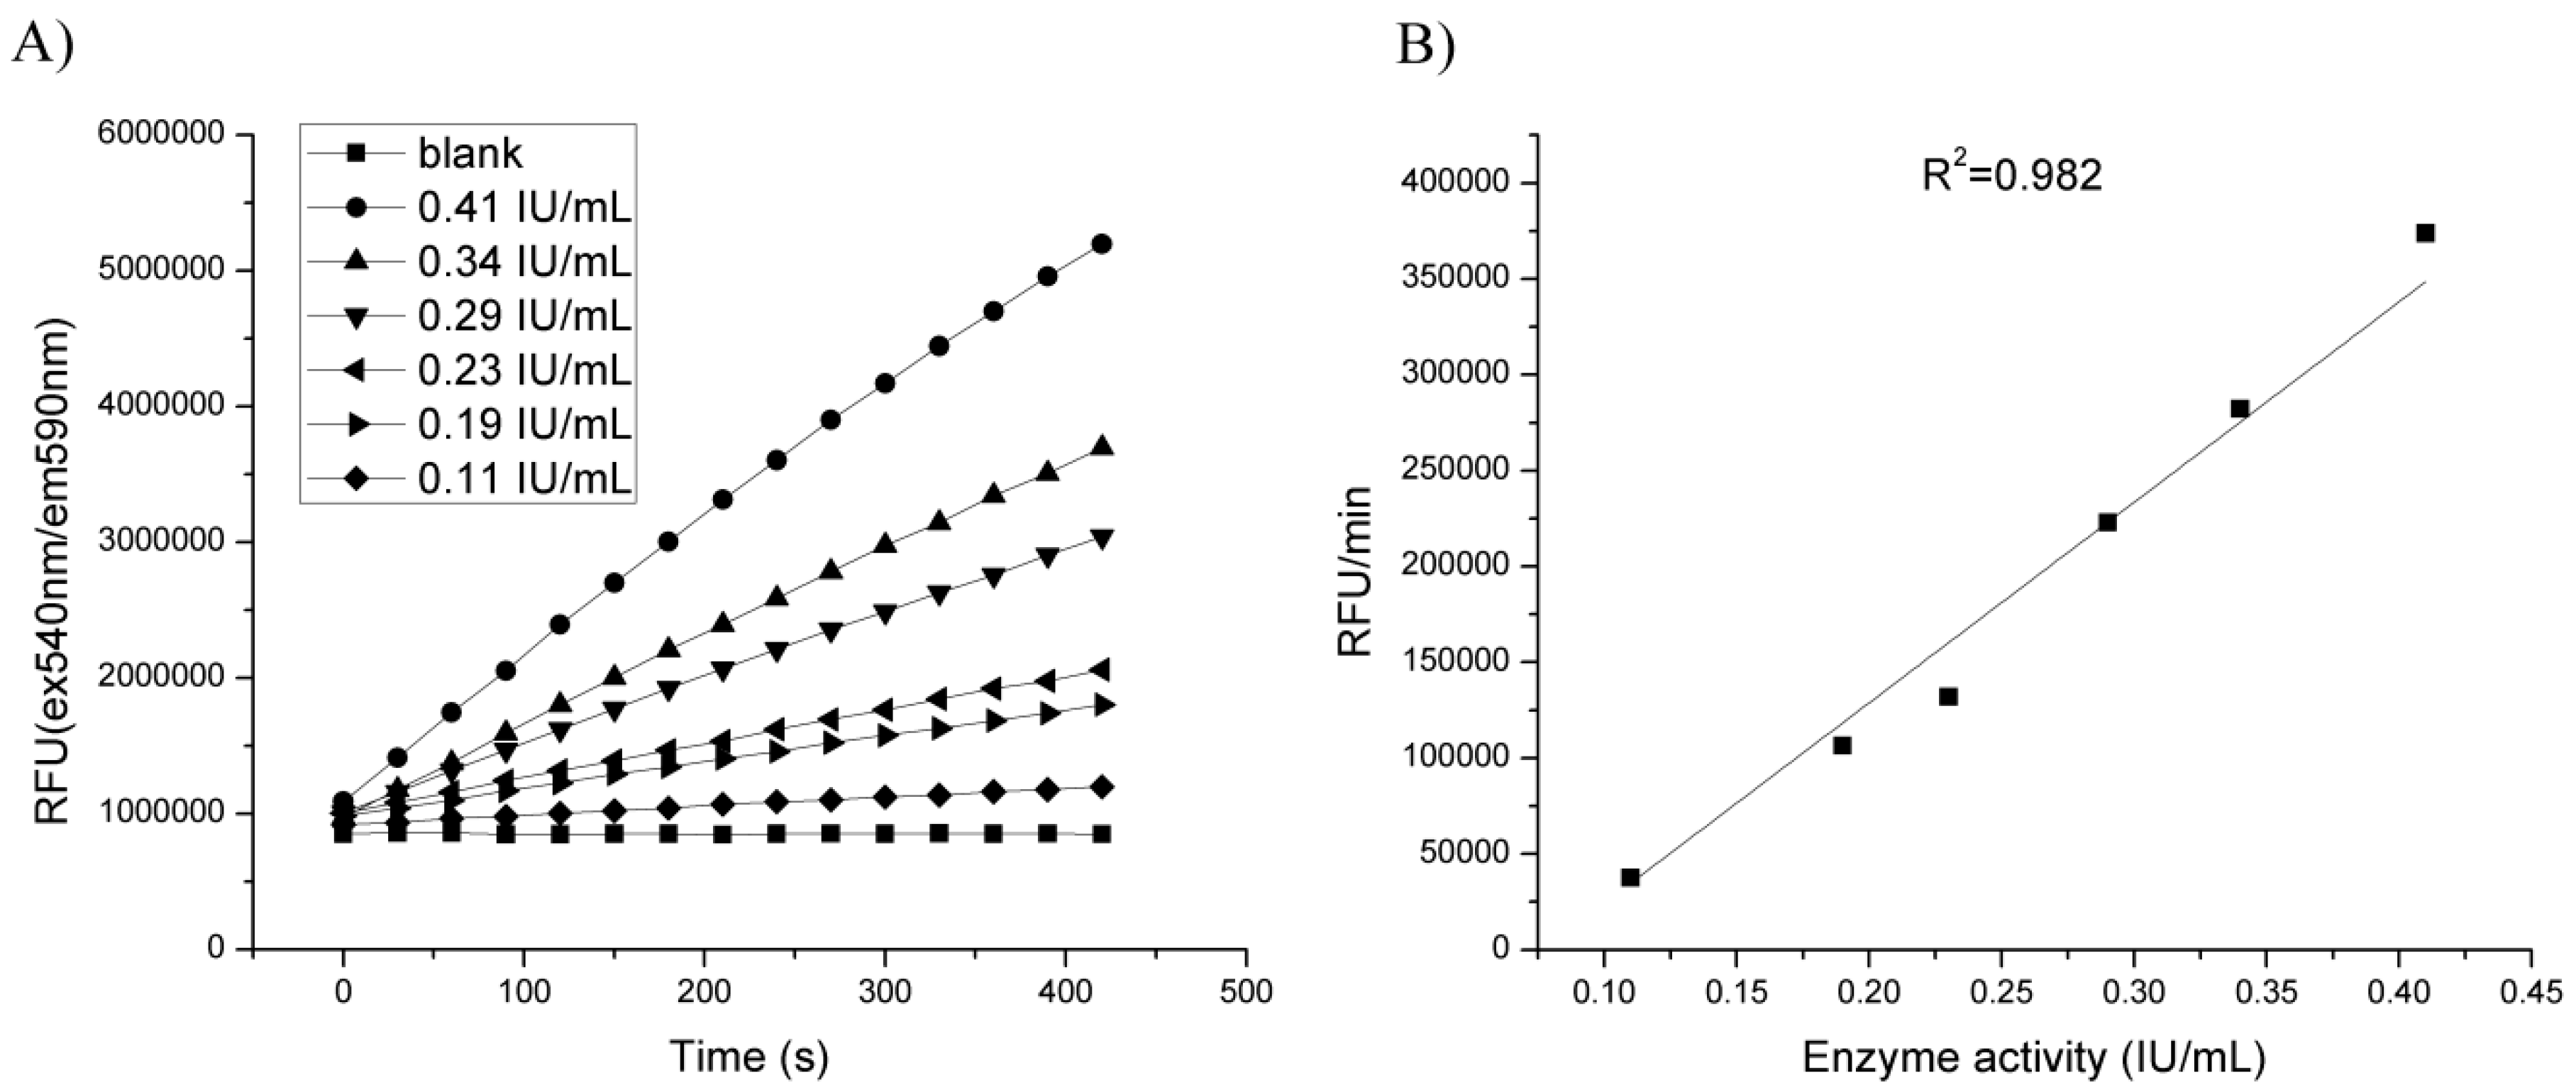
3.1.4. Influence of Enzyme Amount
3.2. Optimization of Resazurin Fluorescence Assay with CDH Expressed on the Surface of Yeast Cells
3.2.1. Expression of CDH on the Surface of Yeast Cells
3.2.2. Influence of Substrate Concentration
3.2.3. Influence of Yeast Cells Density
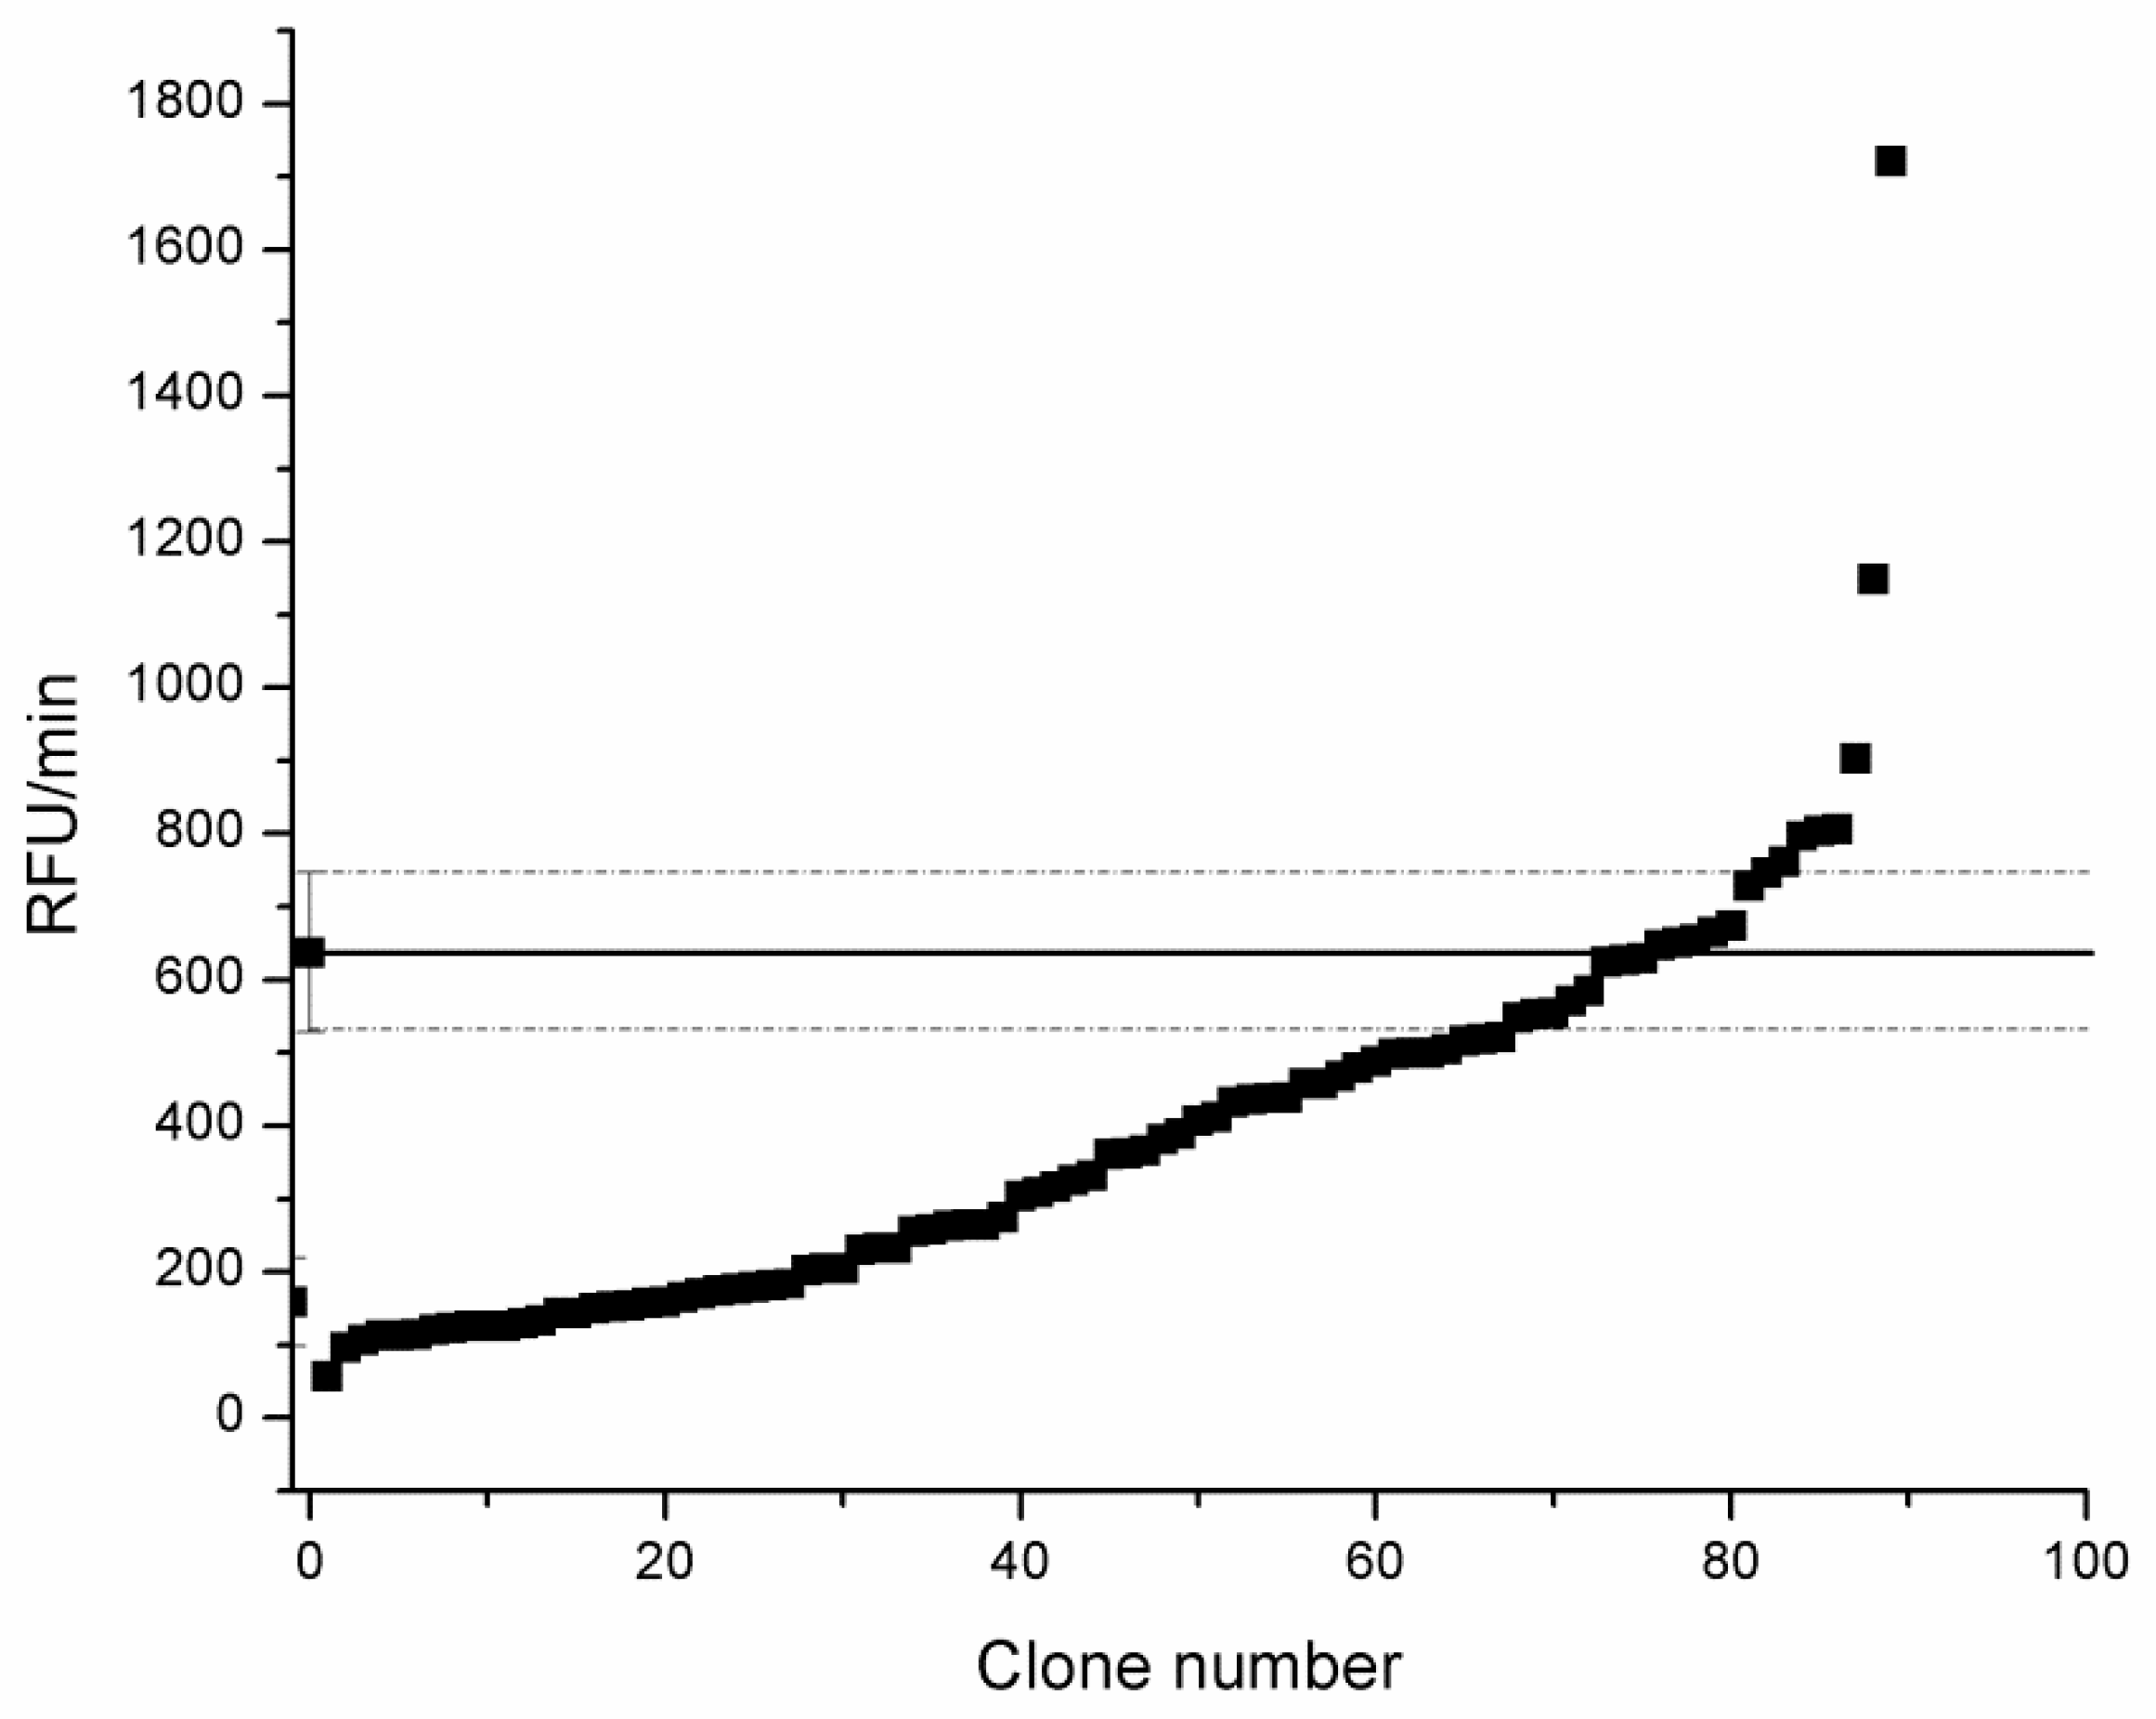
3.2.4. Screening of tmCDH Gene Library in MTP by Resazurin Assay
3.3. Kinetic Characterization of CDH Mutants on the Surface of Yeast Cells
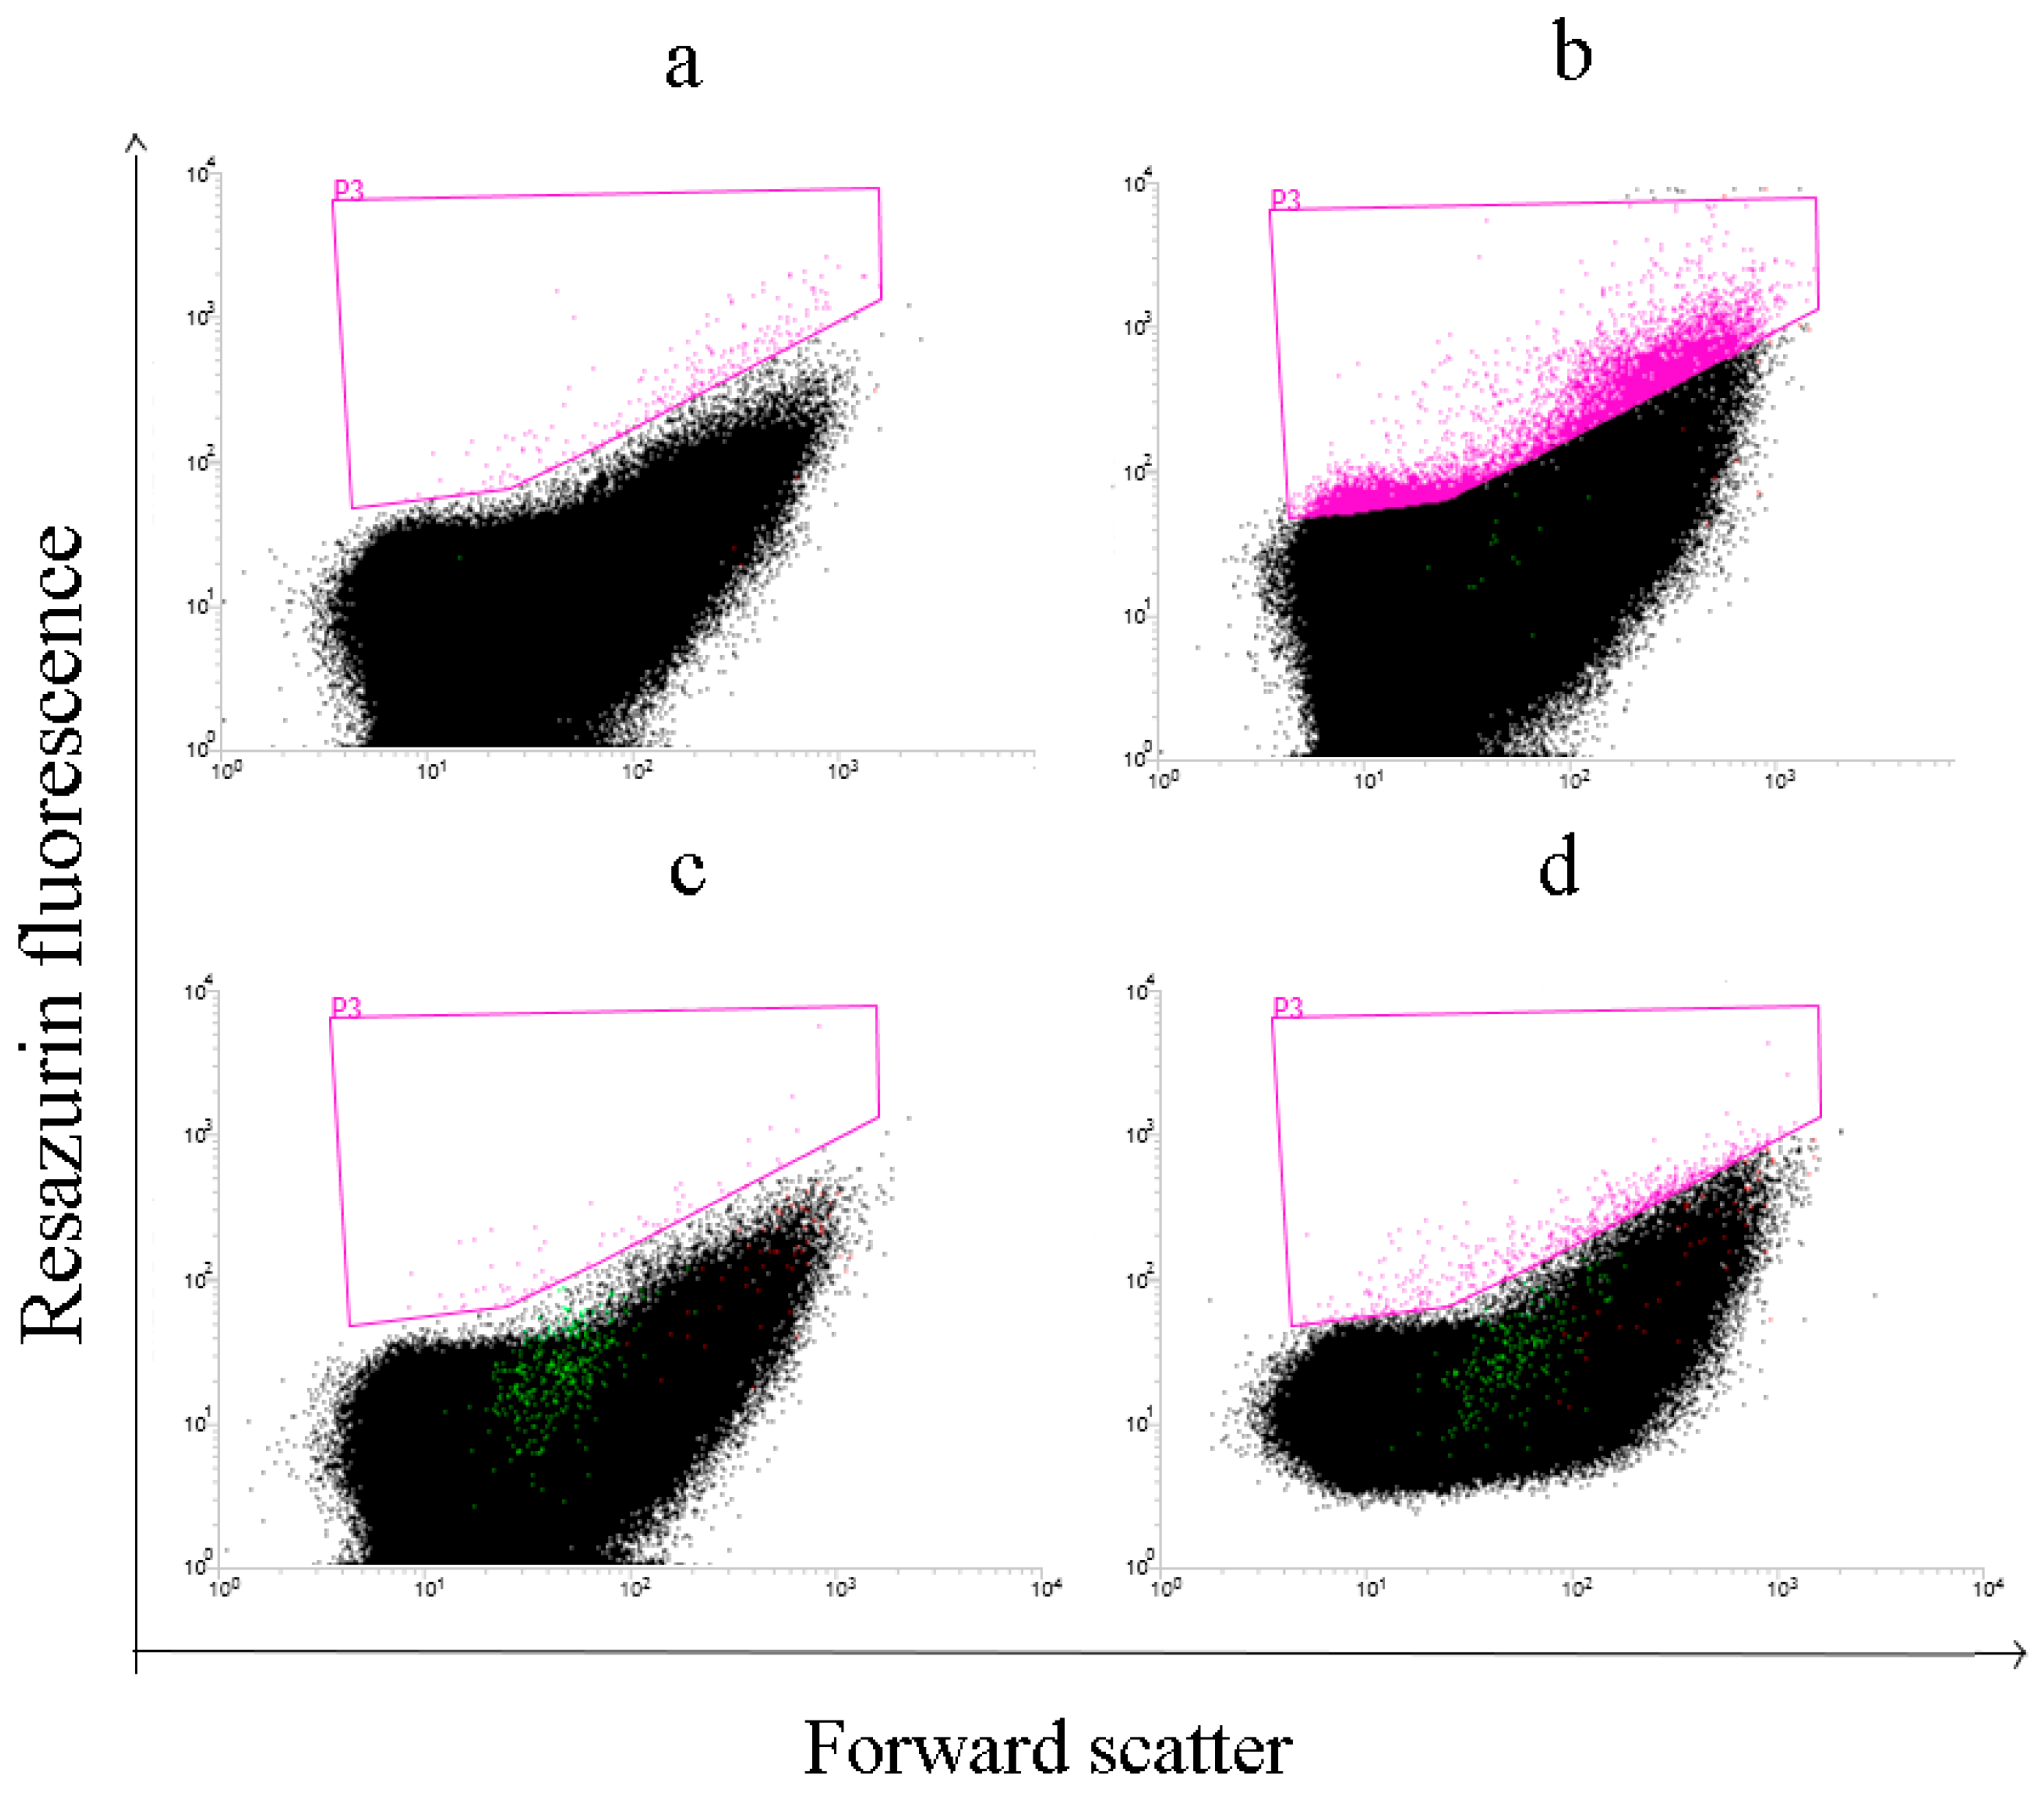
3.4. Detection of CDH by Flow Cytometry
4. Discussion
5. Conclusions
Supplementary Materials
Author Contributions
Funding
Acknowledgments
Conflicts of Interest
References
- Cameron, M.D.; Aust, S.D. Cellobiose dehydrogenase-an extracellular fungal flavocytochrome. Enzyme Microb. Technol. 2001, 28, 129–138. [Google Scholar] [CrossRef]
- Henriksson, G.; Johansson, G.; Pettersson, G. A critical review of cellobiose dehydrogenases. J. Biotechnol. 2000, 78, 93–113. [Google Scholar] [CrossRef]
- Zamocky, M.; Ludwig, R.; Peterbauer, C.; Hallberg, B.M.; Divne, C.; Nicholls, P.; Haltrich, D. Cellobiose dehydrogenase—A flavocytochrome from wood-degrading, phytopathogenic and saprotropic fungi. Curr. Protein Pept. Sci. 2006, 7, 255–280. [Google Scholar] [CrossRef] [PubMed]
- Ludwig, R.; Ortiz, R.; Schulz, C.; Harreither, W.; Sygmund, C.; Gorton, L. Cellobiose dehydrogenase modified electrodes: Advances by materials science and biochemical engineering. Anal. Bioanal. Chem. 2013, 405, 3637–3658. [Google Scholar] [CrossRef]
- Ludwig, R.; Harreither, W.; Tasca, F.; Gorton, L. Cellobiose dehydrogenase: a versatile catalyst for electrochemical applications. Chemphyschem 2010, 11, 2674–2697. [Google Scholar] [CrossRef]
- Ludwig, R.; Ozga, M.; Zámocky, M.; Peterbauer, C.; Kulbe, K.D.; Haltrich, D. Continuous Enzymatic Regeneration of Electron Acceptors Used by Flavoenzymes: Cellobiose Dehydrogenase-Catalyzed Production of Lactobionic Acid as an Example. Biocatal. Biotransfor. 2004, 22, 97–104. [Google Scholar] [CrossRef]
- Ciullini, I.; Tilli, S.; Scozzafava, A.; Briganti, F. Fungal laccase, cellobiose dehydrogenase, and chemical mediators: combined actions for the decolorization of different classes of textile dyes. Bioresour. Technol. 2008, 99, 7003–7010. [Google Scholar] [CrossRef]
- Traxlmayr, M.W.; Obinger, C. Directed evolution of proteins for increased stability and expression using yeast display. Arch. Biochem. Biophys. 2012, 526, 174–180. [Google Scholar] [CrossRef] [PubMed]
- McCafferty, J.; Griffiths, A.D.; Winter, G.; Chiswell, D.J. Phage antibodies: filamentous phage displaying antibody variable domains. Nature 1990, 348, 552–554. [Google Scholar] [CrossRef]
- Francisco, J.A.; Campbell, R.; Iverson, B.L.; Georgiou, G. Production and fluorescence-activated cell sorting of Escherichia coli expressing a functional antibody fragment on the external surface. Proc. Natl. Acad. Sci. USA 1993, 90, 10444–10448. [Google Scholar] [CrossRef] [PubMed]
- Antipov, E.; Cho, A.E.; Wittrup, K.D.; Klibanov, A.M. Highly L and D enantioselective variants of horseradish peroxidase discovered by an ultrahigh-throughput selection method. Proc. Natl. Acad. Sci. USA 2008, 105, 17694–17699. [Google Scholar] [CrossRef] [PubMed]
- Beerli, R.R.; Bauer, M.; Buser, R.B.; Gwerder, M.; Muntwiler, S.; Maurer, P.; Saudan, P.; Bachmann, M.F. Isolation of human monoclonal antibodies by mammalian cell display. Proc. Natl. Acad. Sci. USA 2008, 105, 14336–14341. [Google Scholar] [CrossRef]
- Cherf, G.M.; Cochran, J.R. Applications of Yeast Surface Display for Protein Engineering. Methods Mol. Biol. 2015, 1319, 155–175. [Google Scholar] [CrossRef] [PubMed]
- Cohen, N.; Abramov, S.; Dror, Y.; Freeman, A. In vitro enzyme evolution: the screening challenge of isolating the one in a million. Trends Biotechnol. 2001, 19, 507–510. [Google Scholar] [CrossRef]
- Lin, H.; Cornish, V.W. Screening and selection methods for large-scale analysis of protein function. Angew. Chem. Int. Ed. Engl. 2002, 41, 4402–4425. [Google Scholar] [CrossRef]
- Mastrobattista, E.; Taly, V.; Chanudet, E.; Treacy, P.; Kelly, B.T.; Griffiths, A.D. High-throughput screening of enzyme libraries: in vitro evolution of a beta-galactosidase by fluorescence-activated sorting of double emulsions. Chem. Biol. 2005, 12, 1291–1300. [Google Scholar] [CrossRef] [PubMed]
- Aharoni, A.; Amitai, G.; Bernath, K.; Magdassi, S.; Tawfik, D.S. High-throughput screening of enzyme libraries: thiolactonases evolved by fluorescence-activated sorting of single cells in emulsion compartments. Chem. Biol. 2005, 12, 1281–1289. [Google Scholar] [CrossRef] [PubMed]
- Georgiou, G. Analysis of large libraries of protein mutants using flow cytometry. Adv. Protein Chem. 2000, 55, 293–315. [Google Scholar]
- Guerin, T.F.; Mondido, M.; McClenn, B.; Peasley, B. Application of resazurin for estimating abundance of contaminant-degrading micro-organisms. Lett. Appl. Microbiol. 2001, 32, 340–345. [Google Scholar] [CrossRef] [PubMed]
- Twigg, R.S. Oxidation-Reduction Aspects of Resazurin. Nature 1945, 155, 401. [Google Scholar] [CrossRef]
- Pfaller, M.A.; Barry, A.L. Evaluation of a novel colorimetric broth microdilution method for antifungal susceptibility testing of yeast isolates. J. Clin. Microbiol. 1994, 32, 1992–1996. [Google Scholar]
- Peeters, E.; Nelis, H.J.; Coenye, T. Comparison of multiple methods for quantification of microbial biofilms grown in microtiter plates. J. Microbiol. Methods 2008, 72, 157–165. [Google Scholar] [CrossRef]
- Mariscal, A.; Lopez-Gigosos, R.M.; Carnero-Varo, M.; Fernandez-Crehuet, J. Fluorescent assay based on resazurin for detection of activity of disinfectants against bacterial biofilm. Appl. Microbiol. Biotechnol. 2009, 82, 773–783. [Google Scholar] [CrossRef]
- O’Brien, J.; Wilson, I.; Orton, T.; Pognan, F. Investigation of the Alamar Blue (resazurin) fluorescent dye for the assessment of mammalian cell cytotoxicity. Eur. J. Biochem. 2000, 267, 5421–5426. [Google Scholar] [CrossRef]
- Chao, G.; Lau, W.L.; Hackel, B.J.; Sazinsky, S.L.; Lippow, S.M.; Wittrup, K.D. Isolating and engineering human antibodies using yeast surface display. Nat. Protoc. 2006, 1, 755–768. [Google Scholar] [CrossRef]
- Yoshida, M.; Ohira, T.; Igarashi, K.; Nagasawa, H.; Aida, K.; Hallberg, B.M.; Divne, C.; Nishino, T.; Samejima, M. Production and characterization of recombinant Phanerochaete chrysosporium cellobiose dehydrogenase in the methylotrophic yeast Pichia pastoris. Biosci. Biotechnol. Biochem. 2001, 65, 2050–2057. [Google Scholar] [CrossRef]
- Baminger, U.; Nidetzky, B.; Kulbe, K.D.; Haltrich, D. A simple assay for measuring cellobiose dehydrogenase activity in the presence of laccase. J. Microbiol. Methods 1999, 35, 253–259. [Google Scholar] [CrossRef]
- Gietz, R.D.; Schiestl, R.H. High-efficiency yeast transformation using the LiAc/SS carrier DNA/PEG method. Nat. Protoc. 2007, 2, 31–34. [Google Scholar] [CrossRef]
- Rampersad, S.N. Multiple Applications of Alamar Blue as an Indicator of Metabolic Function and Cellular Health in Cell Viability Bioassays. Sensors 2012, 12, 12347–12360. [Google Scholar] [CrossRef] [PubMed]
- Blazic, M.; Kovacevic, G.; Prodanovic, O.; Ostafe, R.; Gavrovic-Jankulovic, M.; Fischer, R.; Prodanovic, R. Yeast surface display for the expression, purification and characterization of wild-type and B11 mutant glucose oxidases. Protein Expr. Purif. 2013, 89, 175–180. [Google Scholar] [CrossRef]
- Gibson, Q.H.; Swoboda, B.E.; Massey, V. Kinetics and Mechanism of Action of Glucose Oxidase. J. Biol. Chem. 1964, 239, 3927–3934. [Google Scholar]
- Ostafe, R.; Prodanovic, R.; Nazor, J.; Fischer, R. Ultra-High-Throughput Screening Method for the Directed Evolution of Glucose Oxidase. Chem. Biol. 2014, 21, 414–421. [Google Scholar] [CrossRef]
- Huang, D.; Shusta, E.V. Secretion and surface display of green fluorescent protein using the yeast Saccharomyces cerevisiae. Biotechnol. Progr. 2005, 21, 349–357. [Google Scholar] [CrossRef]
- Brugger, D.; Krondorfer, I.; Zahma, K.; Stoisser, T.; Bolivar, J.M.; Nidetzky, B.; Peterbauer, C.K.; Haltrich, D. Convenient microtiter plate-based, oxygen-independent activity assays for flavin-dependent oxidoreductases based on different redox dyes. Biotechnol. J. 2014, 9, 474–482. [Google Scholar] [CrossRef]
- Matsu-ura, S.; Yamauchi, Y.; Ohmori, H.; Maeda, H. Blood glucose determination with the reduction of resazurin as a fluorometric indicator reaction. Bunseki Kagaku 2002, 51, 111–115. [Google Scholar] [CrossRef]
- Bueno, C.; Villegas, M.L.; Bertolotti, S.G.; Previtali, C.M.; Neumann, M.G.; Encinas, M.V. The excited-state interaction of resazurin and resorufin with amines in aqueous solutions. Photophysics and photochemical reaction. Photochem. Photobiol. 2002, 76, 385–390. [Google Scholar] [CrossRef]
- Harreither, W.; Sygmund, C.; Augustin, M.; Narciso, M.; Rabinovich, M.L.; Gorton, L.; Haltrich, D.; Ludwig, R. Catalytic Properties and Classification of Cellobiose Dehydrogenases from Ascomycetes. Appl. Environ. Microbiol. 2011, 77, 1804–1815. [Google Scholar] [CrossRef]
- Caballero, I.; Lafuente, M.J.; Gamo, F.J.; Cid, C. A high-throughput fluorescence-based assay for Plasmodium dihydroorotate dehydrogenase inhibitor screening. Anal. Biochem. 2016, 506, 13–21. [Google Scholar] [CrossRef]
- Henriksson, G.; Sild, V.; Szabo, I.J.; Pettersson, G.; Johansson, G. Substrate specificity of cellobiose dehydrogenase from Phanerochaete chrysosporium. Biochim. Biophys. Acta Protein Struct. Molec. Enzym. 1998, 1383, 48–54. [Google Scholar] [CrossRef]


| Lactose | Lactose | Cellobiose | Cellobiose | Mutations | |
|---|---|---|---|---|---|
| Vmax (RFU × 105/OD·min) | Km (mM) | Vmax (RFU × 105/OD·min) | Km (µM) | ||
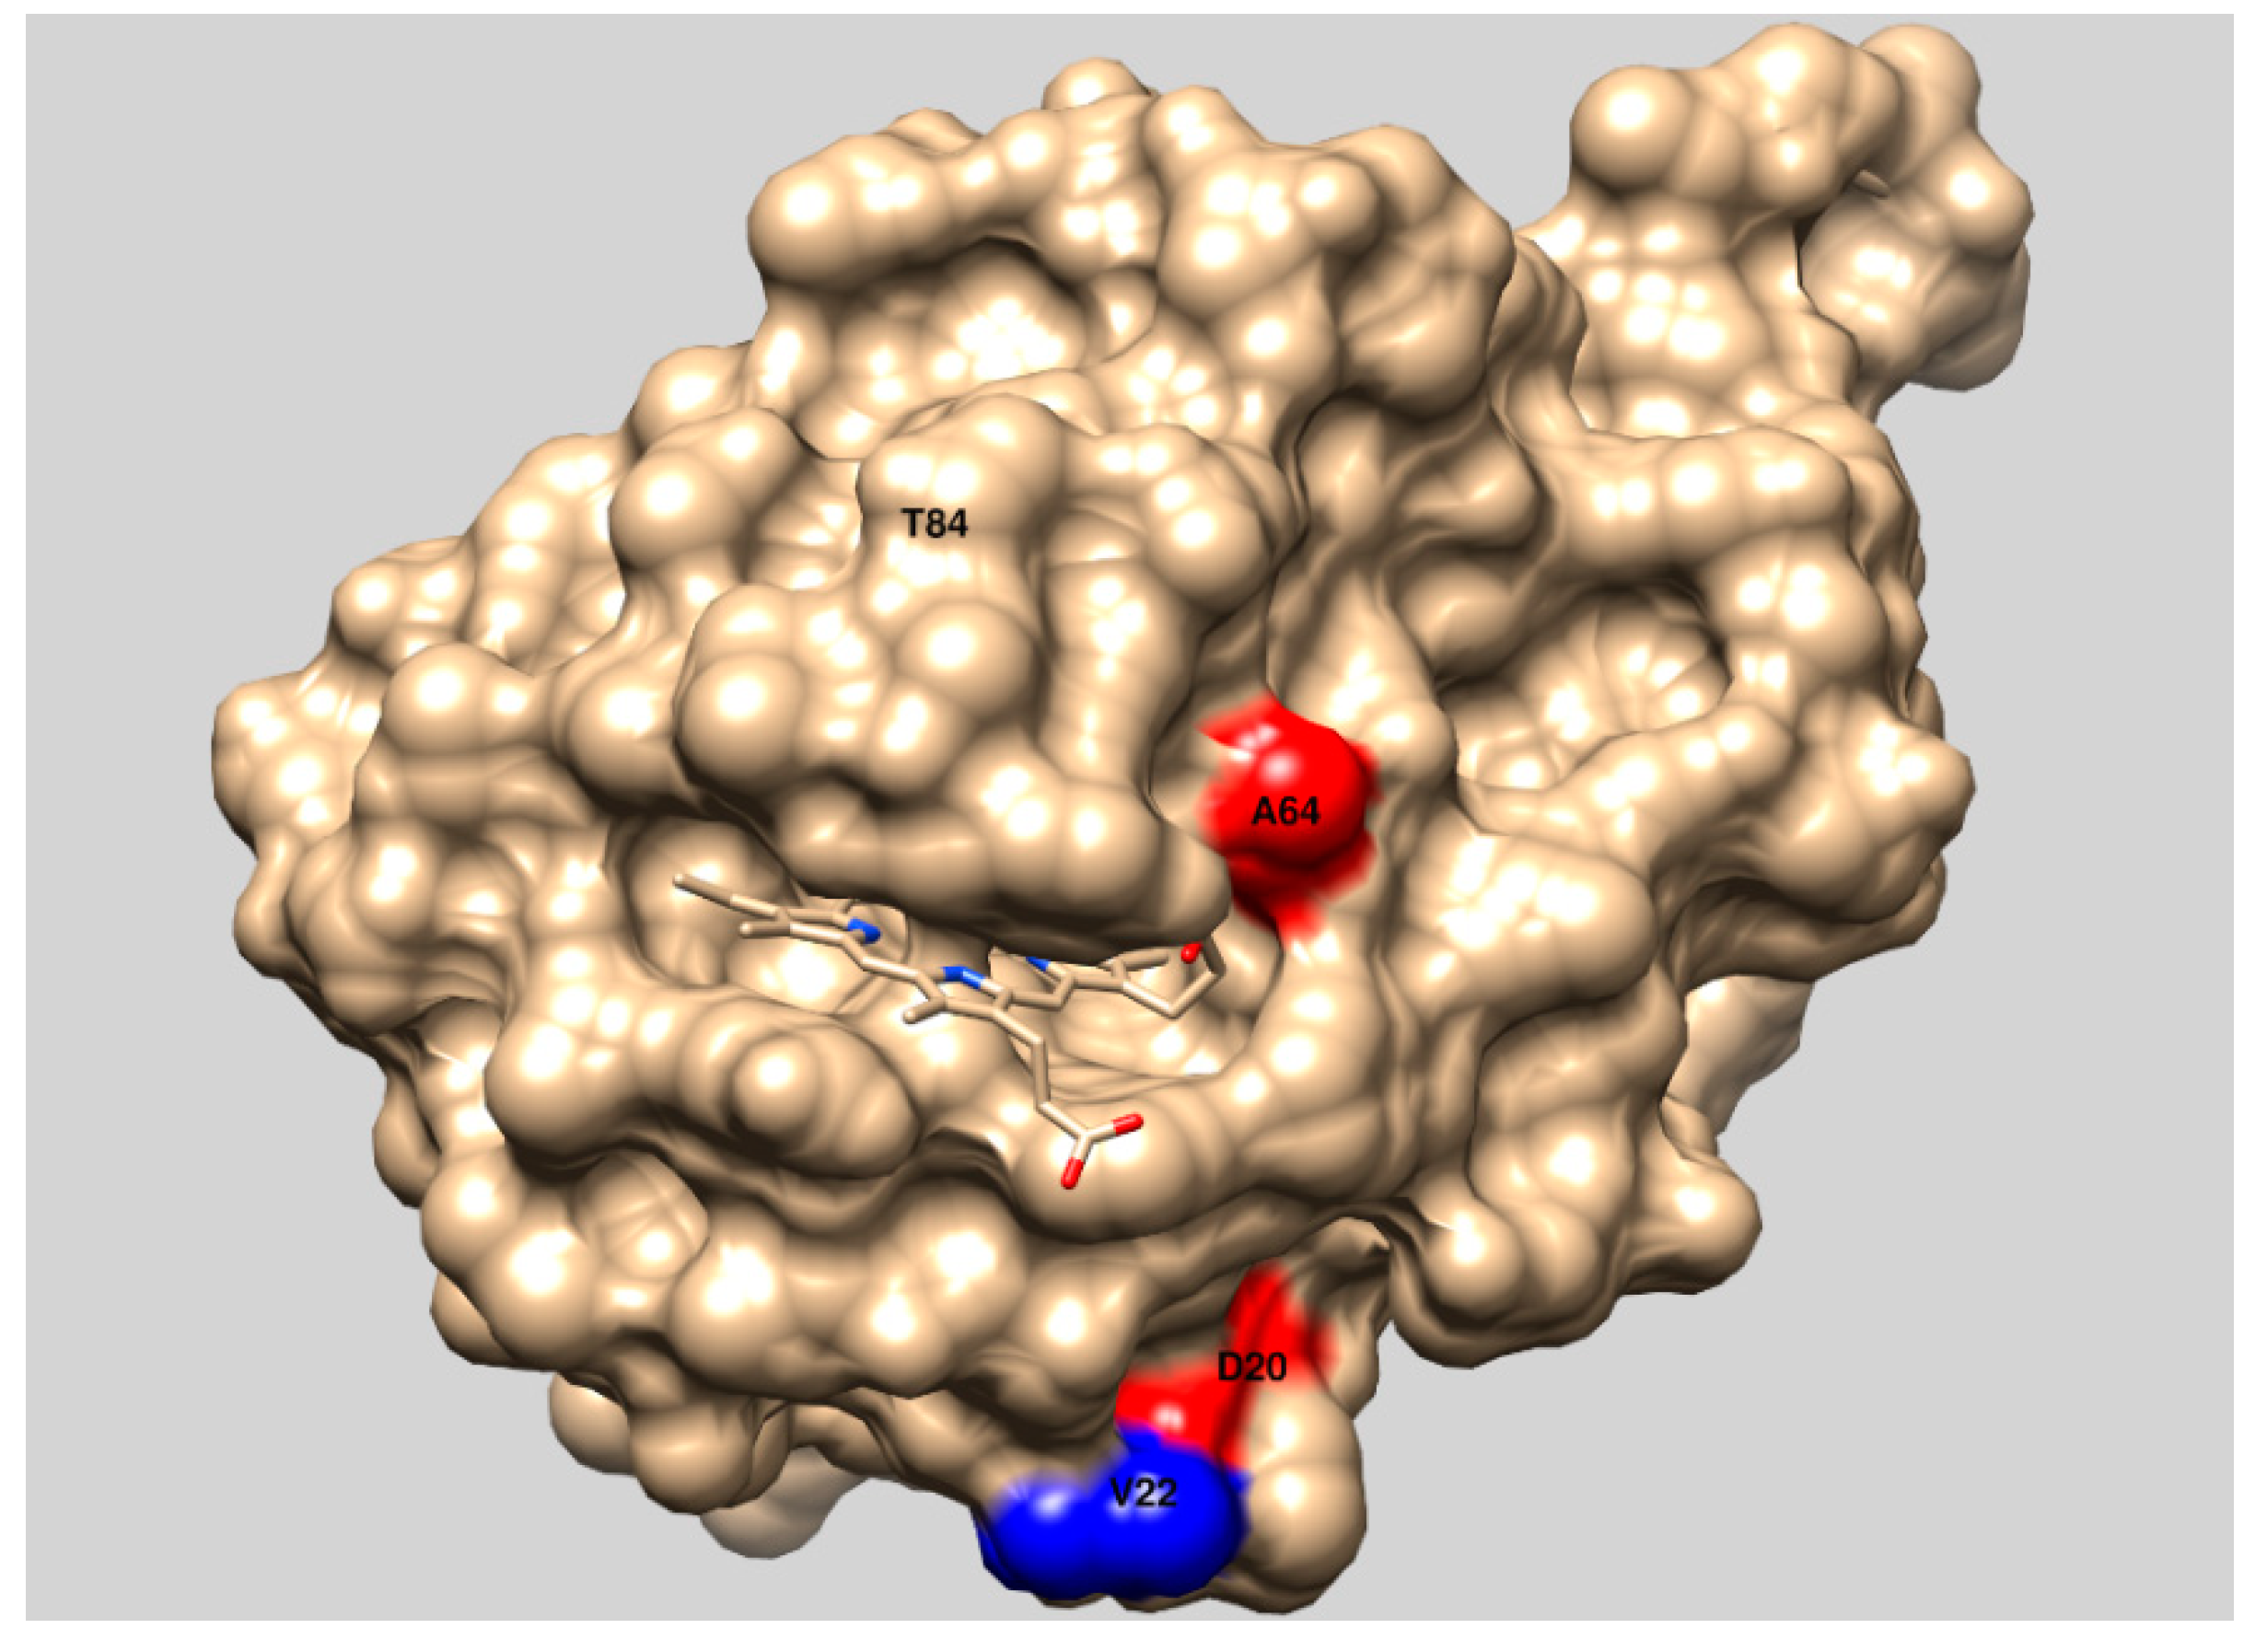
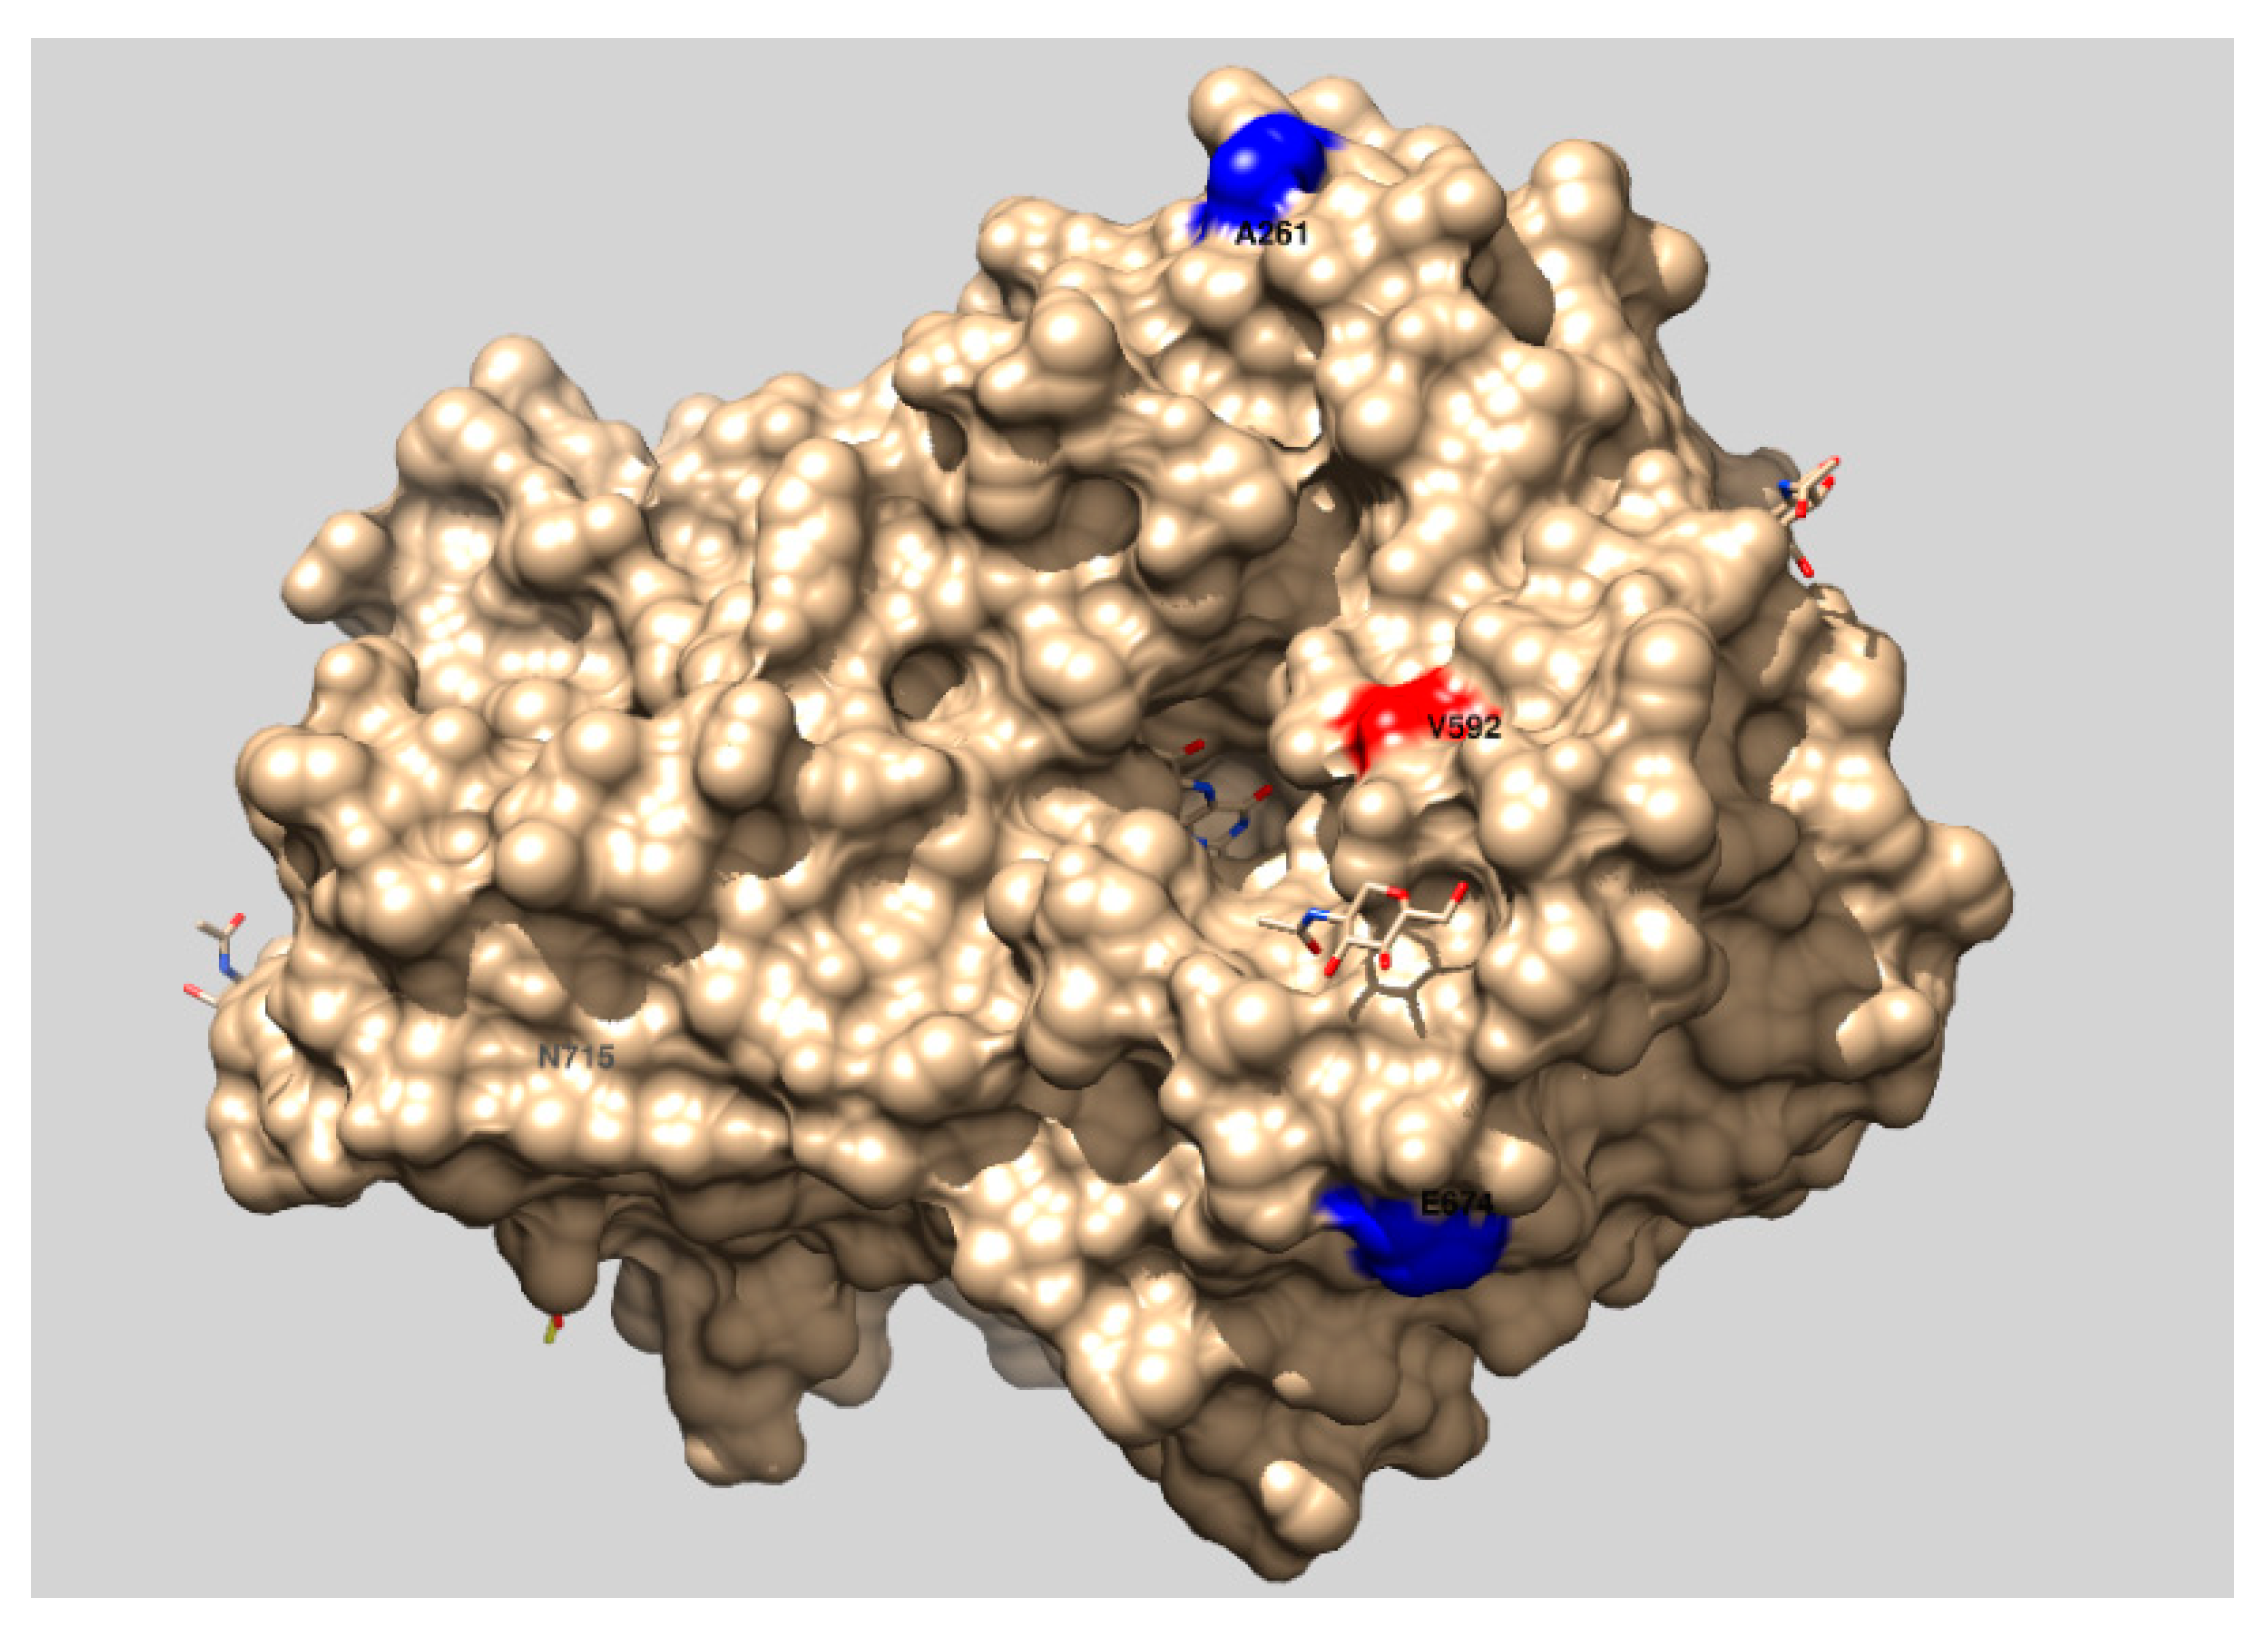
| tmCDH | 1.70 ± 0.11 | 0.144 ± 0.063 | 2.71 ± 0.05 | 2.7 ± 0.4 | D20N, A64T, V592M |
| H5 | 2.80 ± 0.16 | 0.225 ± 0.099 | 3.51 ± 0.18 | 5.5 ± 1.3 | D20N, A64T, V592M, V22A, T99T |
| H9 | 3.53 ± 0.24 | 0.654 ± 0.245 | 3.13 ± 0.16 | 4.5 ± 1.2 | D20N, A64T, V592M, T84A, A261P, E674G, N715S |
© 2019 by the authors. Licensee MDPI, Basel, Switzerland. This article is an open access article distributed under the terms and conditions of the Creative Commons Attribution (CC BY) license (http://creativecommons.org/licenses/by/4.0/).
Share and Cite
Blažić, M.; Balaž, A.M.; Prodanović, O.; Popović, N.; Ostafe, R.; Fischer, R.; Prodanović, R. Directed Evolution of Cellobiose Dehydrogenase on the Surface of Yeast Cells Using Resazurin-Based Fluorescent Assay. Appl. Sci. 2019, 9, 1413. https://doi.org/10.3390/app9071413
Blažić M, Balaž AM, Prodanović O, Popović N, Ostafe R, Fischer R, Prodanović R. Directed Evolution of Cellobiose Dehydrogenase on the Surface of Yeast Cells Using Resazurin-Based Fluorescent Assay. Applied Sciences. 2019; 9(7):1413. https://doi.org/10.3390/app9071413
Chicago/Turabian StyleBlažić, Marija, Ana Marija Balaž, Olivera Prodanović, Nikolina Popović, Raluca Ostafe, Rainer Fischer, and Radivoje Prodanović. 2019. "Directed Evolution of Cellobiose Dehydrogenase on the Surface of Yeast Cells Using Resazurin-Based Fluorescent Assay" Applied Sciences 9, no. 7: 1413. https://doi.org/10.3390/app9071413
APA StyleBlažić, M., Balaž, A. M., Prodanović, O., Popović, N., Ostafe, R., Fischer, R., & Prodanović, R. (2019). Directed Evolution of Cellobiose Dehydrogenase on the Surface of Yeast Cells Using Resazurin-Based Fluorescent Assay. Applied Sciences, 9(7), 1413. https://doi.org/10.3390/app9071413