Effects of Temperature on the Relationship between Mode-I Fracture Toughness and Tensile Strength of Rock


Abstract
:1. Introduction
2. Specimen Preparation and Test
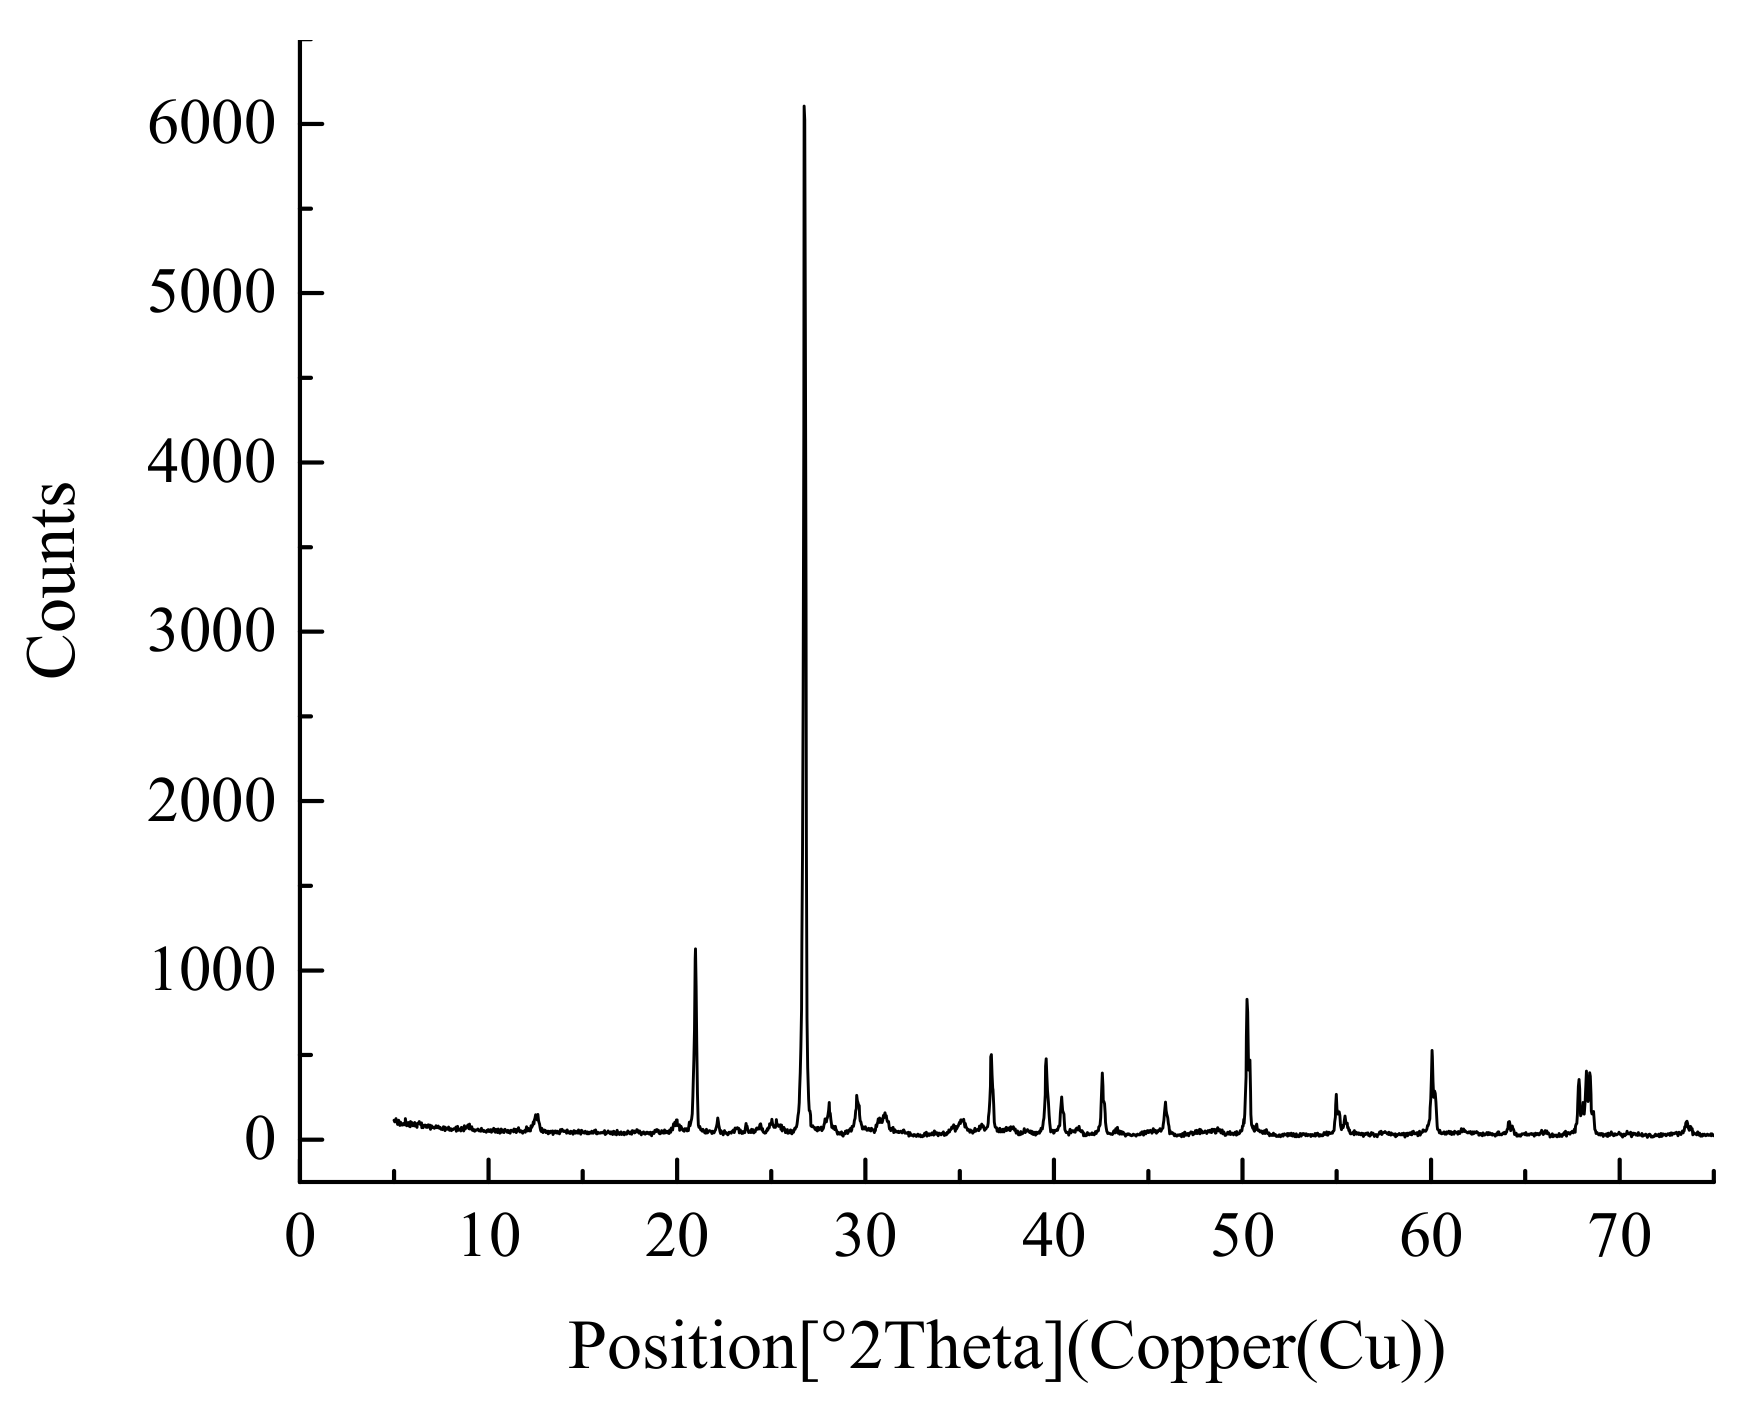
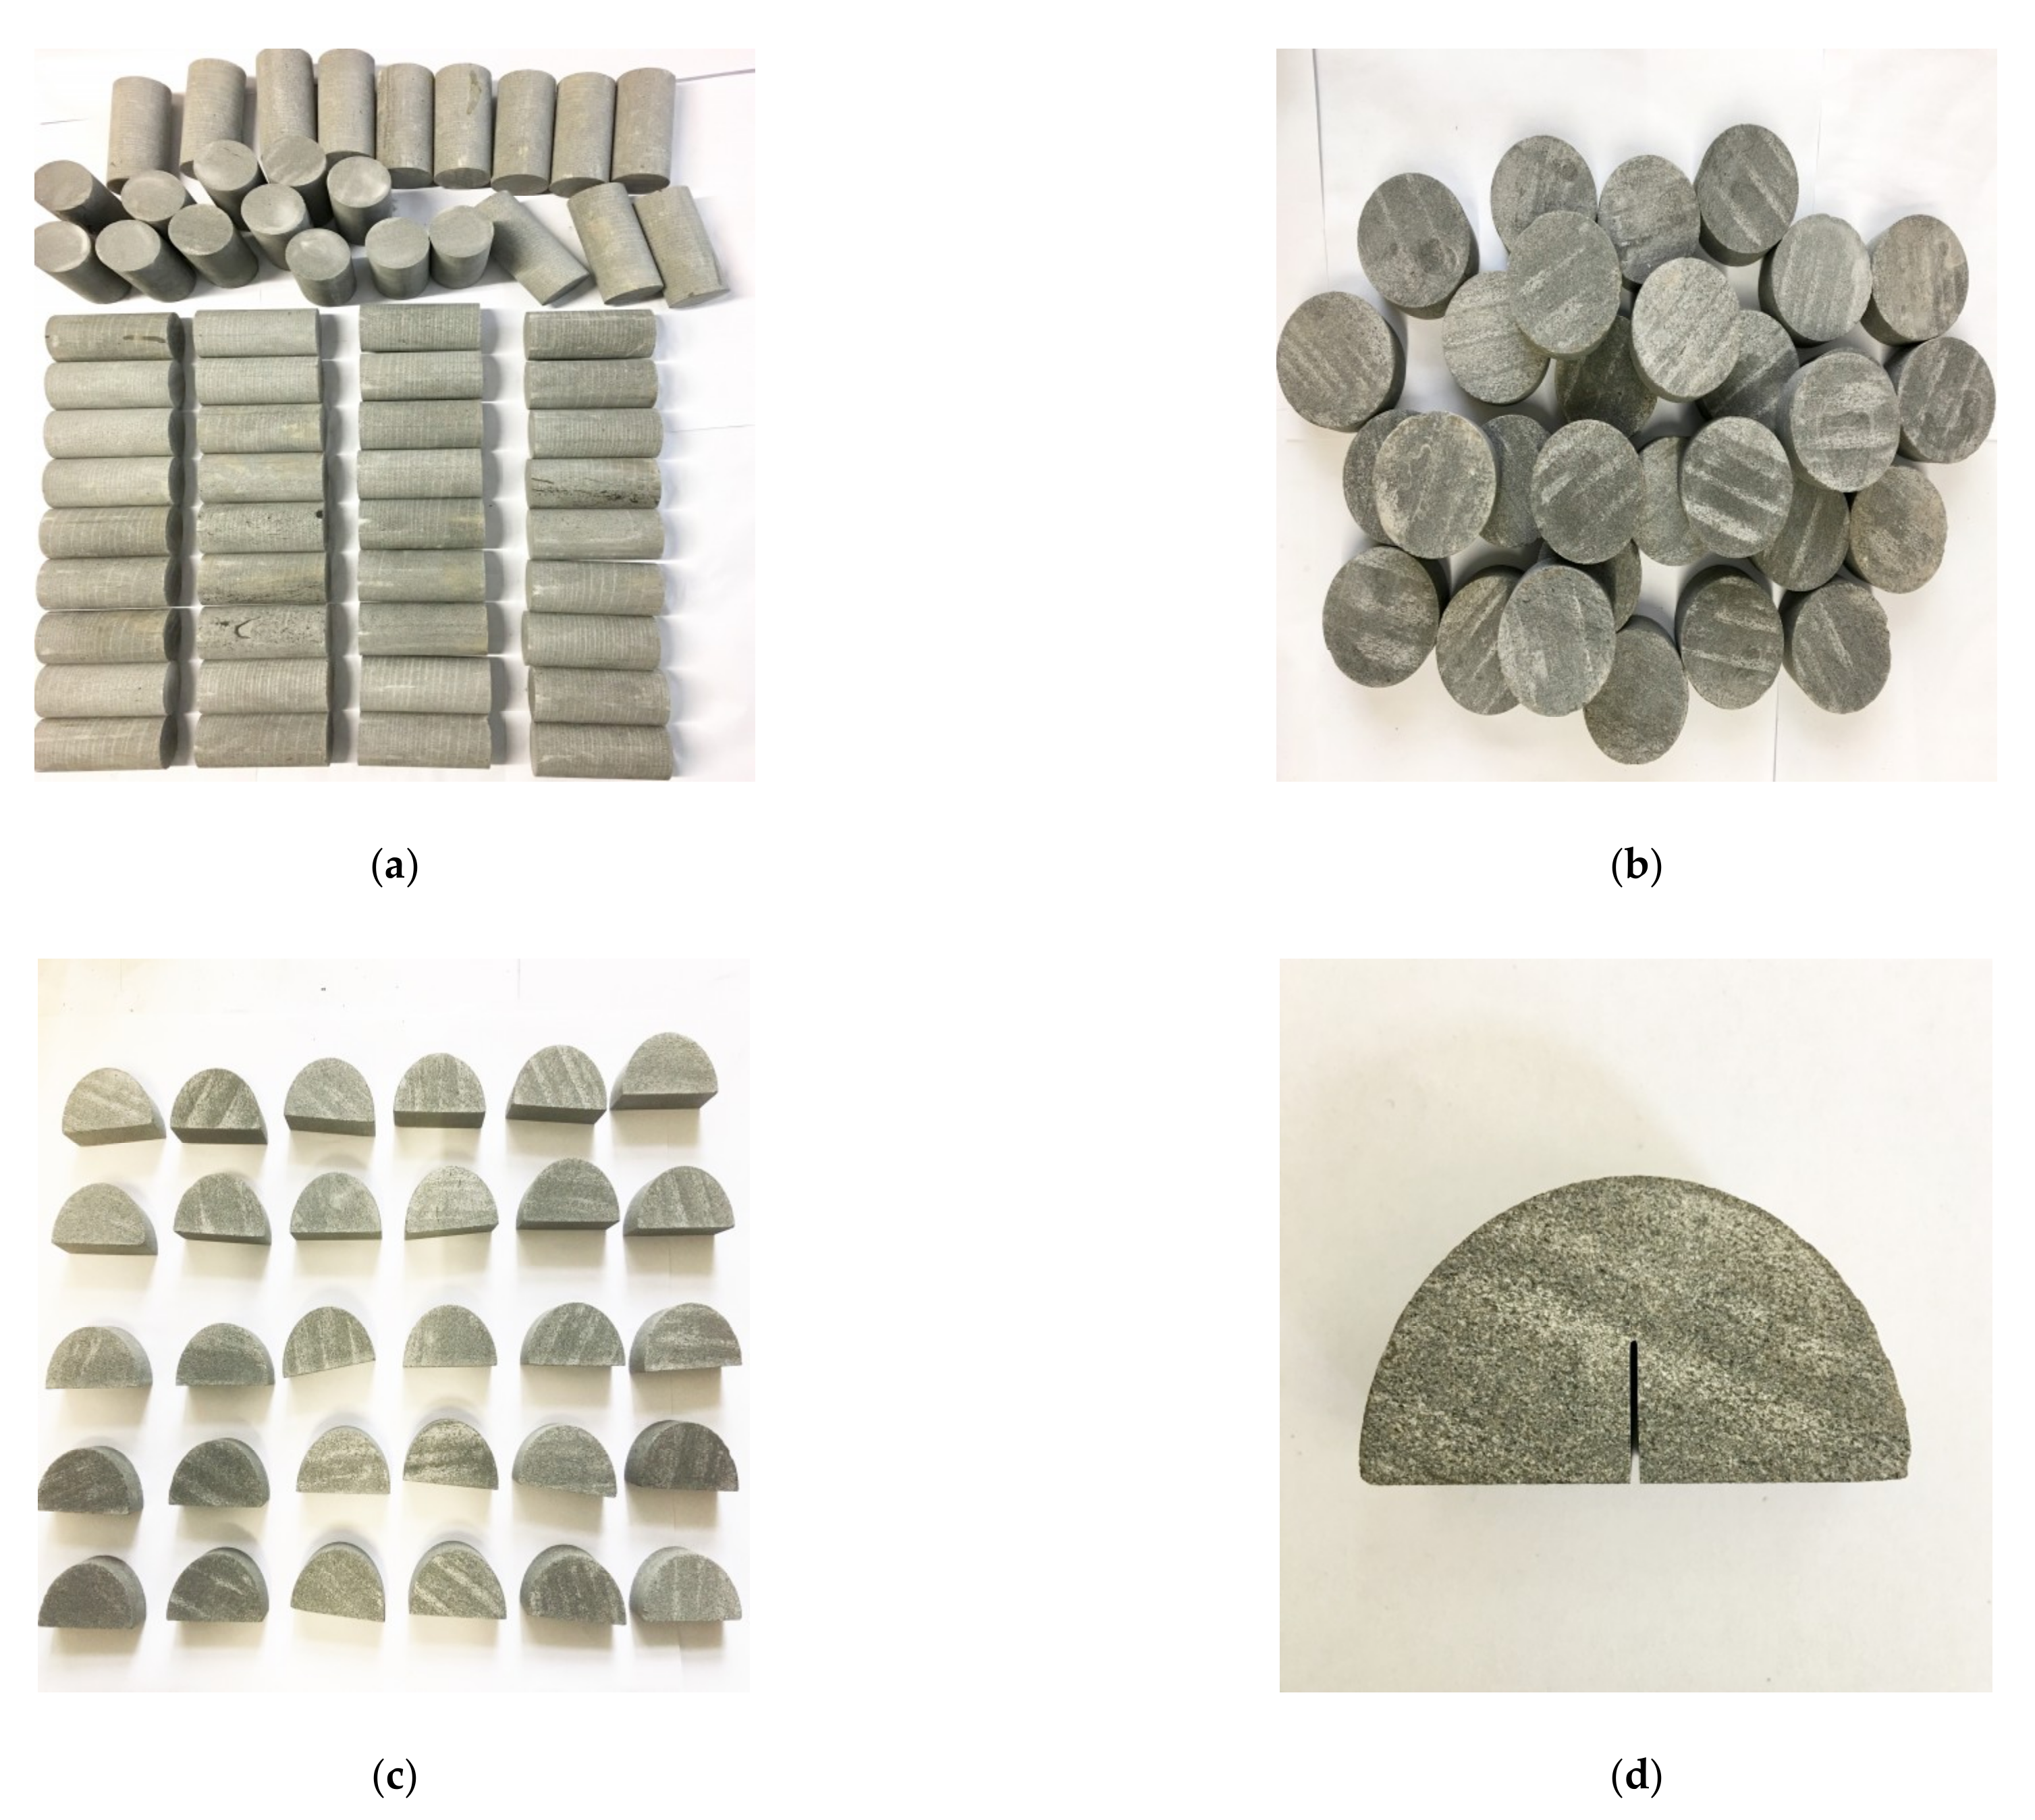
2.1. Specimen Preparation
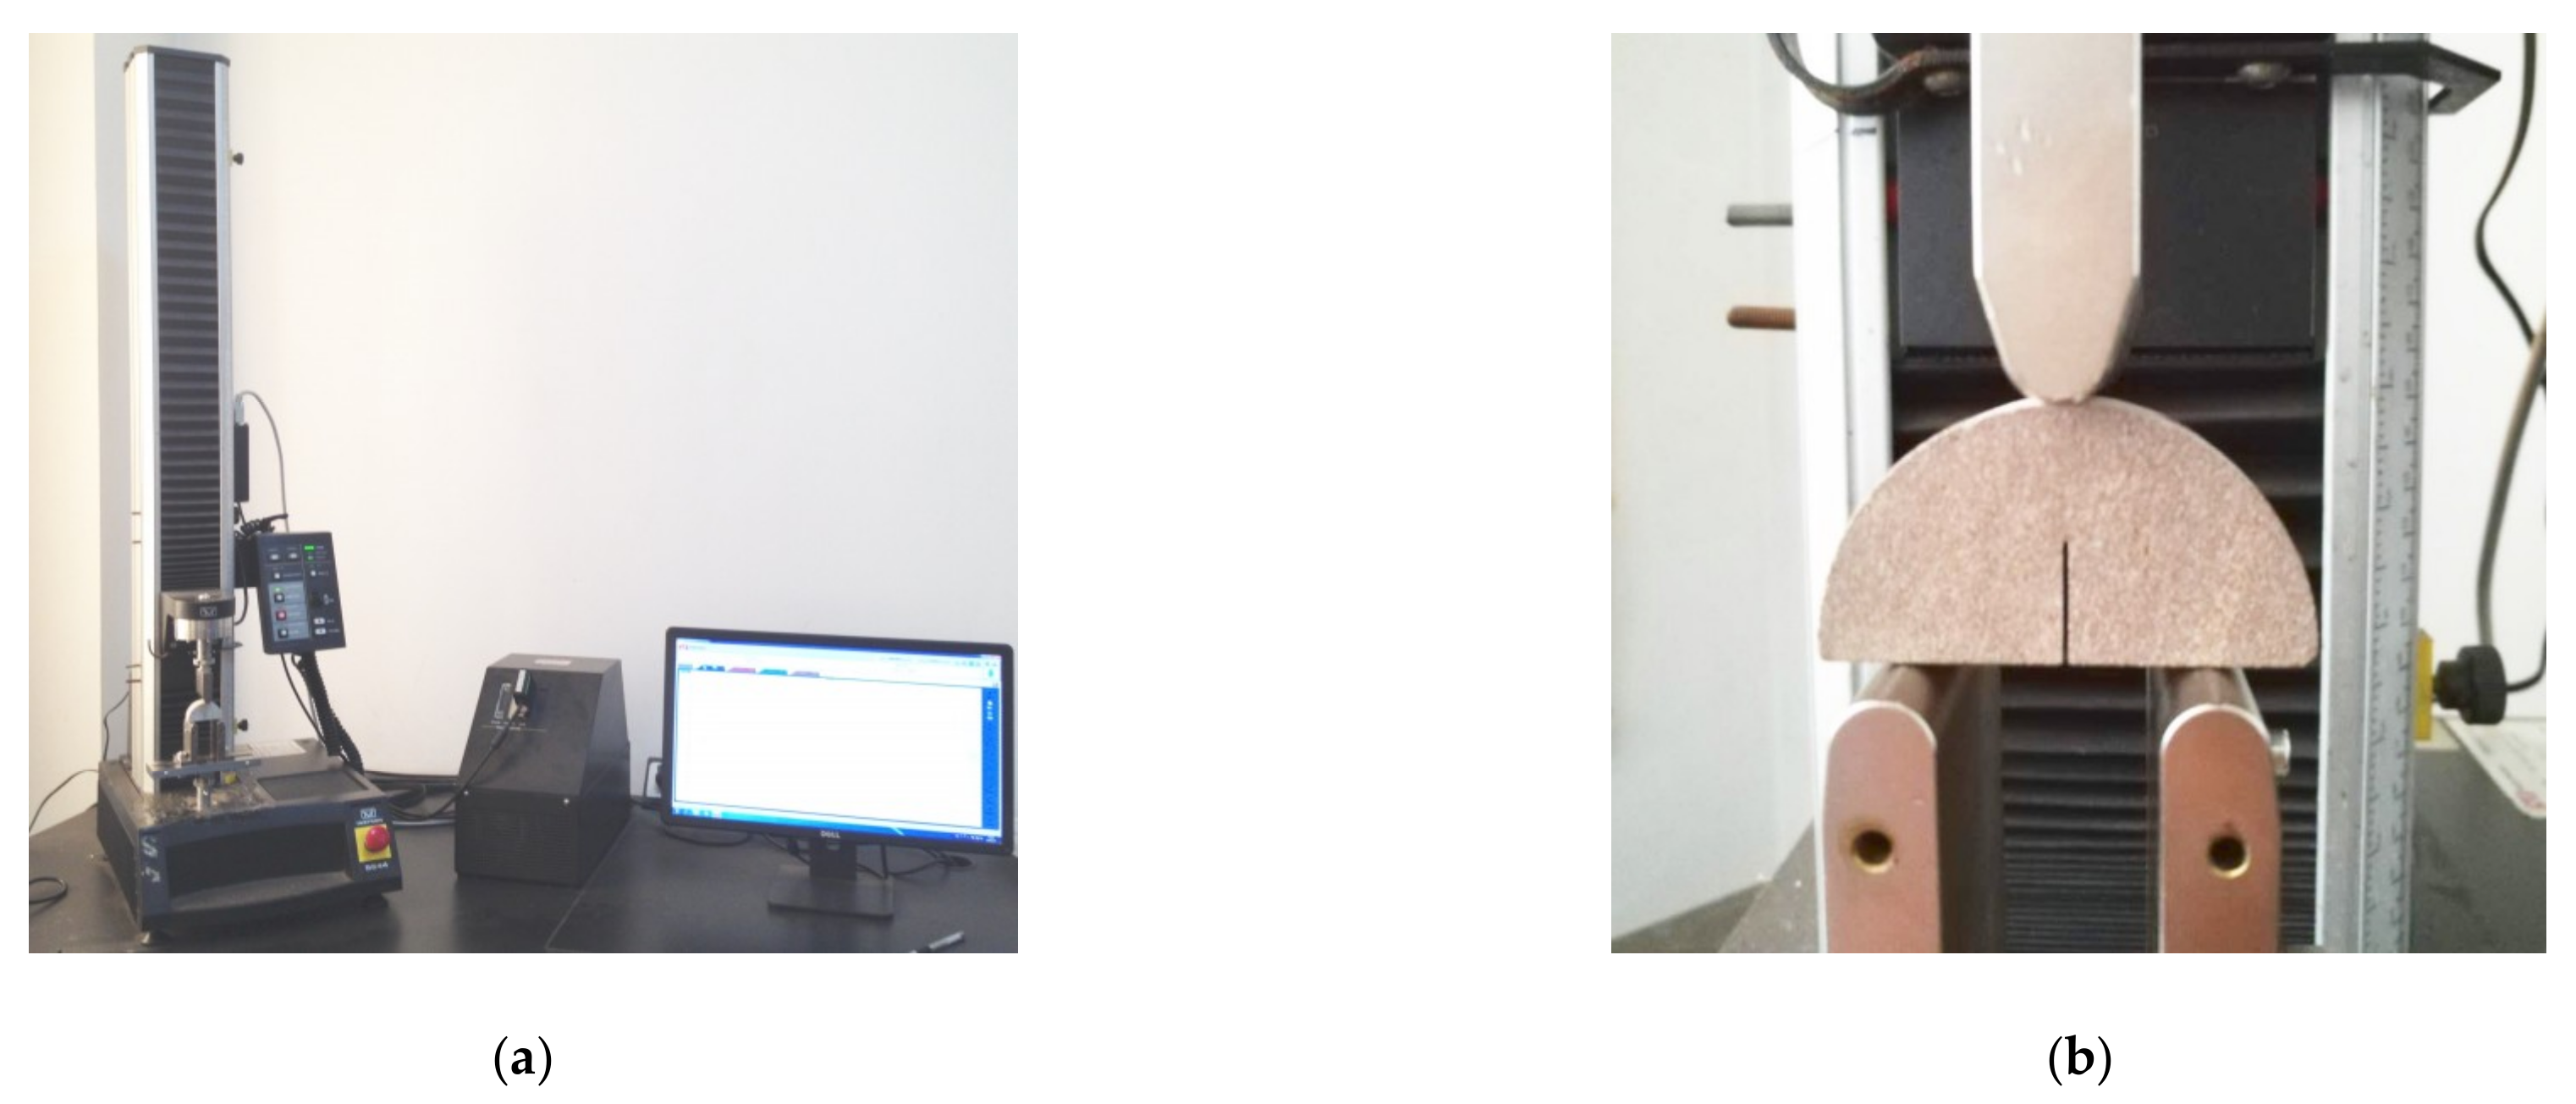
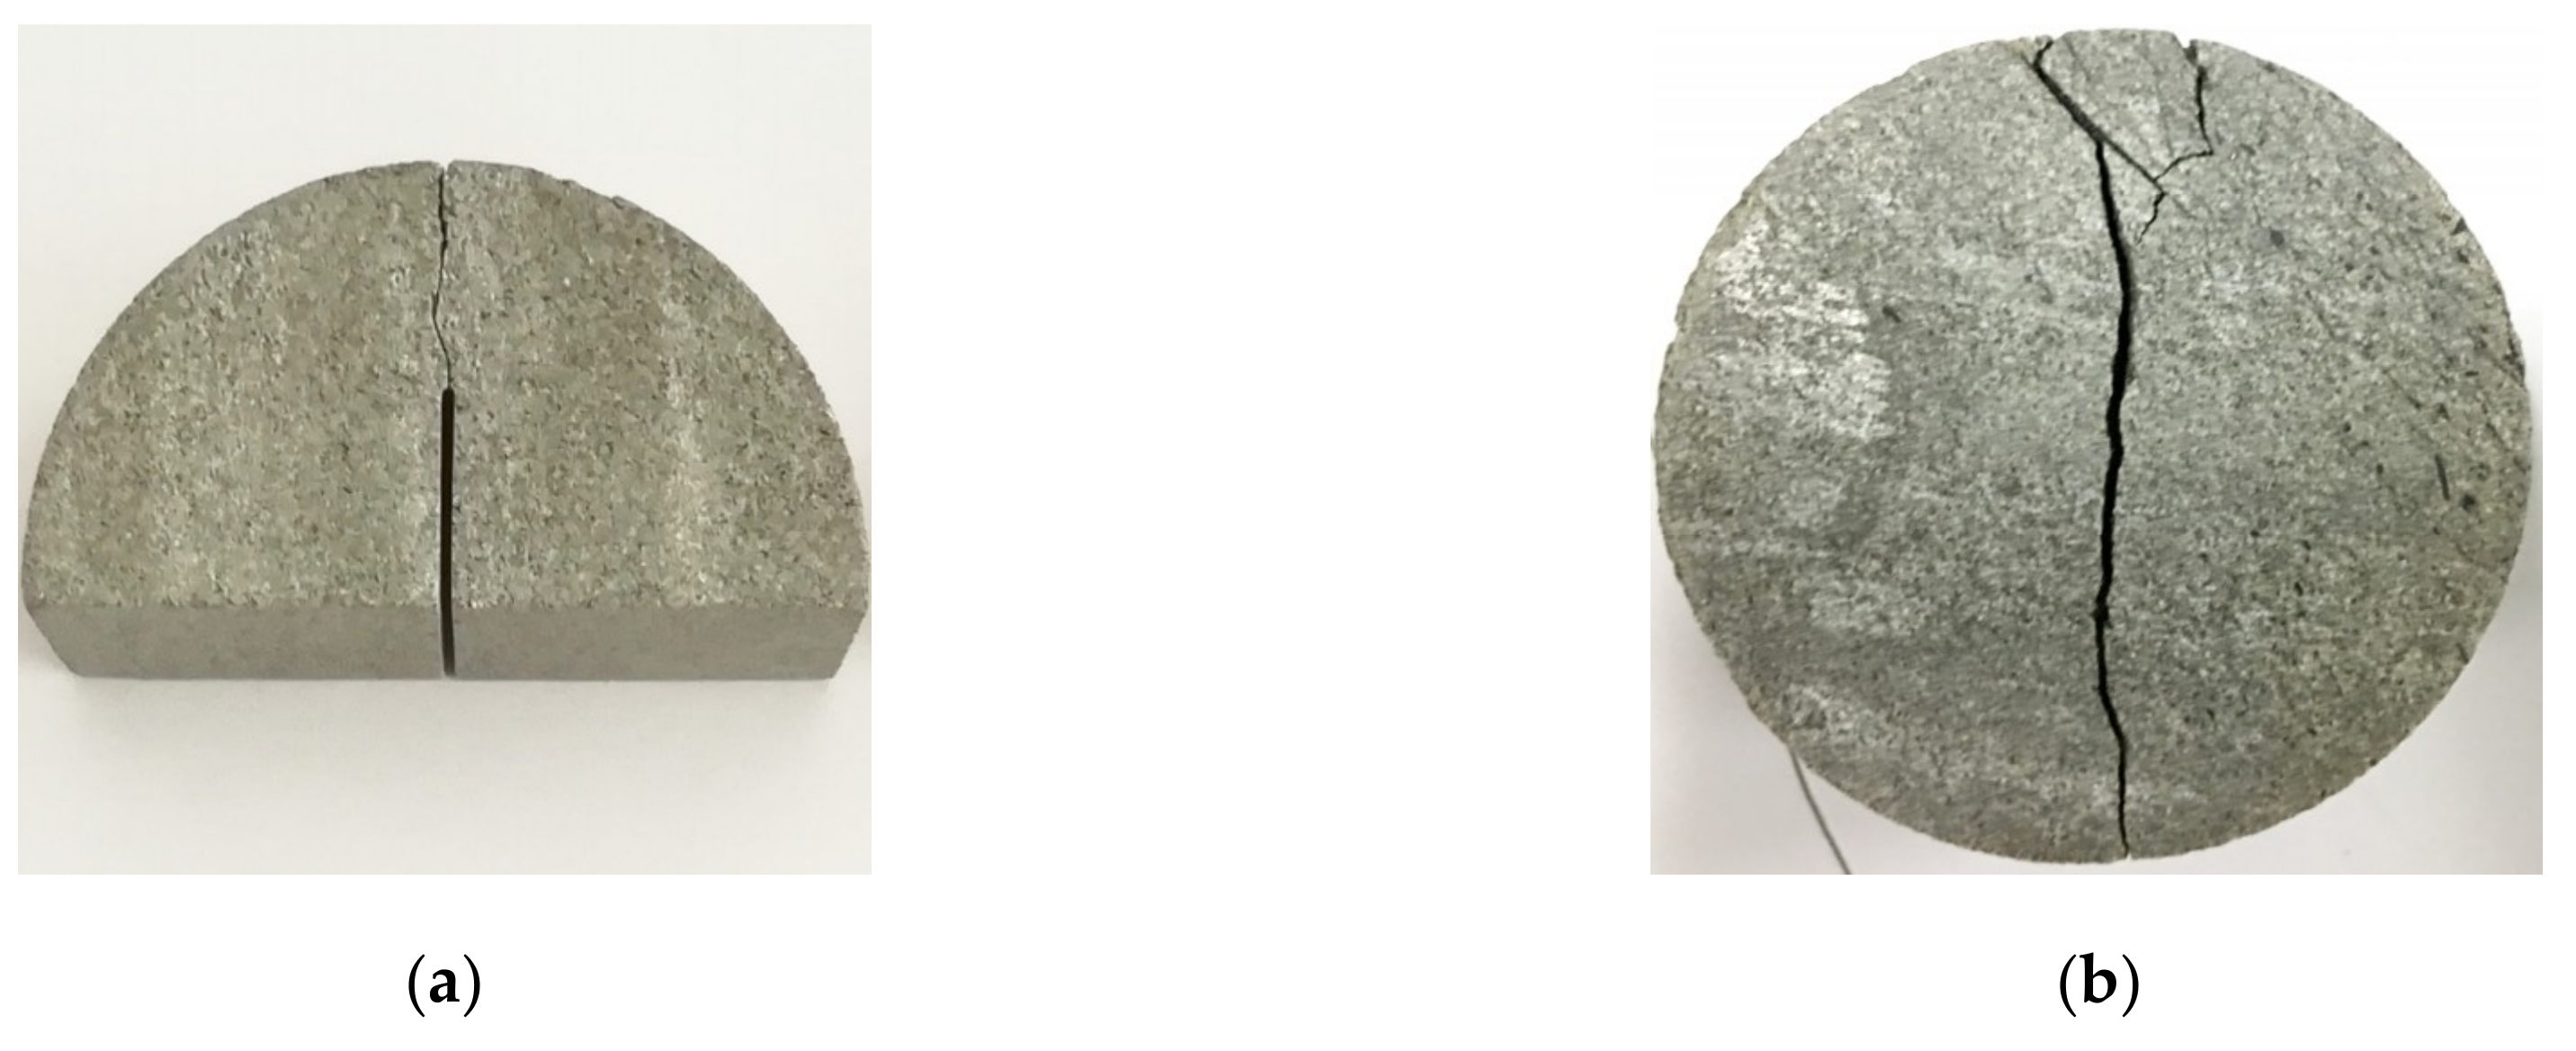
2.2. Mode-I Fracture Toughness Test
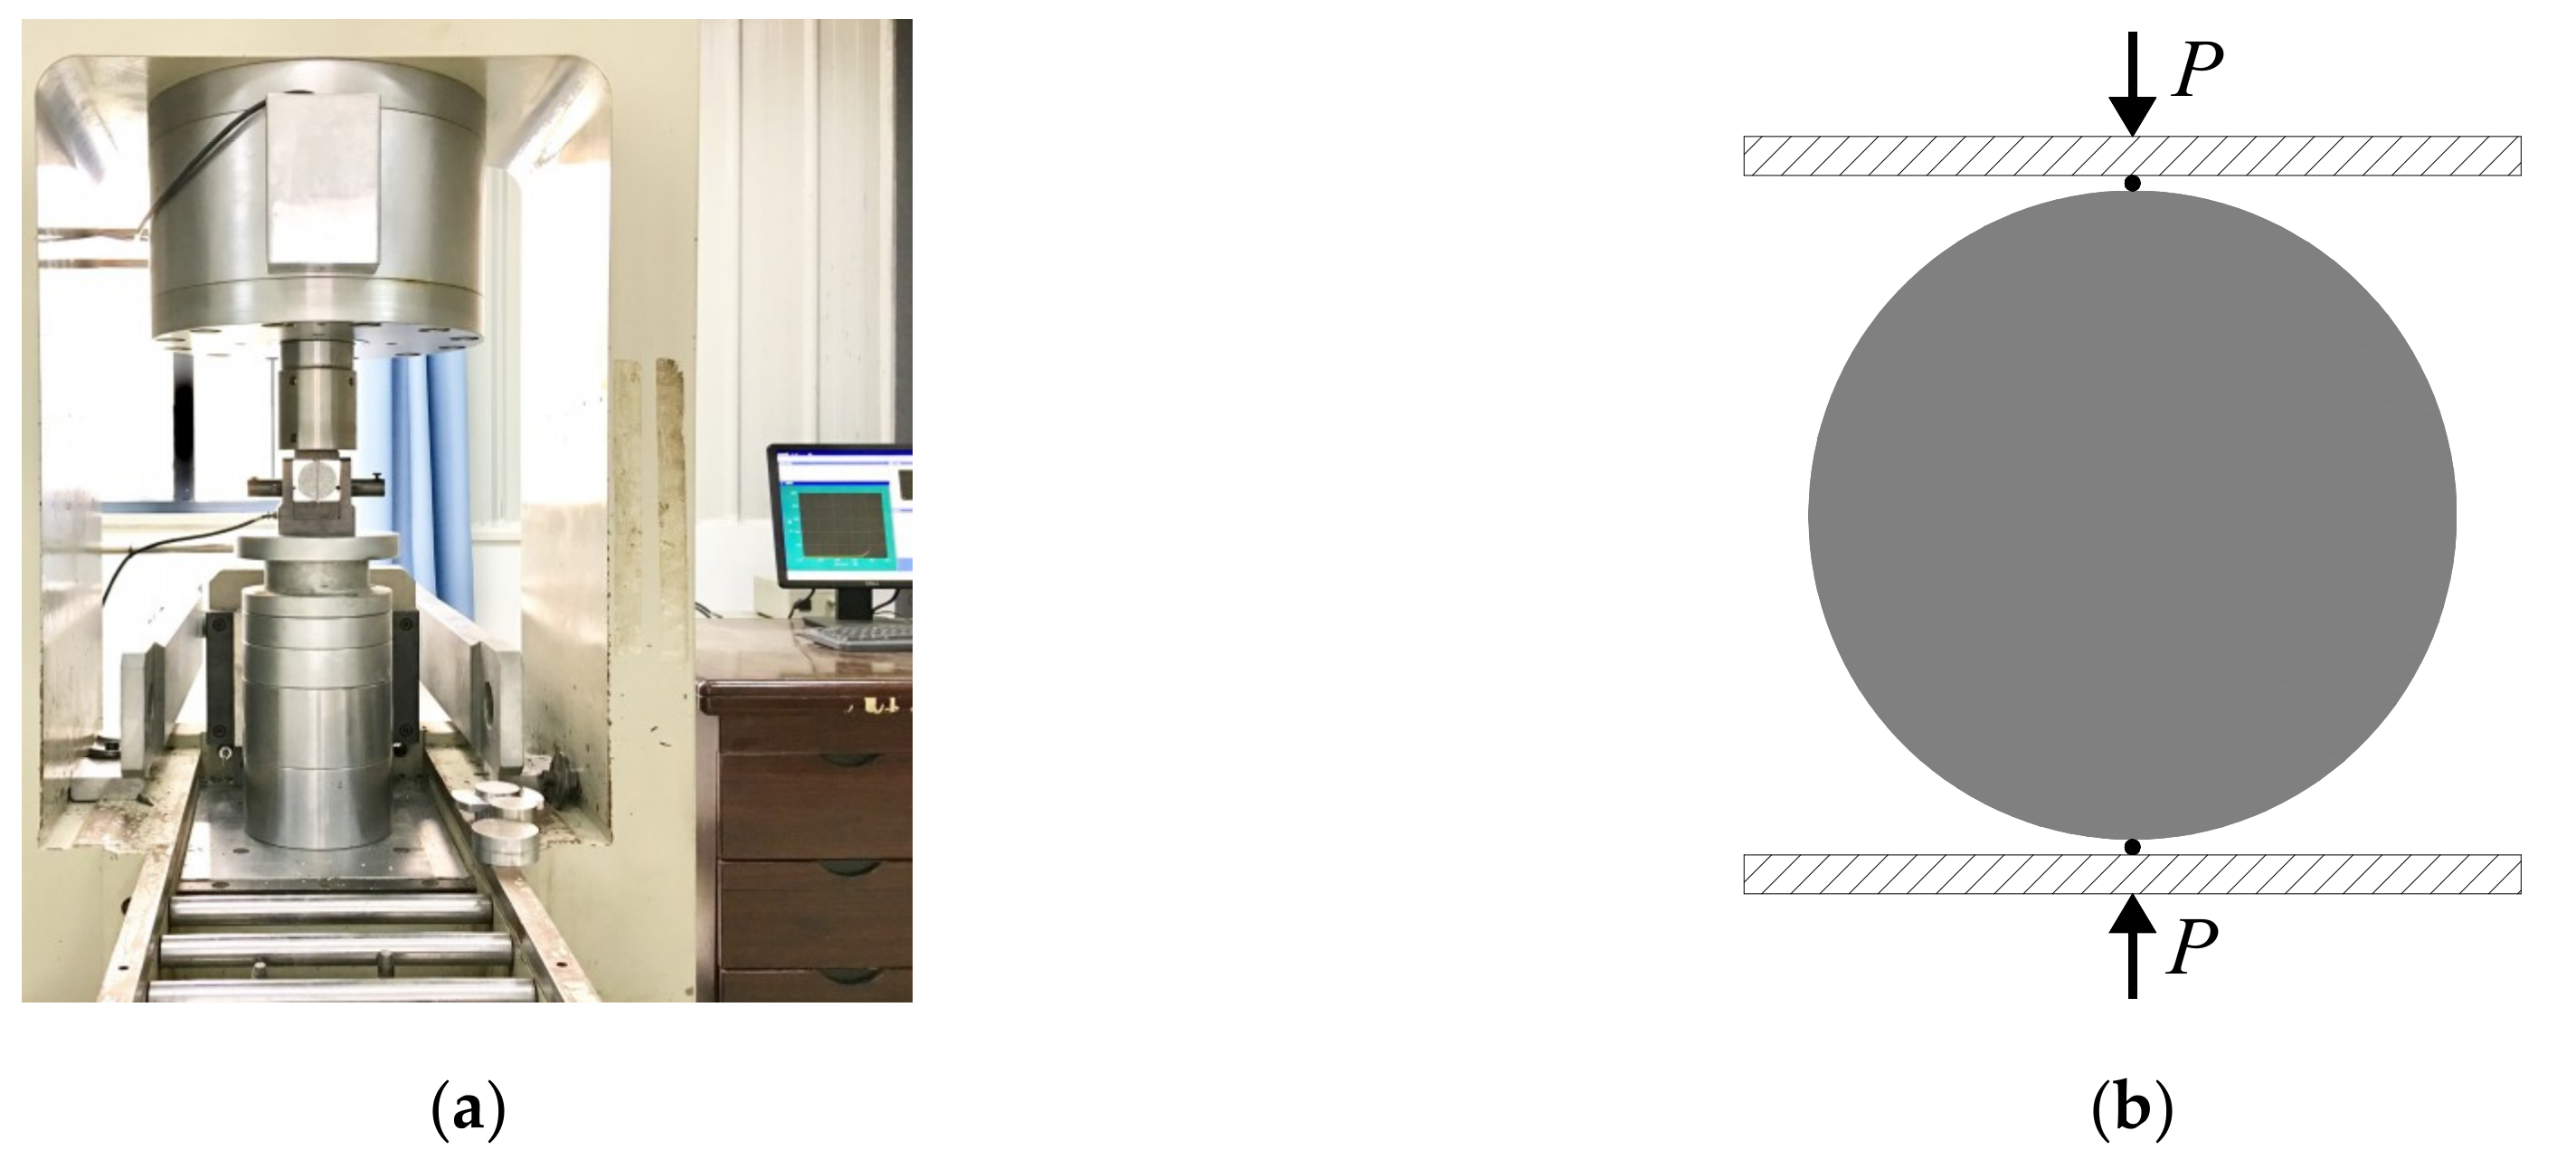
2.3. Brazilian Disc Splitting Test
3. Test Results
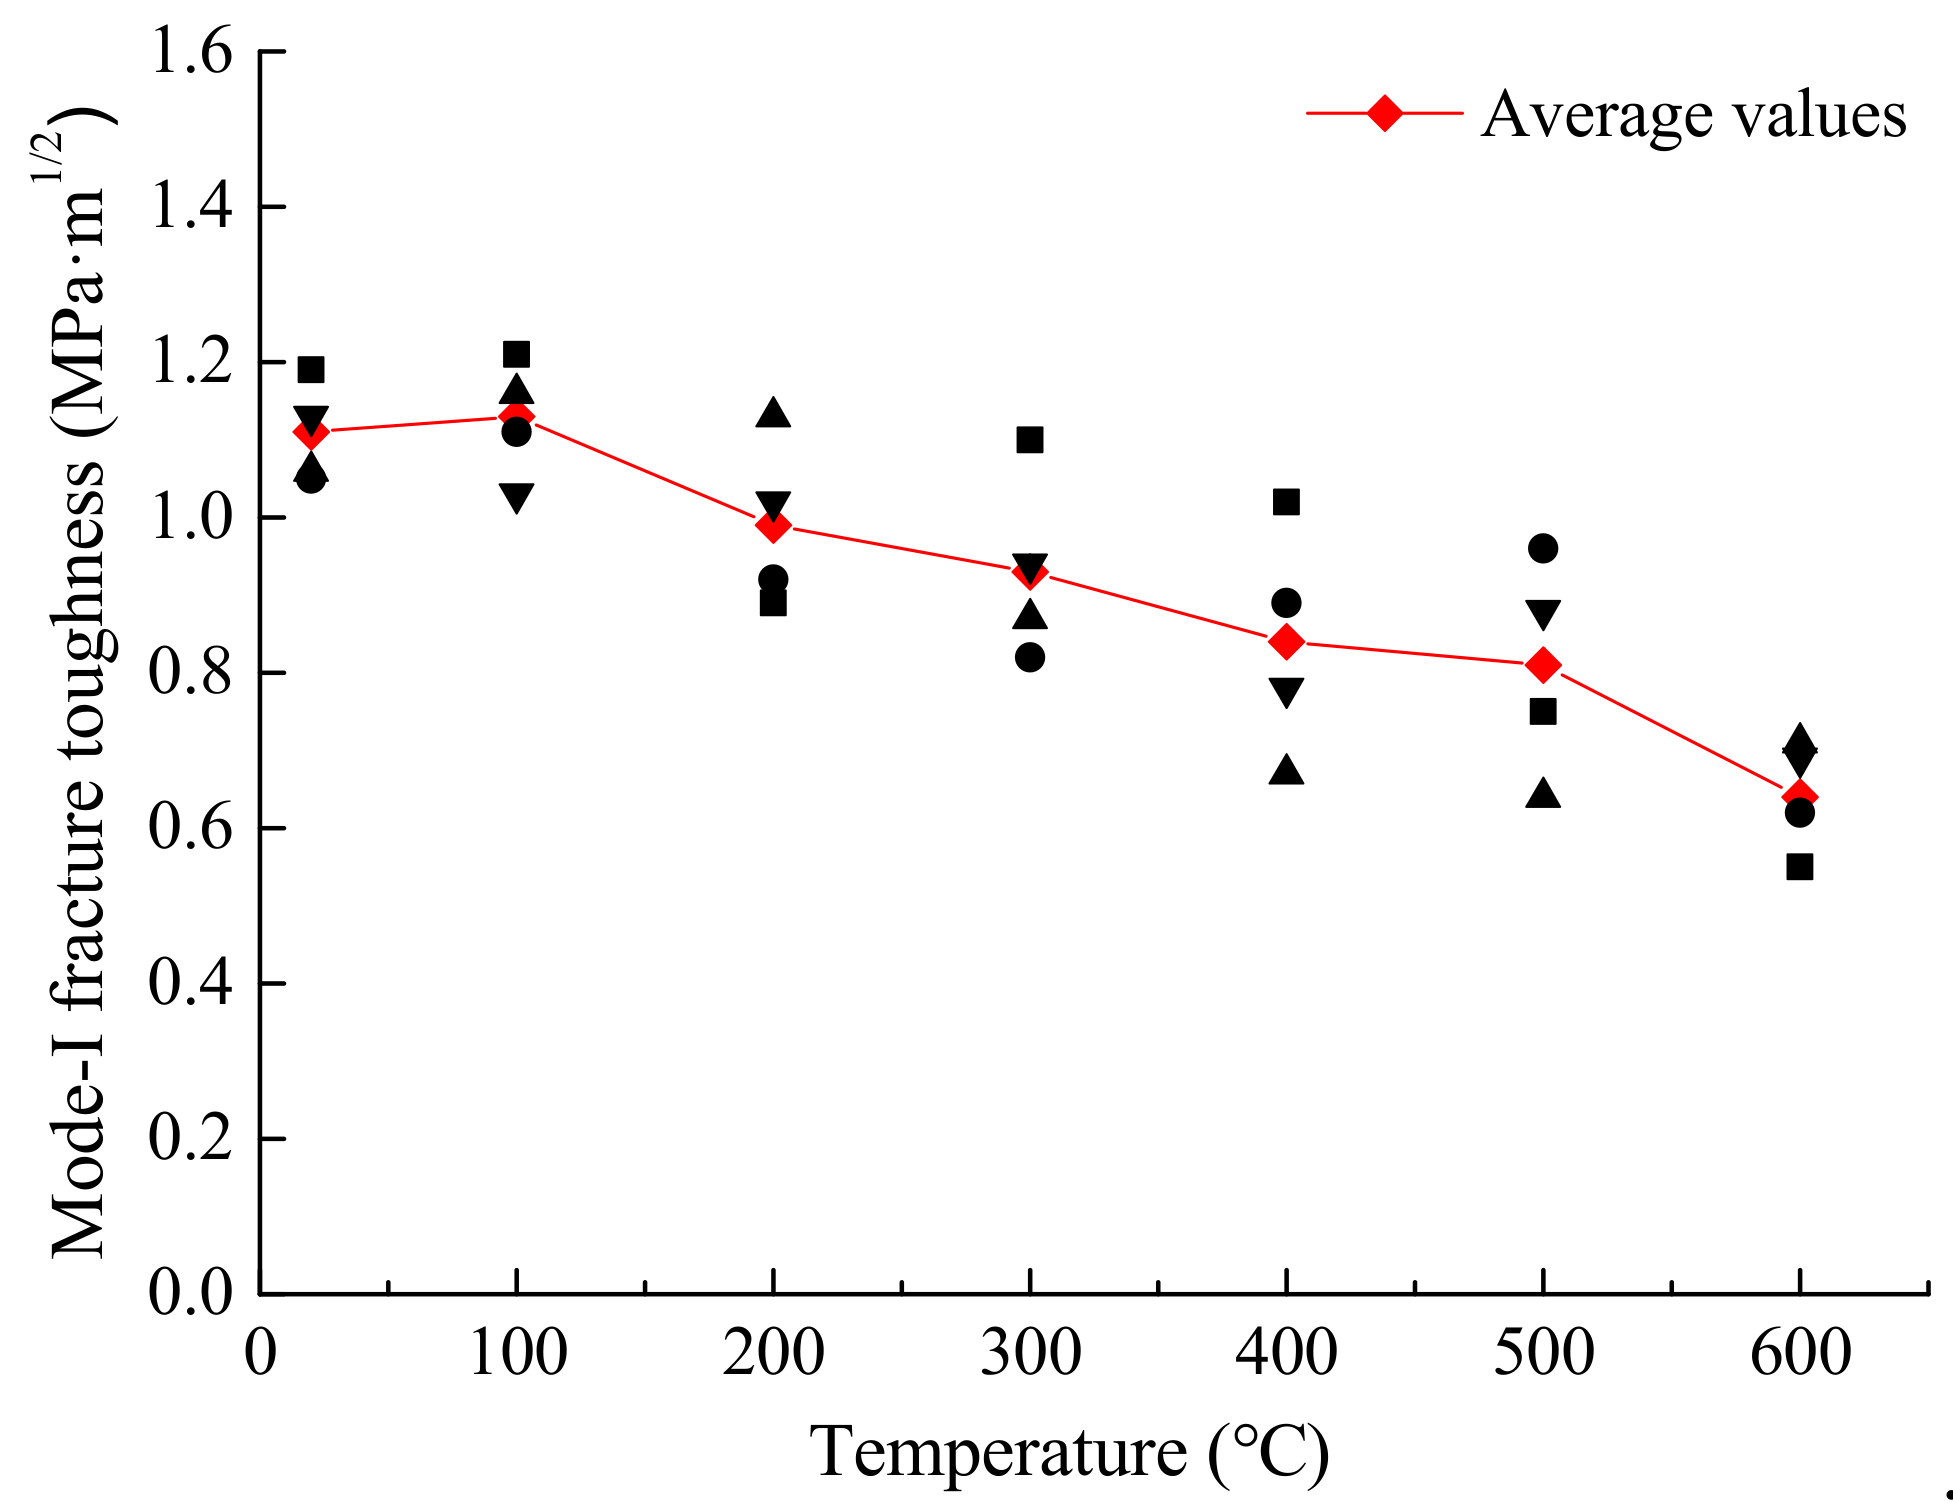
3.1. Mode-I Fracture Toughness
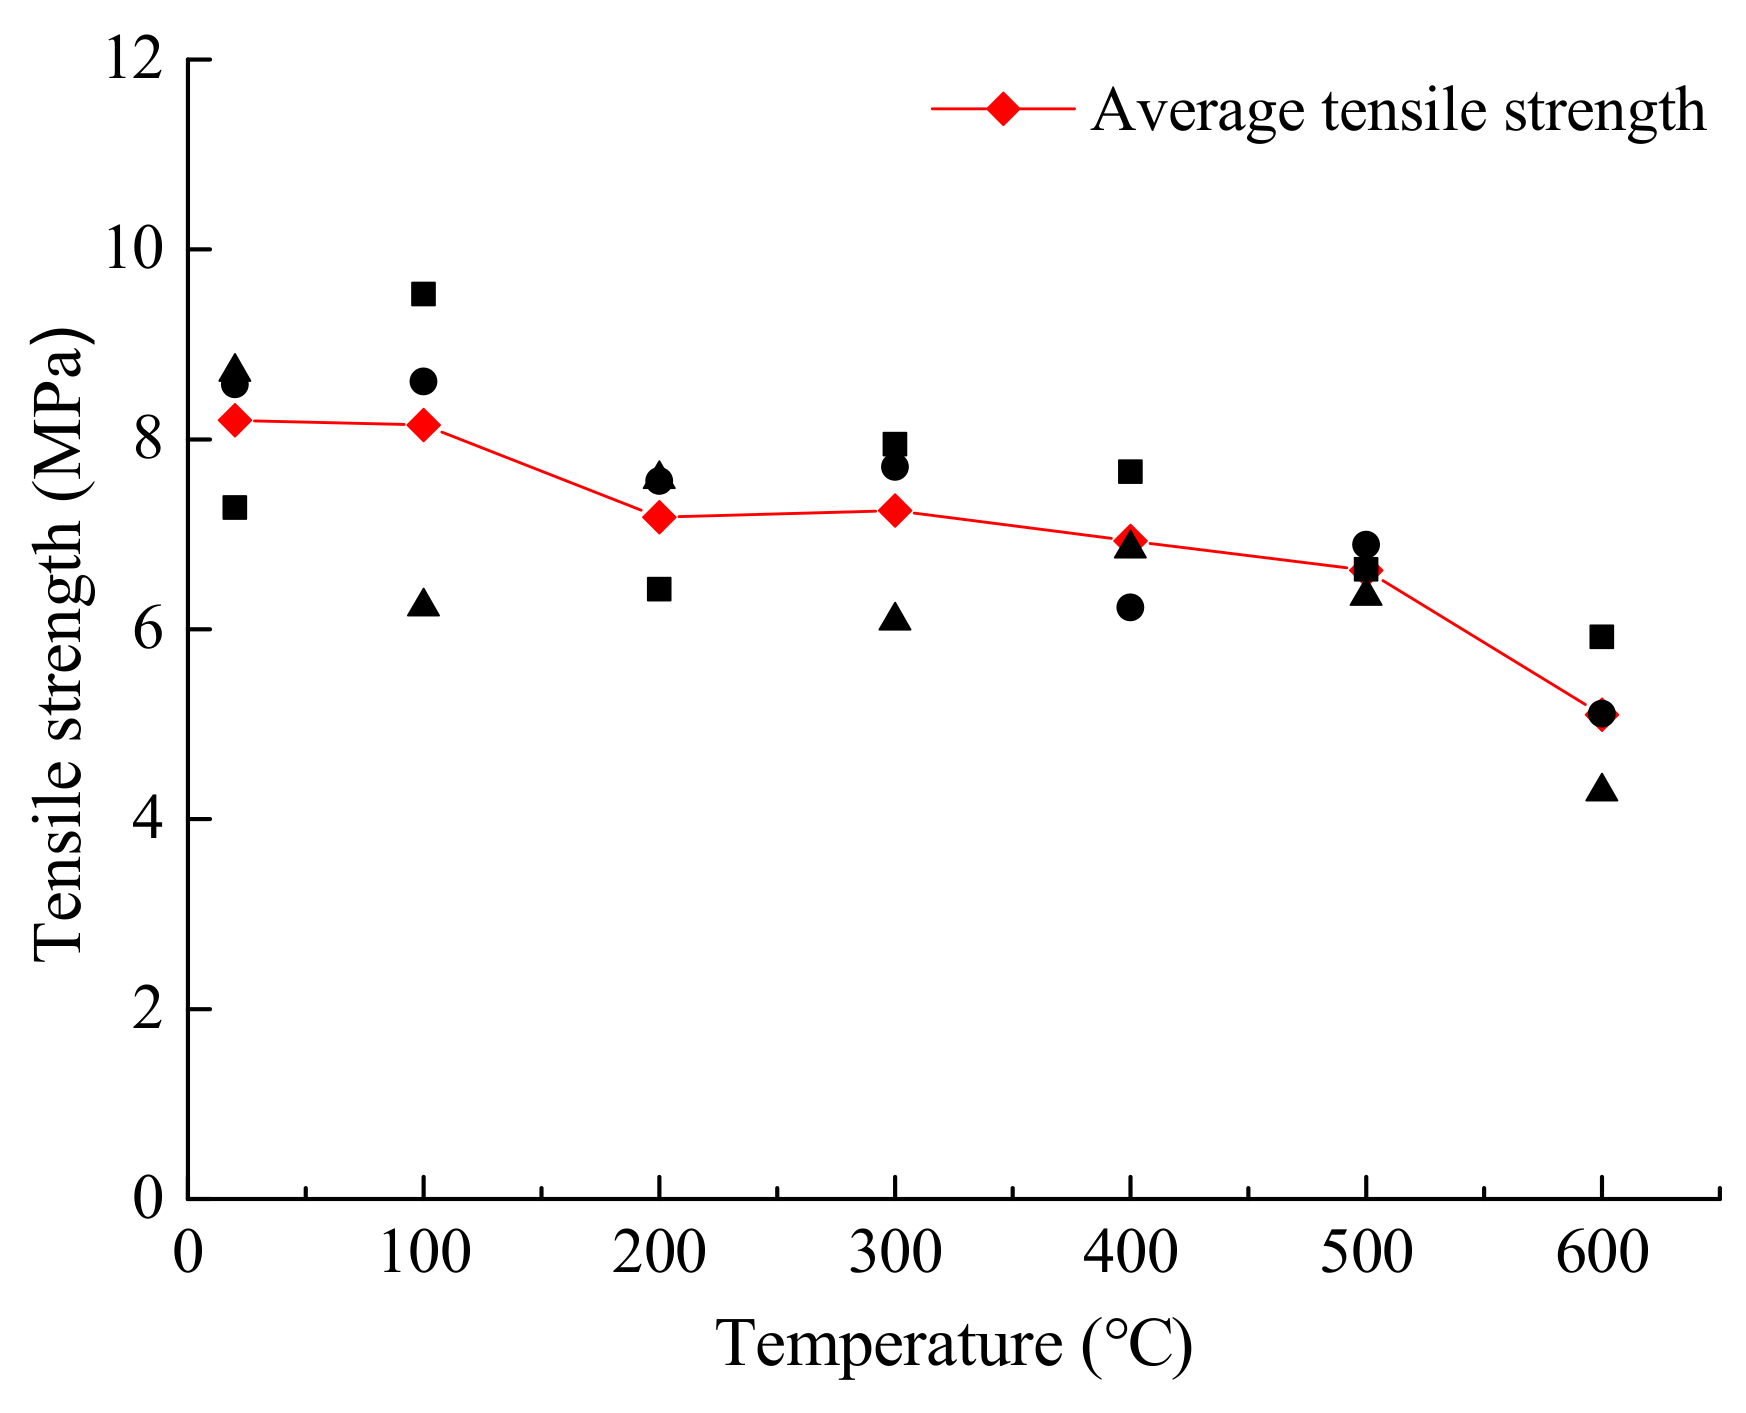
3.2. Tensile Strength
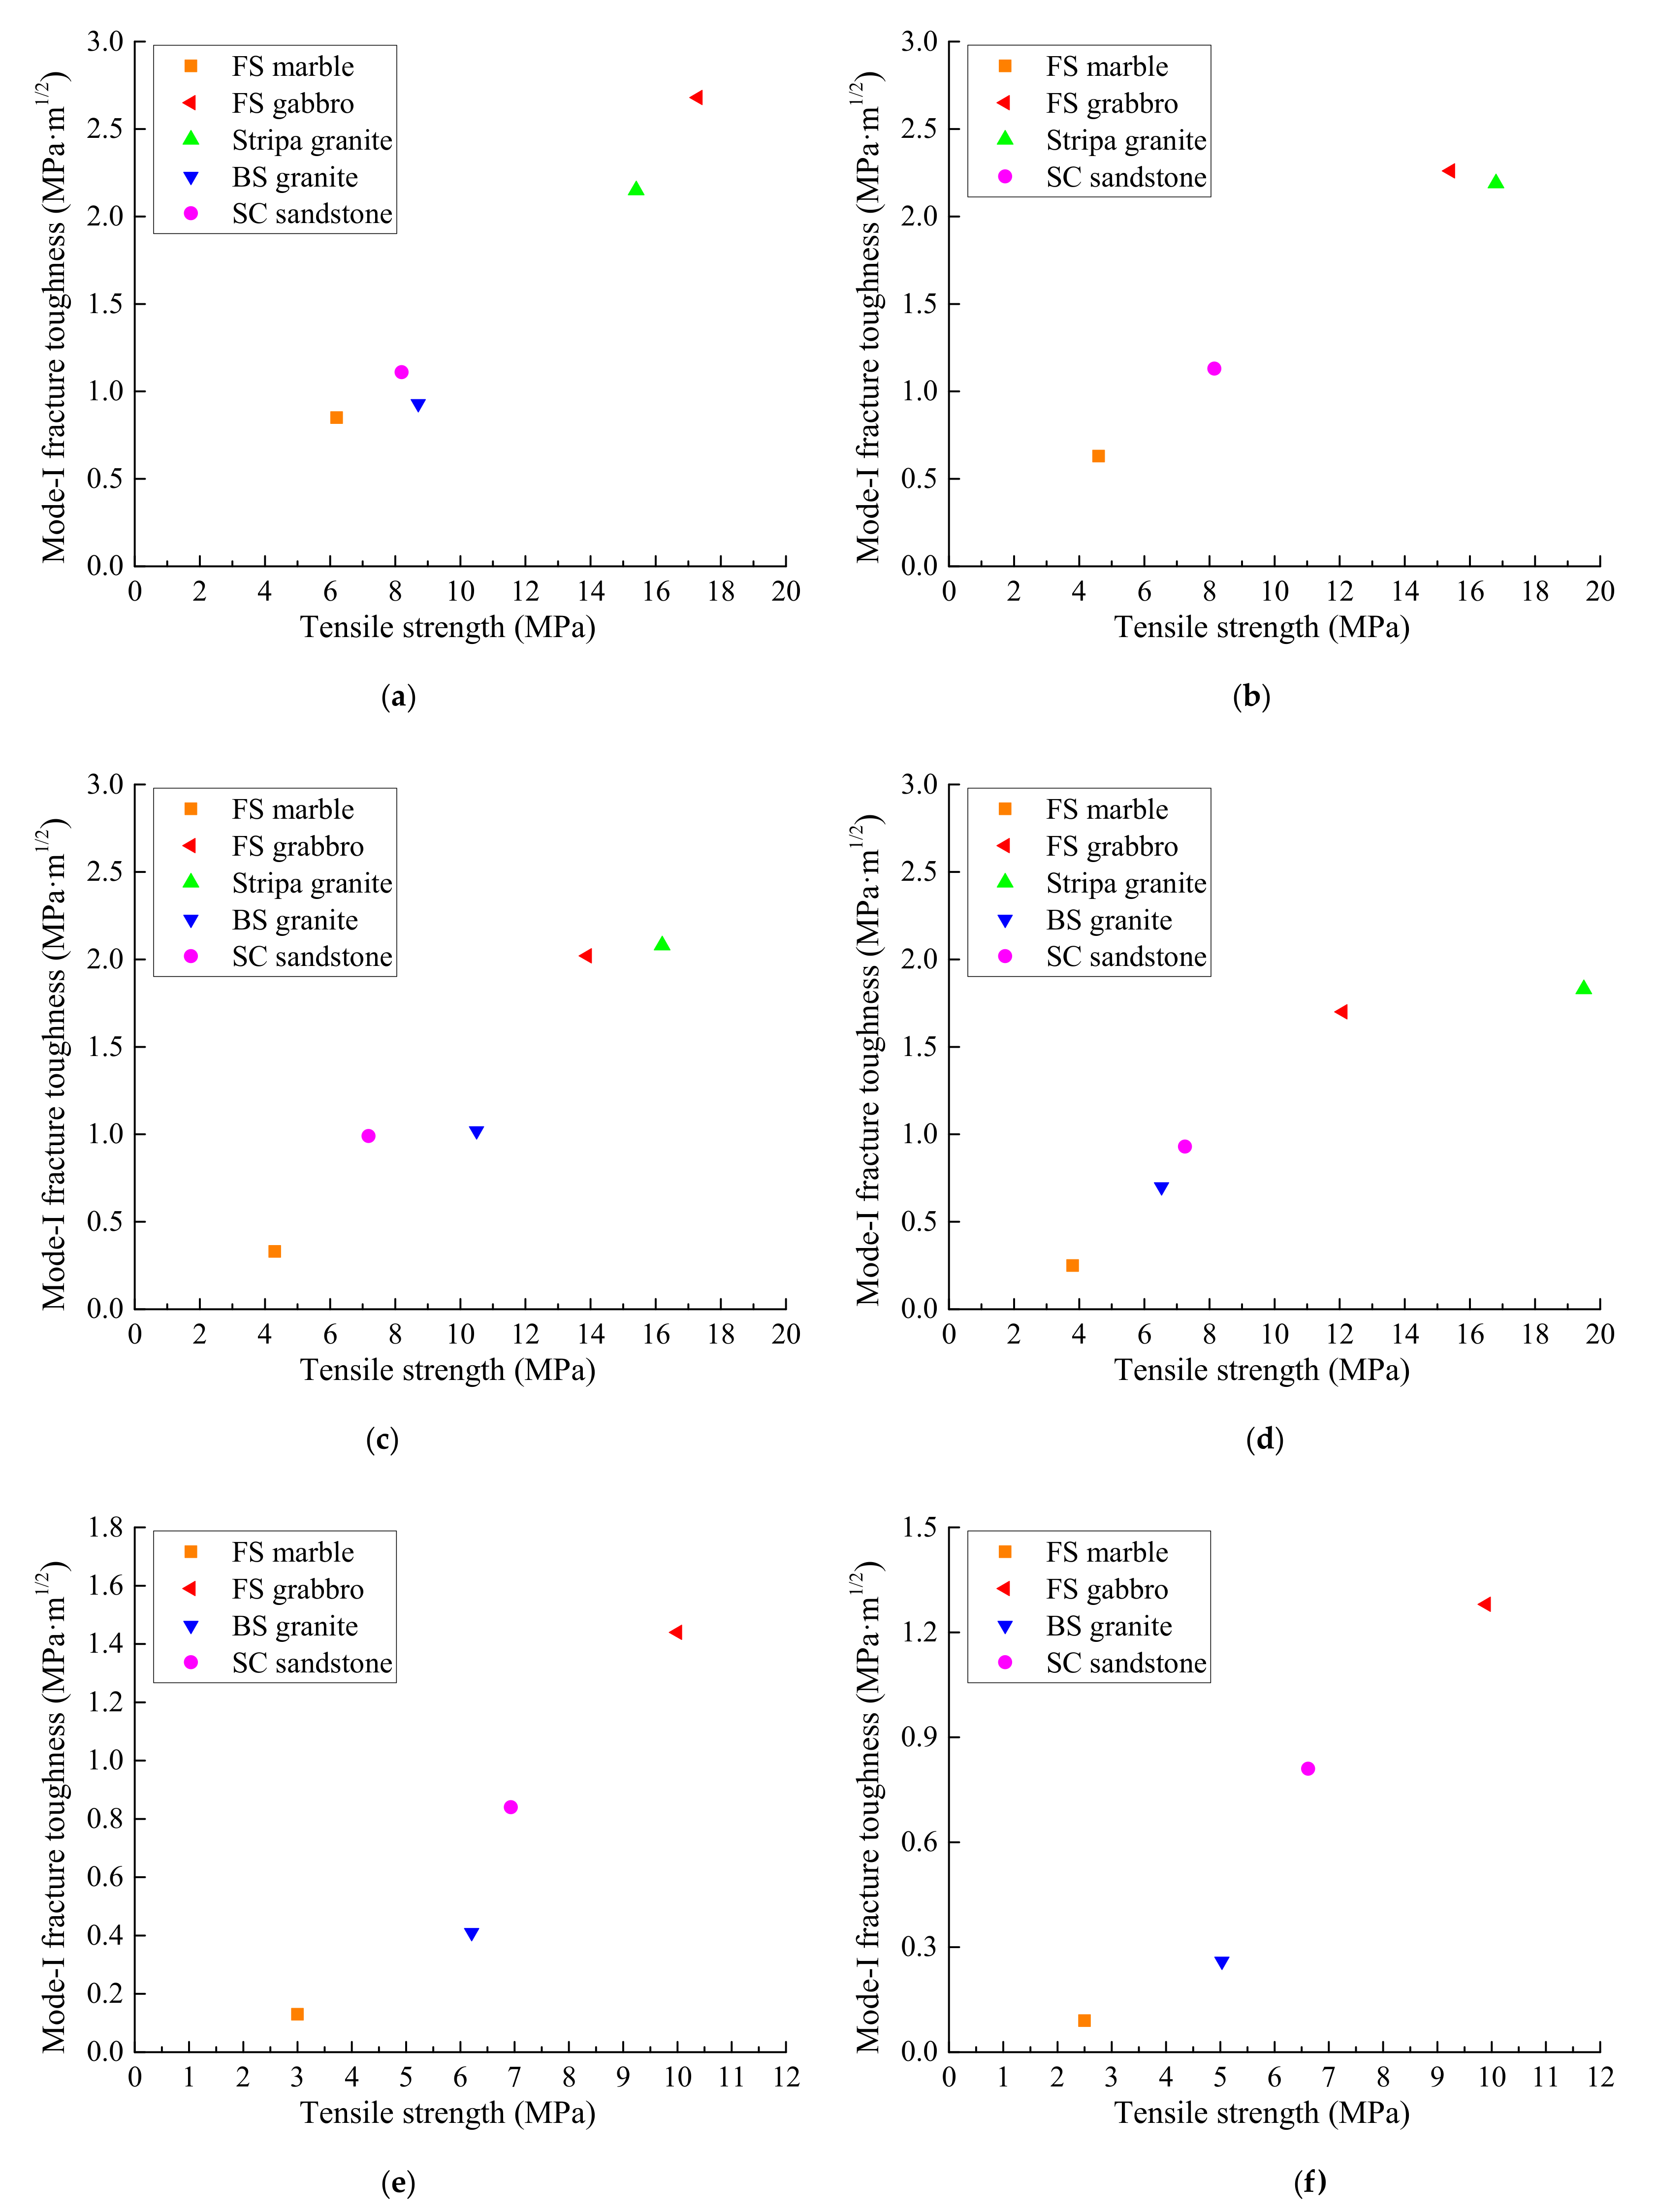
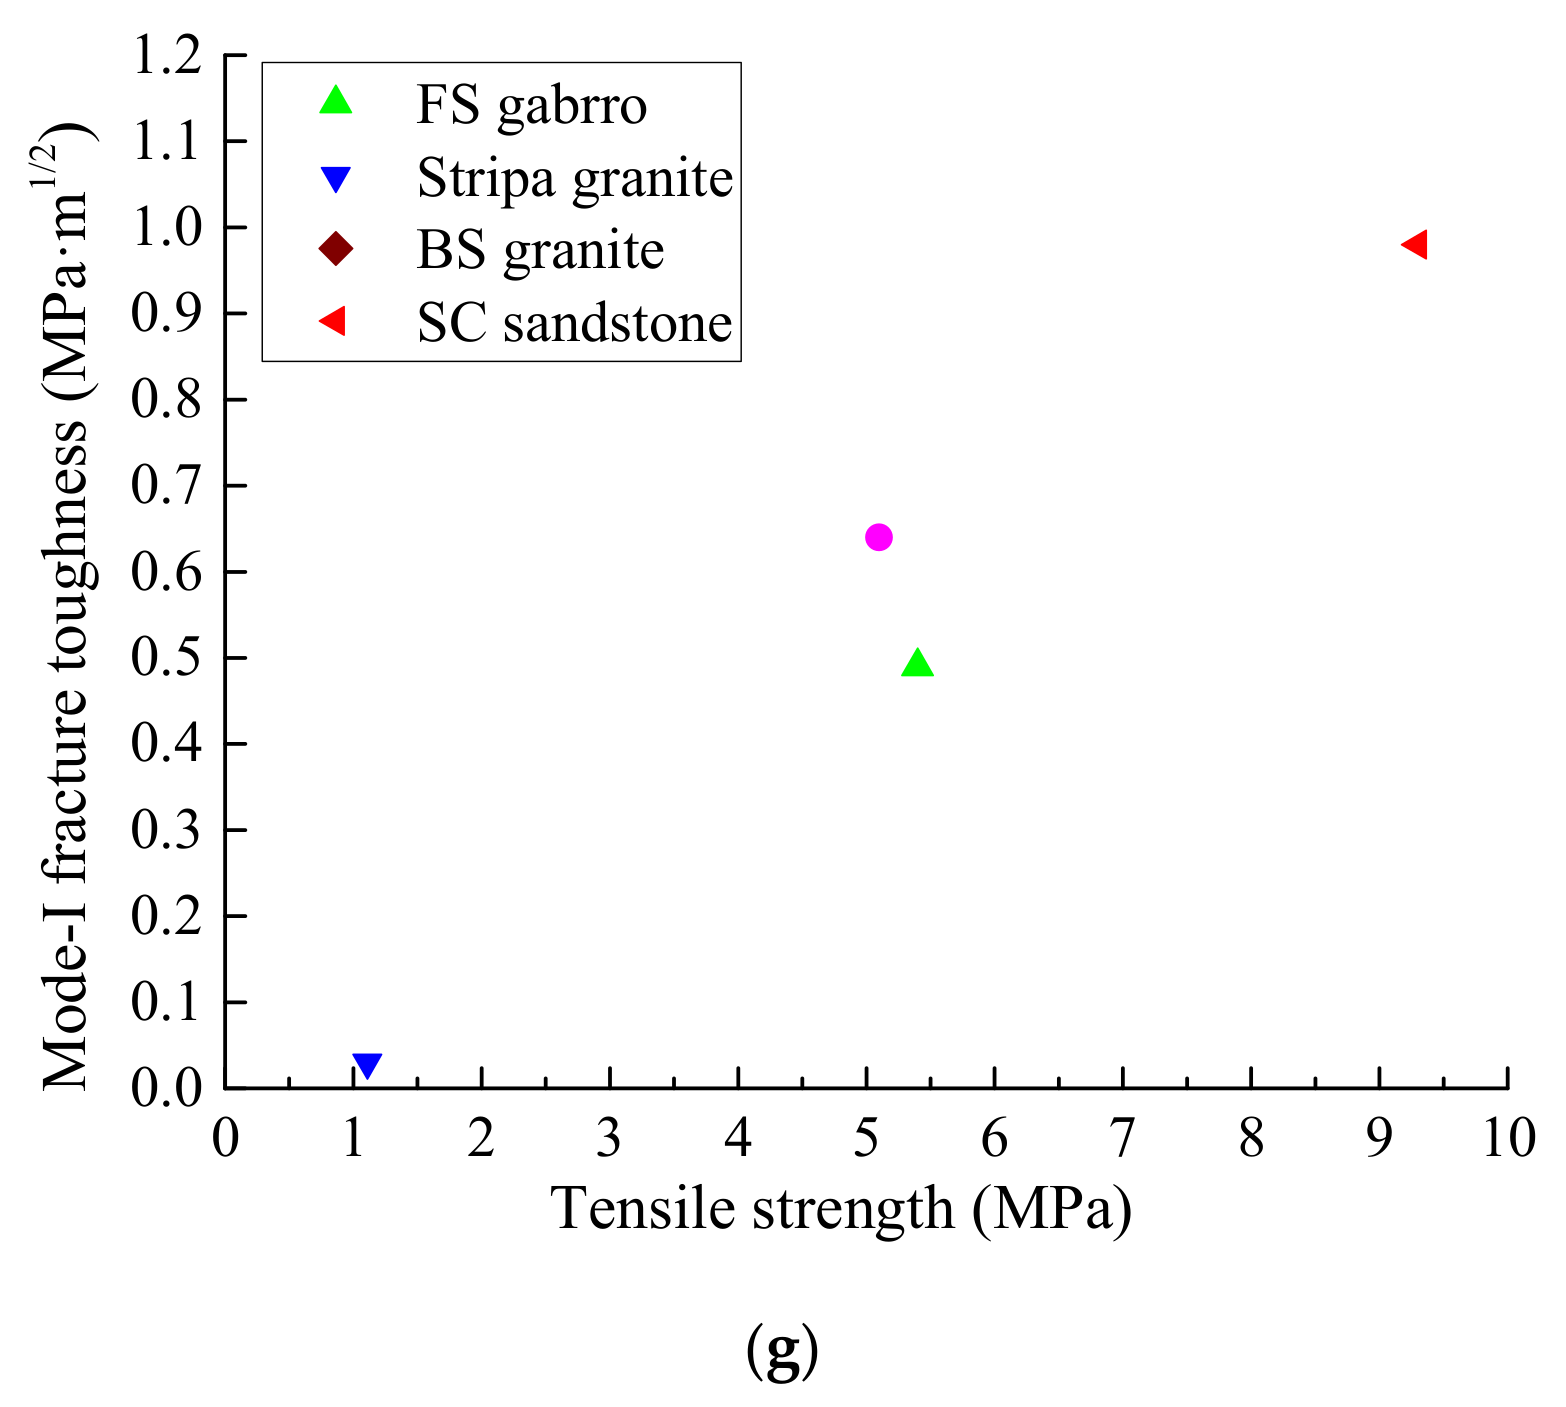
4. Relationship between KIC and σt
4.1. Empirical Relationship
4.2. Theoretical Analysis
5. Discussion
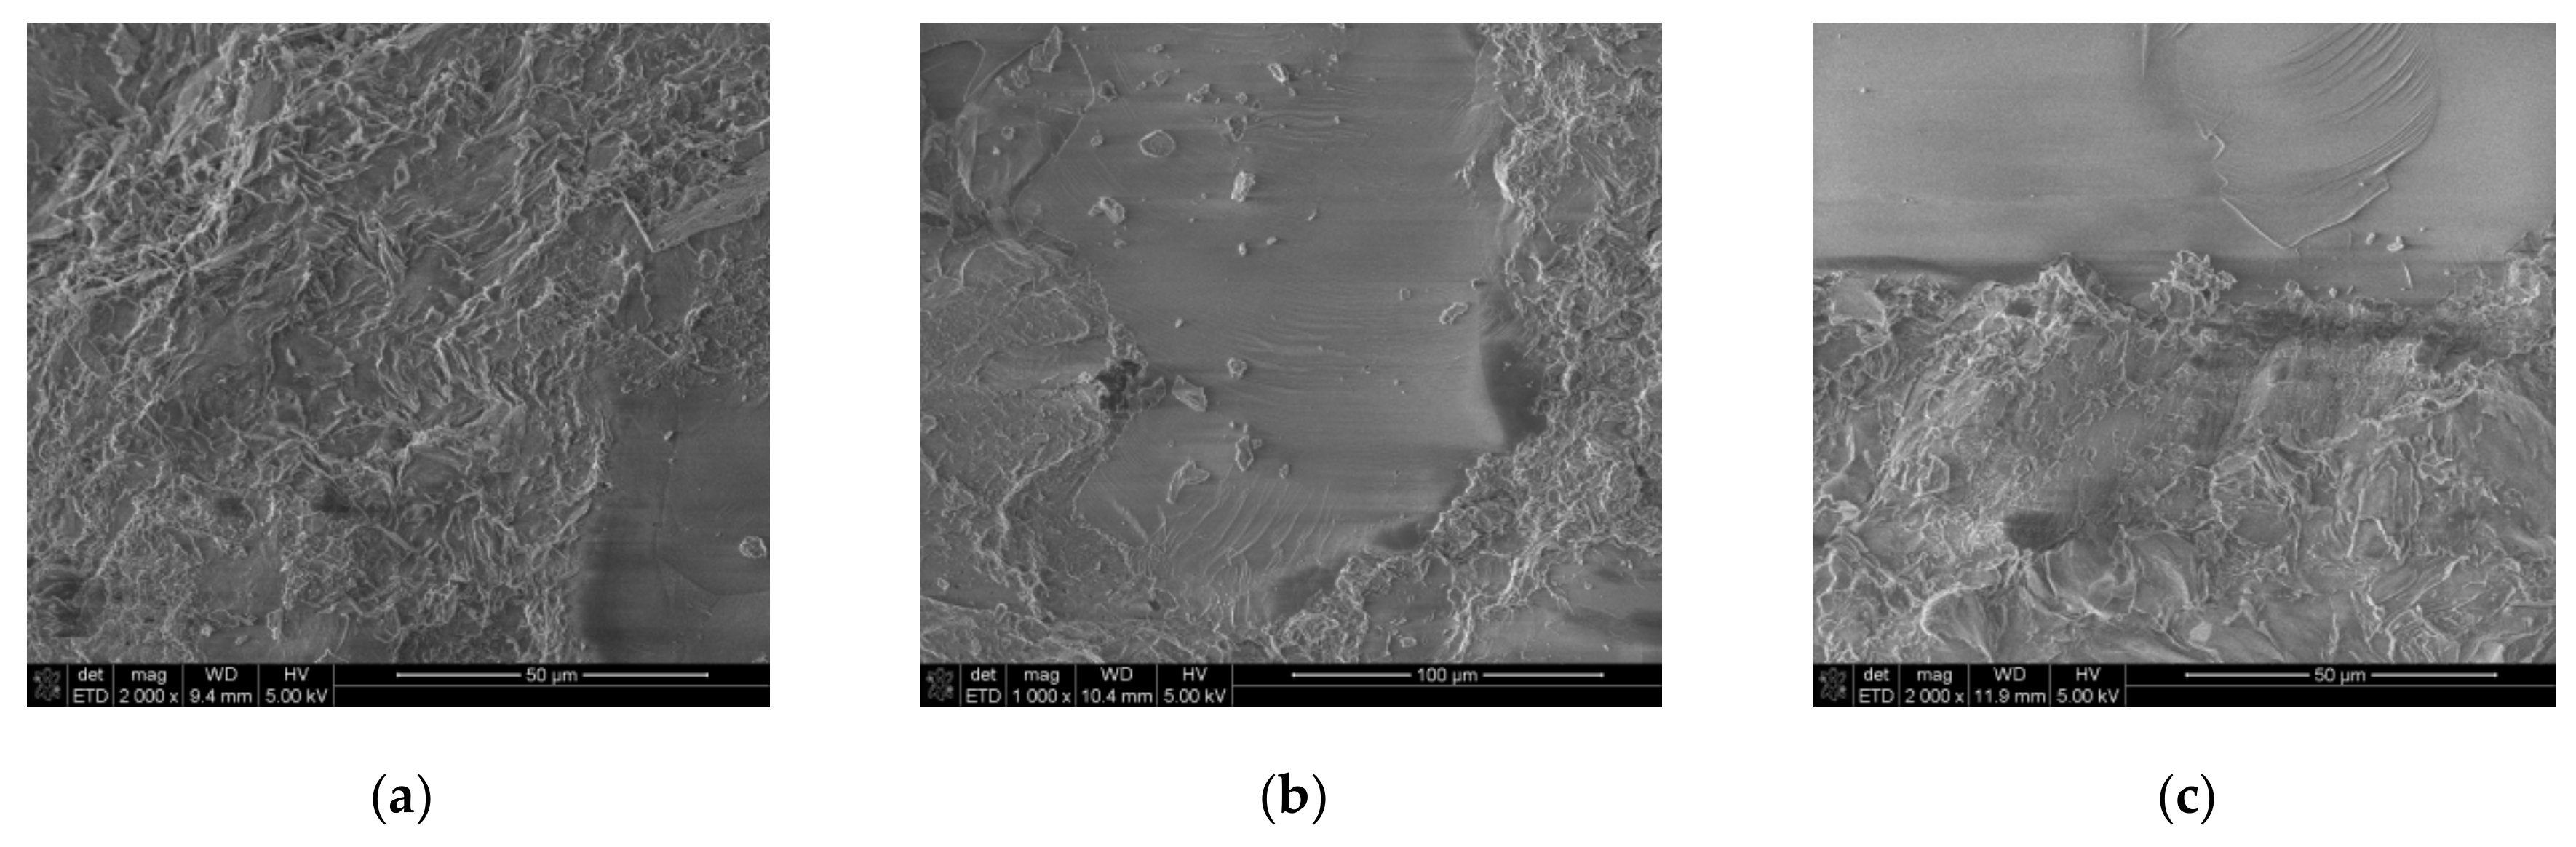
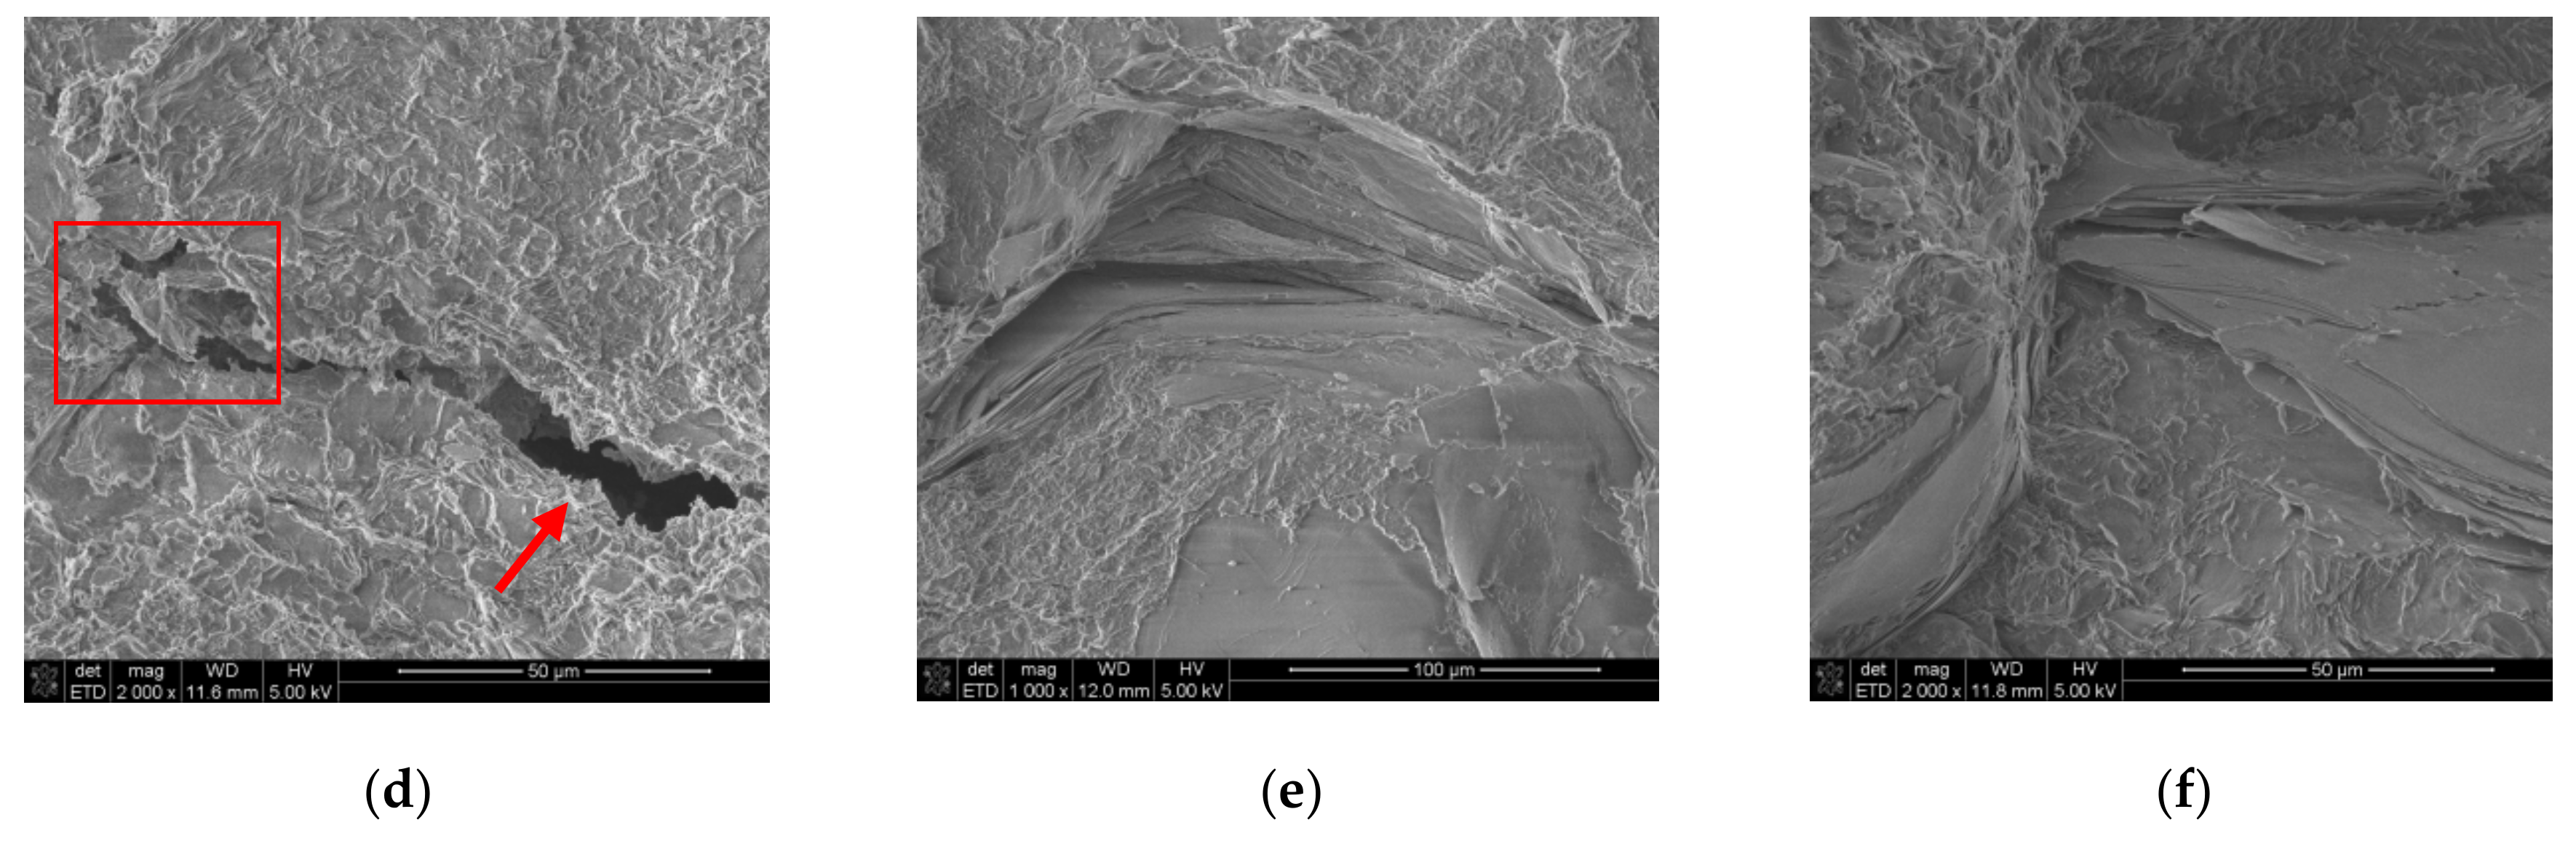
5.1. Fracture Analysis
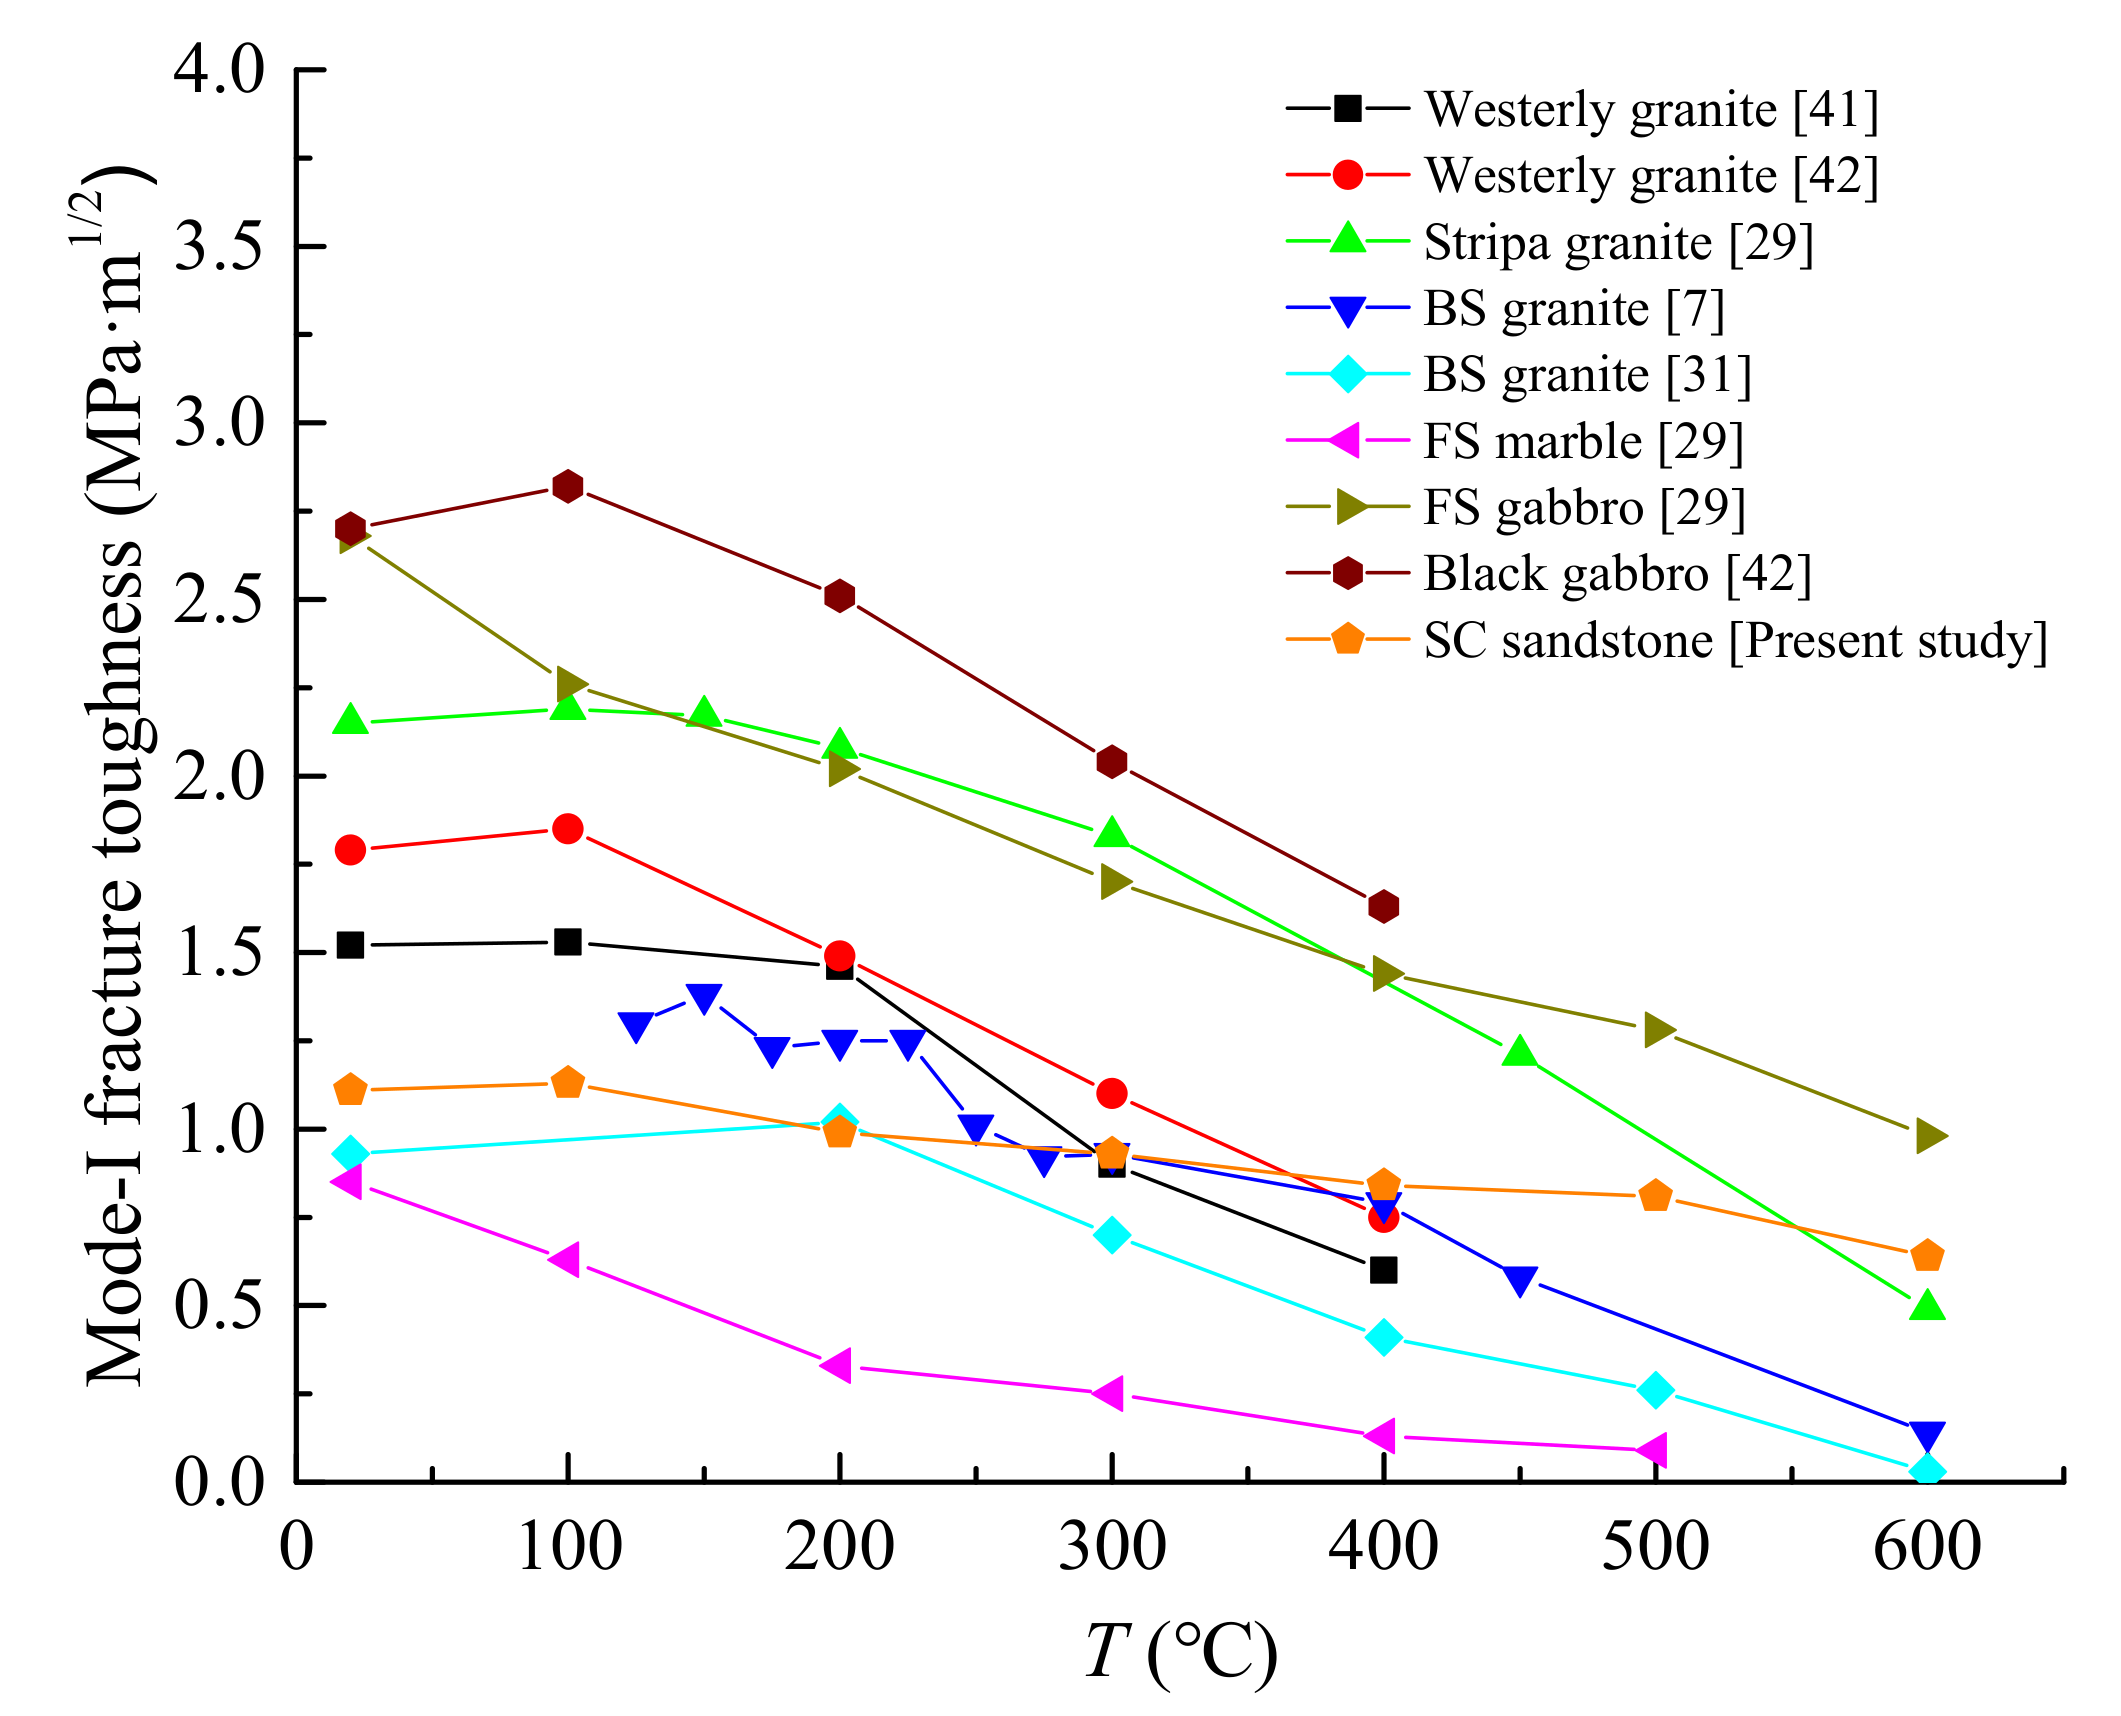
5.2. Influence of Temperature on KIC and σt
5.3. Reasons for the Relationship between KIC and σt
6. Conclusions
Author Contributions
Acknowledgements
Conflicts of Interest
Abbreviations
| SCB | Semi-circular bend |
| BD | Brazilian disc |
| SEM | Scanning electron microscopy |
| ISRM | International Society for Rock Mechanics |
| R | SCB sample radius (mm) |
| B | SCB and Brazilian disc sample thickness (mm) |
| a | Artificial-notch length (mm) |
| S | Support span (mm) |
| P | Load (N) |
| D | SCB sample diameter (mm) |
| KIC | Mode-I fracture toughness (MPa·m1/2) |
| Pmax | Peak load of specimen failure (N) |
| Y′ | Dimensionless stress intensity factor |
| UCS | Uniaxial compressive strength (MPa) |
| BTS | Brazilian tensile strength (MPa) |
| T | Temperature (°C) |
| σt | Tensile strength (MPa) |
| XRF | X-ray fluorescence |
| XRD | X-ray diffraction |
| FS | Fangshan (in the suburb of Beijing) |
| BS | Beishan (in Gansu province, China) |
| SC | Sichuan (in Sichuan province, China) |
| TPBSEN | Three-point bending single edge-notched |
| SCR3PB | Single crack rod three-point bending |
| R2 | Coefficient of determination |
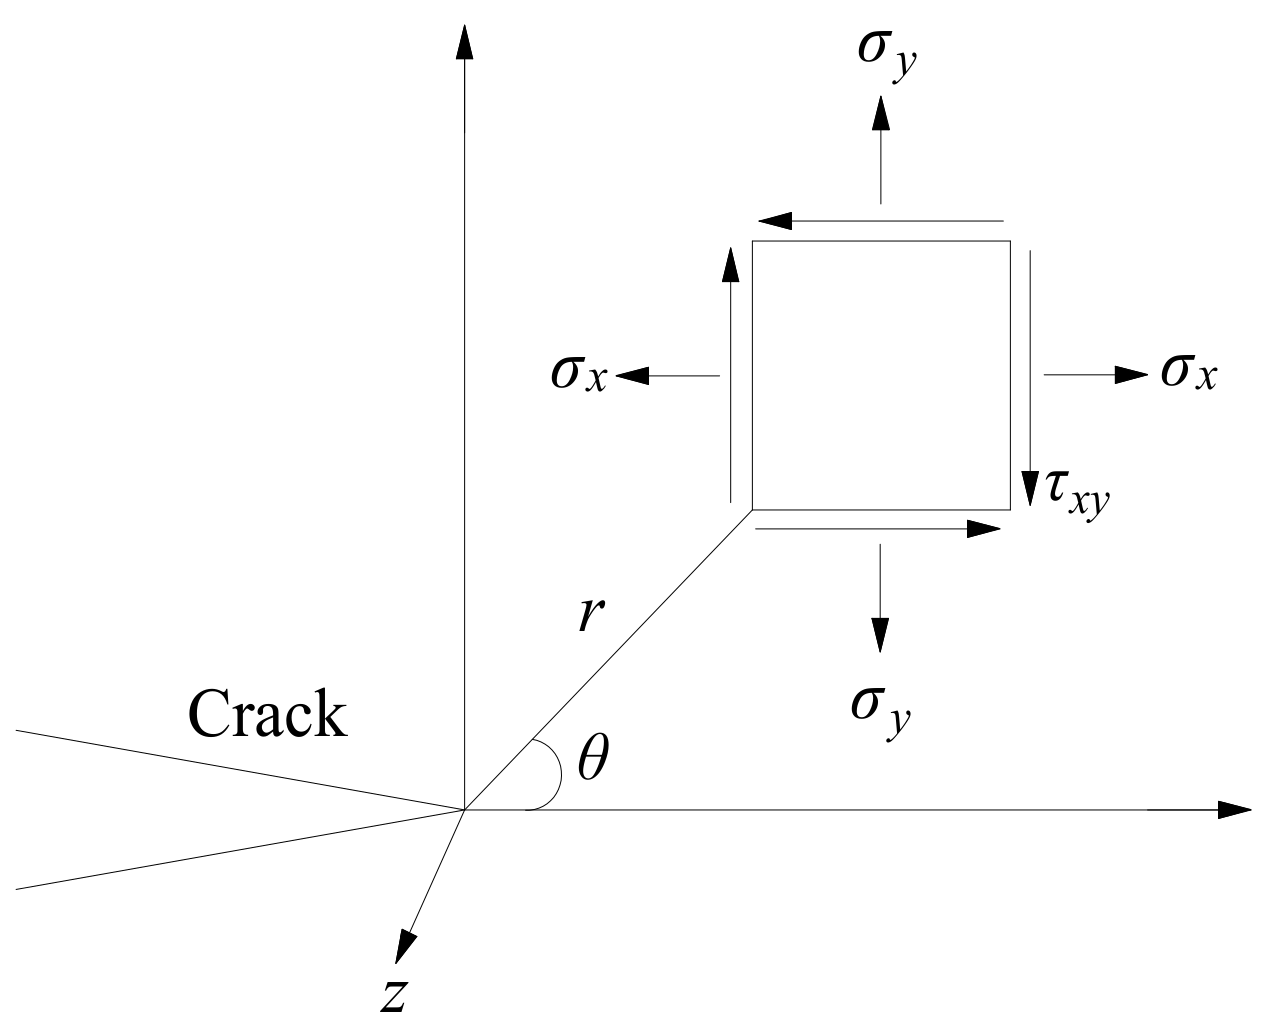
| θ | Crack propagation angle (°) |
| r | Crack propagation radius (m) |
| rIC | Critical crack propagation radius (m) |
| σx | Normal stress in the x-direction (MPa) |
| σy | Normal stress in the y-direction (MPa) |
| τxy | Shear stress (MPa) |
| σ1 | Maximum principal stress (MPa) |
| σ2 | Minimum principal stress (MPa) |
References
- Cui, G.D.; Ren, S.R.; Zhang, L.; Ezekiel, J.; Enechukwu, C.; Wang, Y.; Zhang, R. Geothermal exploitation from hot dry rocks via recycling heat transmission fluid in a horizontal well. Energy 2017, 128, 366–377. [Google Scholar] [CrossRef]
- Su, F.; Hamanaka, A.; Itakura, K.; Deguchi, G.; Sato, K.; Kodam, J. Evaluation of coal Combustion zone and gas energy recovery for underground coal gasification (UCG) process. Energy Fuels 2017, 31, 154–169. [Google Scholar] [CrossRef]
- Zhang, Z.T.; Zhang, R.; Xie, H.P.; Gao, M.Z.; Xie, J. Mining-induced coal permeability change under different mining layouts. Rock Mech. Rock Eng. 2016, 49, 3753–3768. [Google Scholar] [CrossRef]
- Feng, G.; Kang, Y.; Meng, T.; Hu, Y.Q.; Li, X.H. The influence of temperature on mode I fracture toughness and fracture characteristics of sandstone. Rock Mech. Rock Eng. 2017, 50, 2007–2019. [Google Scholar] [CrossRef]
- Feng, G.; Kang, Y.; Chen, F.; Liu, Y.W.; Wang, X.C. The influence of temperature on mixed-mode (I+II) and mode-II fracture toughness of sandstone. Eng. Fract. Mech. 2018, 189, 51–63. [Google Scholar] [CrossRef]
- Kuruppu, M.D.; Obara, Y.; Ayatollahi, M.R.; Chong, K.P.; Funatsu, T. ISRM-suggested method for determining the mode I static fracture toughness using semi-circular bend specimen. Rock Mech. Rock Eng. 2013, 47, 267–274. [Google Scholar] [CrossRef]
- Zuo, J.-P.; Wang, J.-T.; Sun, Y.-J.; Chen, Y.; Jiang, G.-H.; Li, Y.-H. Effects of thermal treatment on fracture characteristics of granite from Beishan, a possible high-level radioactive waste disposal site in China. Eng. Fract. Mech. 2017, 182, 425–437. [Google Scholar] [CrossRef]
- Ayatollahi, M.R.; Zakeri, M. An improved definition for mode I and mode II crack problems. Eng. Fract. Mech. 2017, 175, 235–246. [Google Scholar] [CrossRef]
- Monfared, M.M.; Ayatollahi, M. Interactions of multiple cracks in a transversely isotropic piezoelectric plane under mixed mode condition. Eng. Fract. Mech. 2017, 180, 87–104. [Google Scholar] [CrossRef]
- Bearman, R.A. The use of the point load test for the rapid estimation of mode I fracture toughness. Int. J. Rock Mech. Min. Sci. 1999, 36, 257–263. [Google Scholar] [CrossRef]
- Whittaker, B.N.; Singh, R.N.; Sun, G. Rock Fracture Mechanics—Principles, Design and Applications; Elsevier Science Publisher: Amsterdam, The Netherlands, 1992. [Google Scholar]
- Brown, G.; Reddish, D. Experimental relations between rock fracture toughness and density. Int. J. Rock Mech. Min. 1997, 34, 153–155. [Google Scholar] [CrossRef]
- Nasseri, M.H.B.; Schubnel, A.; Young, R.P. Coupled evolutions of fracture toughness and elastic wave velocities at high crack density in thermally treated Westerly granite. Int. J. Rock Mech. Min. Sci. 2007, 44, 601–616. [Google Scholar] [CrossRef]
- Gunsallus, K.L.; Kulhawy, F.H. A comparative evaluation of rock strength measures. Int. J. Rock Mech. Min. Sci. Geomech. Abstr. 1984, 21, 233–248. [Google Scholar] [CrossRef]
- Bhagat, R.B. Mode I fracture toughness of coal. Int. J. Min. Eng. 1985, 3, 229–236. [Google Scholar] [CrossRef]
- Haberfield, C.; Johnston, I. Relationship between fracture toughness and tensile strength for geomaterials. In Proceedings of the 12th International Conference on Soil Mechanics and Foundation Engineering (SMFE 1989), Rio De Janeiro, Brazil, 13–18 August 1989; pp. 47–52. [Google Scholar]
- Harison, J.A.; Hardin, B.O.; Mahboub, K. Fracture toughness of compacted cohesive soills using ring test. J. Geotech. Eng. 1994, 120, 872–891. [Google Scholar]
- Zhang, Z.X. An empirical relation between mode I fracture toughness and the tensile strength of rock. Int. J. Rock Mech. Min. Sci. 2002, 39, 401–406. [Google Scholar] [CrossRef]
- Wang, J.-J.; Zhu, J.-G.; Chiu, C.; Zhang, H. Experimental study on fracture toughness and tensile strength of clay. Eng. Geol. 2007, 94, 65–75. [Google Scholar] [CrossRef]
- Lakshmikantha, M.R.; Prat, P.C.; Ledesma, A. Discussion on “Experimental study on fracture toughness and tensile strength of a clay” [Engineering Geology 94 (2007) 64–75]. Eng. Geol. 2008, 101, 295–296. [Google Scholar] [CrossRef]
- Deng, H.F.; Zhu, M.; Li, J.L.; Wang, Y.; Luo, Q.; Yuan, X.F. Study of mode-I fracture toughness and its correlation with strength parameters of sandstone. Rock Soil Mech. 2012, 33, 3585–3591. (In Chinese) [Google Scholar]
- Hudson, J.A.; Brown, E.T.; Rummel, F. The controlled failure of rock discs and rings loaded in diametral compression. Int. J. Rock Mech. Min. Sci. Geomech. Abstr. 1972, 9, 241–248. [Google Scholar] [CrossRef]
- Bieniawski, Z.T.; Hawkes, I. Suggested methods for determining tensile strength of rock materials. Int. J. Rock Mech. Min. Sci. Geomech. Abstr. 1978, 15, 99–103. [Google Scholar]
- Gholami, R.; Rasouli, V. Mechanical and elastic properties of transversely isotropic slate. Rock Mech. Rock Eng. 2014, 47, 1763–1773. [Google Scholar] [CrossRef]
- Talukdar, M.; Guha, D.; Singh, T.N. Correlating mode-I fracture toughness and mechanical properties of heat-treated crystalline rocks. J. Rock Mech. Geotech. Eng. 2018, 10, 91–101. [Google Scholar] [CrossRef]
- Yin, T.; Li, X.; Cao, W.; Xia, K. Effects of thermal treatment on tensile strength of Laurentian granite using Brazilian test. Rock Mech. Rock Eng. 2015, 48, 2213–2223. [Google Scholar] [CrossRef]
- Mahanta, B.; Singh, T.; Ranjith, P. Influence of thermal treatment on mode I fracture toughness of certain Indian rocks. Eng. Geol. 2016, 210, 103–114. [Google Scholar] [CrossRef]
- Zhang, F.; Zhao, J.J.; Hu, D.W.; Skoczylas, F.; Shao, J.F. Laboratory investigation on physical and mechanical properties of granite after heating and water-cooling treatment. Rock Mech. Rock Eng. 2018, 5, 677–694. [Google Scholar] [CrossRef]
- Zhang, Z.X.; Kou, S.Q.; Lindqvist, P.; Yu, Y. The relationship between the fracture toughness and tensile strength of rock. In Strength Theories: Applications, Development and Prospects for 21st Century; Yu, M., Fan, S.C., Eds.; Science Press: Beijing, China, 1998; pp. 215–219. [Google Scholar]
- Kou, S.Q. Effect of thermal cracking damage on the deformation and failure of granite. Acta Mech. Sin. 1987, 19, 550–556. (In Chinese) [Google Scholar]
- Wang, G.D. Experiment Research on the Effects of Temperature and Viscoelastoplastic Analysis of Beishan Granite; Xi’an Institute of Science and Technology: Xi’an, China, 2003. (In Chinese) [Google Scholar]
- Cheng, J.; Zhao, S.S. Fracture Mechanics; Science Press: Beijing, China, 2006. (In Chinese) [Google Scholar]
- Xu, Z.L. Elasticity Mechanics; Higher Education Press: Beijing, China, 2016. (In Chinese) [Google Scholar]
- Erdogan, F.; Sih, G.C. On the crack extension path in plates under plane loading and transverse shear. ASMEJ Basic Eng. 1963, 85D, 519–525. [Google Scholar] [CrossRef]
- Hussain, M.A.; Pu, E.L.; Underwood, J.H. Strain energy release rate for a crack under combined model I and mode II. ASTM STP 1974, 560, 28. [Google Scholar] [CrossRef]
- Saghafi, H.; Ayatollahi, M.R.; Sistaninia, M. A modified MTS criterion (MMTS) for mixed-mode fracture toughness assessment of brittle materials. Mater. Sci. Eng. A 2010, 527, 5624–5630. [Google Scholar] [CrossRef]
- Ayatollahi, M.R.; Aliha, M.R.M. Cracked Brazilian disc specimen subjected to mode II deformation. Eng. Fract. Mech. 2005, 72, 493–503. [Google Scholar] [CrossRef]
- Golshani, A.; Okui, Y.; Oda, M.; Takemura, T. A micromechanical model for brittle failure of rock and its relation to crack growth observed in triaxial compression tests of granite. Mech. Mater. 2006, 38, 287–303. [Google Scholar] [CrossRef]
- Li, H.B.; Zhao, J.; Li, T.J. Micromechanical modelling of the mechanical properties of a granite under dynamic uniaxial compressive loads. Int. J. Rock Mech. Min. 2000, 37, 923–935. [Google Scholar] [CrossRef]
- Golshani, A.; Oda, M.; Okui, Y.; Takemura, T.; Munkhtogoo, E. Numerical simulation of the excavation damaged zone around an opening in brittle rock. Int. J. Rock Mech. Min. Sci. 2007, 44, 835–845. [Google Scholar] [CrossRef]
- Atkinson, C.; Smelser, R.E.; Sanchez, J. Combined mode fracture via the cracked Brazilian disk. Int. J. Fract. 1982, 18, 279–291. [Google Scholar]
- Meredith, P.G.; Atkinson, B.K. Fracture toughness and subcritical crack growth during high-temperature tensile deformation of Westerly granite and Black gabbro. Phys. Earth Planet. Inter. 1985, 39, 33–51. [Google Scholar] [CrossRef]
- Roy, D.G.; Singh, T.N. Effect of heat-treated and layer orientation on the tensile strength of a crystalline rock under Brazilian test condition. Rock Mech. Rock Eng. 2016, 49, 1663–1677. [Google Scholar]
- Zhang, Z.X.; Yu, J.; Kou, S.Q.; Lindqvist, P.A. Effects of high temperatures on dynamic rock fracture. Int. J. Rock Mech. Min. 2001, 38, 211–225. [Google Scholar] [CrossRef]
- Lajtai, E.Z. A theoretical and experimental evaluation of the Griffith theory of brittle fracture. Tectonophysics 1970, 11, 129–156. [Google Scholar] [CrossRef]
- Melin, S. When does a crack grow under mode II conditions? Int. J. Fract. 1986, 30, 103–114. [Google Scholar]
- Kranz, R.L. Crack growth and development during creep of Barre Granite. Int. J. Rock Mech. Min. Sci. Geomech. Abstr. 1979, 16, 23–35. [Google Scholar] [CrossRef]
- Janach, W. Failure of granite under compression. Int. J. Rock Mech. Min. Sci. Geomech. Abstr. 1977, 14, 209–215. [Google Scholar] [CrossRef]
- Tapponnier, P.; Brace, W.F. Development of stress-induced microcracks in Westerly granite. Int. J. Rock Mech. Min. Sci. Geomech. Abstr. 1976, 13, 103–112. [Google Scholar] [CrossRef]


| Diameter (D) | Thickness (B) | Artificial-Notch Length (a) | Span Length (S) |
|---|---|---|---|
| 50 mm | 20 mm | 12.5 mm | 30.5 mm |
| FS Marble | FS Gabbro | Stripa Granite | BS Granite | SC Sandstone | ||||||
|---|---|---|---|---|---|---|---|---|---|---|
| T | KIC | σt | KIC | σt | KIC | σt | KIC | σt | KIC | σt |
| 20 | 0.85 | 6.20 | 2.68 | 17.30 | 2.15 | 15.40 | 0.93 | 8.71 | 1.11 | 8.20 |
| 100 | 0.63 | 4.60 | 2.26 | 15.40 | 2.19 | 16.80 | - | - | 1.13 | 8.15 |
| 200 | 0.33 | 4.30 | 2.02 | 13.90 | 2.08 | 16.20 | 1.02 | 10.50 | 0.99 | 7.18 |
| 300 | 0.25 | 3.80 | 1.70 | 12.10 | 1.83 | 19.50 | 0.70 | 6.53 | 0.93 | 7.25 |
| 400 | 0.13 | 3.00 | 1.44 | 10.00 | - | - | 0.41 | 6.21 | 0.84 | 6.93 |
| 500 | 0.09 | 2.50 | 1.28 | 9.90 | - | - | 0.26 | 5.03 | 0.81 | 6.62 |
| 600 | - | - | 0.98 | 9.30 | 0.49 | 5.40 | 0.03 | 1.11 | 0.64 | 5.10 |
| T (°C) | Linear Formula | R2 | Exponential Formula | R2 |
|---|---|---|---|---|
| 20 | y = 0.1420x | 0.9448 | y = 0.4288exp(0.1049x) | 0.9728 |
| 100 | y = 0.1379x | 0.9821 | y = 0.4328exp(0.1025x) | 0.9637 |
| 200 | y = 0.1274x | 0.9035 | y = 0.2376exp(0.1444x) | 0.8713 |
| 300 | y = 0.1077x | 0.8457 | y = 0.2959exp(0.1100x) | 0.7027 |
| 400 | y = 0.1184x | 0.7721 | y = 0.0508exp(0.3512x) | 0.9421 |
| 500 | y = 0.1129x | 0.8163 | y = 0.0430exp(0.3687x) | 0.9184 |
| 600 | y = 0.1054x | 0.9478 | y = 0.0335exp(0.4255x) | 0.8092 |
| T (°C) | FS Marble | FS Gabbro | SP Granite | BS Granite | SC Sandstone |
|---|---|---|---|---|---|
| 25 | 0.00299 | 0.00382 | 0.00310 | 0.00181 | 0.00292 |
| 100 | 0.00299 | 0.00343 | 0.00270 | - | 0.00306 |
| 200 | 0.00094 | 0.00336 | 0.00262 | 0.00150 | 0.00303 |
| 300 | 0.00069 | 0.00314 | 0.00140 | 0.00183 | 0.00262 |
| 400 | 0.00030 | 0.00330 | - | 0.00069 | 0.00234 |
| 500 | 0.00021 | 0.00266 | - | 0.00043 | 0.00238 |
| 600 | - | 0.00177 | 0.00131 | 0.00012 | 0.00251 |
© 2019 by the authors. Licensee MDPI, Basel, Switzerland. This article is an open access article distributed under the terms and conditions of the Creative Commons Attribution (CC BY) license (http://creativecommons.org/licenses/by/4.0/).
Share and Cite
Feng, G.; Wang, X.-c.; Kang, Y.; Luo, S.-g.; Hu, Y.-q. Effects of Temperature on the Relationship between Mode-I Fracture Toughness and Tensile Strength of Rock. Appl. Sci. 2019, 9, 1326. https://doi.org/10.3390/app9071326
Feng G, Wang X-c, Kang Y, Luo S-g, Hu Y-q. Effects of Temperature on the Relationship between Mode-I Fracture Toughness and Tensile Strength of Rock. Applied Sciences. 2019; 9(7):1326. https://doi.org/10.3390/app9071326
Chicago/Turabian StyleFeng, Gan, Xiao-chuan Wang, Yong Kang, Shi-gang Luo, and Yao-qing Hu. 2019. "Effects of Temperature on the Relationship between Mode-I Fracture Toughness and Tensile Strength of Rock" Applied Sciences 9, no. 7: 1326. https://doi.org/10.3390/app9071326
APA StyleFeng, G., Wang, X.-c., Kang, Y., Luo, S.-g., & Hu, Y.-q. (2019). Effects of Temperature on the Relationship between Mode-I Fracture Toughness and Tensile Strength of Rock. Applied Sciences, 9(7), 1326. https://doi.org/10.3390/app9071326