Article

Numerical and Statistical Analyses of Tsunami Heights with the L-Moments Method


1
Department of Civil and Environmental Engineering, Hanyang University, Seoul 04763, Korea
2
Division of Civil Engineering, Hyundai Engineering and Cons. Co., Ltd., Seoul 03058, Korea
*
Author to whom correspondence should be addressed.
Appl. Sci. 2019, 9(24), 5517; https://doi.org/10.3390/app9245517
Submission received: 25 September 2019 / Revised: 9 December 2019 / Accepted: 11 December 2019 / Published: 15 December 2019

Abstract

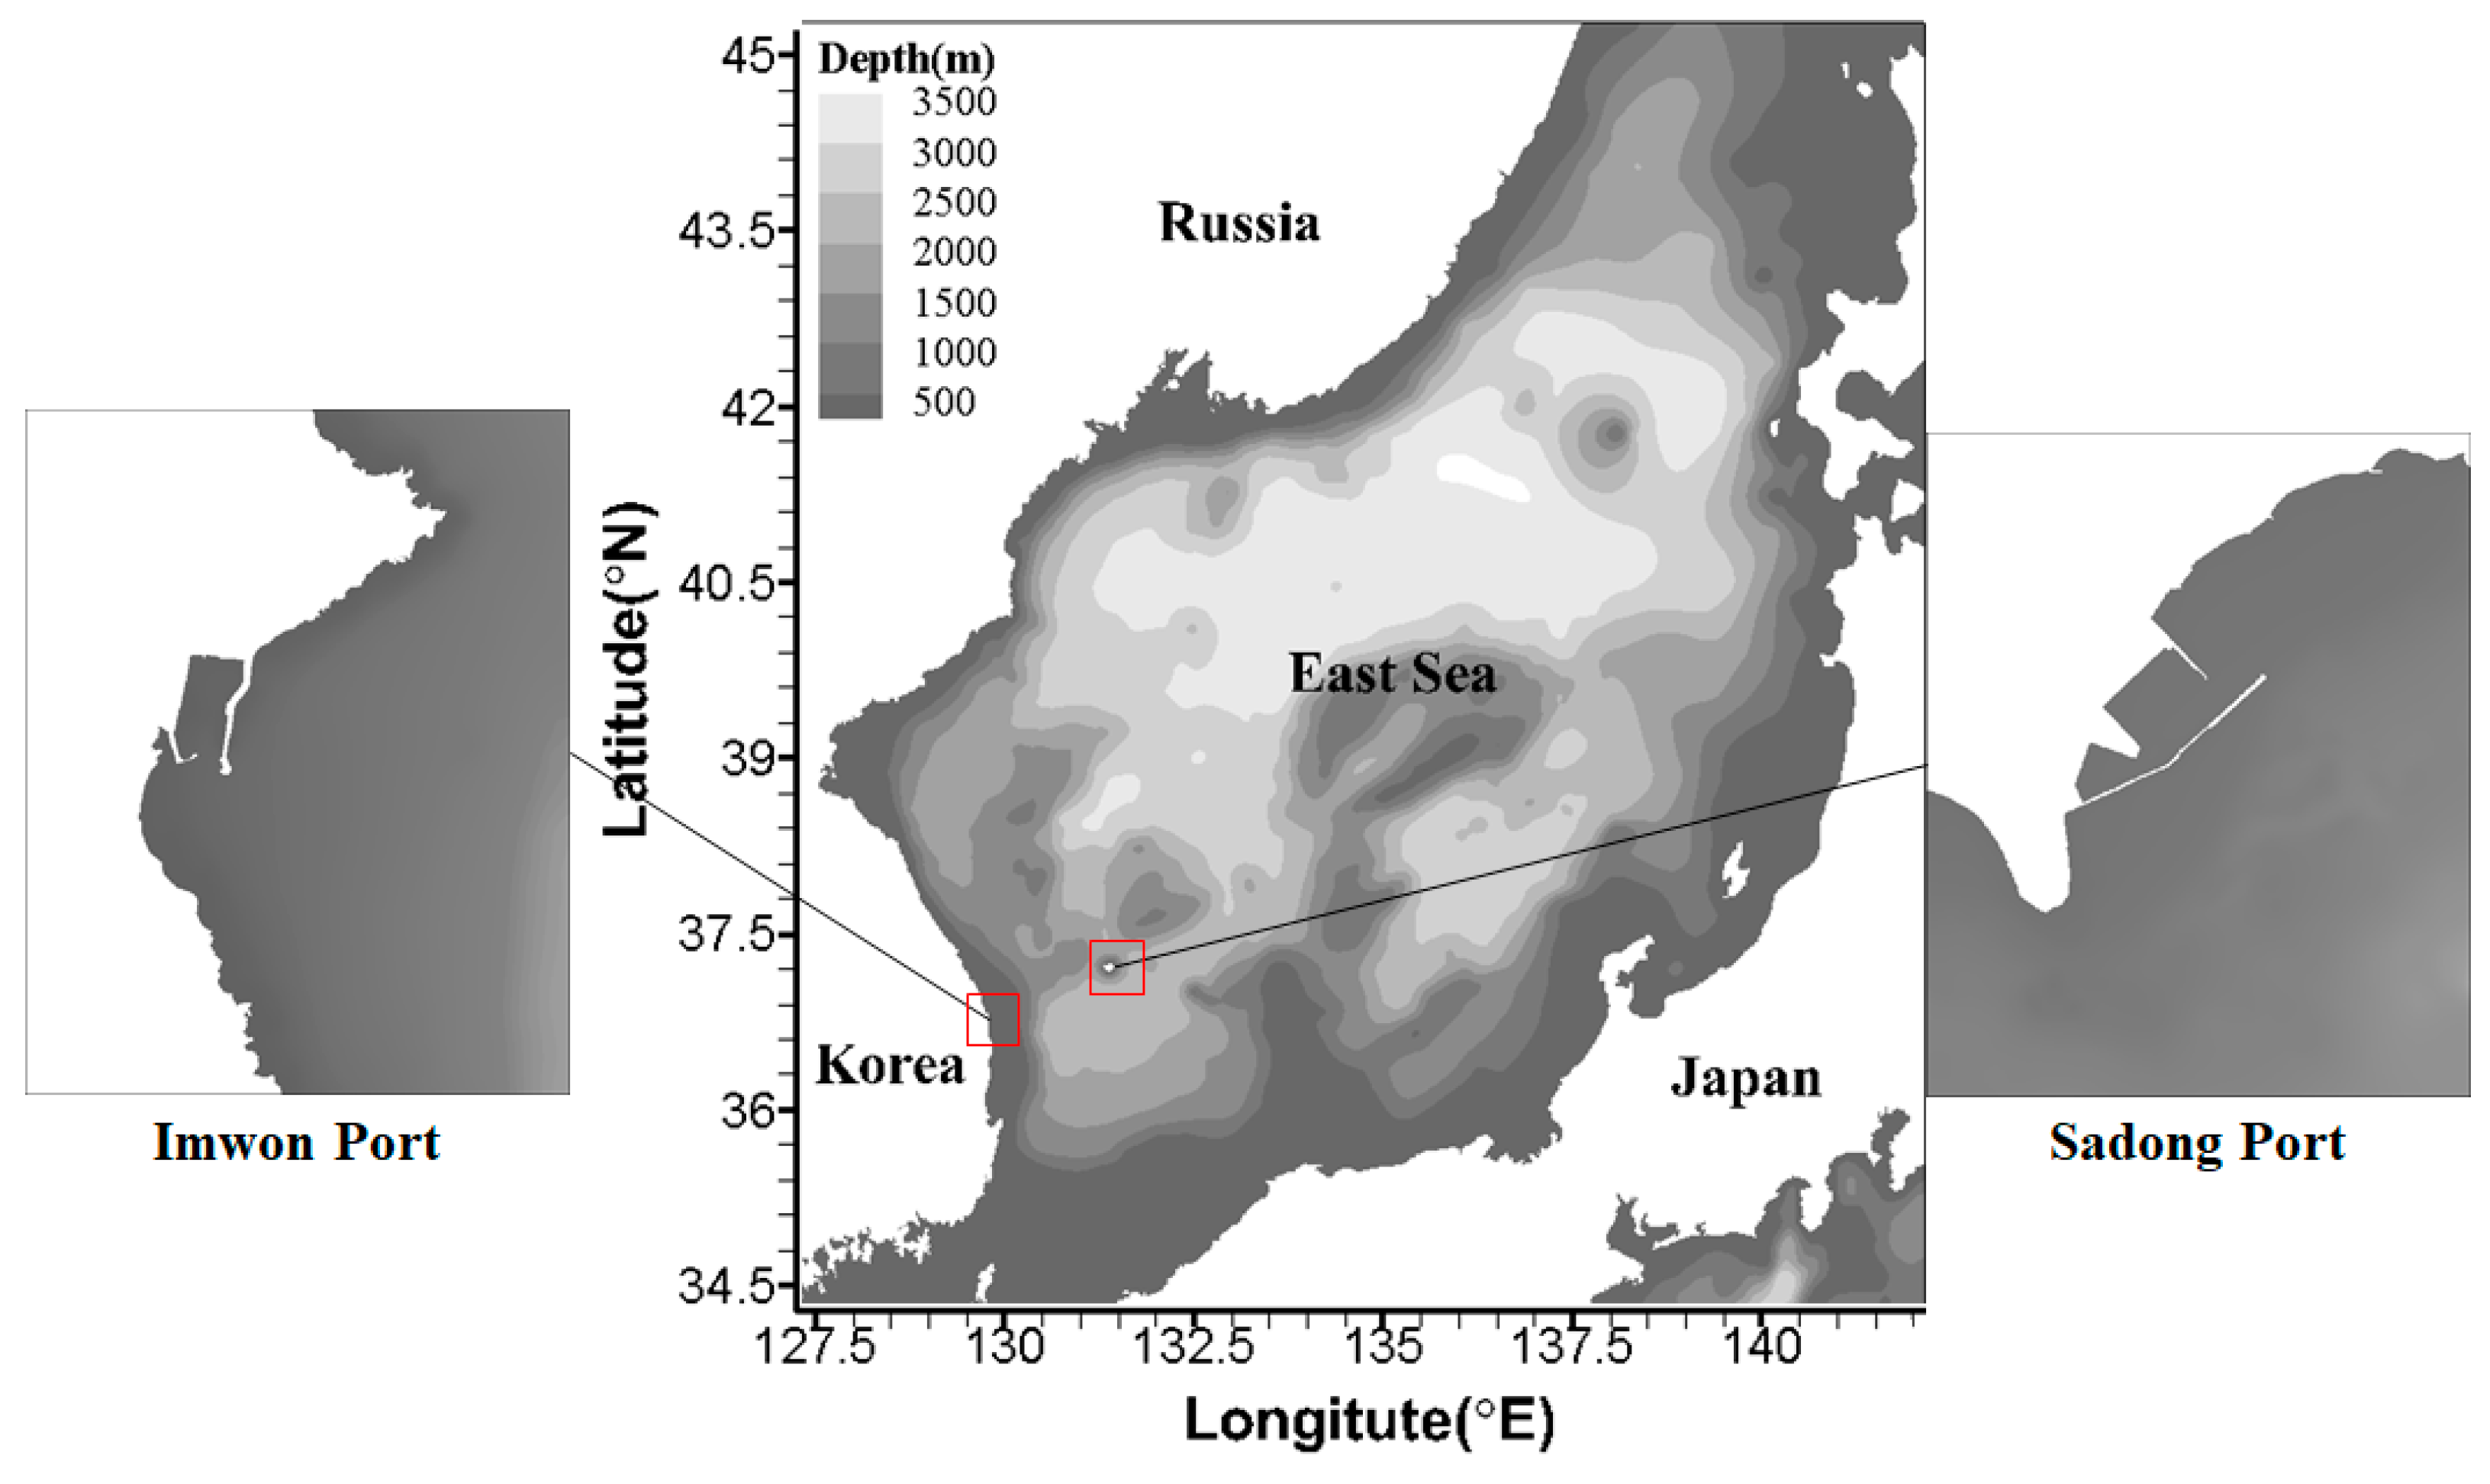
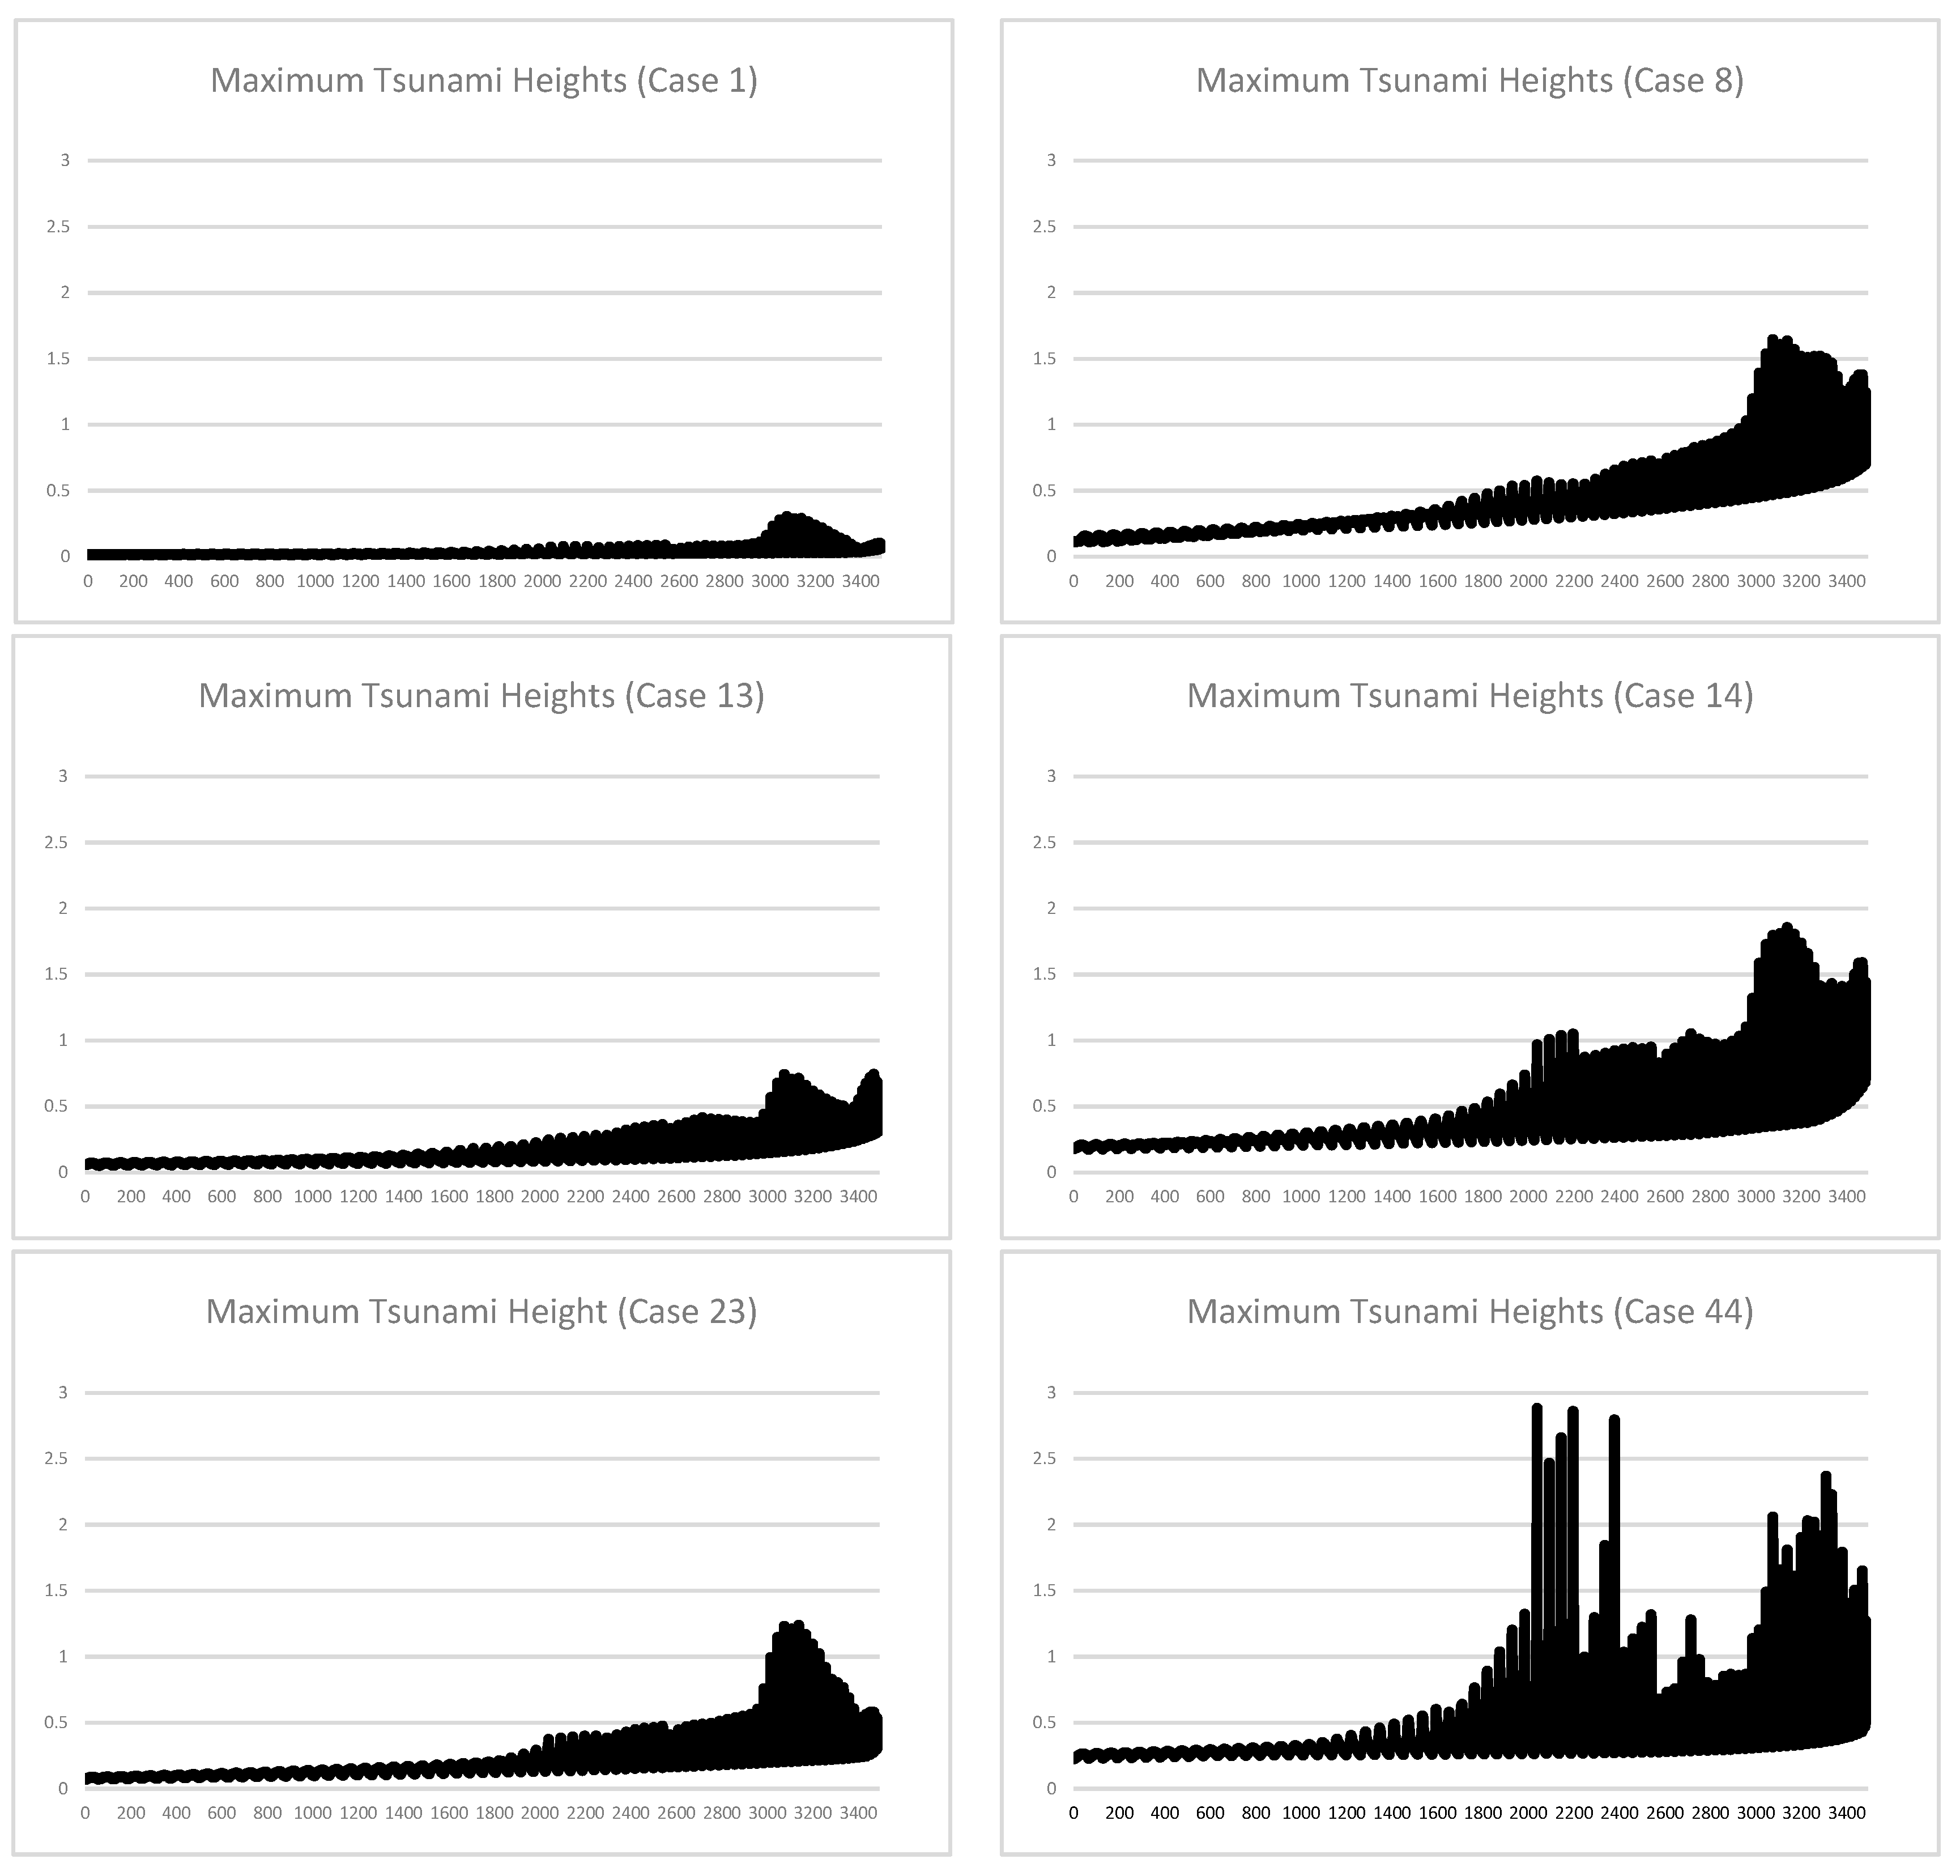
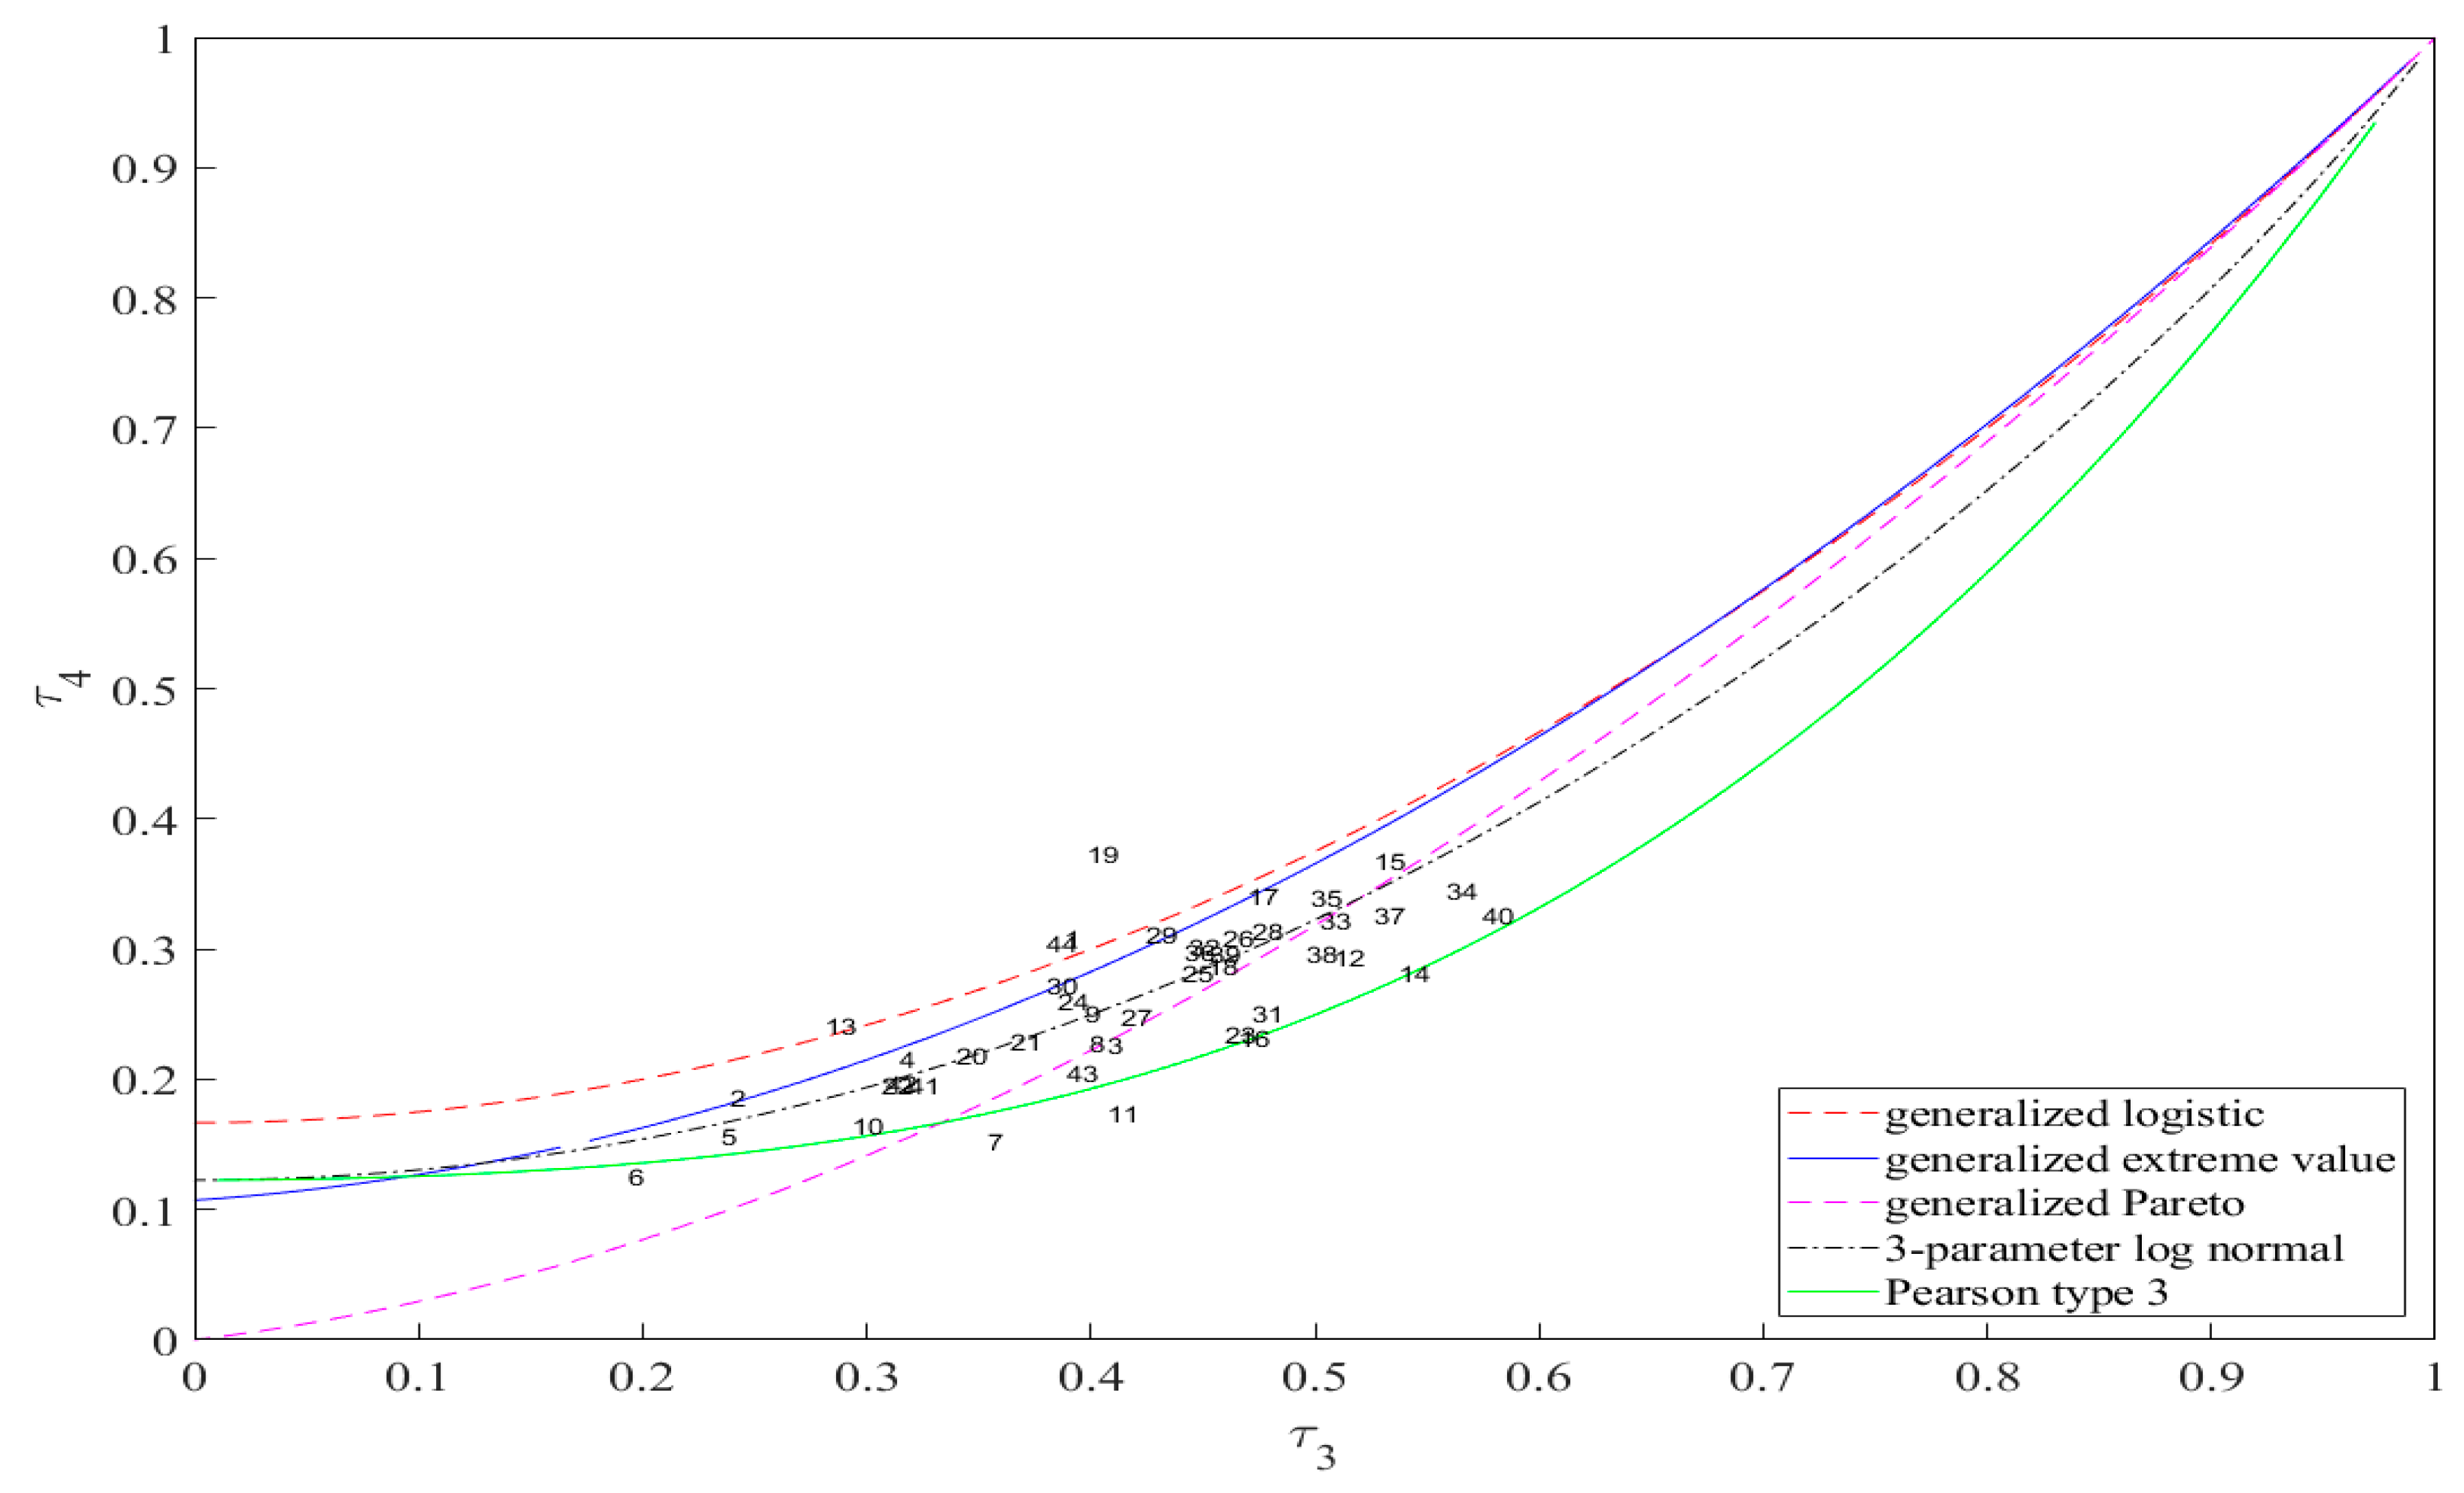
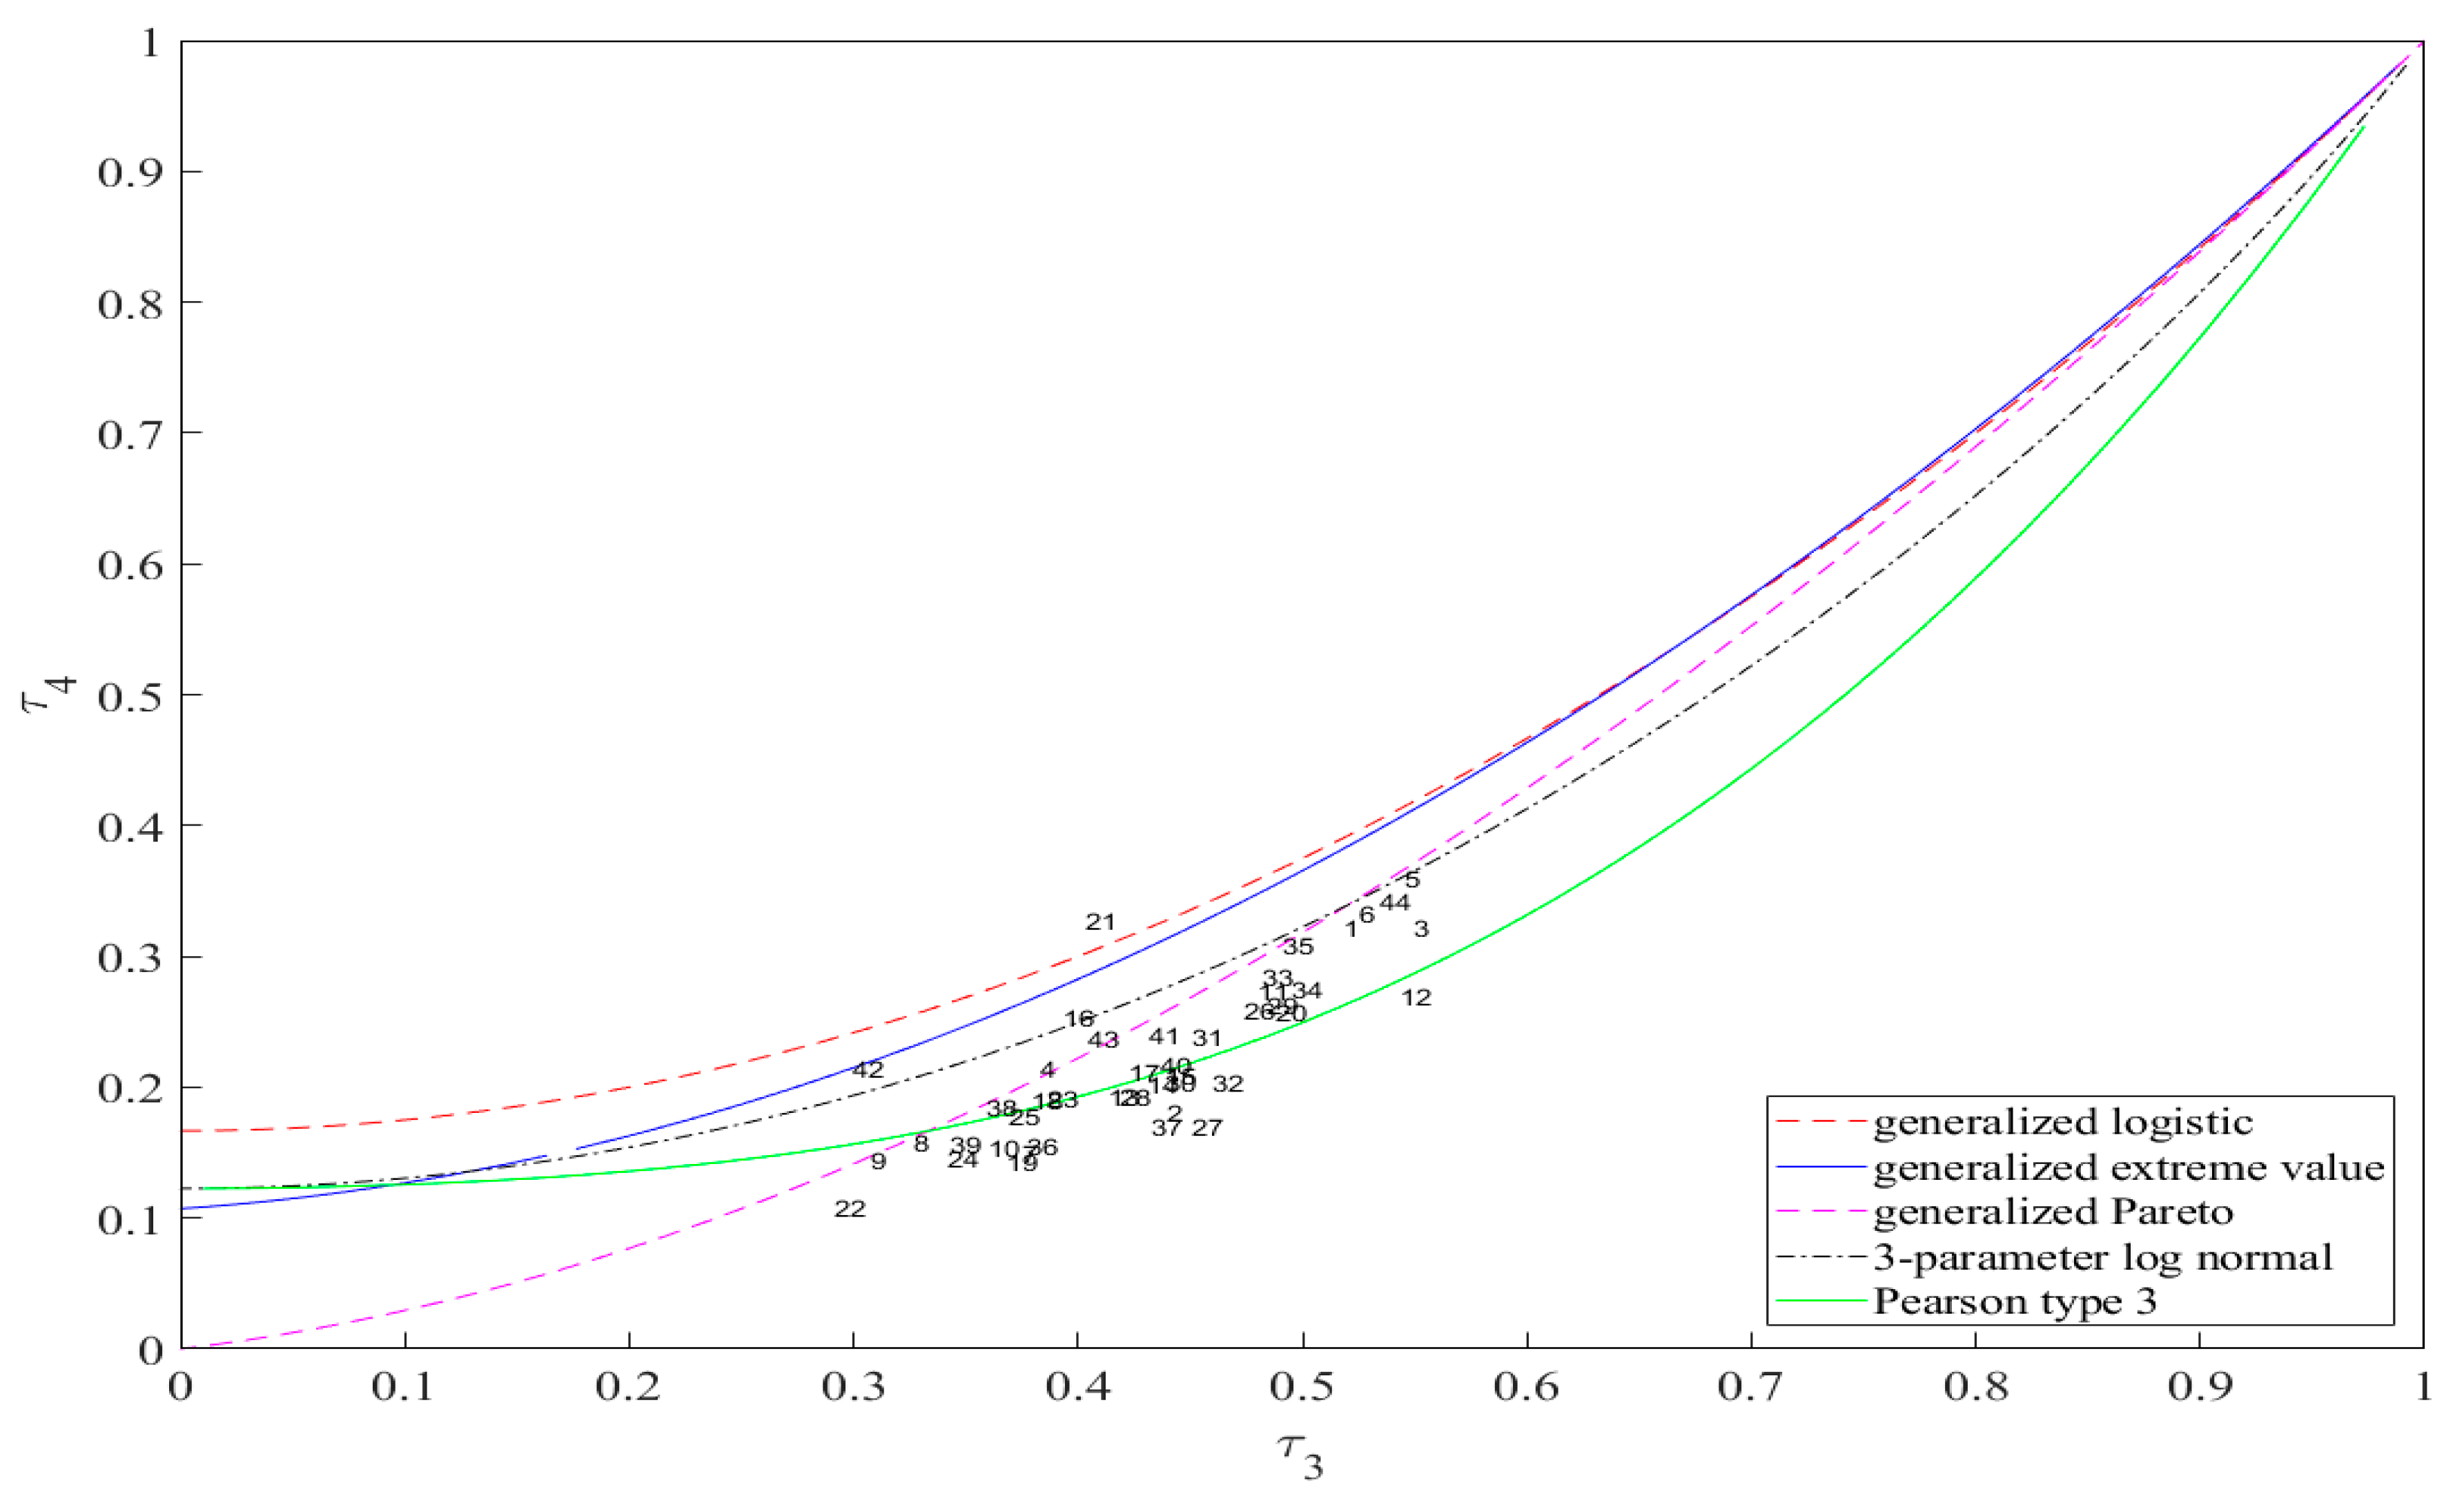
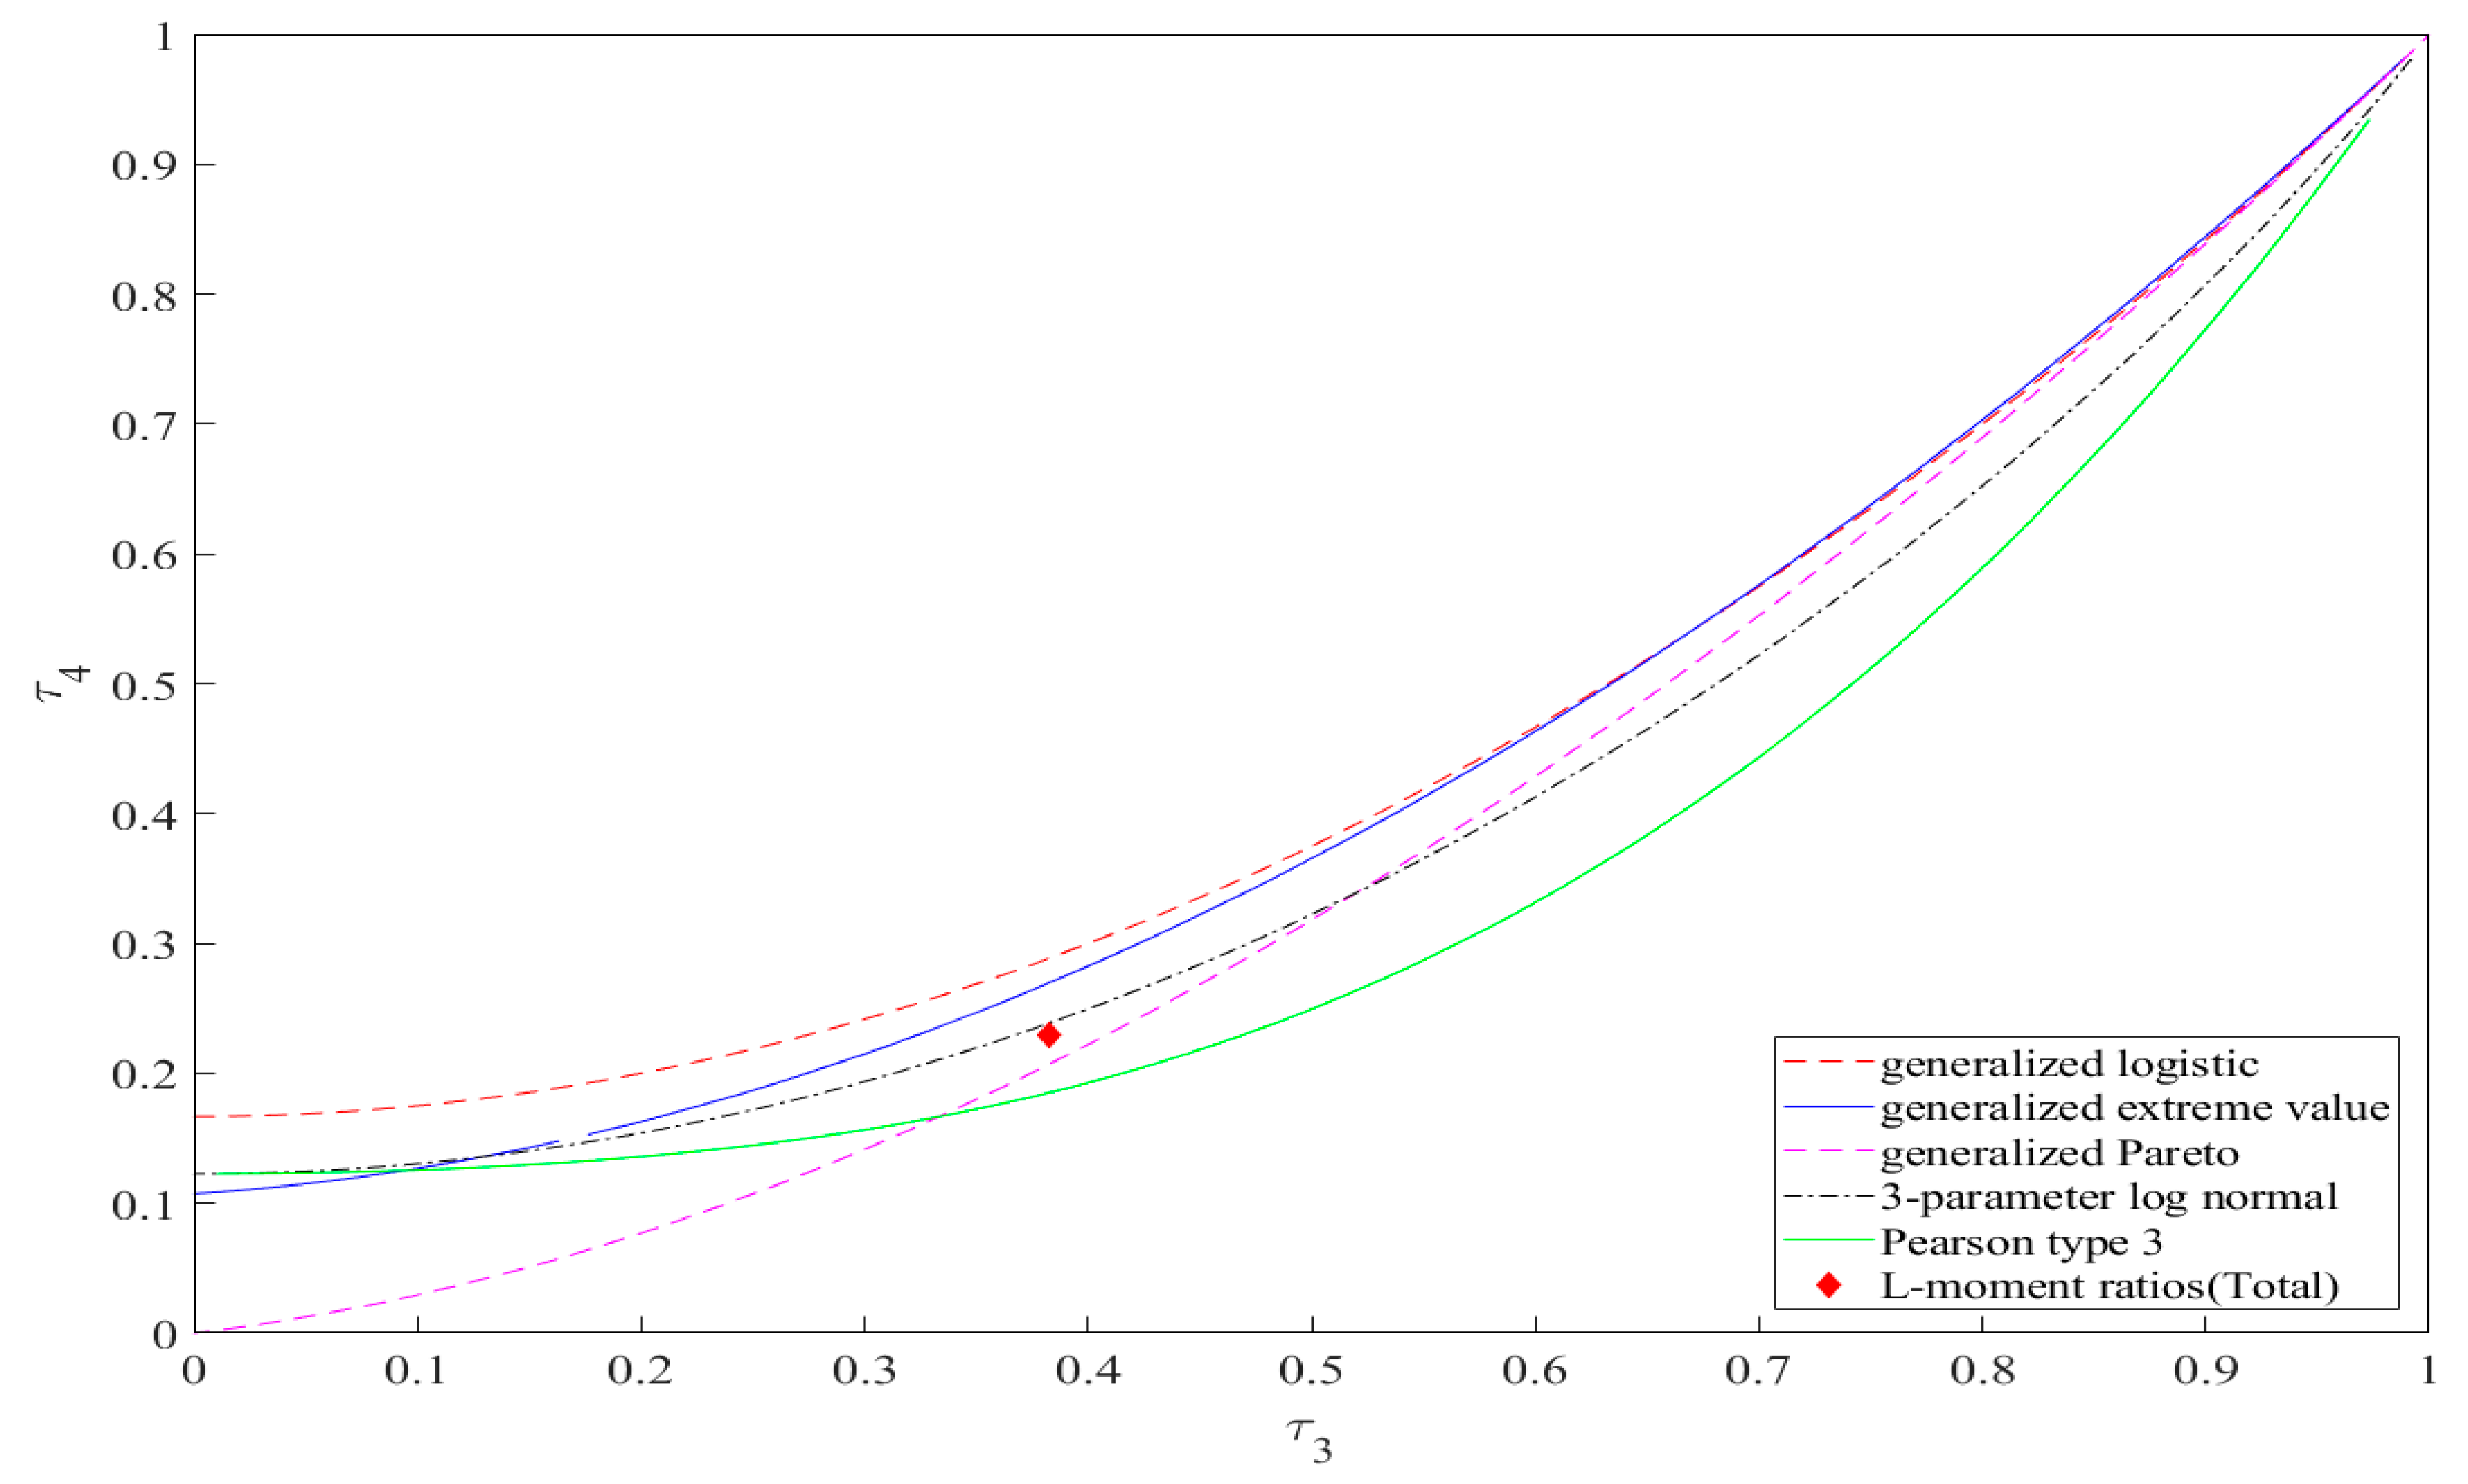
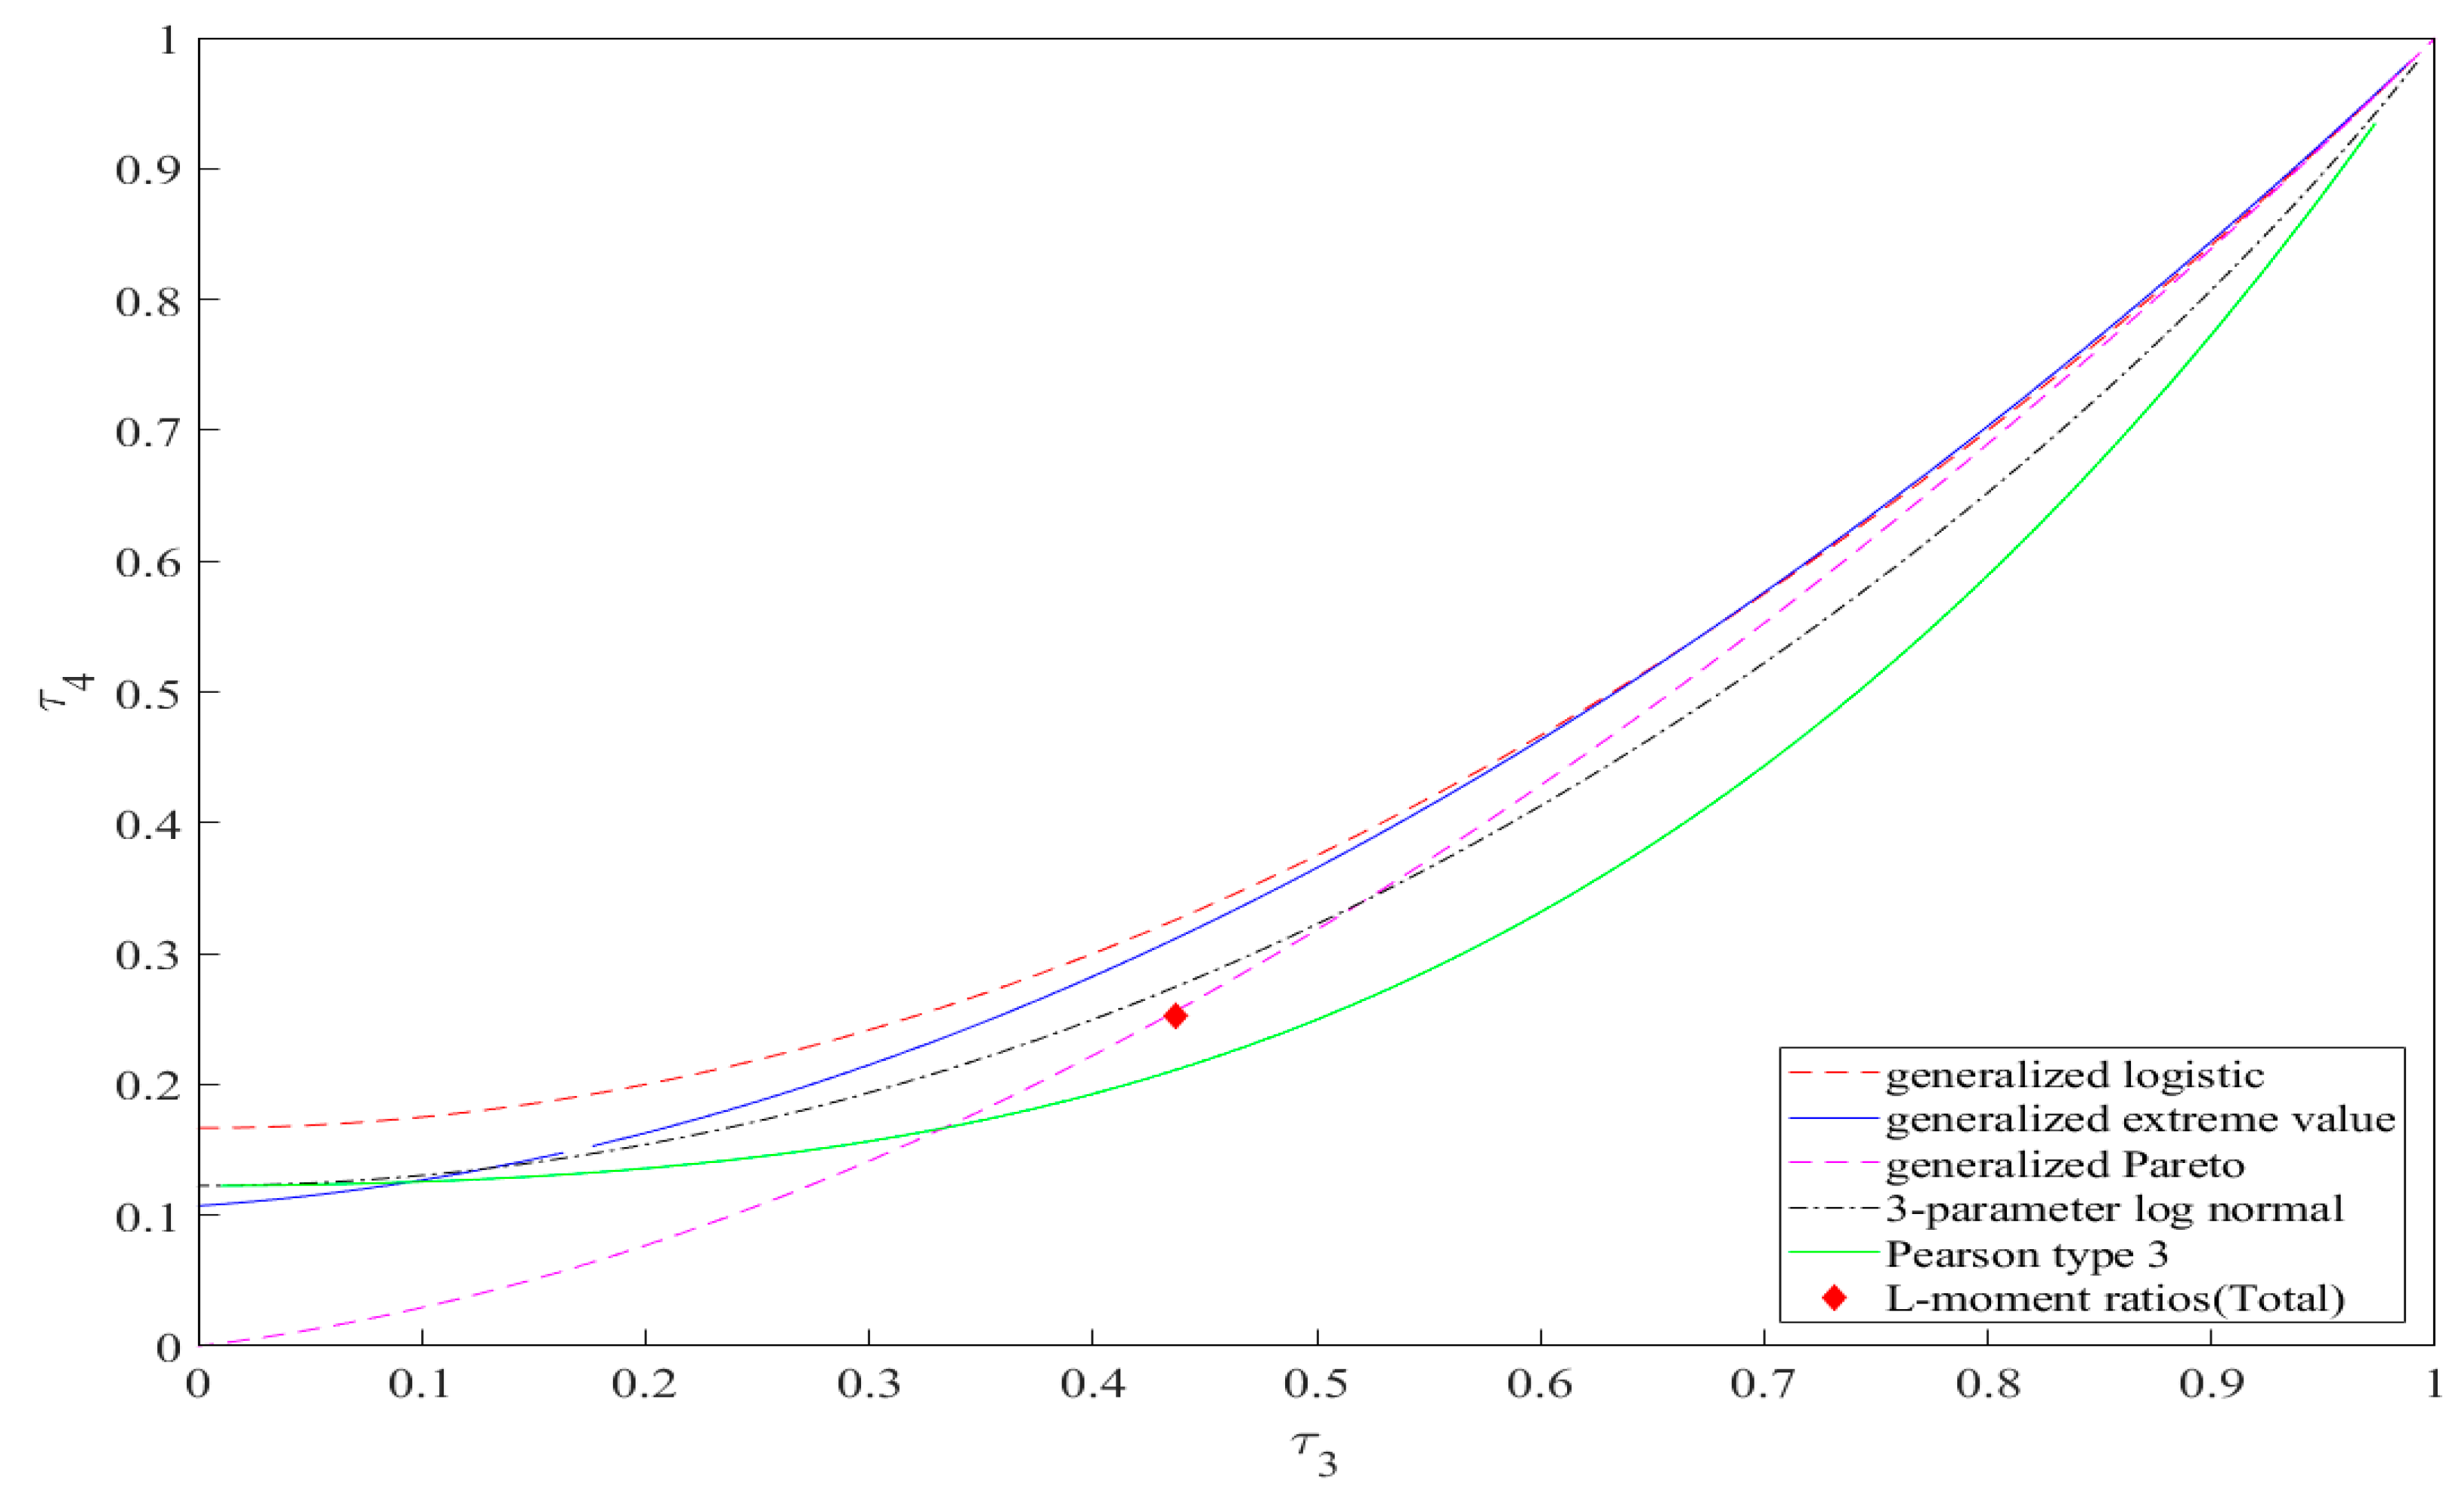
As devastating and unpredictable tsunamis generated by underwater earthquakes are occurring more frequently, the need for tsunami disaster prevention measures is rapidly increasing. In this study, tsunami heights were estimated, and the best-fit distribution was examined through a combination of numerical analyses and statistical methods. A numerical model was employed to estimate the tsunami heights, and the parameters were estimated using the method of L-moments applied to the estimated tsunami heights. The best-fit distribution was determined by applying the estimated parameters to the L-moment ratio diagram. The study areas were the Imwon Port and the Sadong Port located in the eastern part of the Korean Peninsula. The tsunami height distribution was represented by a log-normal distribution for the Imwon Port, whereas the distribution was represented by a generalized Pareto distribution for the Sadong Port. The study indicates that the distribution most commonly suggested by previous studies, i.e., the log-normal distribution, is not always accurate. Therefore, when performing statistical analysis on tsunami heights, the assumption of a log-normal distribution should be considered carefully.
Keywords: tsunami; wave height; L-moments method; L-moment ratio diagram; best-fit distribution tsunami; wave height; L-moments method; L-moment ratio diagram; best-fit distribution