1. Introduction
Statistical process control (SPC) is one of the monitoring schemes that can be applied to fault detection in manufacturing processes. The basic SPC procedure consists of two phases: the calculation of the statistics to represent the objects’ status from multivariate variables and the determination of the control limits that define an abnormal status of the objects.
There has been a variety of research with respect to the monitoring of manufacturing processes. Borionetti [
1] introduced multiple indices for process monitoring such as the surface parameters, bulk, and epitaxial layer, which were applicable to the monitoring of the process quality of wafers. Besides, a model for multistage processes from binary data was proposed by Shang et al. [
2] by using the hierarchical likelihood approach to illustrate the cumulative effects. Nguyen et al. [
3] suggested a three-stage prognosis for batch manufacturing composed of the extraction of the health index, the variation of representative values using the percentile measure, and the modeling of profiles as gamma processes.
As an advanced process monitoring methodology, the machine vision system (MVS) is actively used in the manufacturing area. MVS is an automated two-dimensional inspection system that monitors whether the objects of interest (e.g., products, processes) are in the normal status or not. This system has an advantage over manual investigation in that the inspection can be performed with less time and at a lower cost. Currently, the need for further research on automated two-dimensional (2D) monitoring algorithms is becoming greater to reduce the high inspection costs. MVS is repeatedly operated in the given sequence; obtaining images, analyzing raw data using an appropriate model, and training and updating the constructed model. In the general manufacturing area, MVS is applied to SPC to maintain productivity, diagnose manufacturing processes in real time, and detect faults early [
4]. For instance, MVS is utilized in the quality control of wafers, which are the basis of electronic integrated circuits (ICs) as components of semiconductors. As shown in
Figure 1, silicon crystal, called ingot, is melted by heat and sliced after hardening. The wafer is then fabricated in the manufacturing process through a series of masking, etching, and polishing to generate the IC. In the process, MVS can be introduced to each processing lot in order to monitor the status of wafers or detect any defective region, which leads to the increase in the yield of the manufacturing process.
Though image based multivariate SPC approaches are widely applied to distinguish if the process will have a defective status or not, using a representative value, there are few literature works providing the spatial information of faulty regions; e.g., the defect clustering area in the wafer bin map (WBM) resulting from the semiconductor manufacturing process. Tong et al. [
6] applied the traditional Hotelling’s T
2 chart to WBM data based on the number of defects and defect clustering indices. However, they failed to provide the spatial information of the clustered defects in WBM.
Lin [
7] used a wavelet transform based multivariate process approach for an automated visual inspection of ripple defects. Therein, he showed that wavelet-based methods had better performance than traditional approaches, which use raw images directly. Liu and Macgregor [
8] proposed the wavelet texture based T
2 control chart, where principal component analysis (PCA) was added in order to extract the feature vector in an efficient manner. To provide spatial information on image data, Tunák et al. [
9] introduced the spatial
chart to illustrate the density of woven images based on 2D discrete Fourier transform (DFT), which localized wavelet coefficients in the frequency domain. Later, by segmenting a single image matrix into 1D signals, Koosha et al. [
10] extracted wavelet basis functions from textile image data to detect out-of-control conditions using a generalized likelihood ratio chart, which was proposed by Reynolds and Liu [
11]. Existing approaches employ signal processing methods in SPC to improve the detection accuracy of abnormal status from (spatial) image data. The majority of studies assume normality or a pre-specified distribution a priori to calculate the statistics designating the control limits of a control chart. In reality, the process variables from (spatial) image data hardly follow a normal distribution. Moreover, almost entirely abnormal (or defective) regions in an image present relatively irregular patterns for each faulty area.
In this research, we propose a wavelet spectrum based 2D SPC (WS-2DSPC) to provide a robust output by considering the energy of wavelets, mainly under a nonparametric framework. A hierarchical structure decomposed by 2D discrete wavelet transform (DWT), which was proposed by Nicolis et al. [
12], is introduced to obtain the directional and spectral information of the faulty area. Then, the Hurst index as the representative statistic is estimated to reflect the nonstationary property of wavelet coefficients in fractional Gaussian fields. Finally, WS-2DSPC is constructed by setting the control limits based on the density of Hurst indices from image windows. The proposed method is applied to real WBM image data to prove its potential in fault detection or process monitoring.
The rest of this study is organized as follows. In
Section 2, we briefly review 2D DWT and wavelet spectrum analysis. The conceptual procedure of the proposed idea is presented in
Section 3.
Section 4 provides an application of the proposed idea to WBM image data for SPC purposes. This study is concluded in
Section 5, along with possible future research.
3. Wavelet Spectrum Based 2D Statistical Process Control
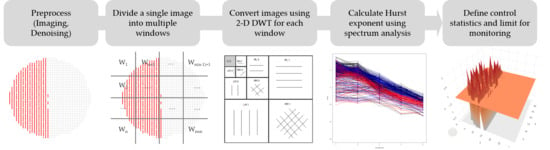
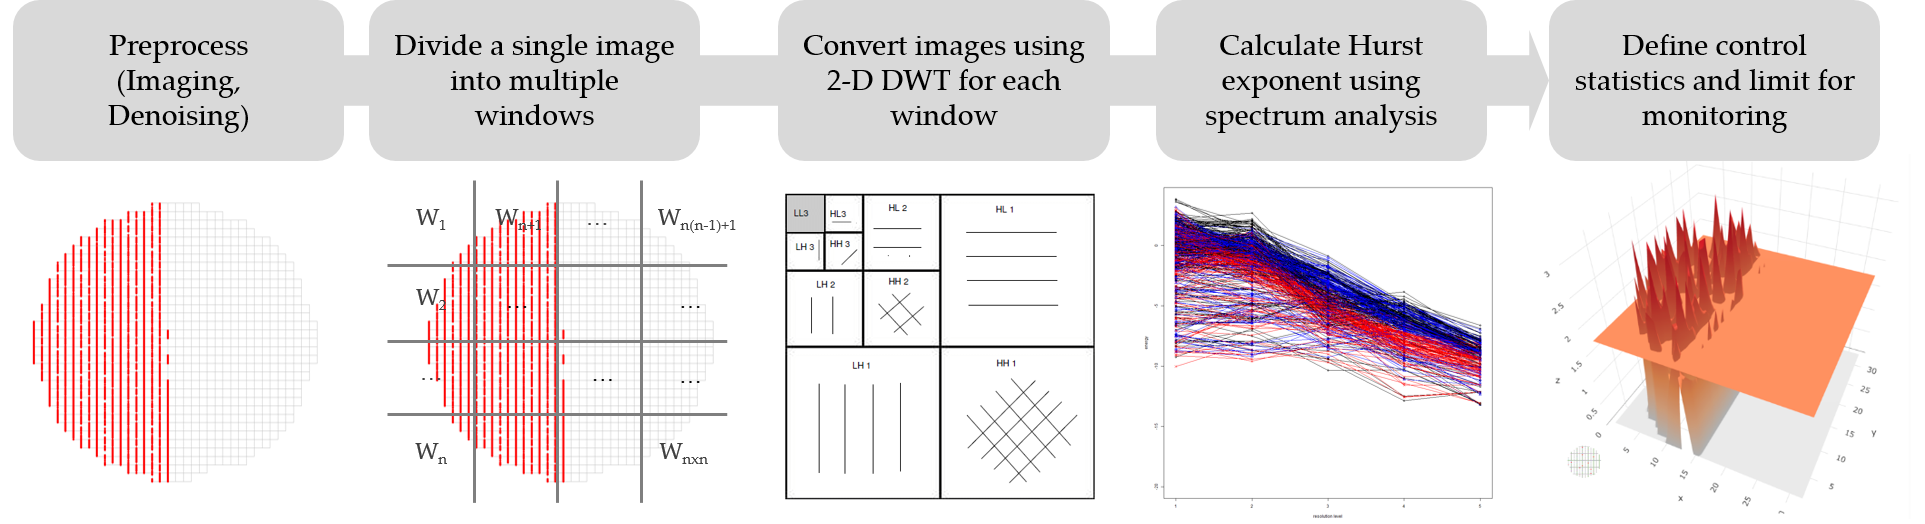
In this section, we propose a wavelet spectrum based two-dimensional statistical process control (WS-2DSPC). WS-2DSPC is a procedure to detect localized faulty regions, as well as overall defective regions without any distributional assumption. First, image features are selected from 2D DWT, and wavelet spectrum analysis is performed by calculating the fault strengths of divided windows. In order to obtain the spatial characteristics from a single image, the image should be divided into multiple windows to apply 2D DWT to each window. After dividing the image, 2D DWT is conducted for each window in order to capture the potential variability of signals, where the hierarchical structure of the detailed coefficients can be constructed, where the energy of the detailed coefficients is calculated for each resolution level. Once energies are calculated for each resolution level, a linear regression model can be constructed so that Hurst exponents of the divided windows are estimated as representative values. Based on the indices, a matrix of control statistics and control limits is computed, then the spatial control chart for the image is constructed. A detailed description of the WS-2DSPC procedure is listed below.
Step 1: Remove noise regions from raw images by applying the universal thresholding suggested by Donoho and Johnstone [
14], and transform the images into gray-scale. Thresholding is a de-noising method to remove the converted wavelet coefficients smaller than a specific threshold value. This step could be omitted if the images do not include any noise. In this step, we decomposed the applied images into the maximum resolution level to minimize the loss of useful information and preserve the local defects as much as possible.
Step 2: Split a
matrix of image
into multiple sub-matrices as windows,
, which are given as:
with the total number of windows
. Each window is divided into a
square matrix. To apply 2D DWT, it is recommended that both the image and divided windows have a
size format for a positive integer
. The larger width and height the windows have, the more possible is the precision of the monitoring; thus, the trade-off between accuracy and computation time must be considered. In order to obtain sufficient information from the wavelet hierarchy, it is desirable for the height and width of windows to be more than
.
Step 3: Conduct window-wise 2D DWT to extract the representations of divided images generated by wavelets. The number of resolution levels is dependent on the dimension of the sub-matrices. If the size of windows is
, 2D DWT provides
resolution levels containing wavelet coefficients. From this, three wavelet matrices per each window are generated, where the results come from three directions: horizontal, vertical, and diagonal. Conducting 2D DWT for every window using Equation (1), the
th window matrix is decomposed as:
Step 4: Estimate the Hurst exponents of each window in three directions using wavelet spectrum analysis, which is used for calculating the control statistics of WS-SPC. As mentioned in
Section 2.1, the detailed coefficients actually work as the key for capturing the vibrating pattern and energy of objects. The wavelet function of the original image (2) can be re-written with a self-similar model in the fractional Brownian field,
, and the detailed coefficients of a single window
can be defined as:
where the detailed coefficients have zero mean and variance:
If there is some replacement
for a simplification, Equation (8) is modified as:
Taking the natural logarithm of the variance of Equation (9), we can obtain the regression form of wavelet energy:
where
denotes a constant composed of the integrals of wavelet functions. Using the generalized power spectrum and linear relationship, the Hurst exponents and constants of the windows are estimated.
Step 5: Define the control statistics and control limits using the density of statistics to monitor the image process. In order to distinguish the irregular pattern from a normal region, the distance between each Hurst exponent and mode of windows is calculated. Since there are three features generated from each direction of 2D DWT, the distance matrix (denoted as
) for all features to the background are considered as:
where
is the background values or matrix of features and
is the Hurst matrix of a whole image containing individual (scalar) Hurst exponents from each window in direction
as:
For the distance measurements, the L1 norm is selected due to its appropriacy for the sparse model, where the distance matrix with a large normal region should be treated as the sparse matrix. From the above equation, the distance matrix is generated as the features of control statistics, which represent the degree of faults and energies with spectral information. Then, the control limits for the distance matrix are determined by the distribution of . In addition to the spectral information, we can calculate the control limit by estimating the kernel density of . Density estimation results show that the normal region and suspicious regions are divided into two parts based on the points of the valley in the distribution. If a probability of a suspicious region is more than the pre-determined rates, the maximizer of the suspicious density, , is considered as the upper control limit (UCL).
In WS-2DSPC, pre-processing of the image and division of a single image into multiple windows is conducted. After wavelet coefficients are obtained by 2D DWT, the Hurst matrices from three directions are generated from spectrum analysis, where the distance matrix is calculated from the Hurst features to represent the status of processes as control statistics. Hereafter, the calculation of the control limit is conducted based on the density of the distance matrices, which enables us to detect the abnormal status containing a high amount of energy distance from the original background. The suggested method gives robust results in a nonparametric framework with computational efficiency, regardless of the hyperparameters or pre-specified distribution. Using this procedure, a spatial monitoring scheme for 2D image data, as well as the calculation of fault strengths in the divided region can be provided.
4. Application and Discussion
In this section, we applied the suggested algorithm to wafer bin map (WBM) data provided by a semiconductor company in Korea. This data contained the defective information of WBMs during the manufacturing processes, which provided the X-Y coordinate of defects in each WBM. As shown in
Table 1, the identification code of the lot, timestamp, and relative position of defects from the center (0, 0) could be obtained from the data. In order to monitor the continuous status in a single lot, the data generated from a specified lot were considered.
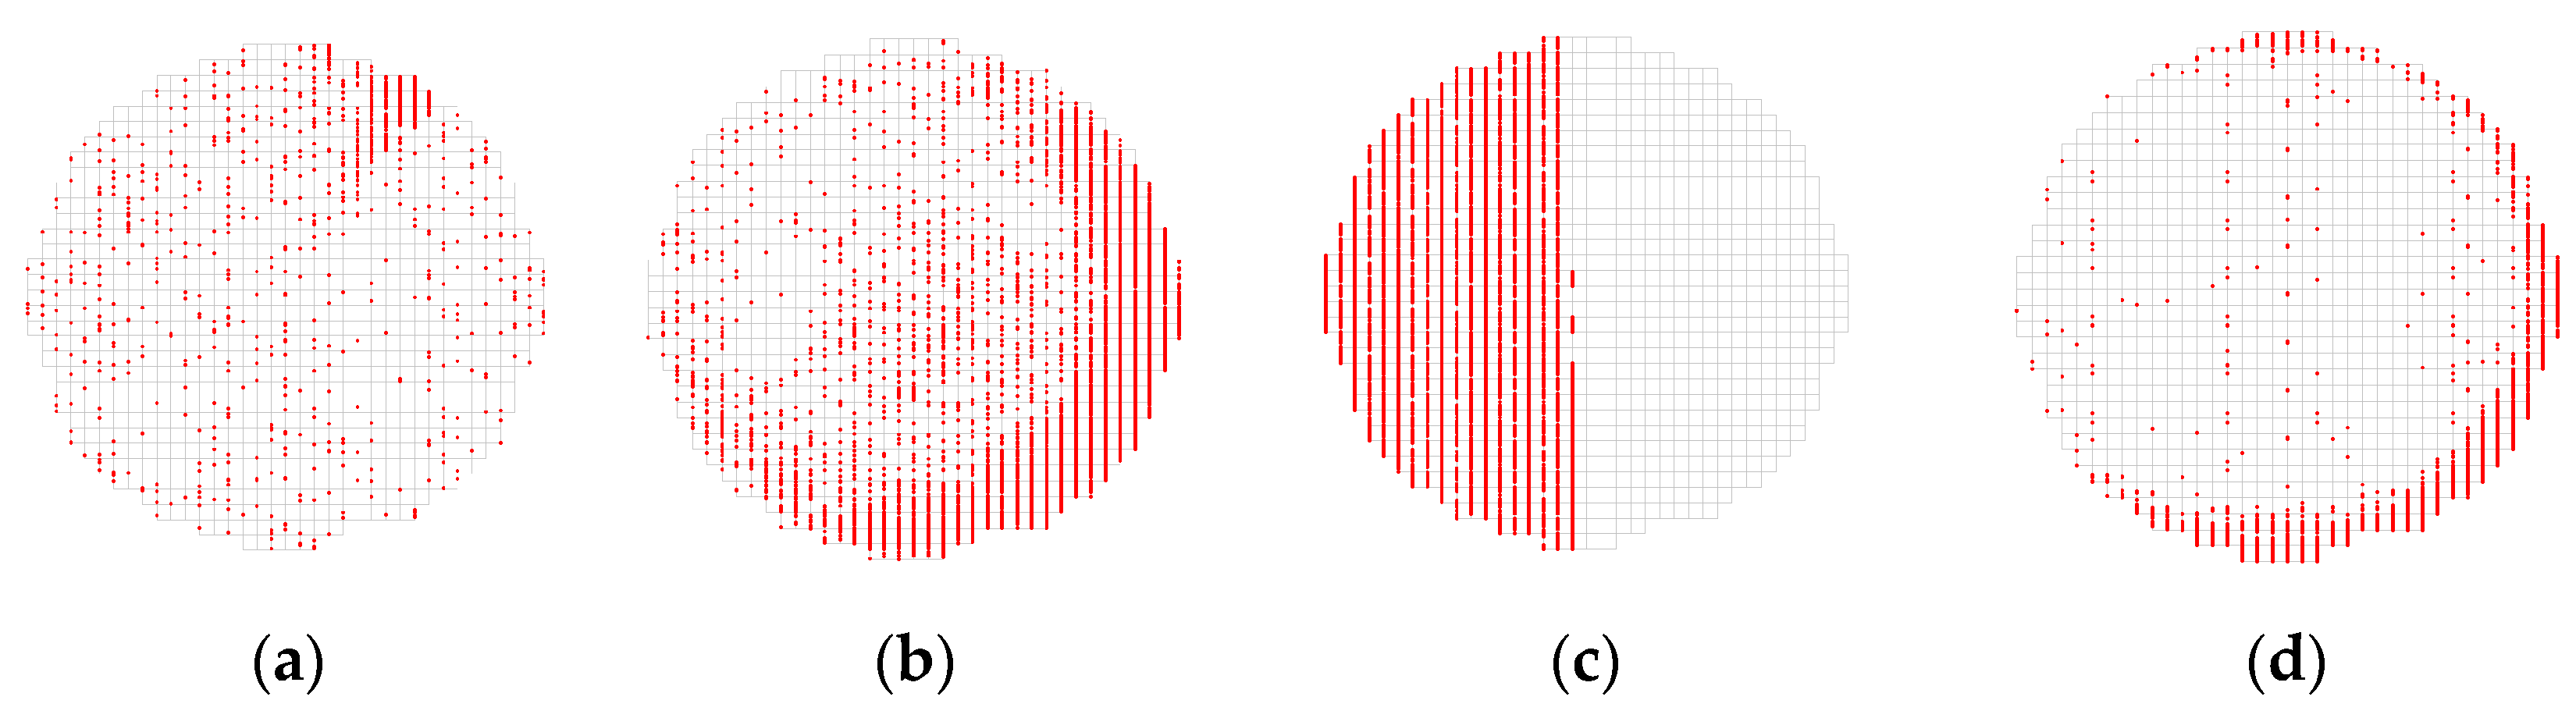
Since the suggested procedure aims to control and detect the spatial defects of time series processing based on image analysis, we selected four main types of defective WBM images, as shown in
Figure 2. These images consisted of a faulty condition caused by multiple patterns of local defects including scratch, circle, and semicircle (half). Each of these images was separately applied to each step in the suggested algorithm to illustrate the effectiveness of the proposed procedure clearly.
Proceeding with the proposed method, the original data were transformed into image-type format, where the locations with faults were represented as colored points. Every image had a size of
for 2D DWT, and the size of windows was fixed to
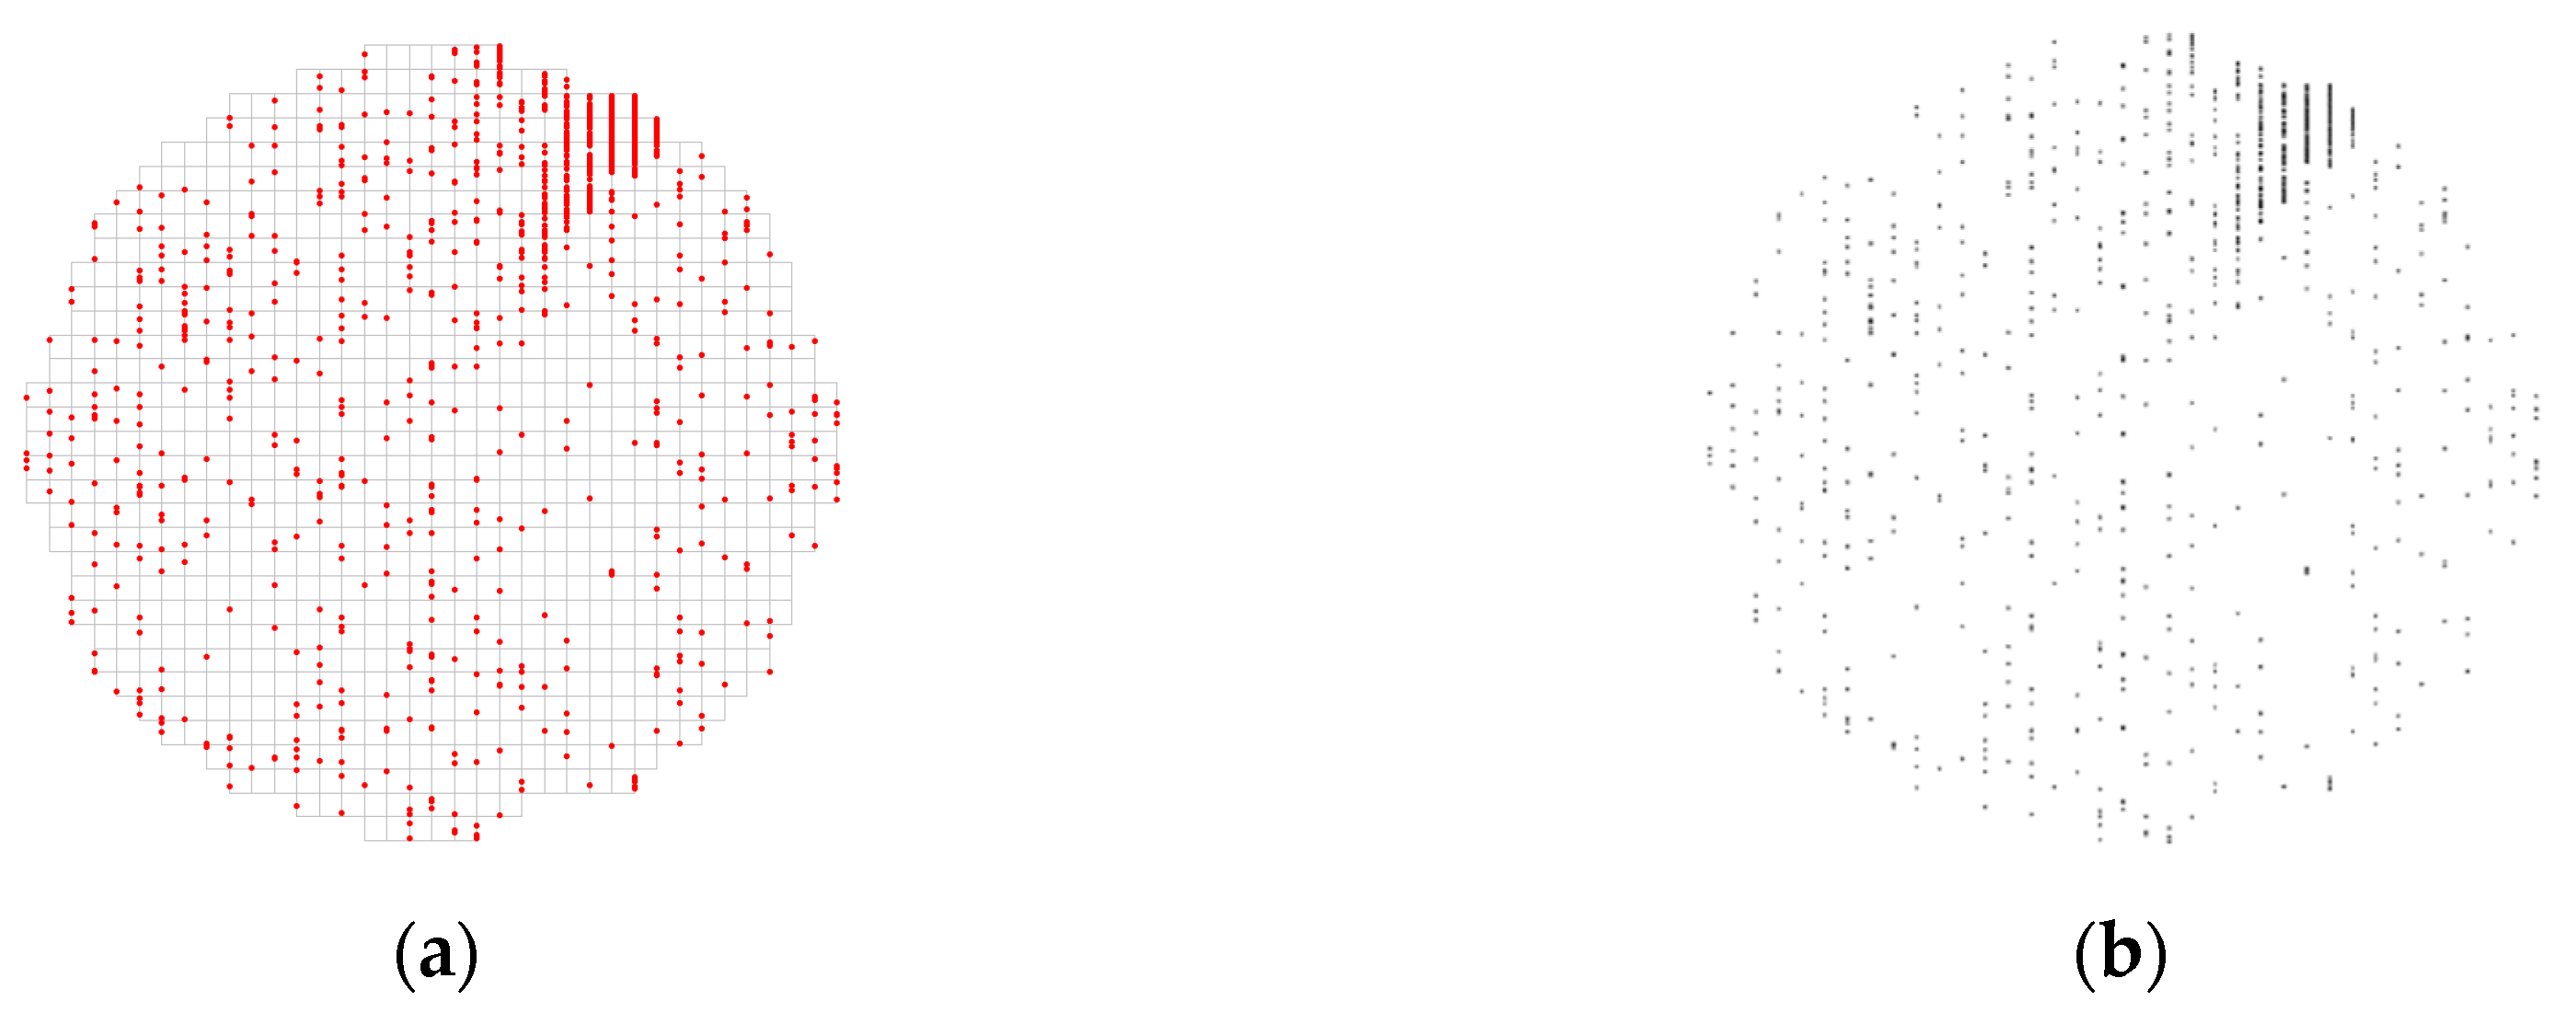
. With respect to the 2D DWT function, “la8” wavelet, the Daubechies least asymmetry length eight, was used. Since random defects in the overall area can be produced during semiconductor manufacturing, global defects were eliminated for effective quantification of faults using universal thresholding with the maximum decomposition level. In addition to noise elimination, the image should be made gray-scale to integrate WBM in one layer. The result of image construction and pre-processing is given in
Figure 3, where the scattered points indicating global defects are minimized.
After the pre-processing step, the image was divided into square-sized sub-images as windows. As mentioned in Step 3 in
Section 3, the hierarchy of wavelet coefficients was obtained by 2D DWT per each window. In Step 4, the energy of the detailed coefficients for resolution levels was calculated so that the linear regression based on wavelet spectrum analysis could be conducted.
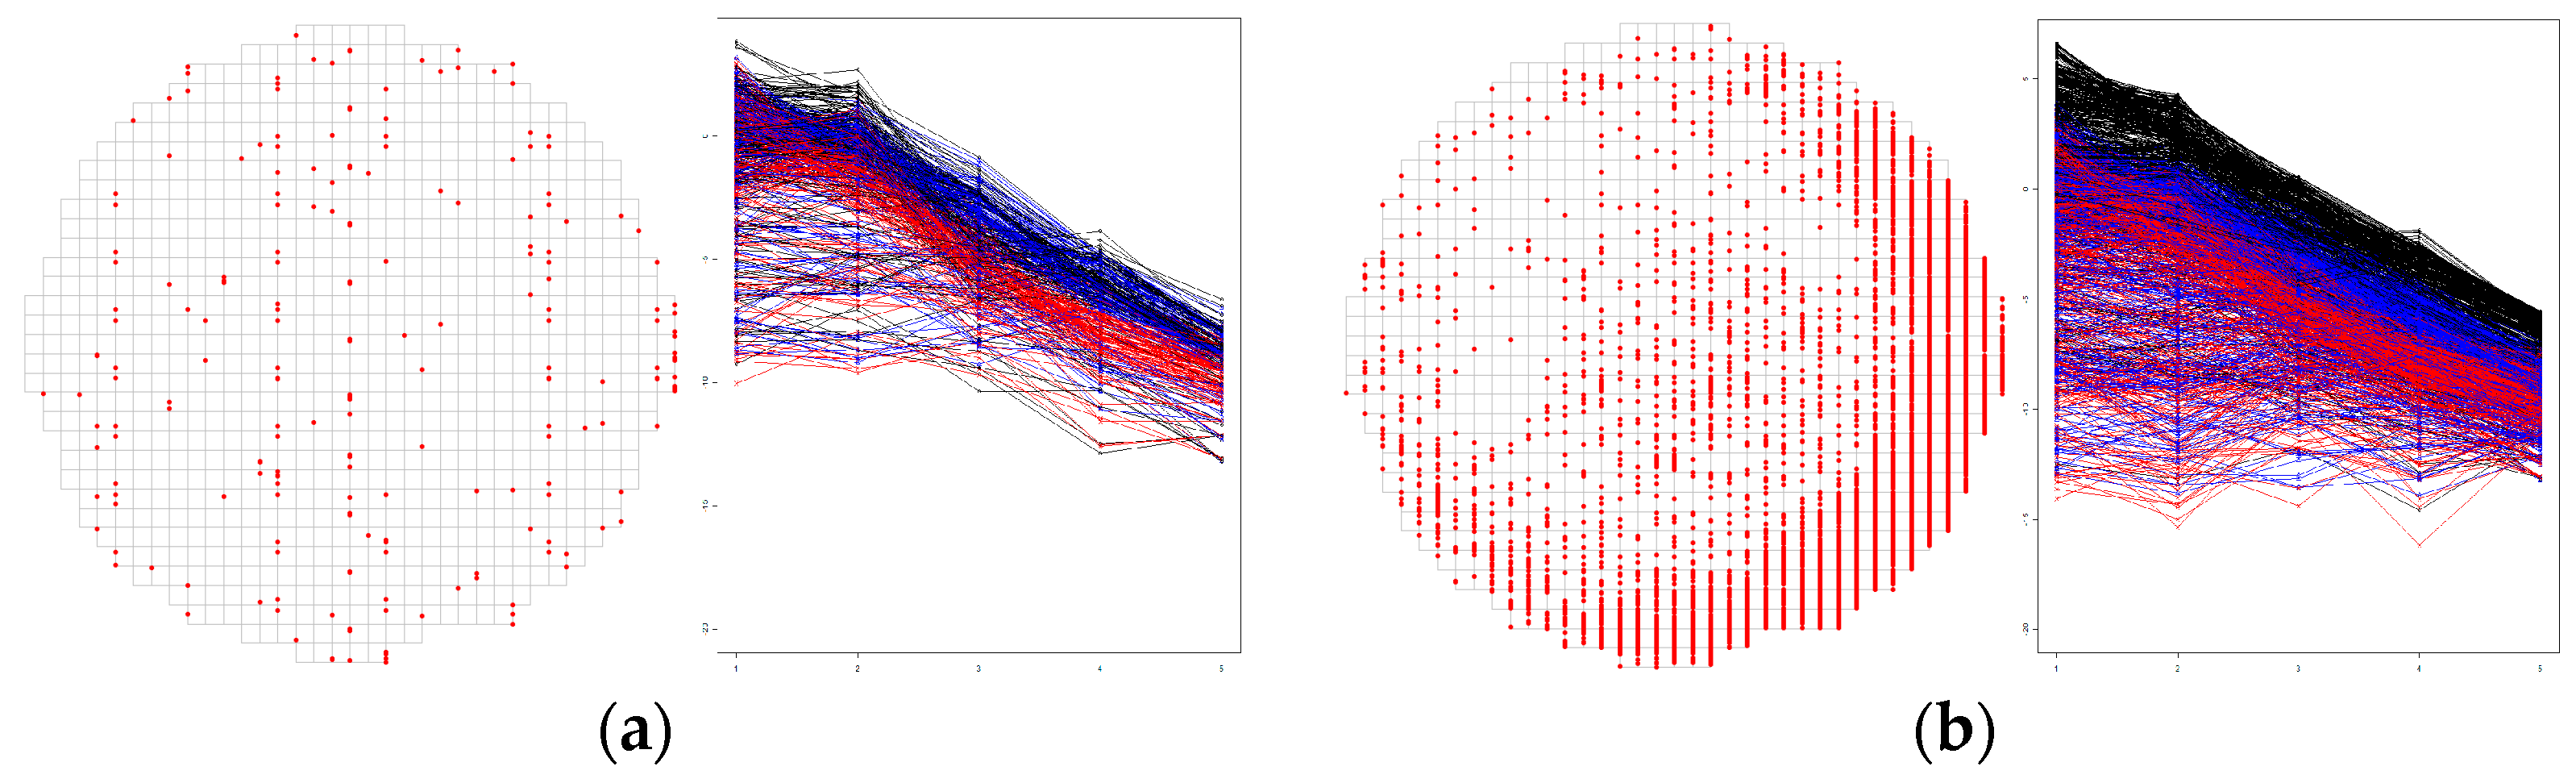
Figure 4 presents the energy profiles of all windows derived from WBMs, where a single line describes the trend of single windows and the color of lines (red, blue, and black) represents the direction of wavelet transforms: diagonal (HH), horizontal (HL), and vertical (LH) coefficients, respectively. From the comparison of WBMs between the normal condition and abnormal condition with a circle defect, we can observe that the WBM with more faults had greater variation of energies, where the Hurst exponents (slopes of the linear equation derived from each window) were more distributed than the normal status.
Using the Hurst exponents from every window, a distance matrix
was calculated from Step 4 in
Section 3, where the derivation of distances from the background enabled us to quantify the strength of faults. Based on the matrix, the density of the distance elements,
for
, was estimated. The distribution was split into normal and suspicious parts by the valley, that is the defective region belonged to the distribution that had a greater distance from the local minimal value, because the suspicious area had a further distance from the background than the other. The probability of faults was calculated by the cumulative distribution function (CDF), which was more than the valley. If the probability was more than the pre-specified standard for fault detection, the wafer was determined to have failed.
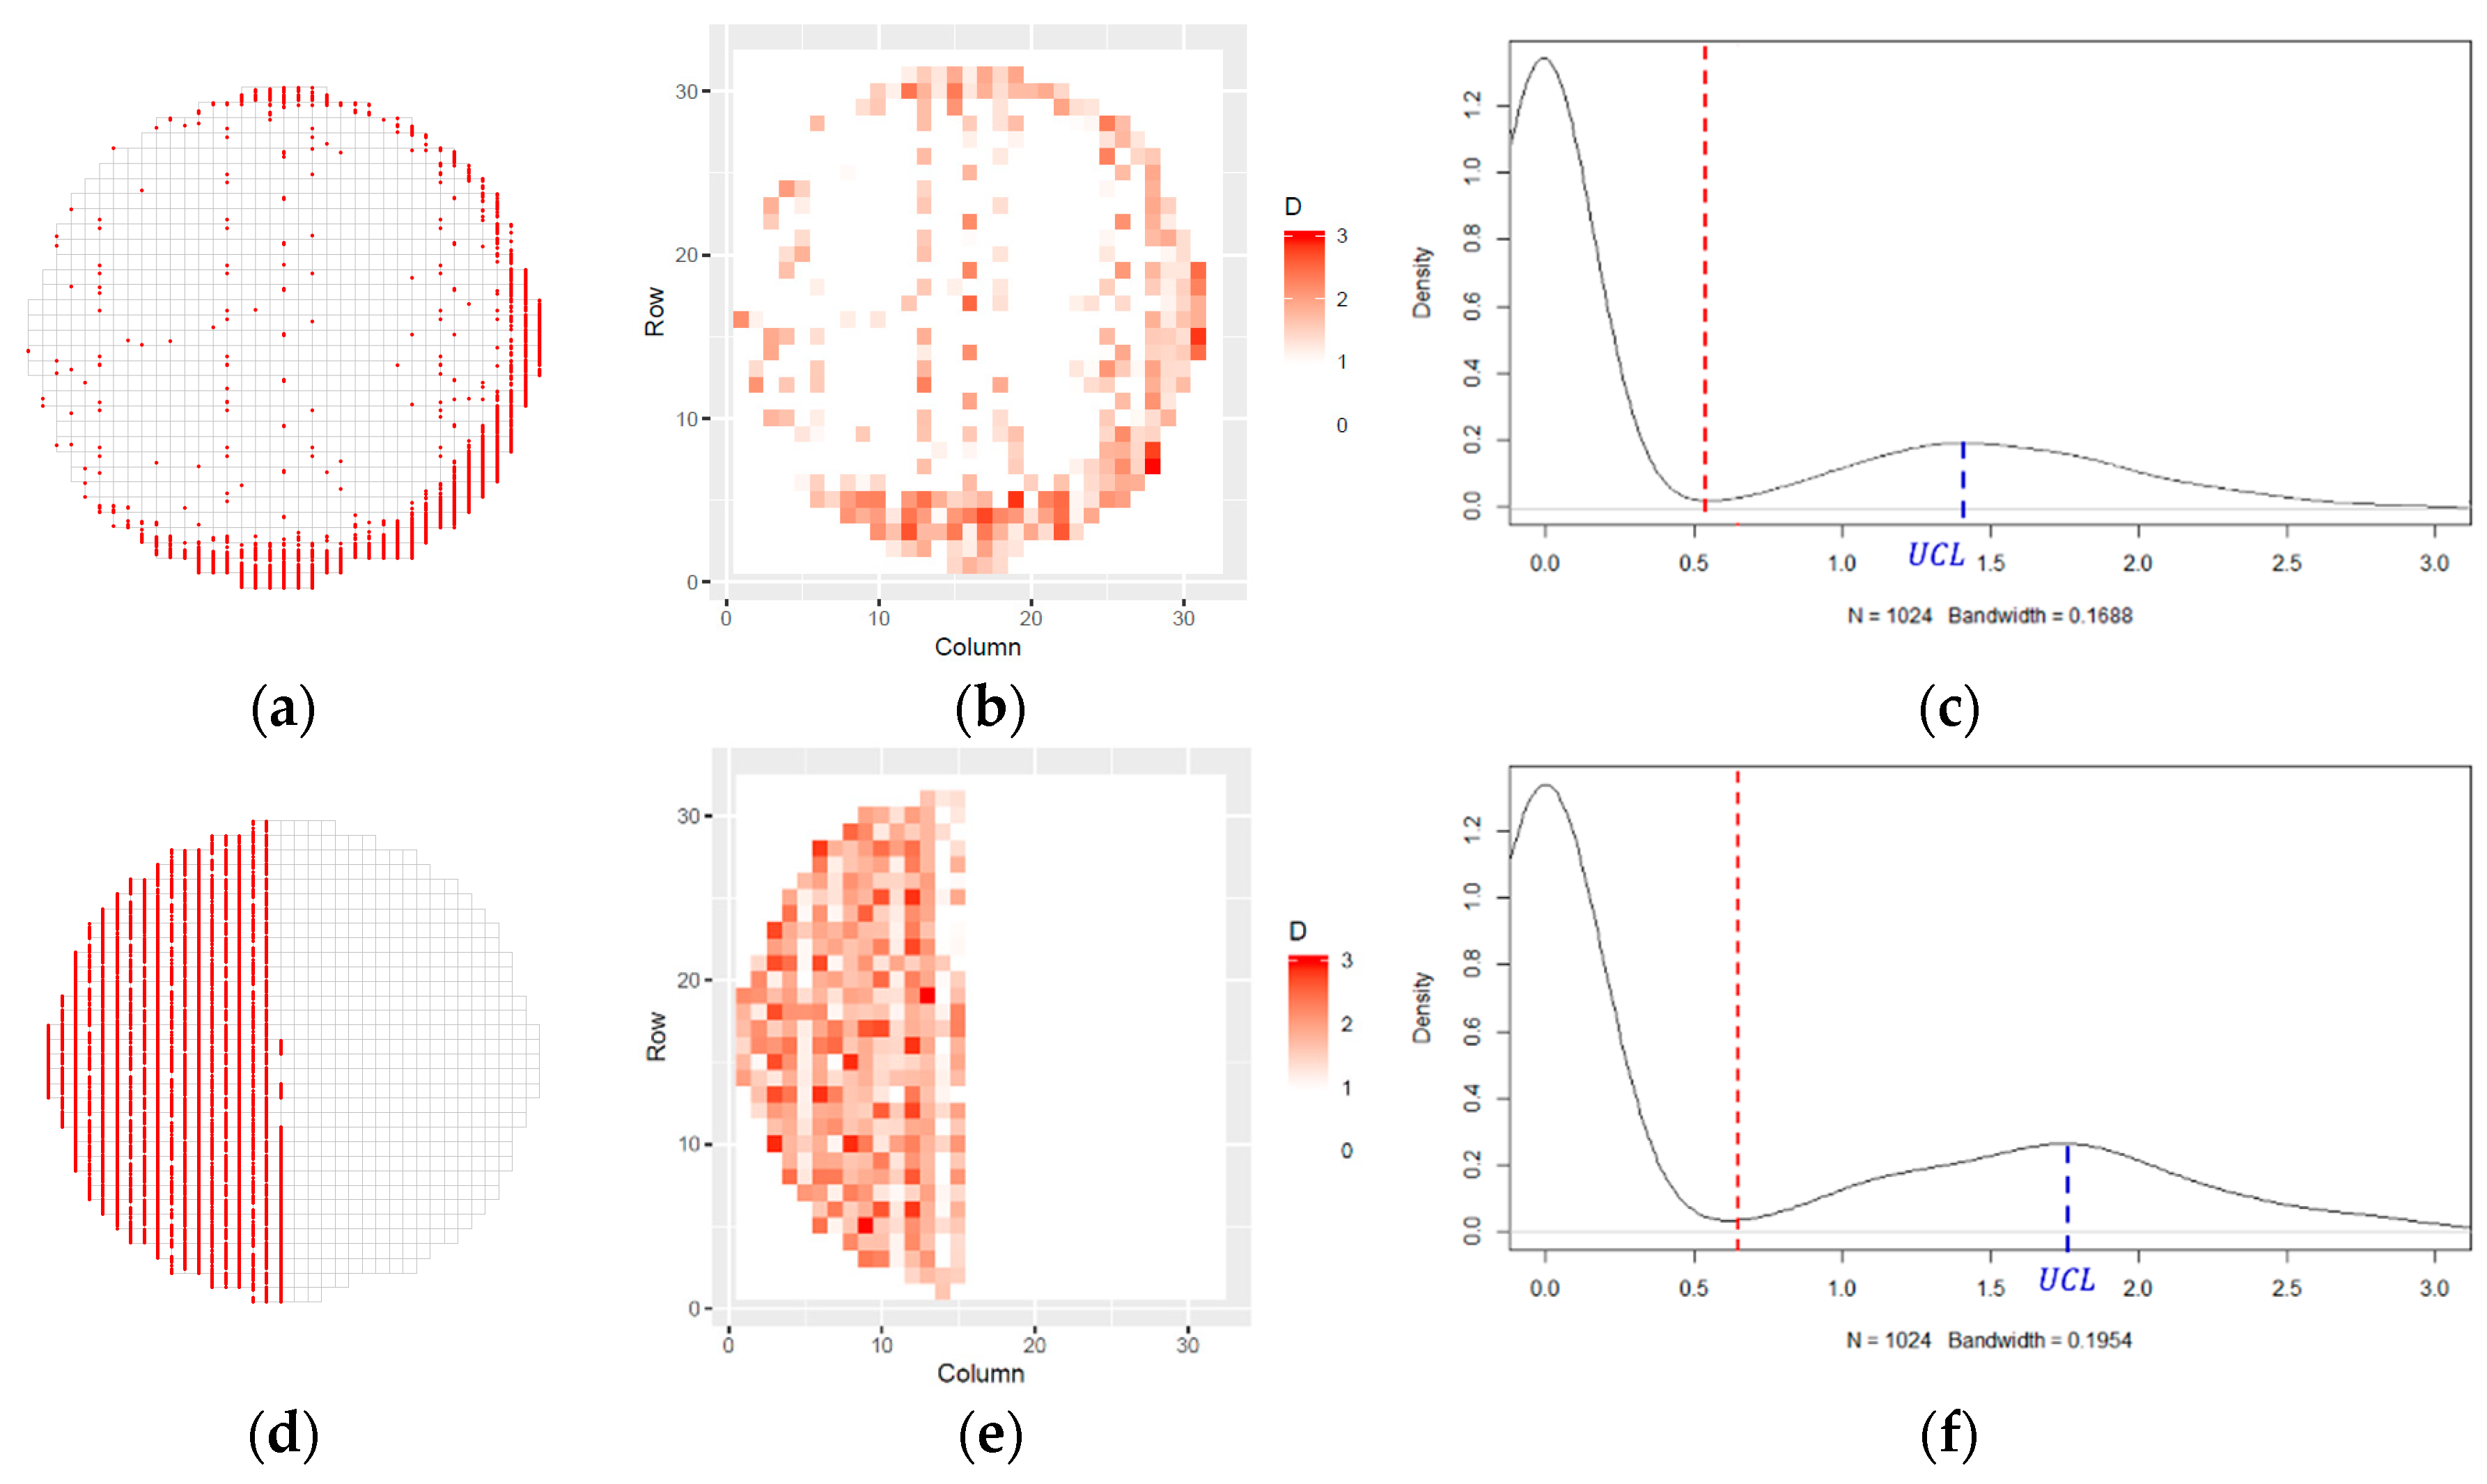
The visualization of the distance matrix and density estimation from the given images having circle and vertical defects and half defects is shown in
Figure 5. If the degree of defects in a specific window was serious, the window had a greater distance from the background. The kernel density function was separated by each valley, which lied at 0.5564 and 0.6219 in the WBM with circle and vertical defects and half defects, respectively. The probabilities of failure from two images were estimated as 0.2928 and 0.3394. Since we set the threshold for failure to 0.3 in this application, the half defective WBM would be classified as the faulty state, and the UCL for the spectral control chart was defined as the maximizer of a suspicious distribution. In this example, UCL was set to 1.7461 to detect the failure parts exceeding the control limits.
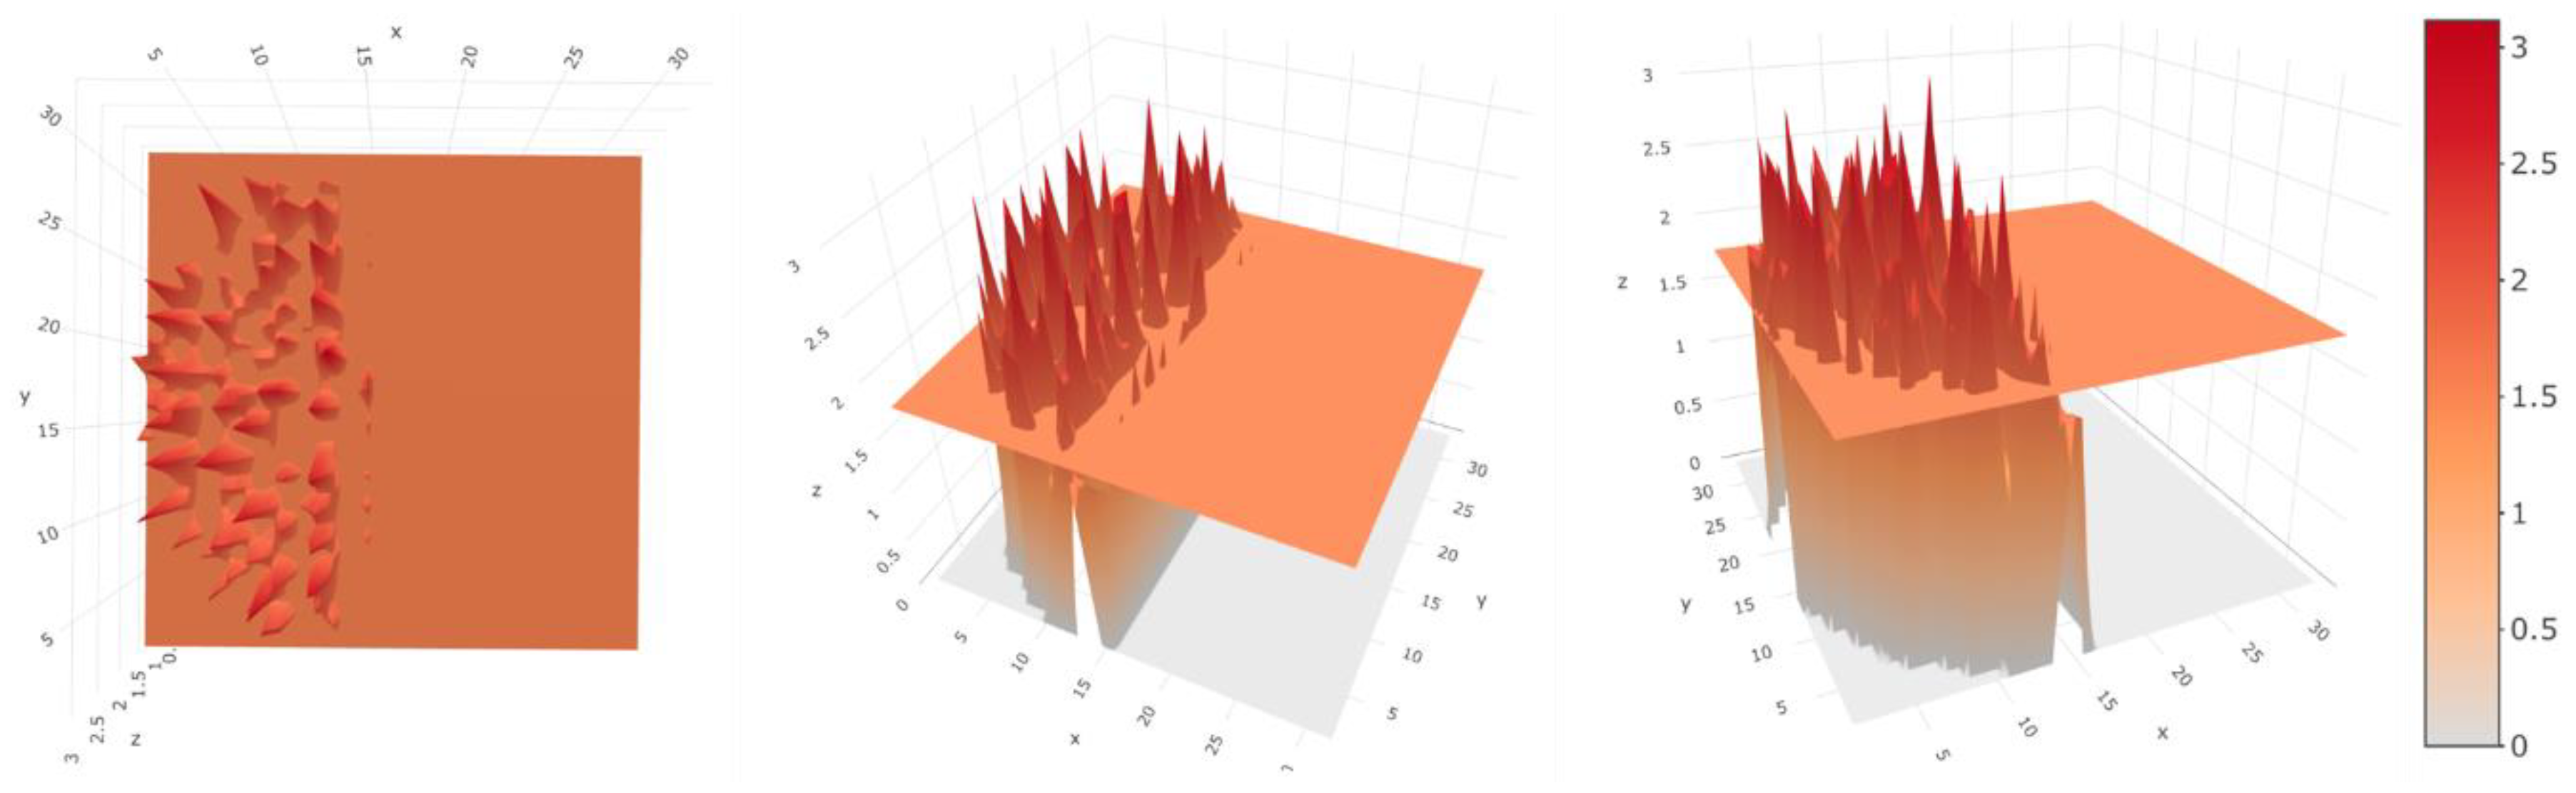
Based on the matrix composed of the statistics and upper control limit, a spectrum-based 3D spatial control chart was constructed. The spatial SPC implemented from the WBM image given in
Figure 5 is provided in
Figure 6, where three axes, X, Y, and Z, stand for the column, the row index of windows, and the control statistics. Because the defective region had a greater distance from the background, it would have higher values of the control statistics, and the statistics exceeding UCL were detected as faulty regions. The plane for UCL could be generated to detect the faulty location easily with higher values of the control statistics, and the plane was parallel to the XY-plane.
The result showed that WS-2DSPC conducted the detection of the faulty region and calculated the degree and strength of the defects with an efficient computation speed (it took approximately 2.17 s for a single image with a size of on an Intel® Core™ i-5 6400 CPU @ 2.70 GHz and 8.00 GB of RAM, including the feature exportation and visualization). If the application of WS-2DSPC can be extended to multiple online images in a timed sequence, a system for stereotaxic and spatial monitoring, as well as the diagnosis of defects can be implemented without a bottleneck in the manufacturing process.
5. Conclusions
In this article, a novel approach for spatial SPC based on wavelet spectrum analysis was proposed. With a brief review of existing approaches, we suggested an automated and quantified control method using an image processing method to detect spatial fault images in the manufacturing process without any assumptions about pre-determined values. In this procedure, 2D DWT and wavelet spectrums were utilized to calculate the degree of defects via Hurst exponents for divided windows. After the construction of the distance matrix derived from Hurst exponents was completed, the statistics and control limits were defined by the values and densities of matrix elements. The construction of the spatial control chart provided computational efficiency in diagnosing the status of images from both the spatial and real-time perspective. Through the applications of the proposed method to real-world WBMs in the semiconductor industry, the quantitative evaluation criteria for fault detection were provided in order to represent the degree of faults in WBM. Moreover, the spatial monitoring for detailed fault types led to real-time diagnosis and detection during the operation, where the cost for damage delays could be reduced and the most frequent fault type could be investigated.
For future research, classification based SPC would be possible since the defective patterns of images have typical shapes or positions, where the eventual cause of specific defects is prevented. In addition, faults in hidden layers that consist of the WBMs could be detected; while the modeling of defects in hidden layers is a valuable topic for additional research, this paper only covered the faults of image-type data that could be observed from the WBMs. It is also necessary to determine an effective control limit for automated detection, instead of the pre-specified threshold. Another approach applied to other signal processing methods could be also an interesting topic for study.


