Article

Study on Shear Mechanism of Bolted Jointed Rocks: Experiments and CZM-Based FEM Simulations

1
Shandong Provincial Key Laboratory of Civil Engineering Disaster Prevention and Mitigation, Shandong University of Science and Technology, Qingdao 266590, China
2
State Key Laboratory Breeding Base for Mine Disaster Prevention and Control, Shandong University of Science and Technology, Qingdao 266590, China
*
Author to whom correspondence should be addressed.
Appl. Sci. 2020, 10(1), 62; https://doi.org/10.3390/app10010062
Submission received: 13 October 2019 / Revised: 5 December 2019 / Accepted: 10 December 2019 / Published: 20 December 2019

Abstract

:
Based on the underground jointed rock of the Huangdao water sealed oil depot in China, the shear failure mechanism of bolted jointed rock is studied through laboratory experiments and numerical simulation. Laboratory experiments are performed to explore the shear behavior of bolted jointed rock with different joint roughness. Our results show that using high strength bolts is beneficial to improving the shear strength of the jointed rock, but the high strength of bolts can also lead to the rock fracture, which should be avoided. For this particular project site, experimental results indicate that 15% elongation is the best. In addition, a new numerical simulation method with CZM (cohesive zone model) used for modeling the shearing process of bolted jointed rock is proposed. It can reasonably describe the characteristics of jointed rock as a discontinuous medium, and bolt as a continuous medium, that replicate well the shearing process. The numerical model is then verified by comparing the experiment results, and it can be effectively be applied to the simulation of joint shearing process. Finally, we use this simulation method to explore the shear failure mechanism of bolted joints, and find that the root cause of rock failure is the deformation mismatch between the bolt and the surrounding rock. The tensile stress between them eventually causes the rock to fracture near the bolt hole.

1. Introduction

As underground engineering projects are going deeper and deeper, especially in the fields of water conservancy, hydropower engineering, water sealed oil storage caverns, and deep resource exploitation [1,2,3,4,5], jointed rock is prone to causing instability of engineering structures and threatening the safety of engineering construction. Reinforcement by bolts has become one of the most effective and economical reinforcement technologies for the long-term stability of underground projects. Bolts play an important role in strengthening the surrounding rock, limiting the dislocation or slip between blocks, and effectively improving the stability of rock engineering structures. Among all types, the full-length bonded bolts have been widely used in various underground engineering projects [6,7]. Significant achievements have been made in the study of bolted jointed rock, from both experimental and theoretical perspectives. Sten [8] carried out an experimental study on full-length cement mortar bolts embedded in granite, and analyzed the impact of bolts on the shear strength of joints. Gerrard [9] performed an experimental study and a theoretical discussion on the effect of bolts on the shear strength of joints. Spang et al. [10] studied the reinforcement effect of anchor rod in rock mass with different properties through physical experiments, and found that bolts can significantly improve the shear strength of jointed rock mass. Chen et al. [11] investigate the shear behavior of bolted rock joints with different roughness. Direct shear tests on both bolted and unbolted artificial joint specimens were conducted under various normal stresses. Zhang et al. [12] proposed the roughness parameters that considered that the anisotropic characteristic of joint roughness can capture the difference of roughness in forward and reverse directions along a single joint profile. The capacity to resist rock deformation is one of the important parameters affecting the shear strength of bolted jointed rock mass. Pellet and Egger [13] established a new analytical model to predict the contribution of bolts to the shear strength of a rock joint, then compared the performance of this analytical model with experimental results to show its capability, and to describe the observed phenomena. Ferrero [14] investigated the influence of bolt type on shear strength of rock mass for different rocks. However, there have been few studies on the influence of bolt elongation, bolt strength, and other factors on the reinforcement effect. Particularly given that a systematic study is lacking in evaluating and optimizing the bolted effect in practical engineering. The objective of this work is to conduct laboratory experiments to explore these influencing factors on the jointed rock, and explore the shear failure mechanism of bolted rock joints.
With the advancement of numerical simulation, many scholars have explored the shear failure mechanism of bolted joints using different numerical techniques. Liu and Ju [15] used FLAC three-dimensional (3D) to study the influence of pre-stress on the shear behavior of joints. Selvadurai and Yu [16] adopted the finite element method to simulate the joint direct shear tests, and the simulated results were in good agreement with the experimental results. However, the disadvantage of using the continuous medium theory to predict the deformation and failure mechanism of joints during loading is that it is not able to realistically reflect the breaking and weakening effects of rocks and joints. In order to simulate rock fracture process, some scholars have used the discrete element method, such as the Particle Flow Code (PFC) to perform the simulations. For example, Bahaaddini et al. [17] proposed a new shear box genesis approach to overcome the unrealistic increase of shear strength and dilation angle in PFC. Zhou et al. [18] modeled the direct shear experiments of rock joints with PFC, and discussed the evolution characteristics and failure mechanism of joints during the direct shear experiment, from both macroscopic and microscopic perspectives. Park and Song [19] examined the influence of geometric characteristics and microscopic properties of joints on the shear performance by using PFC 3D to simulate the direct shear process. As evidenced by these studies, the discrete element method has become an important means and has been widely used to study the shear failure of jointed rock. However, when using the discrete element method to study bolted jointed rock, the bolt is often represented by discrete particles. For example, Zhao et al. [20] and others used the PFC software to simulate the interface mechanics of bolt. Although the results are good, the bolt is practically a homogeneous continuous medium, and the realistic mechanical properties of the bolt may be described more accurately by the finite element method. The finite element cohesive model has been widely used in the simulation of cracks in brittle materials, such as crystals and rocks. The CZM (cohesive zone model) was first proposed by Dugdale [21] and Barenblatt [22] in the 1960s, which is different from the traditional finite element model. It focuses more on simulating the microstructure of materials and can describe the discontinuity of brittle materials such as rocks. CZM-FEM has been widely used in engineering. It can describe the bond-slip action between steel rebars and surrounding concrete and the crack propagation of composite material plates [23,24,25]. The crack tip singularity problem can be avoided by using this method to simulate the crack initiation. Recently, Su et al. [26] developed an algorithm of embedding cohesive elements in solid finite element grids, which allows for fracture simulation of complex structures.
Considering the discontinuity of the jointed rock and the continuity of the bolt, here we propose a new numerical method to simulate the shear of the bolted joints based on the laboratory experiments on the bolted jointed rock. “Discrete” jointed rock with embedded zero-thickness cohesive element is used in this method, and the traditional finite element model is used to define the bolt. Hence, the advantages of the two methods are conveniently combined to simulate the shear of bolted joints. This numerical simulation method will provide another effective research tool for the study of the mechanical properties and reinforcement effect of bolted joints. In this paper, the characteristics of shear resistance of bolted jointed rock are studied through laboratory experiments and numerical simulation, and the bolt with the best performance is given.

2. Cohesive Element

2.1. Elastic Stage

In ABAQUS, the constitutive response of cohesive element is characterized by a traction–separation law, and its constitutive model is a bilinear model [27]. Specifically, a linear elastic reinforcement is assumed before reaching the initiation of damage, followed by a linear softening behavior in the damage stage. The constitutive relationship is shown in Figure 1.
The initial elastic behavior of a cohesive element can be defined as,
t = { t n t s t t } = [ E n n E n s E n t E n s E s s E s t E n t E s t E t t ] { ε n ε s ε t } = K δ
where t is the stress component in three directions; tn is the normal stress on the crack face; ts and tt are the shear stress on the crack face; εn, εs, and εt are the three components of the nominal strain; δ is the corresponding displacement component; and K is the stiffness matrix for the cohesive element.

2.2. Softening Stage

The maximum nominal stress criterion is selected as the crack initiation criterion. When either the tensile stress or the shear stress reaches the initial damage stress, the material enters the softening stage. This criterion can be expressed as:
M A X { t n t n o , t s t s o , t t t t o } = 1 .
The angular brackets on tn indicate that only positive traction (tension) is considered, and that compression does not cause damage to initiate.
The initial separation displacement can be expressed as,
δ n o = t n o / K n o δ s o = t s o / K s o δ t o = t t o / K t o
The initial fracture energy can be written as,
G n o = 1 2 t n o δ n o G s o = 1 2 t s o δ s o G t o = 1 2 t t o δ t o
After reaching the damage threshold, the stiffness of the cohesive unit will decrease linearly. In ABAQUS, the scalar D is used to represent the degree of damage. The initial value of the scalar damage variable D is set to 0 and gradually increases from 0 to 1. In order to accurately describe the damage evolution in the cohesive element, the function of introducing the effective displacement δm can be written as,
δ m = δ n 2 + δ s 2 + δ t 2
where 〈〉 is the Macaulay bracket; 〈δn〉 is equal to δn when δn is greater than zero, otherwise 〈δn〉 is equal to zero.
The damage variable D evolves according to the following expression,
D = δ m f ( δ m m δ m o ) δ m m ( δ m f δ m o )
where δmm is the maximum effective displacement attained by the cohesive element throughout its entire loading history; δmo is the effective displacement at the beginning; and δmf is the effective displacement at the complete failure.
The stress components in a cohesive element in the softening state are defined as:
t n = { ( 1 D ) t n o , t n o 0 t n o , t n o < 0 t s = ( 1 D ) t s o t t = ( 1 D ) t t o
The stiffness of the cohesive element is expressed as:
K n = ( 1 D ) K n o K s = ( 1 D ) K s o K t = ( 1 D ) K t o
The separation displacement can be written as:
δ n = t n ( 1 D ) K n δ s = t s ( 1 D ) K s δ t = t t ( 1 D ) K t

3. Laboratory Experiments

3.1. Preparation of Rock Specimens

With the start of the construction of China’s oil reserve bases, a number of large underground water sealed oil depots are under preparation. An underground oil depot is mainly an oil storage tank formed by the fissure water in the rock and the surrounding rock of the cavern. Because of the rheological properties of the joints in the surrounding rock, even if the external conditions do not change with time, the structure of the surrounding rock will continue to adjust, which can lead to change in the stability of the surrounding rock. Under complicated long-term loading and unloading conditions, the long-term stability of underground caverns is even more complex and dynamic. It is thus crucial to understand the mechanistic behavior of bolted jointed rock for the safety evaluation of underground water sealed oil storage caverns. Based on the Huangdao oil depot in China, the shear characteristics of bolted jointed rock are studied in this work. The rock in this area is mainly granite. Rock-like materials were used to conduct laboratory experiments, In order to avoid large variability in the experiment results caused by natural sampling. There are two main types of specimens used in our laboratory experiments. The first type is standard cylindrical with a length of 100 mm and a diameter of 50 mm. The second is rectangular parallelepiped with a length of 200 mm, a width of 100 mm and a height of 100 mm. Orthogonal design of experiments was used to determine the optimum proportion of materials for all specimens. The quantity of material by mass was CA270 cement: 0.5–1 Corundum: 0–0.5 mm corundum: −45μcorundum: Water reducer ADS3: Water reducer ADW1: Water = 1: 2.4: 1.4: 1.2: 0.018: 0.042: 0.4. The joint surface curve was selected from ten standard Joint Roughness Coefficient (JRC) curves proposed by Barton [28,29]. The standard JRC curves were discretized and re-divided using CAD as shown in Figure 2. Three JRC curves with different roughness, JRC2-4, JRC10-12 and JRC18-20, labeled S1, S2, and S3, were used in the experiment. As shown in Figure 3. The specimens were first put into the curing box and kept under constant temperature and humidity conditions for 28 days, and then taken out for the experiments.
The bolts were made of metal aluminum and divided into three different types: 1060 aluminum alloy, characterized by strong plasticity, high elongation (up to 25%), labeled as MG1; 6063 aluminum alloy with medium hardness, high strength and elongation of 15%, labeled as MG2; LY12 high-hardness aluminum alloy, with high strength, poor plasticity, and 5% elongation, labeled as MG3. Specific physical and mechanical parameters are listed in Table 1. In order to bolt the rock joints, two couplings of rough joints were aligned, inserted into experiment bolts, and bolted with bolting agent. The diameter of bolts is 10 mm and the length is 100 mm [30]. The bolted piece was cured at room temperature for approximately 10 days. The bolted specimens are shown in Figure 4. The labels of the different types of specimens are provided in Table 2.
We use these three different types of metal aluminum to represent three different types of bolts to carry out our experiments to explore the shear failure mechanisms of different bolted jointed rocks.

3.2. Compression Experiment

In order to obtain accurate macroscopic mechanical parameters of the rock-like material, uniaxial compression and triaxial compression experiments were performed on standard cylindrical specimens, using an electro-hydraulic servo rock mechanics testing apparatus, as shown in Figure 5. The uniaxial compression experiments were carried out by using the displacement control method. The loading rate was 0.06 mm/min. Three confining stresses (10 MPa, 20 MPa, and 30 MPa) were selected to conduct the triaxial compression experiments. The Mohr’s circles plotted according to the triaxial experiment results are illustrated in Figure 6. The physical and mechanical parameters obtained are given in Table 3, which are similar to those of granite [31].

3.3. Shear Experiments

Figure 7 shows the apparatus used for the shear experiments. Both tangential and normal loads are controlled by servo-hydraulic actuators with a maximum load capacity of 600 KN and a linear variable differential transducer (LVDT). The maximum shear displacement of 40 mm and the shear rate of 0.01~100 mm/min can be measured. Jing et al. [32] found through a large number of experiments that the shear strength of jointed rock increases linearly with normal stress. In our study, our experiments were carried out under constant normal stress, without considering the influence of normal stress on shear strength. The constant normal stress was selected to the 10% of the uniaxial compressive strength. The rock in the lower half of the joint surface was fixed under a normal stress of 10 MPa, and the horizontal stress was applied to the upper half of the joint surface with a constant rate. Shear experiments were carried out on rocks with different roughness. Shear displacements and shear stress were recorded during the experiments. In order to ensure the accuracy of the experiment results and avoid the error caused by the operation, each group of experiments was carried out 3 to 4 times, and the average value of all experiment results was taken as the final experiment results.

3.4. Experimental Results

For specimens in group MG1 (25% elongation) and group MG2 (15% elongation) with three different roughness, the cracks mainly appeared near the joint surface, and the failure of the specimens near the joint surface became more severe with increasing roughness of the joint surface. However, during the whole loading process the specimens are relatively complete without breaking into pieces. For the specimens in group MG3 (5% elongation), most of the cracks occurred near the joint surface, and the specimens were broken, as marked by the red dashed lines in Figure 8. These specimens were broken in different directions, but the common feature was that all fractures passed through the bolt holes. It is worth to mention that the specimen S1-MG1 was bent but not broken, so only the state when the pieces were connected together can be observed in Figure 8. The specimen “S3-MG3” is not separated from the specimen because the rock has been completely broken.

3.4.1. Effect of Joint Surface Roughness

The roughness of the joint surface is normally used to characterize the joints of rock, and the stability of rock is often determined by the shape of joint surface in rock. Therefore, roughness is one of the most important factors affecting the shear strength of rock in the rock stability study. In order to analyze the influence of roughness on the shear behavior of bolted joints, the experimental data of bolted joints with different roughness are extracted and studied, as shown in Figure 9 and Table 4.
The shear strength-displacement curves of bolted jointed rocks with different roughness are similar, but the peak shear strength is different. With the increase of joint roughness, the peak shear strength increases. The shear strength of joints with bolts MG1, MG2, and MG3 increases by 26%, 25%, and 17%, with the increase of roughness, respectively. This indicates that the shear strength of the bolted jointed rock is strongly dependent on the roughness of the joint surface. Under a certain normal stress with the same bolt, the rougher the joint surface, the higher the shear strength. The relationship between the roughness and the peak shear strength is shown in the last subfigure in Figure 9.

3.4.2. Effect of Joint Surface Roughness

Bolt can limit excessive shear dislocation of joint surface and fasten rock on both sides of joint surface to improve the integrity and stability of the rock. Thus, studying the influence of bolt on shear strength of jointed rock is important. Our experimental results indicate that under the same conditions, different bolt materials have an important influence on the shear effect of bolted joints. In order to analyze the contribution of elongation to shear strength, we analyzed the relationship between shear stress and shear displacement for the tests. As shown in Figure 10a S1-(MG1-MG3), the shear strength of the bolted jointed rock is generally increased as the bolt becomes "hard" (lower elongation). It is worth noting that the peak shear strength of MG2 and MG3 bolts are similar. Figure 10b shows the experimental results of S2-(MG1~MG3) where we observe that the shear strength of the jointed rock bolted by MG1 is lower than that of the jointed rock bolted by MG2. However, unexpectedly, the shear strength of jointed rock bolted with MG3 high-strength bolt is not significantly improved, but rather slightly lower than MG1 and MG2 with relatively larger elongation and lower strength. The same trend holds true for the specimens bolted with S3-(MG1~MG3), and the order of peak shear strength is: MG2 (15% elongation) > MG1 (25% elongation) > MG3 (5% elongation).
Based on the above results, on one hand, it is clear that the use of the “harder” bolt is beneficial to improving the shear strength of jointed rock. On the other hand, it is counterproductive to simply use high-strength bolts for reinforcement, because the high strength bolt can bear lower deformation, which causes rock to break in the process of shearing. Thus, it reduces the shear strength of bolted jointed rock, and degrades the integrity of the surrounding rock. As far as the Huangdao underground oil storage carven is concerned, we can conclude that the bolt of MG2 (15% elongation) is superior to the other two bolted materials.

4. Numerical Simulation

Since the shear experiments can only reflect the macroscopic shear process and the failure characteristics of the rock, its meso-mechanical deformation and failure mechanisms, especially the interaction between bolt and jointed rock during the shear process, cannot be fully analyzed in the laboratory. In order to overcome this limitation, here we propose a new shear simulation method based on the commercial finite element software ABAQUS. The shearing process is reproduced by numerical simulation to better understand the deformation characteristics of bolted joints. The novelty of this simulation is that the rock is simulated by a globally embedded zero-thickness cohesive element, and the bolt is simulated by the conventional finite element method.

4.1. Model Establishment

In order to obtain the accurate fracture damage parameters in shear numerical simulation of joints, we use the method of globally embedded cohesive elements to simulate uniaxial compression experiment, and calibrate the cohesive element parameters proposed by Jiang et al. [33] A numerical model of a cylinder with a height of 100 mm and a diameter of 50 mm is established, as shown in Figure 11. There are 68230 cohesive elements (COH3D6) and 35220 solid elements (C3D4) in the numerical simulation of cylinder, with a total of 103450 elements. The macroscopic physical and mechanical parameters, such as Young’s modulus, Poisson’s ratio, and cohesion, obtained in our experiments are used in the numerical model. Two types of elements are used in the model: Linear elastic solid element, and the cohesive element, which follows the traction-separation law. The results shown in Figure 12 are obtained by the trial and error method. From the figure, it can be seen that the numerical simulation results are in good agreement with the uniaxial compression experimental results, and the failure modes of both are splitting tensile failure (See Section 3.2 for details). It is, thus, proven that parameters can be used for shear experiment simulation, and the specific values of the calibrated meso-parameters are provided in Table 5 The version of ABAQUS used was 6.14.
In the shear experiments, the bolts are made of aluminum alloy material. In order to simulate the failure behavior of the material during shearing, we have decided to use the continuum-based ductile metal damage model and shear damage model in the numerical simulation. The typical mechanical parameters of aluminum alloys, such as fracture strain, stress ratio, strain ratio, and failure displacement, are used in the work following the study of Hooputra et al. [34]. In order to change the elongation and strength, the plastic criterion is redefined according to the characteristics of three different types of aluminum. The established model is a plane model. Because if we use the real material parameters of the bolt, it will lead to an increase in the contribution rate to the shear strength of the bolt, hence we reduce the yield strength of the material for the purpose of equivalent replacement. Since the diameter of the bolt is only 1/5 of the longitudinal length of the specimen, we reduced the yield strength of the bolt to 1/5 to make the model more suitable for the actual bolted, as listed in Table 6.
In the pre-modelling process, we used the “raster image” function to import the Barton (JRC) joint surface image into CAD, and captured the shape of the joint surface with 100 points of equal spacing, then connected these 100 points into a line to redraw the JRC curve, and imported the JRC curve from CAD into ABAQUS for the modelling.
The numerical model of the shear experiment is calculated by using the dynamic explicit step, the top boundary of the model is loaded with a uniform normal stress, the bottom boundary is fixed completely, and the horizontal displacement on the right side of the rock mass below the joint is also fixed. The shearing loading velocity is 0.06 mm/min. Because friction and mechanical occlusion still exist between solid elements after failure of cohesive element in shear process, “general contact” is used to realize the contact after failure of cohesive element in ABAQUS. In order to closely describe the rock microstructure and fine scale simulation, the meshes are generated automatically with an element size of 1 mm. Due to the large number of elements, it is computationally prohibitive to model this process in three dimensions, thus, a thin three-dimensional plate is used as the proxy for the joint surface numerical model. The thickness of the plate is 1 mm. The rock part is embedded with zero thickness cohesive elements, and the bolt part is filled with solid elements. There are 57,989 cohesive elements (COH3D8) and 29,563 solid elements (C3D8), totalling 87,552 elements. The boundary conditions and loading directions are shown in Figure 13.

4.2. Analysis of Numerical Simulation Results

4.2.1. Verification of Numerical Simulation Results

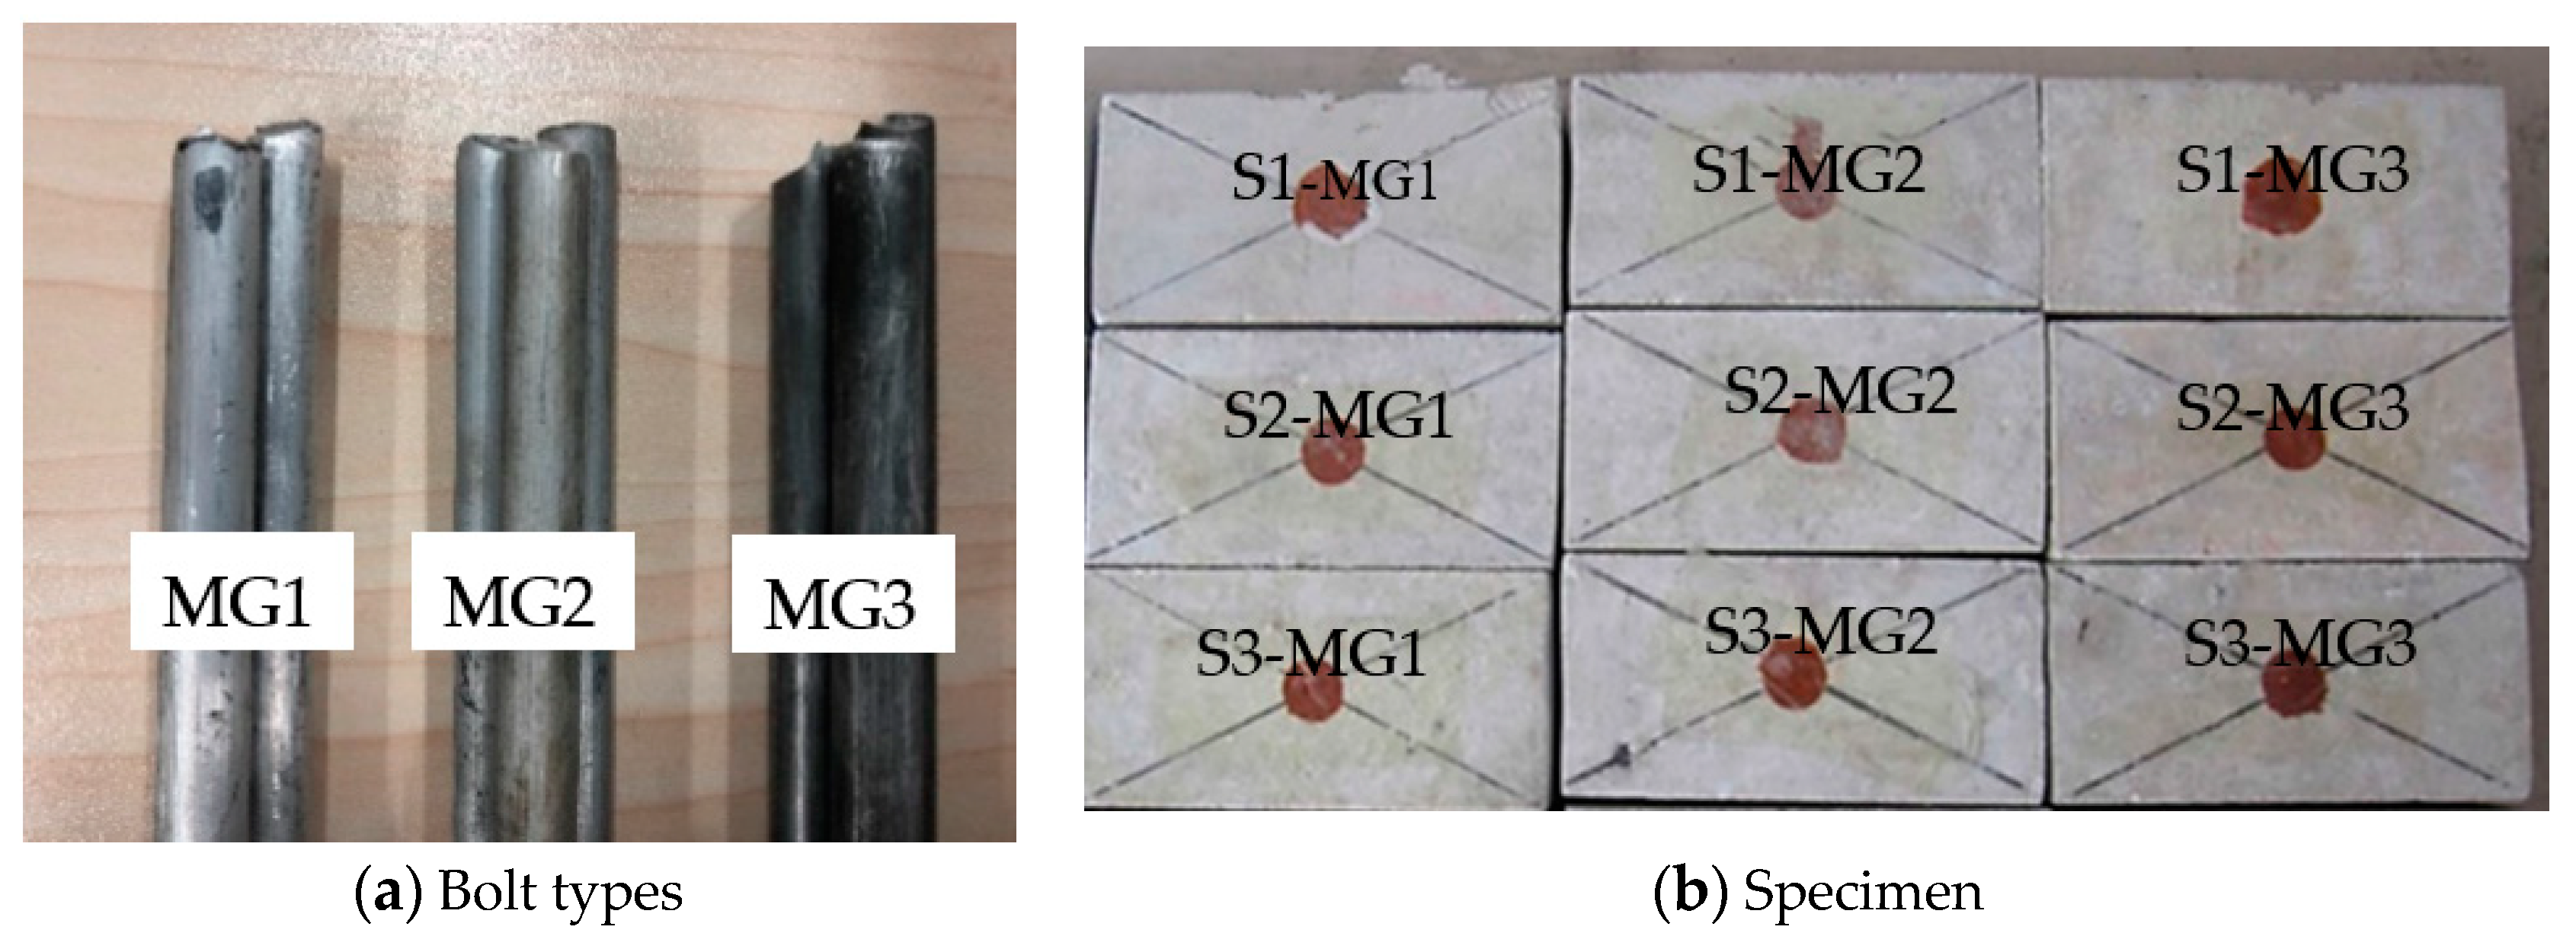
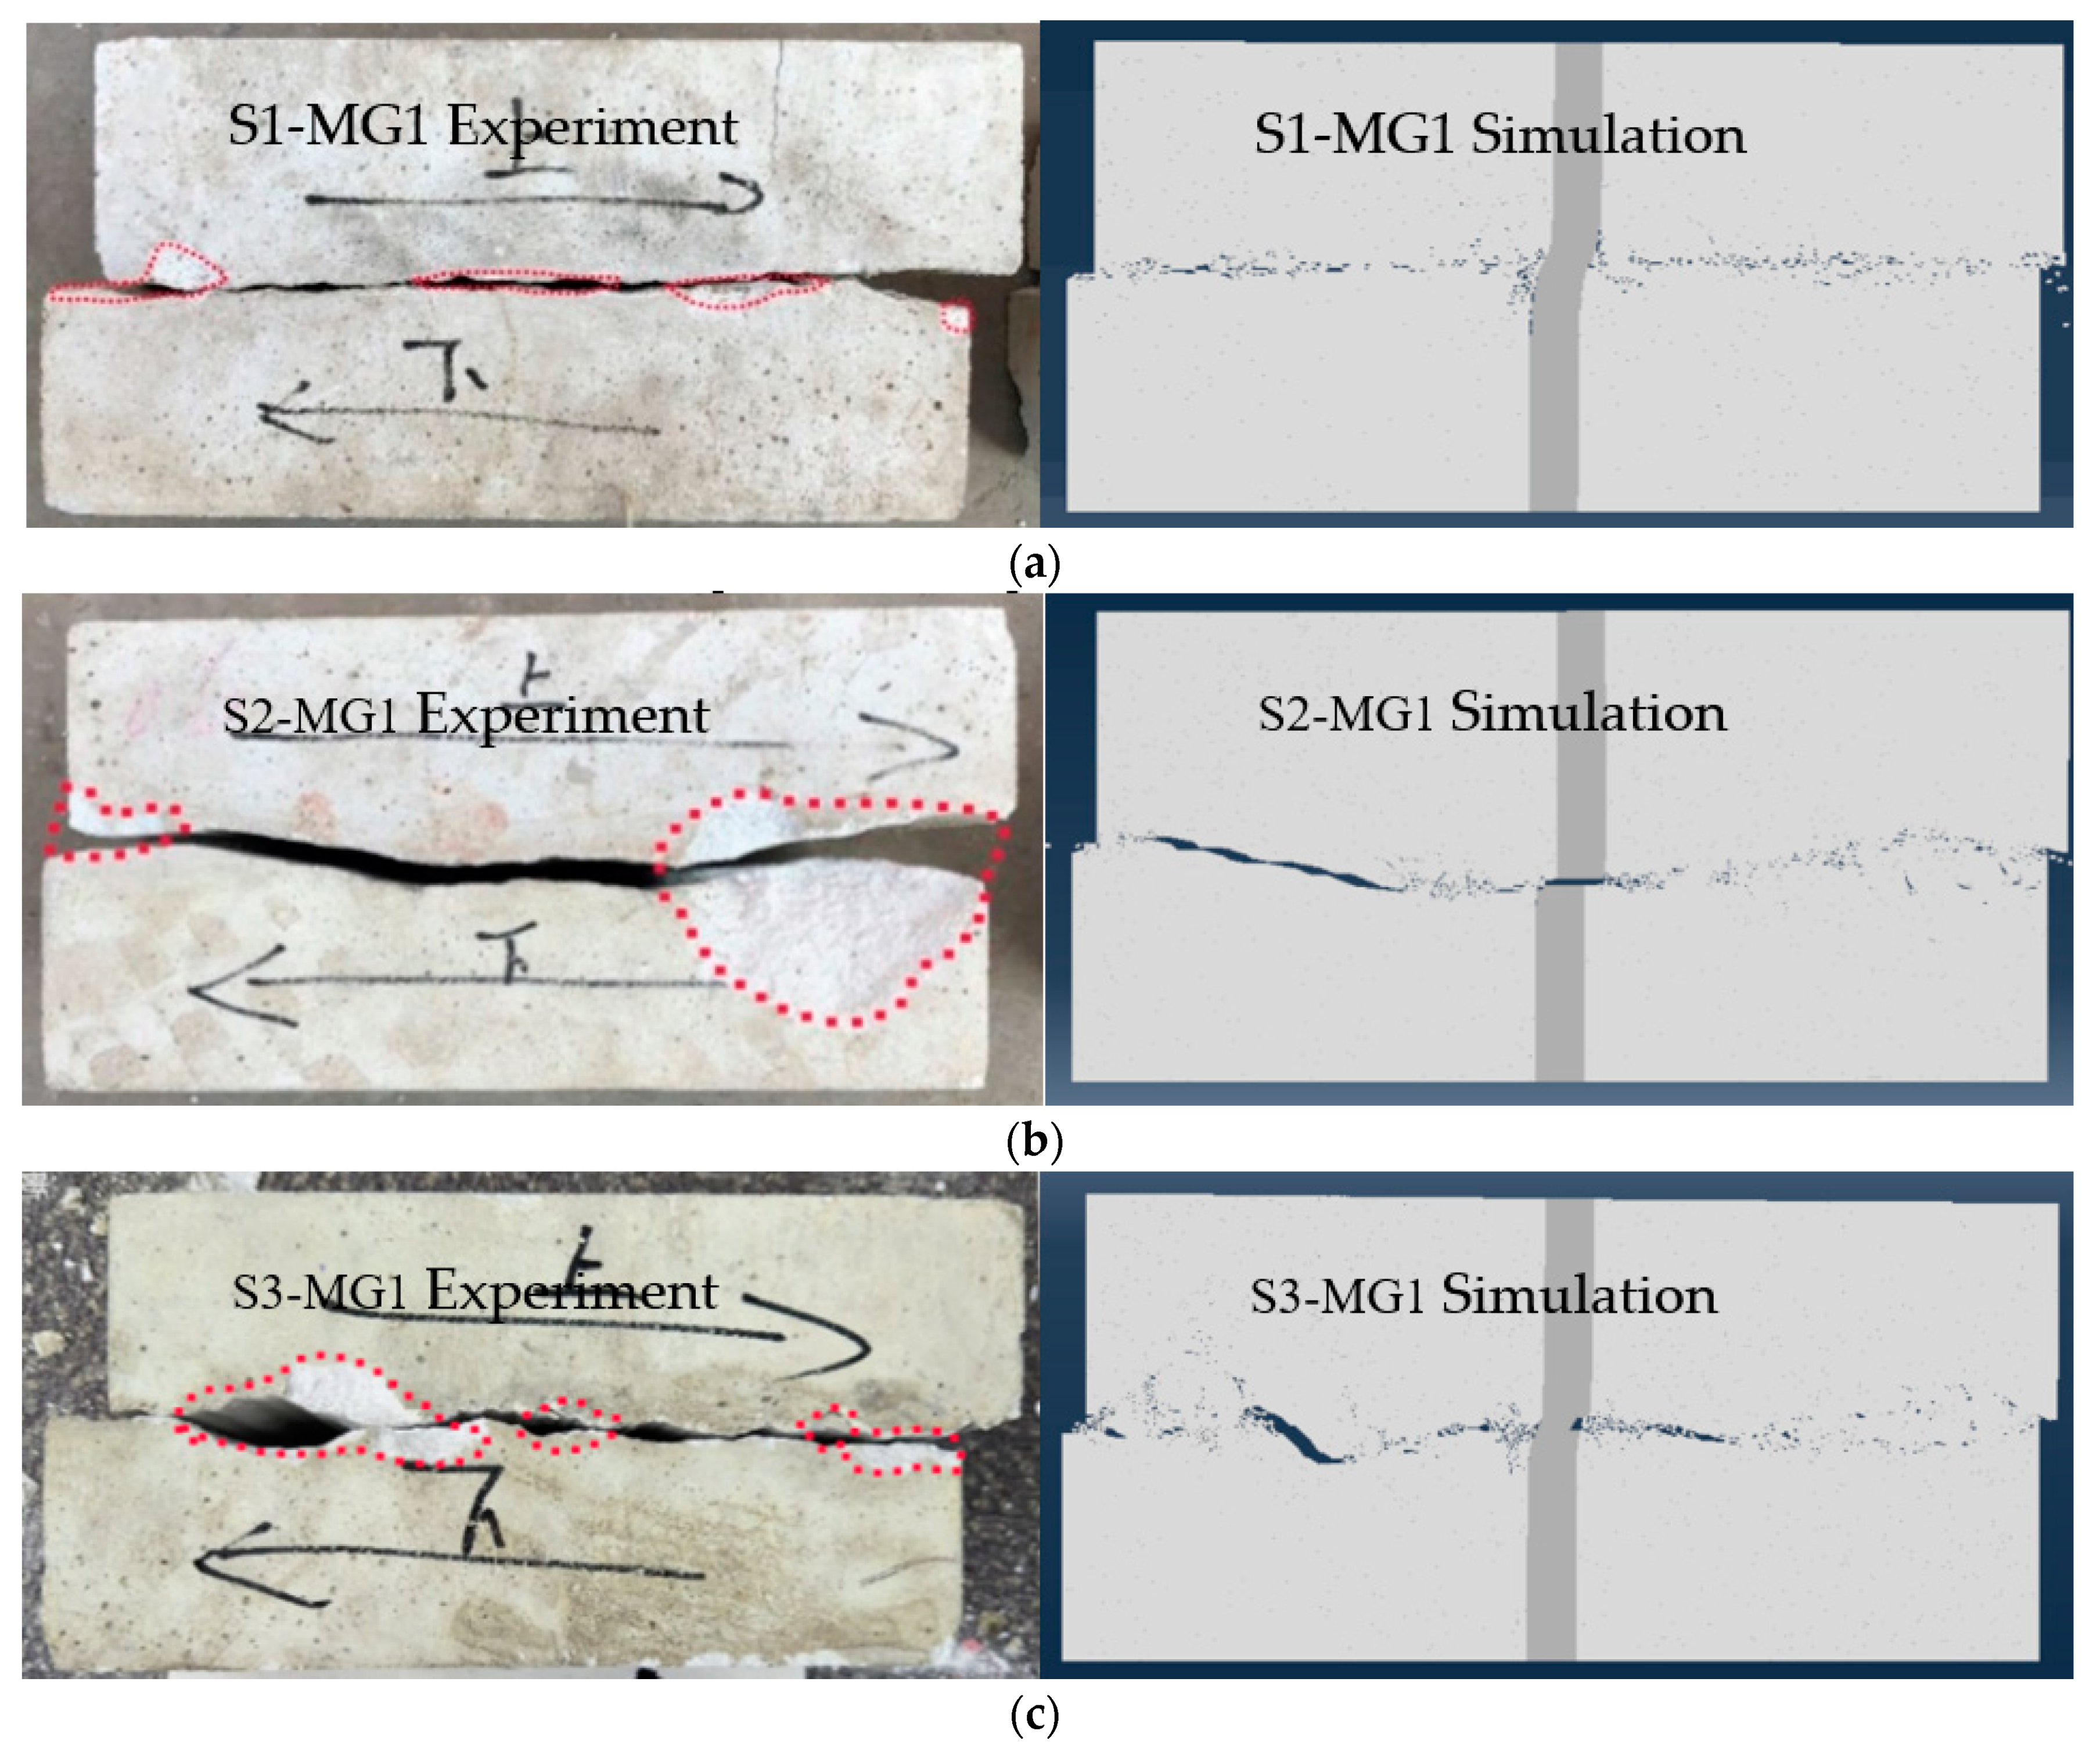
In order to verify the fidelity of this method applied to shear simulation of bolted joints, the experimental and simulation results are compared and analyzed from the macroscopic scale. Since there are many laboratory tests, here we only use S1-MG1, S2-MG1, and S3-MG1 to compare the results, as shown in Figure 14.
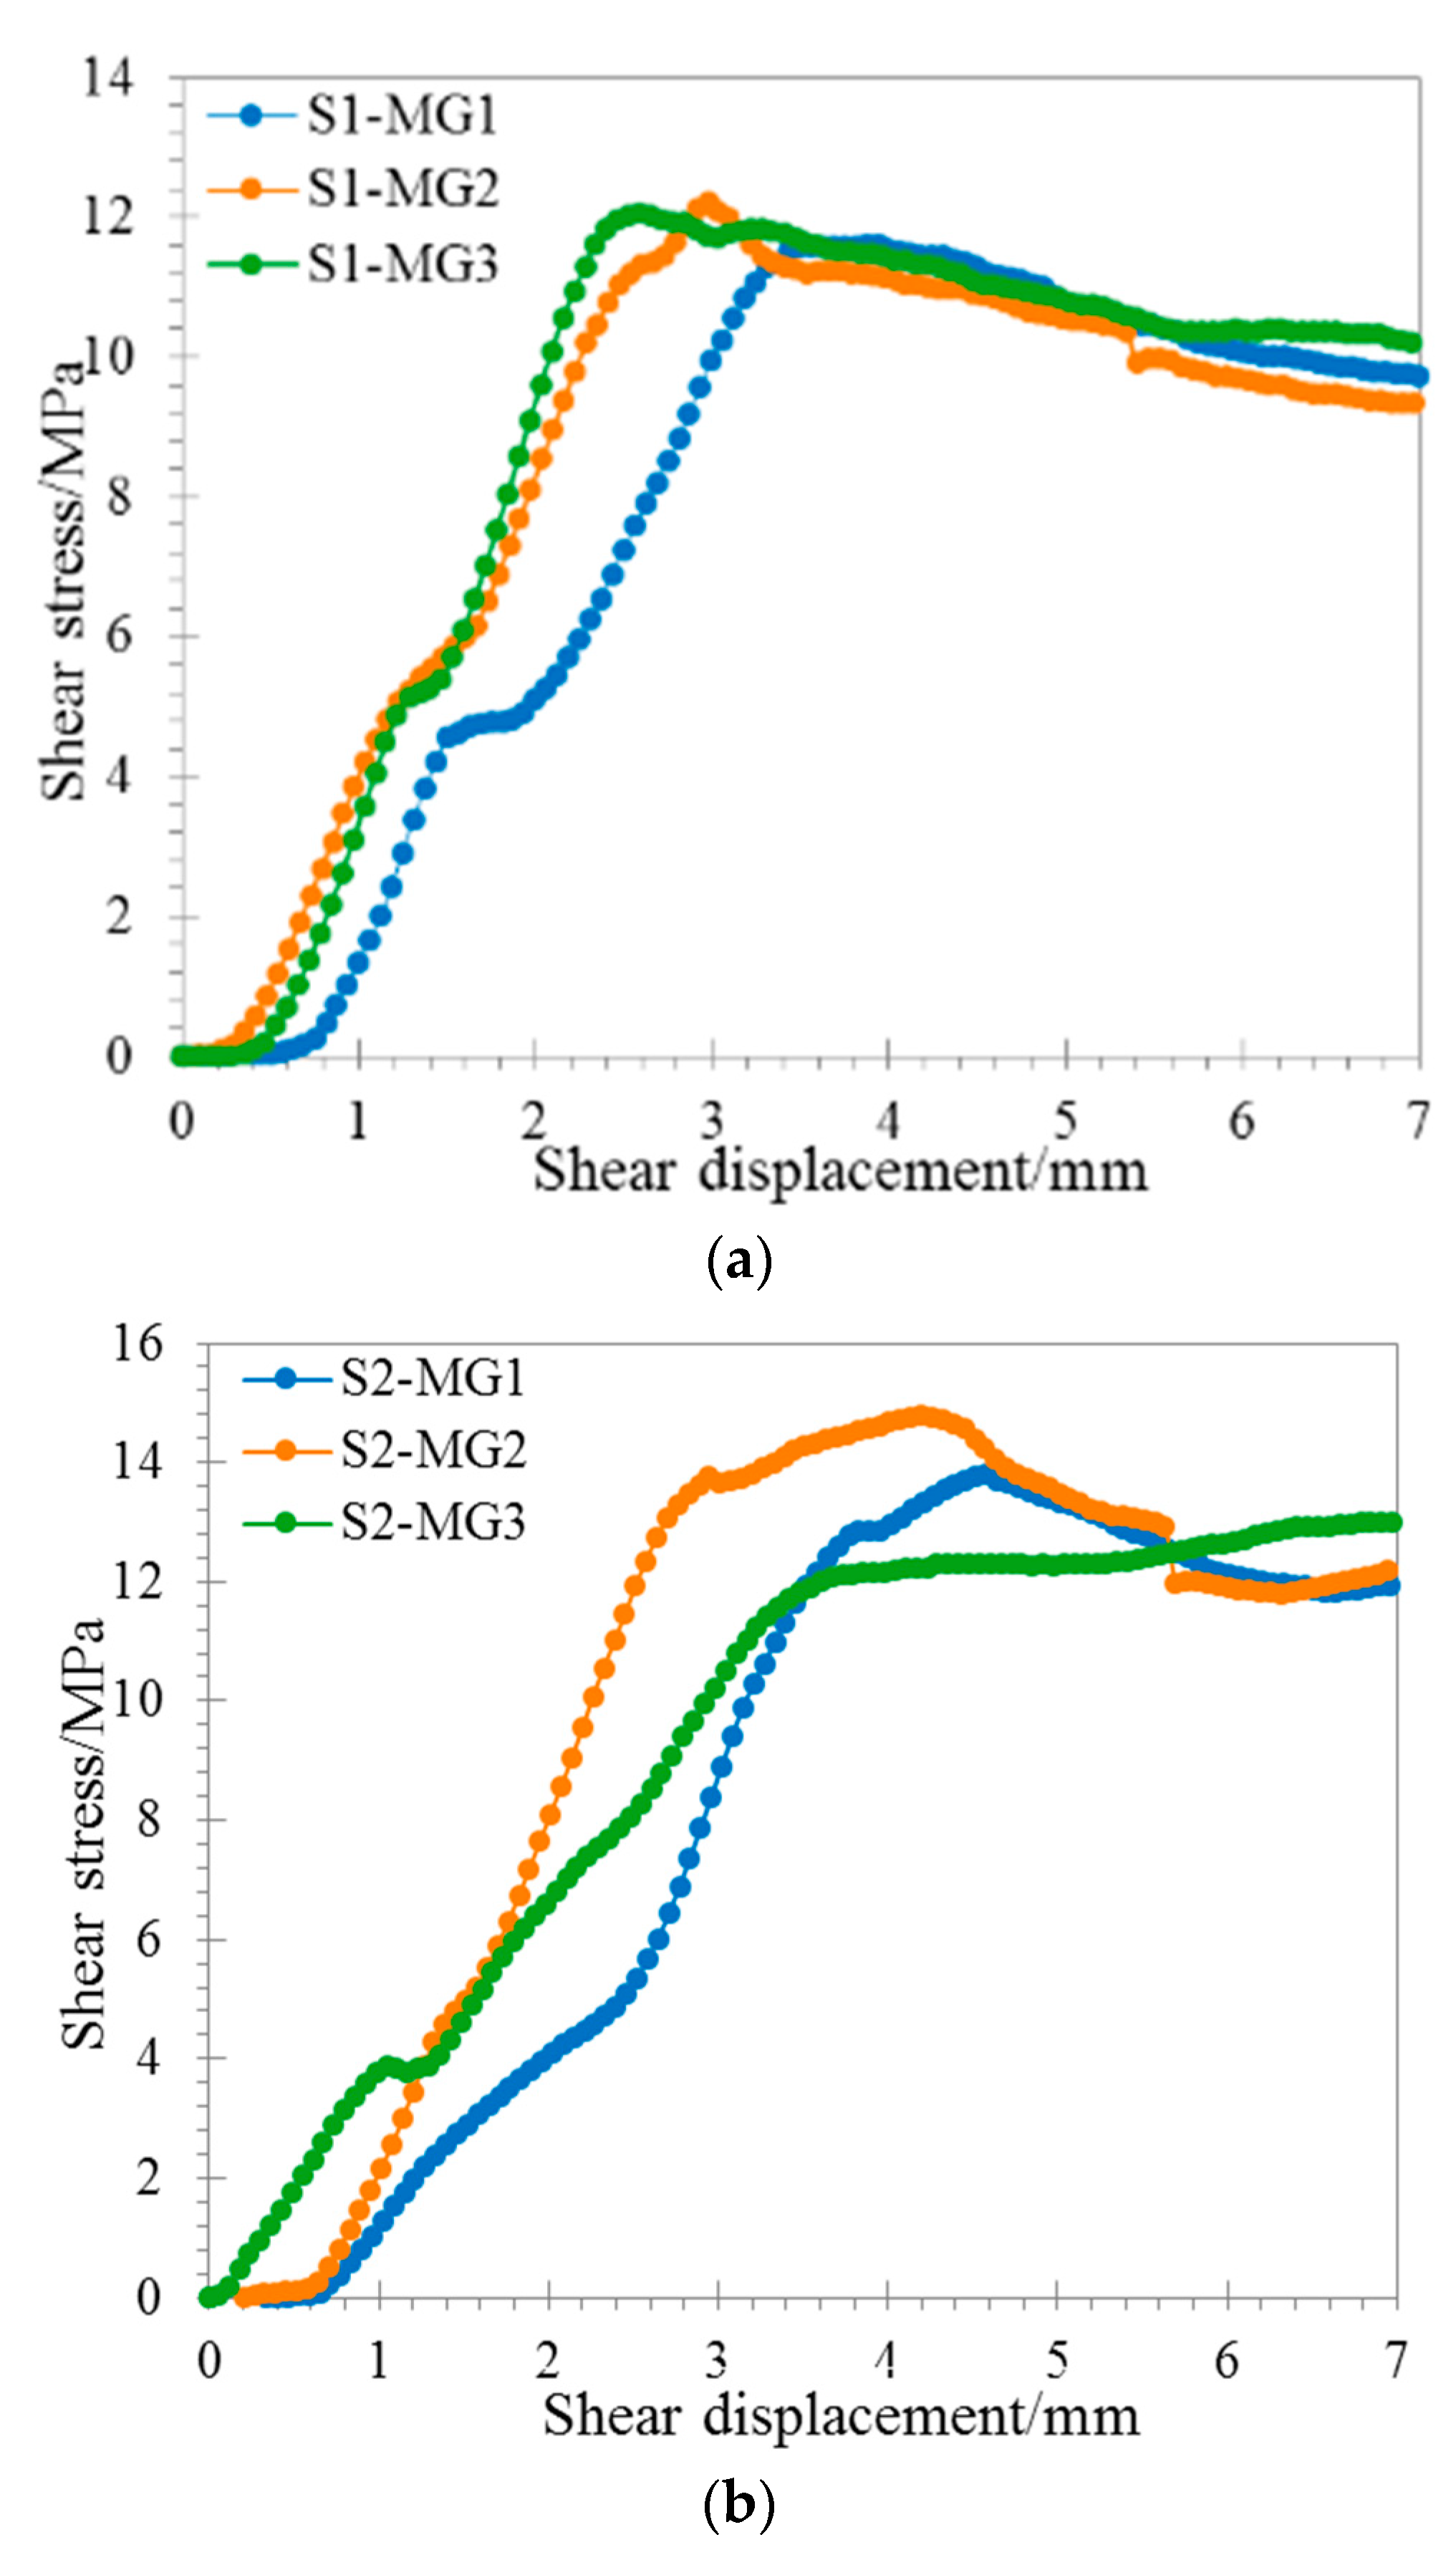
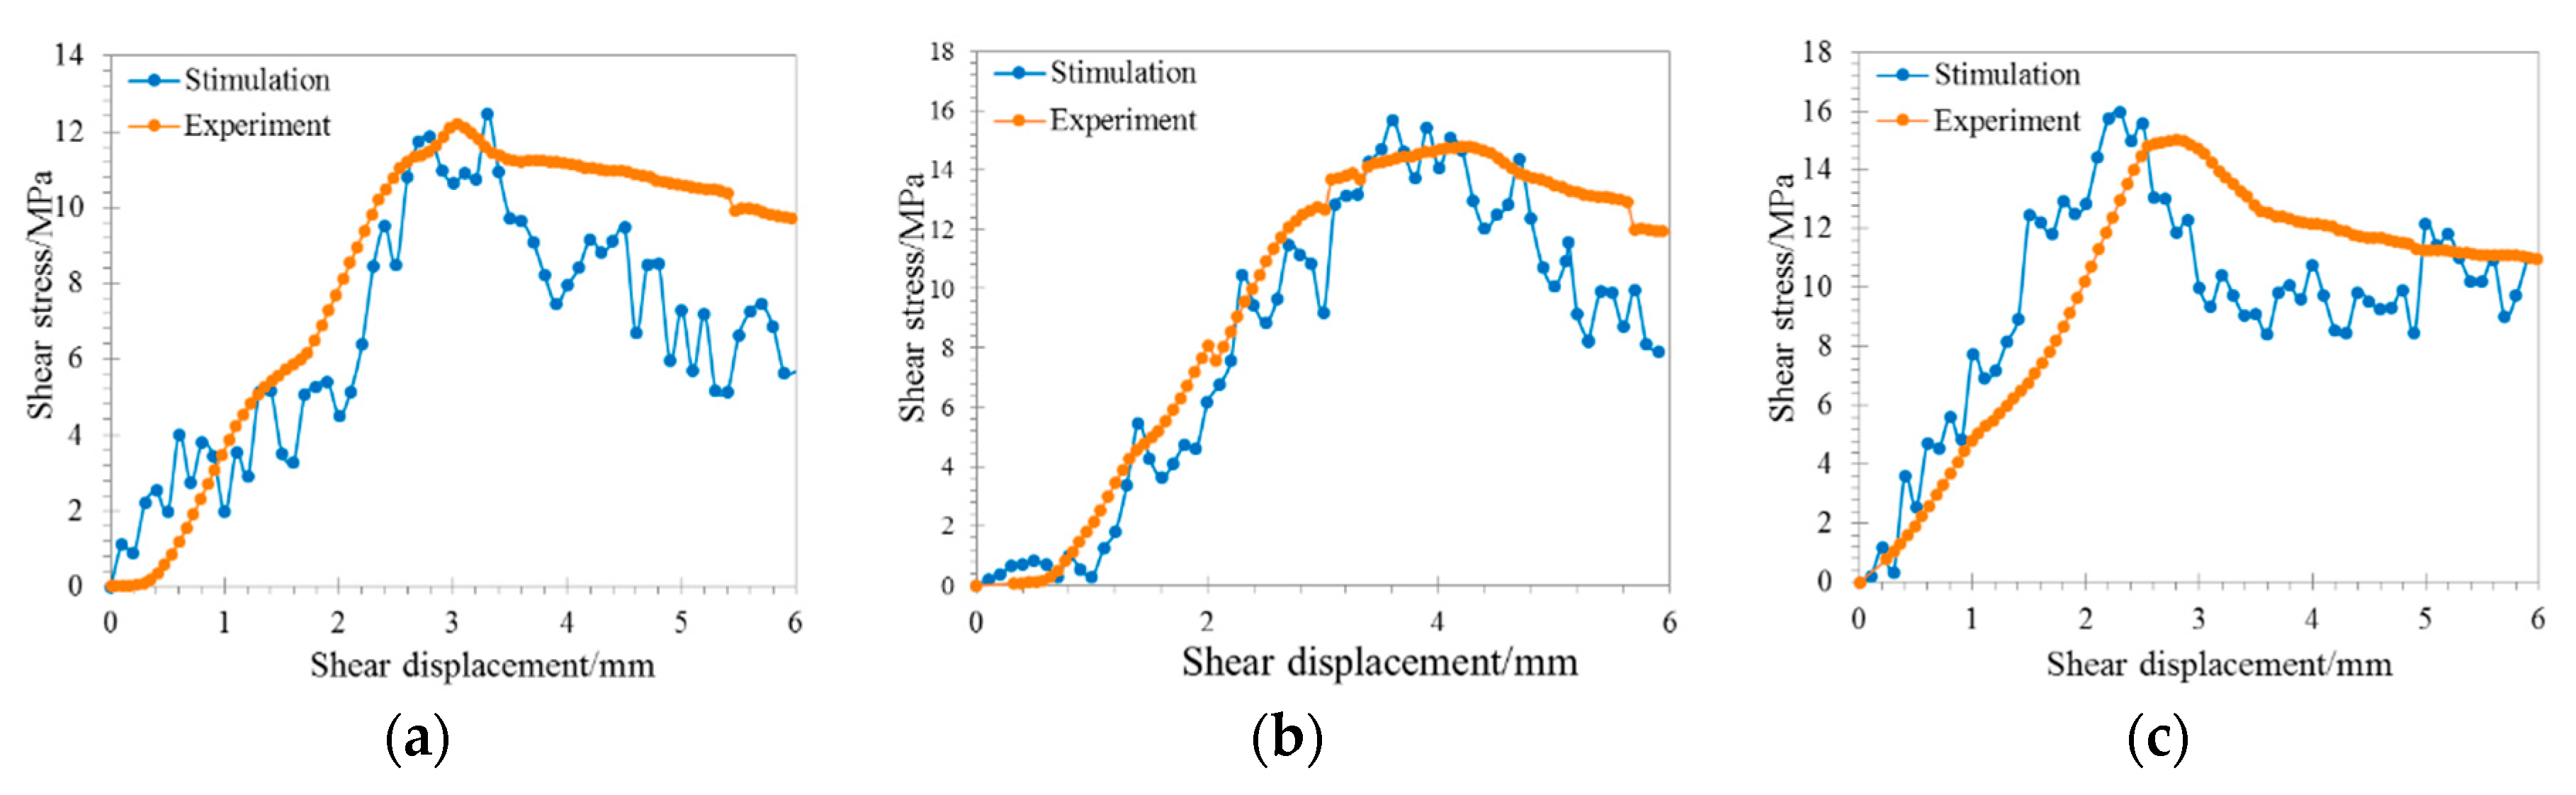
The simulation results of specimen S1-MG1 show a good agreement with the experimental results. Specifically, the cracks appear near the joint with a relatively low degree of development. The damaged surface protuberances form a small fractured zone near the joint, and the S shaped bending of the bolt is consistent with the experiment. After shearing S2-MG1 bolted jointed rock, a part of the rock shows shear fracture far from loading side. Simulation results show that a large number of micro-cracks appeared along the joint surface. Although, the macro-cutting effect was not observed, it did show a large area of fractured zone, which was consistent with the experimental result. Last, the simulation results of S3-MG1 bolted jointed rock is also in good agreement with the experimental result. After shearing, the asperities on the joint surface are all sheared, and the joints are severely damaged. Similar to the earlier analyses, we compare the relationship between shear stress and shear displacement from the simulated result to the experimental result, as shown in Figure 15.
We can see that, in general, the simulation results are in good agreement with the experimental results, which proves the fidelity of the simulation method. In addition, it can replicate the experimental shearing process fairly well, which allows for the investigation of the mechanical characteristics of bolted jointed rock. The data curves from numerical simulation is not smooth because the stress distribution on the jointed rock is not uniform during the shearing process. The failure of the surrounding cohesive elements causes the jumps in the outputted stress. The numerical simulation includes the strengthening stage, peak stage, softening stage, and residual strength stage, which is consistent with our experimental results and the literature, and to some extent proves the credibility of the simulation model. We believe this method can be used as a new research method to examine the shear failure mechanisms of bolted joints. According to the results of the numerical simulation, a quantitative analysis of the experimental results and numerical simulation results is performed, as listed in the Table 7. The mutual verification between numerical simulation and experiment shows that the test data are relatively correct, and the difference in peak shear strength between test and simulation results is about 11.5%, indicating that the experimental results and numerical simulation results are reasonably close.
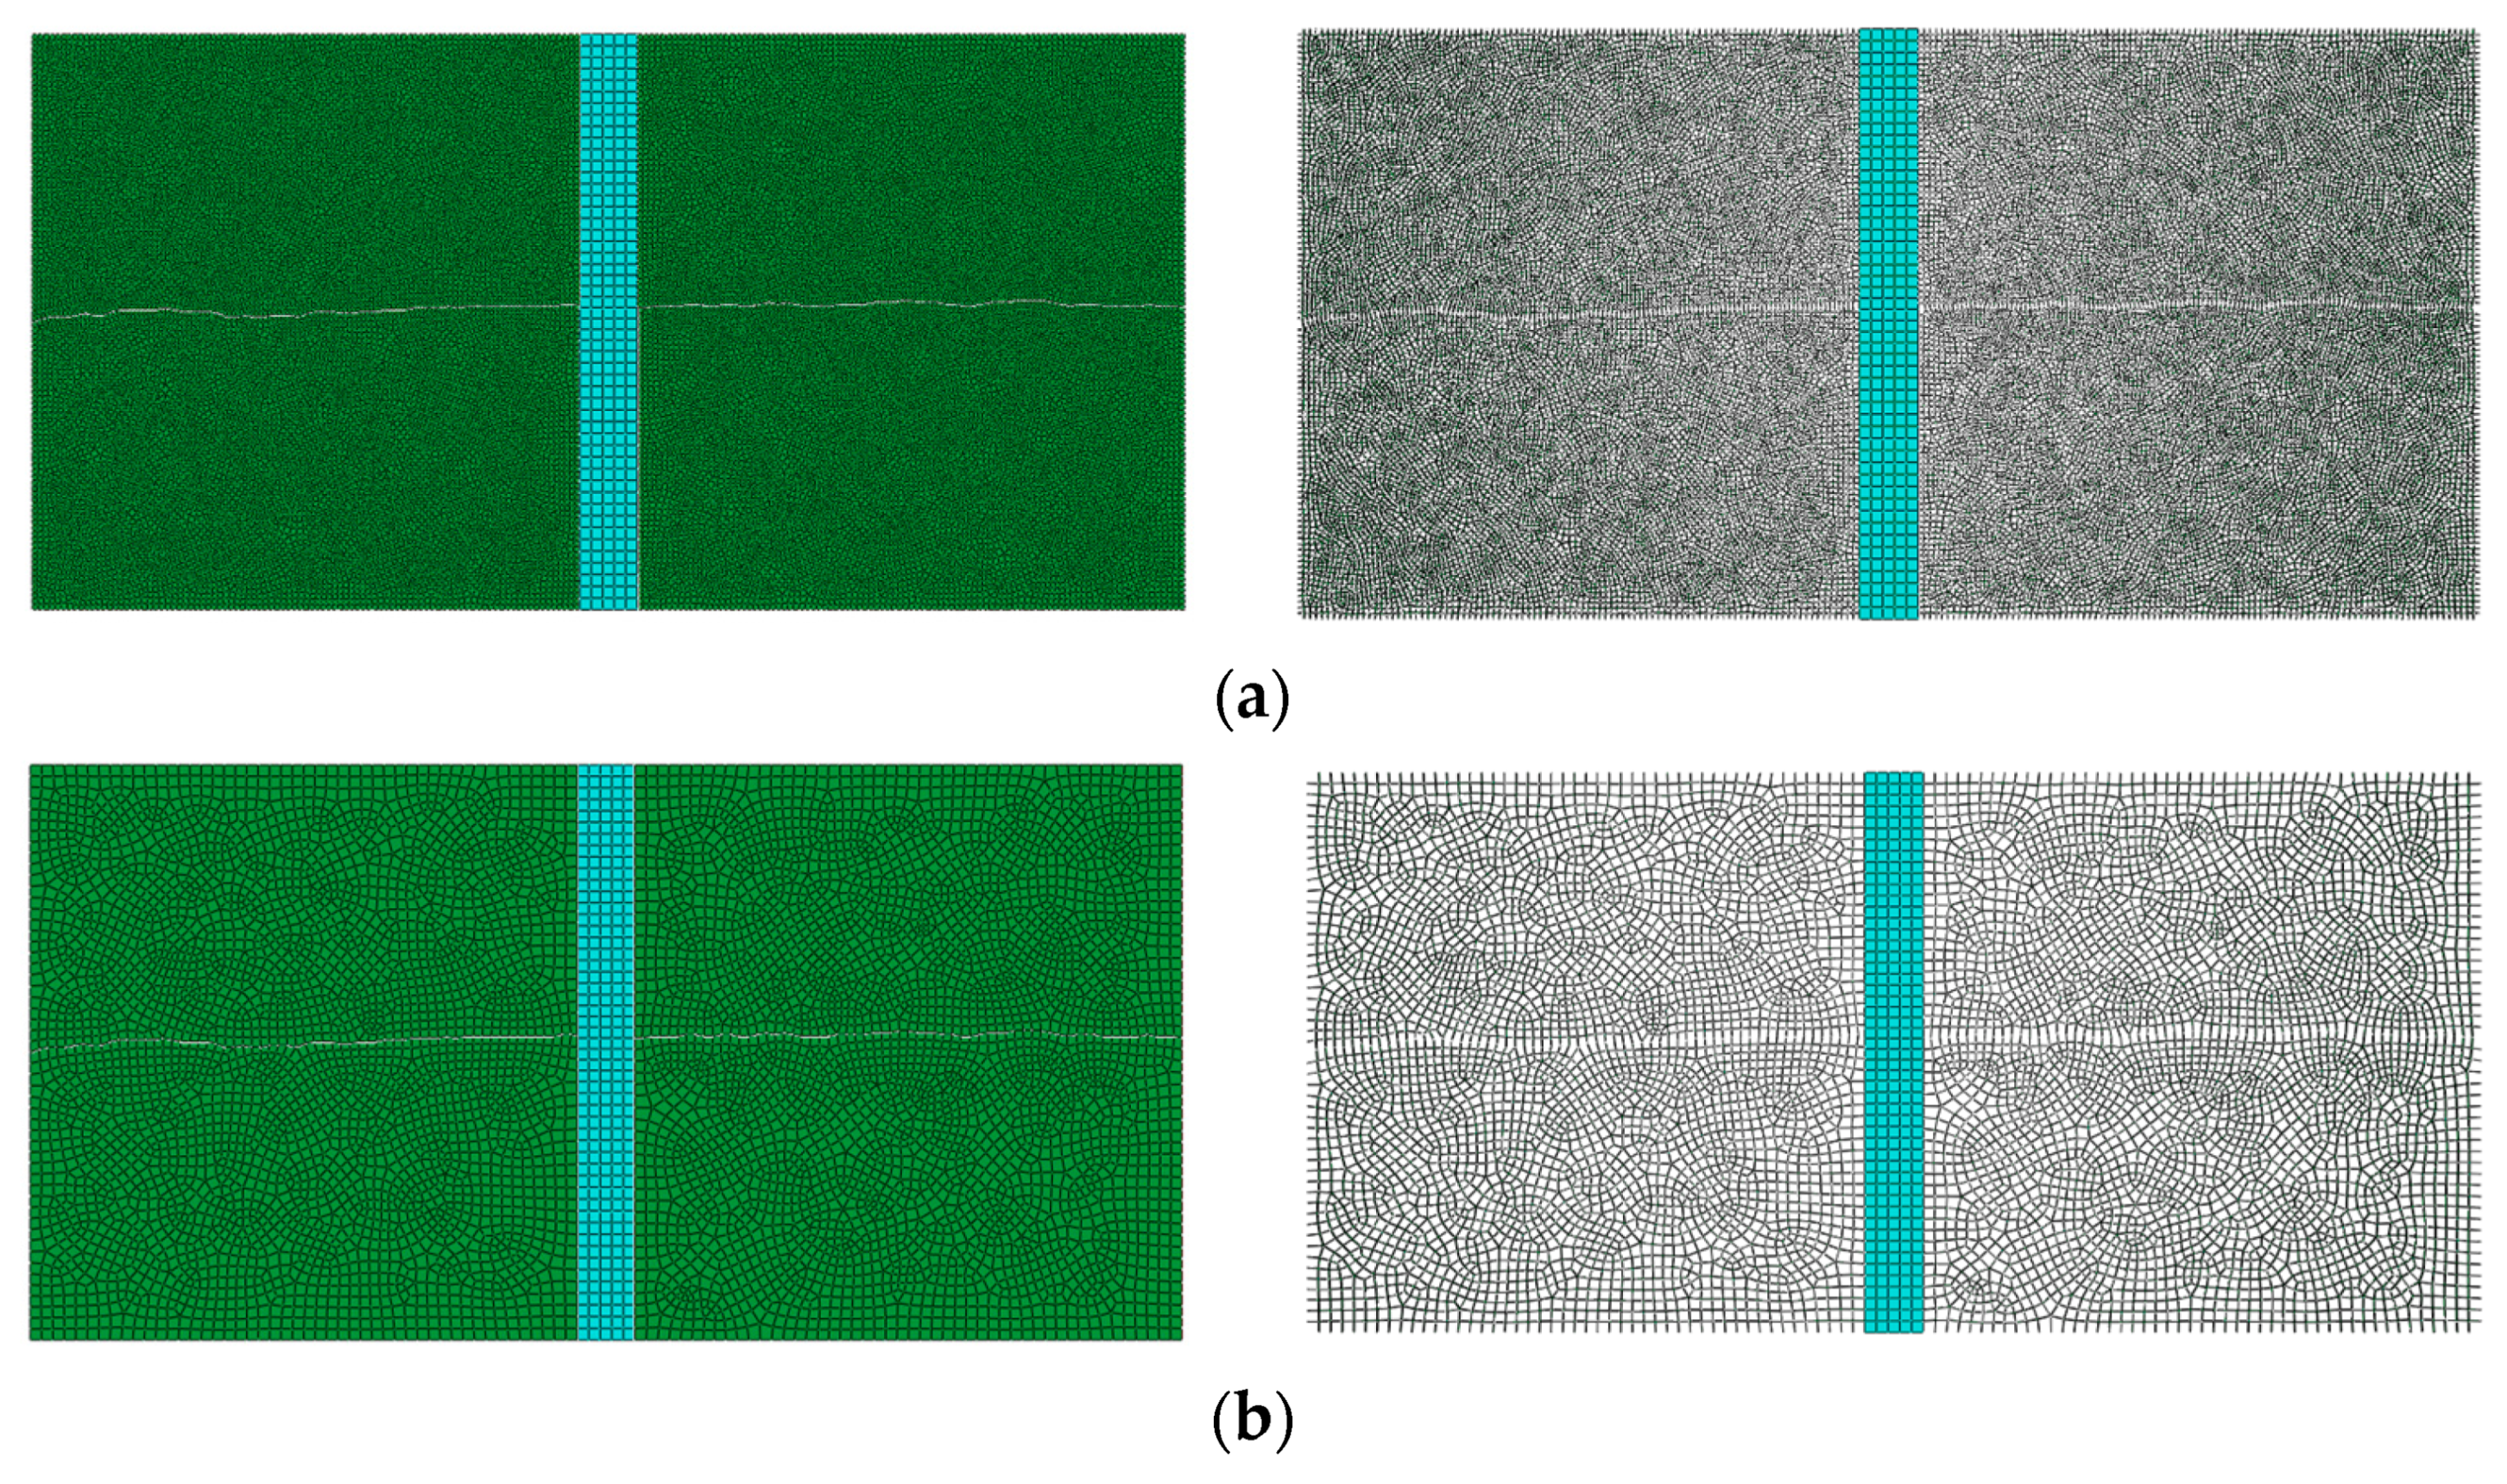
Because cohesive elements need to be pre-defined in the mesh, the crack can only propagate along the direction of the mesh. S1-MG1 is used an example to evaluate the influence of mesh size on the convergence. Figure 16 shows two different meshes and Figure 17 shows the results of numerical simulations.
The simulation results from two different meshes were found to be similar. The peak shear strength from the fine mesh model is 12.46 MPa, and that from the coarse mesh model is 12.06 MPa. Both models show the process of shear failure, and the fracture zone is also formed near the joint surface. However, more detailed deformation and failure can be obtained when using fine mesh. For example, the phenomenon of peeling off part of rock appears on the right side of the jointed rock, which is more in line with the real shear failure. This is due to the fact the CZM simulation method mainly uses pre-defined cohesive elements to represent the evolution of cracks. The finer the mesh, the closer the model to the real microscopic-structure of the rock. It can be concluded that the model has some mesh dependence, however, the overall trends from two meshes are very similar. Both models can converge, indicating that the mesh size does not impact convergence.

4.2.2. Failure Mechanisms of Bolted Rock

Understanding the stress in the bolt is of significance to evaluating the bolting effect and preventing the failure of bolted system. In addition, the use of high strength and low elongation bolt can cause a large range of rock fragmentation, which is another significant reason to explore the causes of this phenomenon for engineering construction. Therefore, we will analyze the S1-MG1 simulation results in detail in the following paragraphs.
During the shearing process of bolted joint surface, the shear stress is larger on the joint surface and smaller at two ends, hence, the joint surface is prone to shear failure. As the shear displacement increases, the shear stress tends to increase gradually. It can be seen that, in most cases, the failure of the bolt occurs near the joint, and is mainly shear failure. This type of failure mainly concentrates on the joint surface, which is not the real cause for the rock fracture. Figure 18 shows the shear stress as a function of distance from the joint for bolt S1-MG1 under 2–6 mm shear displacement conditions.
Normal stress distribution in Figure 19 illustrates that the stress of the bolt is not uniform during the shearing process. Specifically, the upper right side (near the loading side) and the lower left side (far from the loading side) are mainly subjected to tensile stress, while the opposite two sides are mainly subjected to compressive stress. In addition, it is proved that the same stress exists at the position where the bolt contacts the rock. 
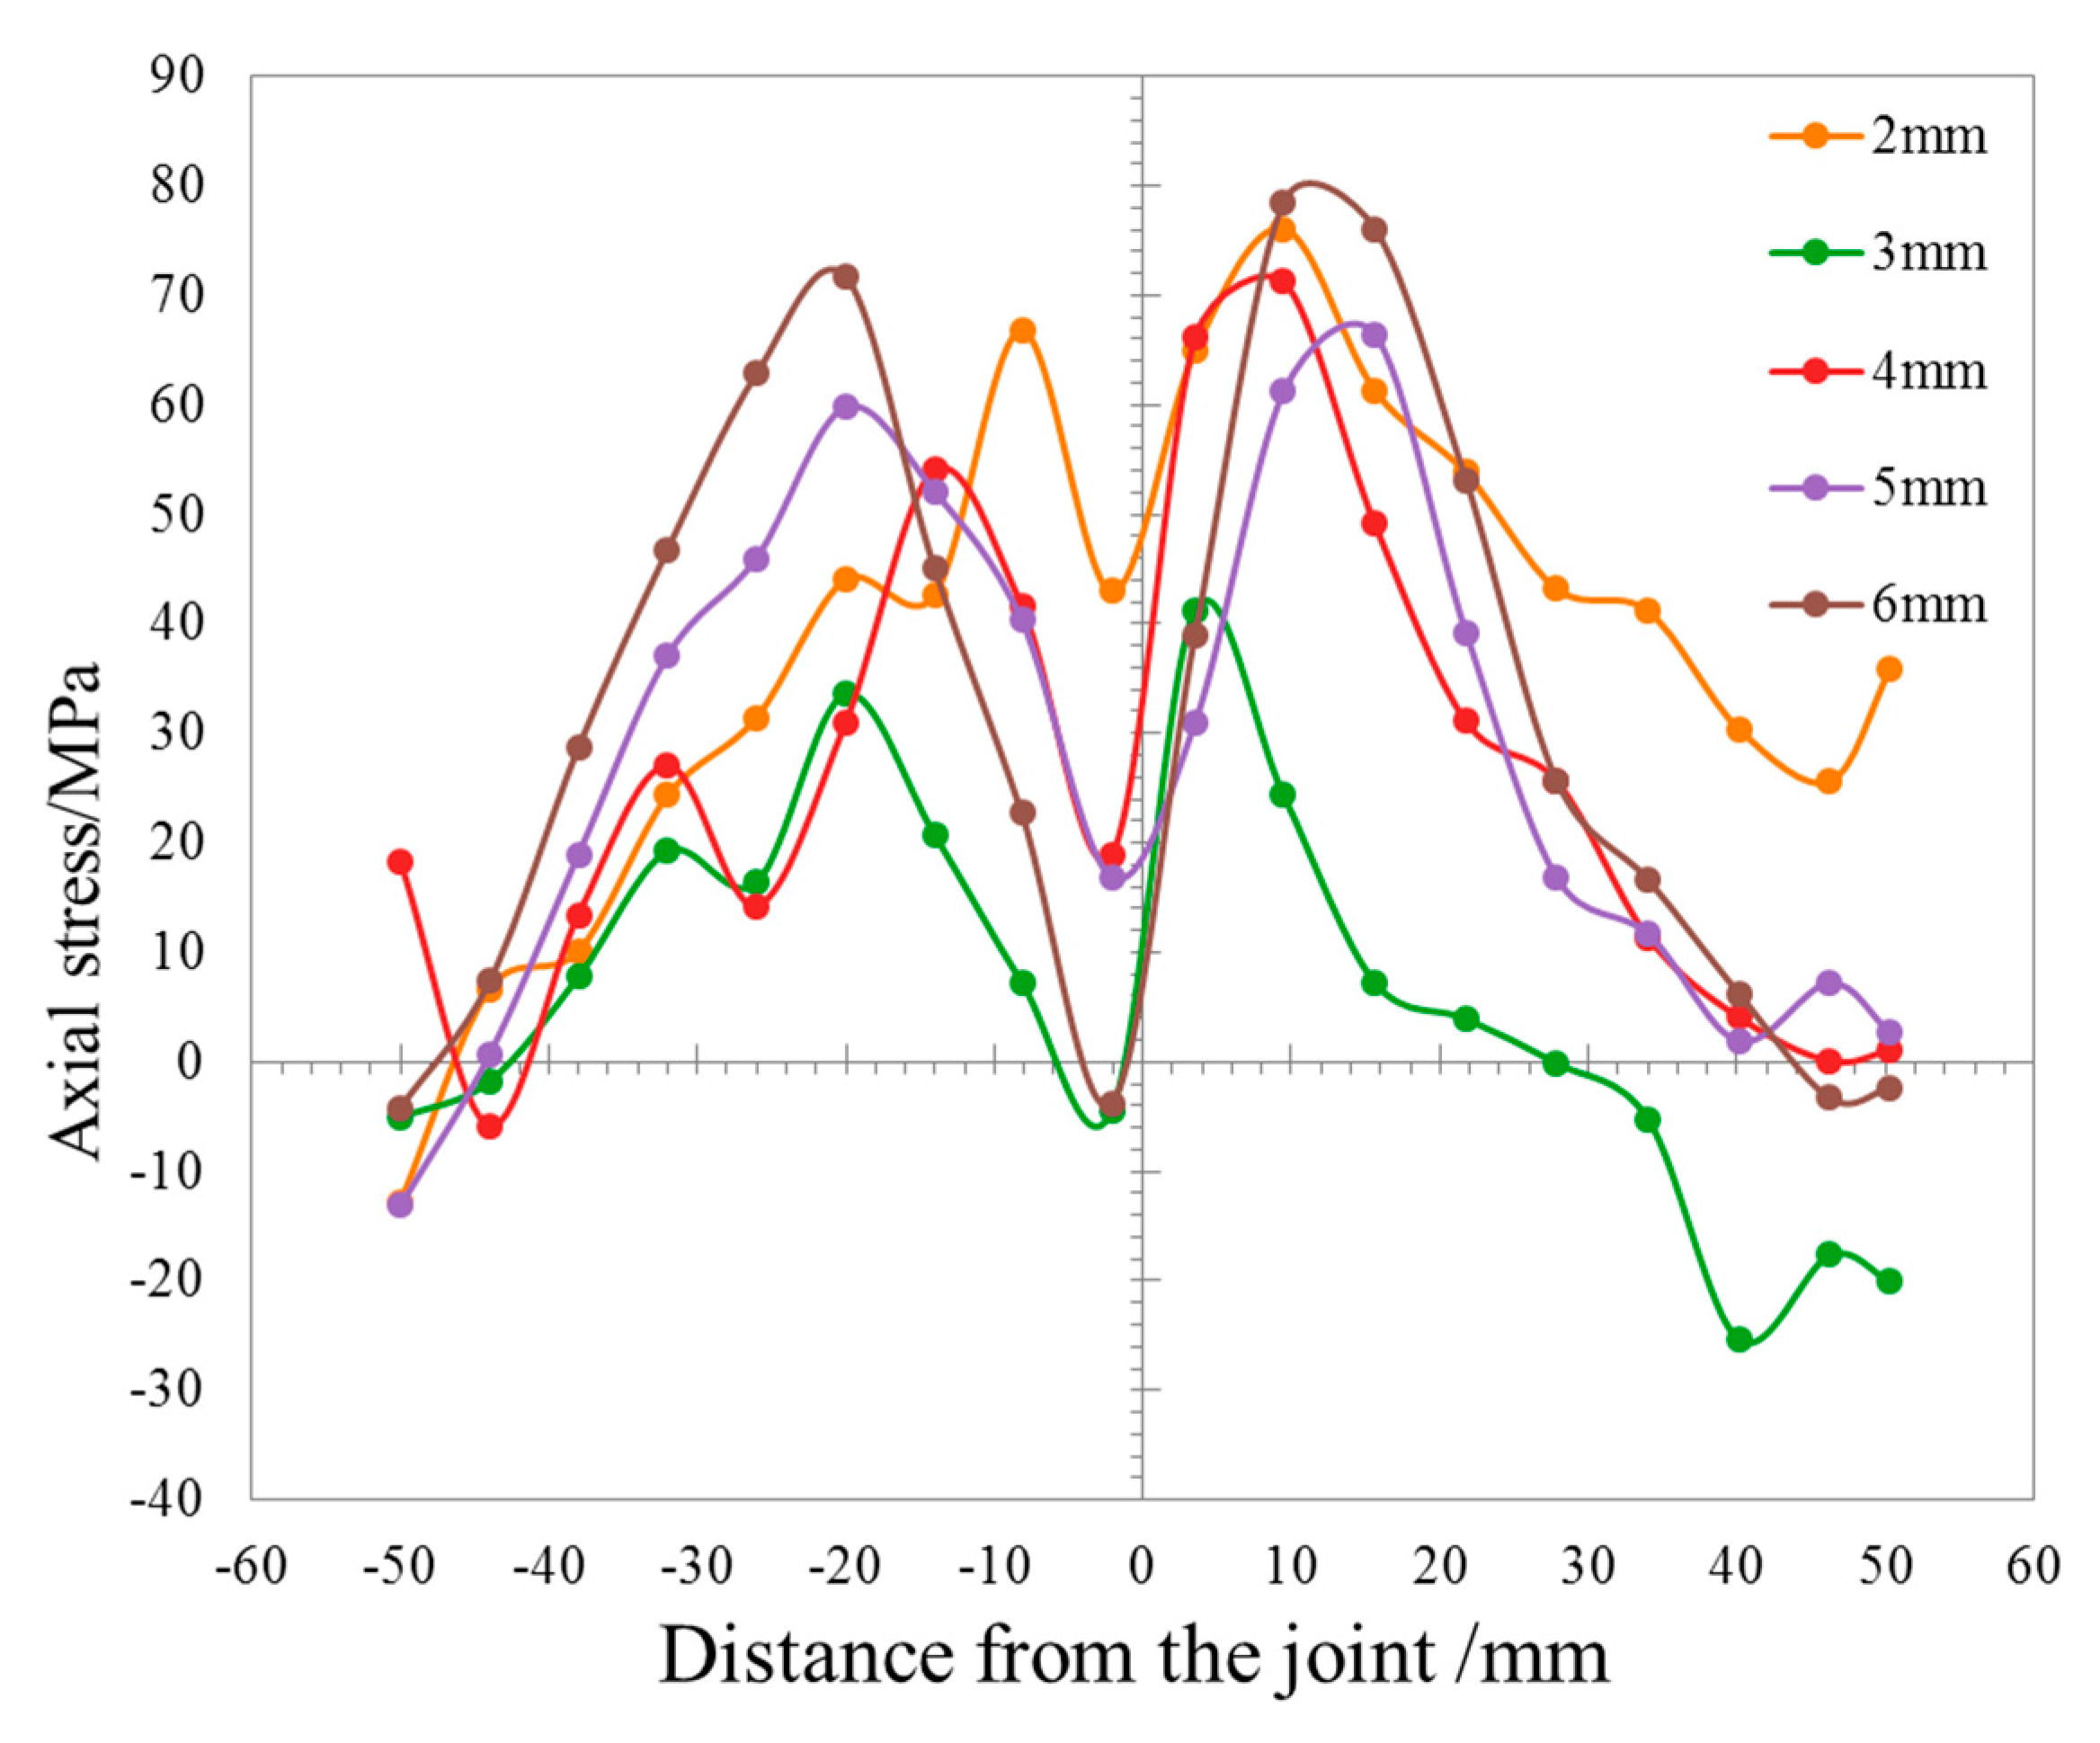
Figure 20 shows the axial stress of bolt as a function of distance from the joint under 2–6 mm shear displacement conditions. In order to further explore the tensile stress of rock under three different bolted modes, the axial stress of rock under three different bolted modes with shear displacement of 2 mm is obtained. It is found that the tensile stress of jointed rock increases with increasing bolt strength, as shown in Figure 21.
It is well-known that the material properties of bolt and the surrounding rock are very different, and the rock has the typical characteristics of bearing compressive stress, but not tensile stress. Therefore, deformation mismatch is very easy to occur in the process of shearing. When shear dilatancy occurs, the bolt with higher elongation can be deformed greatly, so the bolt and the surrounding rock can be deformed cooperatively, which can effectively reduce the normal stress between the bolt and the surrounding rock. However, when the elongation of the bolt is low, the deformation of the bolt is small, and the stiffness of the bolt is far greater than that of the rock, and because of the strong bonding between the bolt and the surrounding rock, the contact position of the bolt and the surrounding rock will form a larger tensile stress. This leads to the initiation of the crack from the contact position and gradually propagating to the top of the rock. This also explains the phenomenon that all cracks pass through the bolt hole in the experiments.
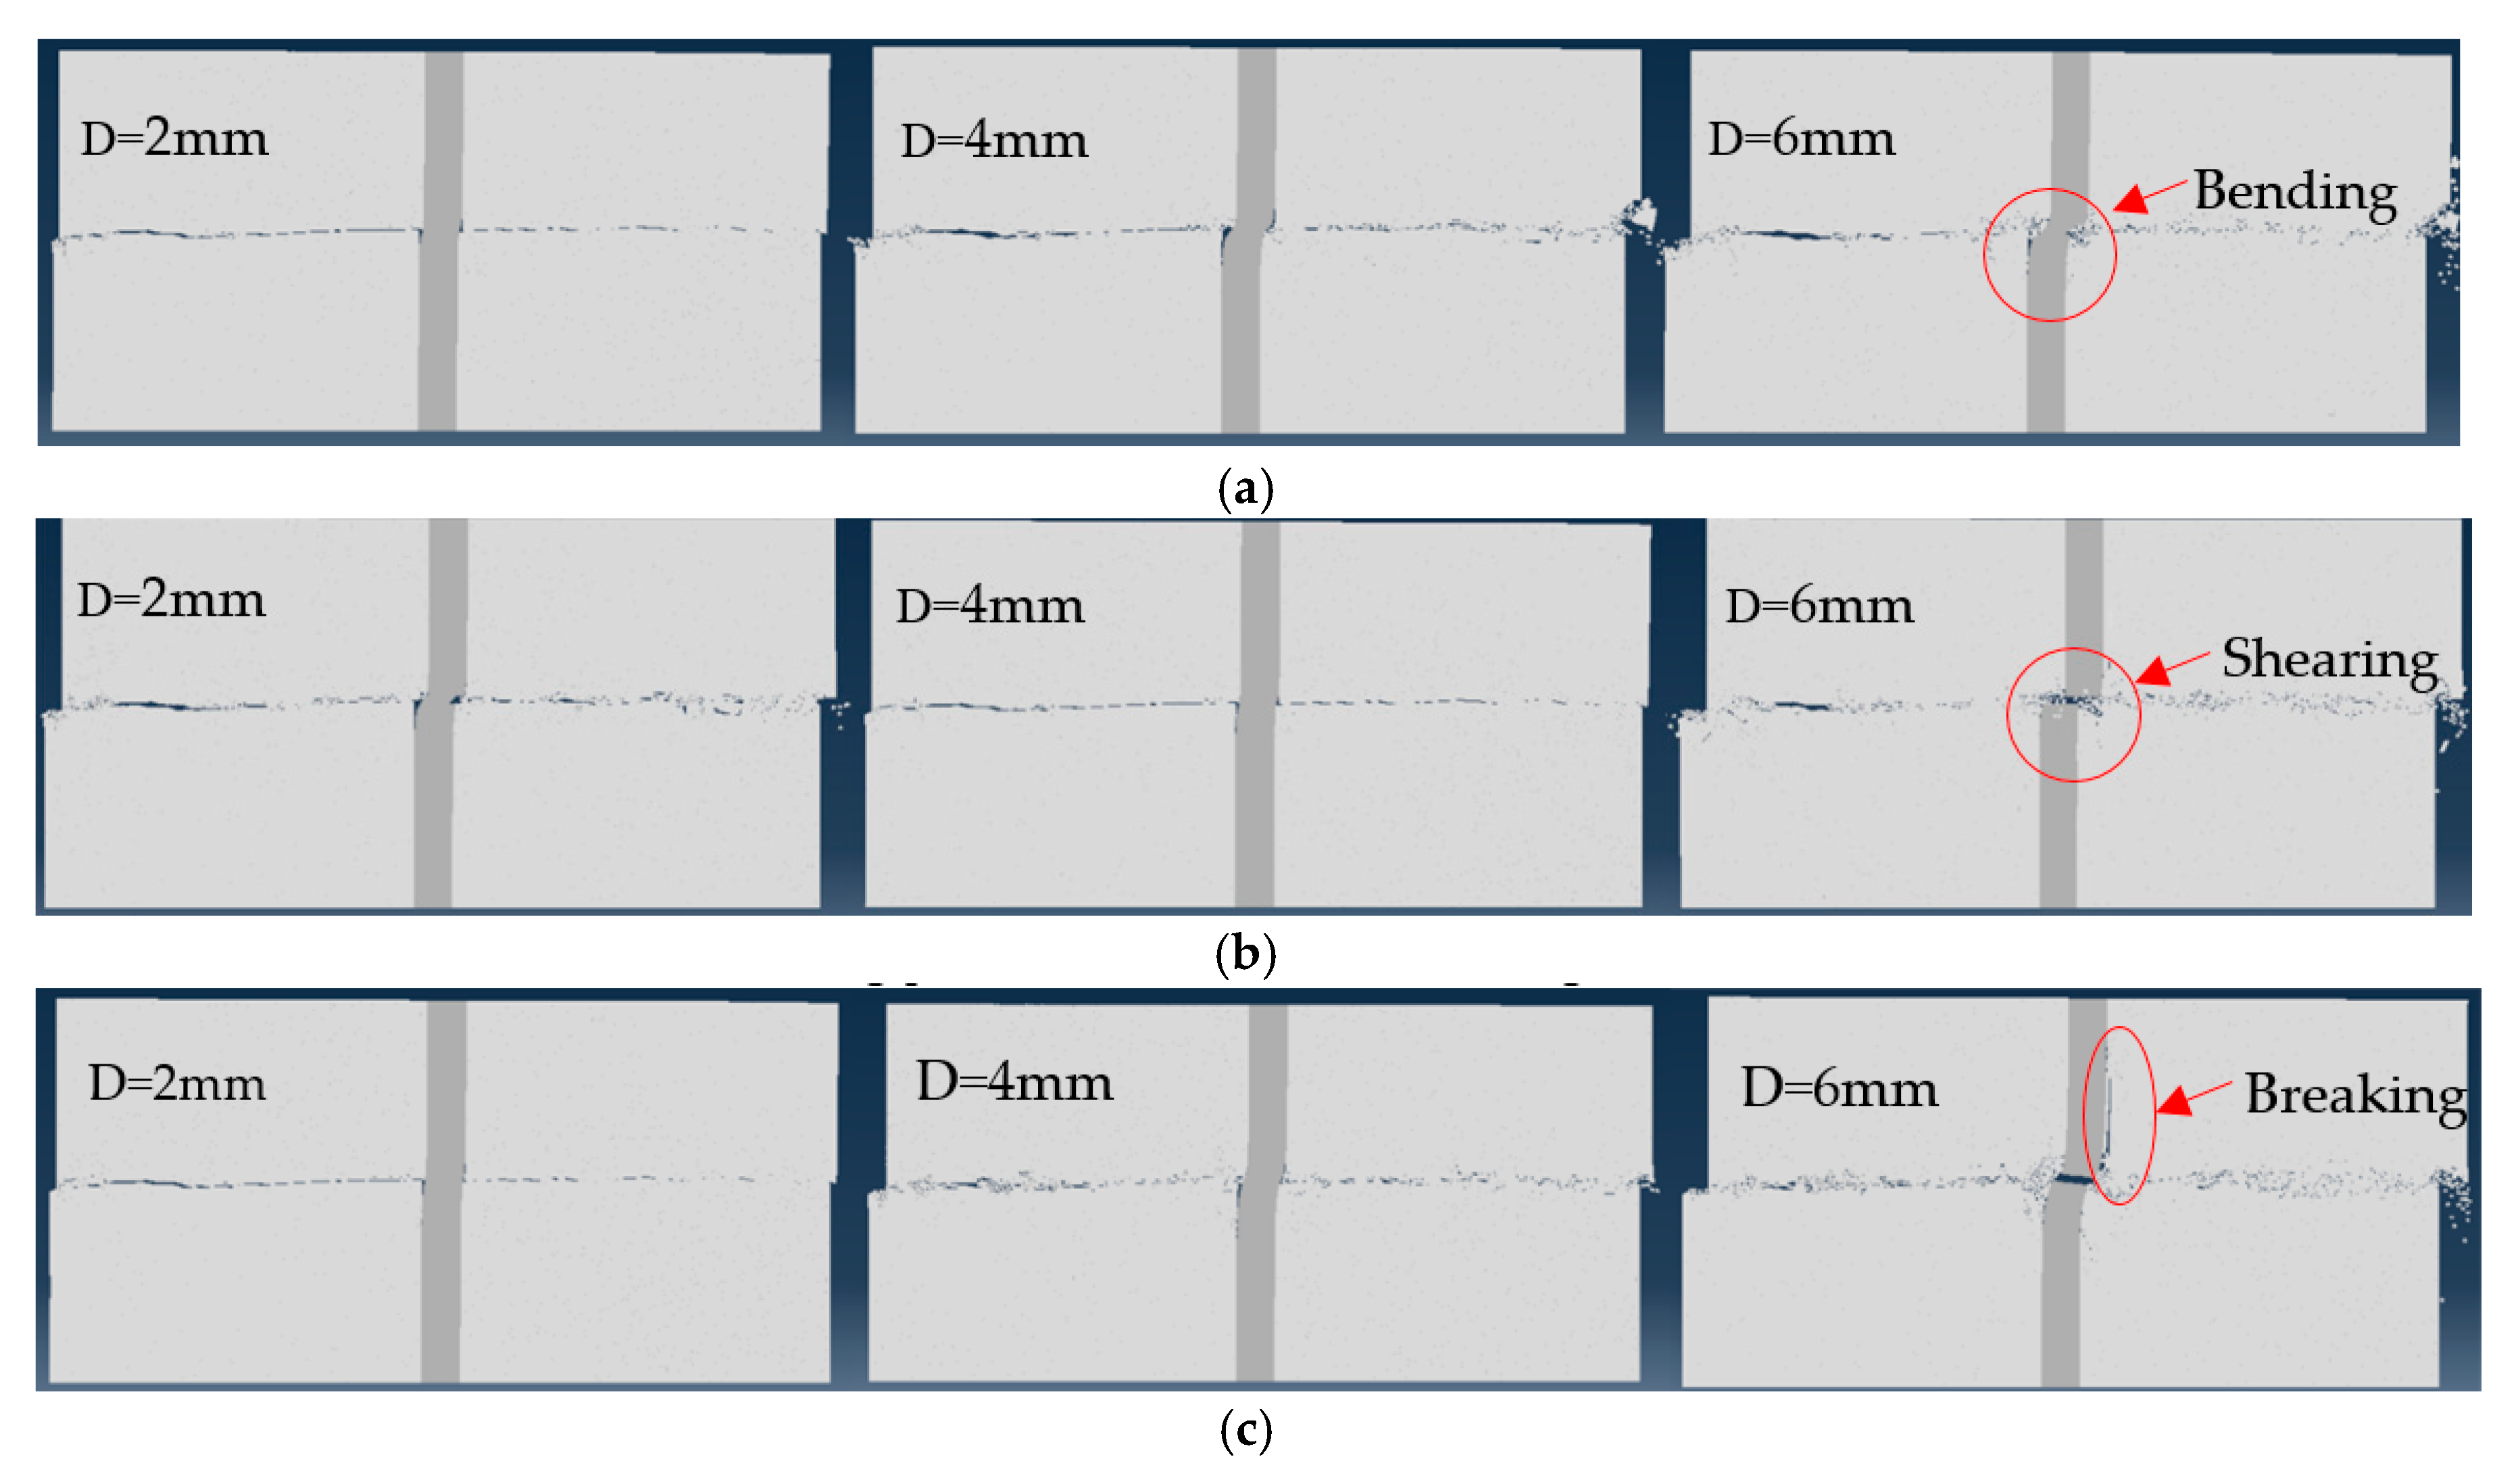
In order to further confirm the above observation, we take S1-(MG1-MG3) as examples to show the shear deformation characteristics of different bolted joints, as shown in Figure 22, where D stands for the shear displacement.
As can be seen from Figure 22, the bolted jointed rock with 25% elongation has the largest deformation in the shearing process due to the high elongation of the bolt. The rock and the bolt are cooperatively deformed during the shear process, which is beneficial to the bolted support. Although, the bolted effect is good, the peak shear strength is low because of its low strength. Underground oil storage caverns normally allow extremely small deformation due to the stability requirement. When shear slip occurs, this type of bolt is flexible and can continue to anchor the surrounding rock. In practice, however, the low shear strength causes the surrounding rock to fail to satisfy the structural function due to large deformation. Therefore, in practical engineering, the use of such bolts should be avoided. More robust bolts are recommended to meet structural deformation requirements.
The shear strength can be improved by using the bolt with 15% elongation. During the shearing process, when the bolted jointed rock is sheared 2~4 mm, the bolt and the surrounding rock can maintain matched deformation. After the displacement reaches to 6 mm, the bolt broke. This behavior indicates that the 15% elongation bolt can improve the shear strength when the shear slip is small, and can co-deform with the surrounding rock when the shear displacement is large. Under shearing displacement, the bolt breakage occurs first, which can further ensure the stability of the surrounding rock and prevent the occurrence of large engineering. Thus, it is recommended that this type of bolt is used for the Huangdao underground oil storage project.
For the bolt with only 5% elongation, when the shear displacement reaches to 6 mm, we observe that not only the bolt breaks, the surrounding rock also has a deep crack near the bolt hole under large tensile stress.
In this work, it is found that the fundamental cause of the rock failure is the tensile stress between the bolt and the rock. Therefore, in the process of bolting support for jointed rock, the rigidity of bolt cannot be increased without limit, and the damage effect of the bolt to the surrounding rock should also be considered, to improve the shear strength of the joint surface and ensure that the damage effect of the bolt to the system is low, and bolting support is achieved.

5. Conclusions

The following conclusions can be drawn from this study:
(1) Increasing the strength and decreasing the elongation of the bolt can enhance the shear strength, but the small the elongation will cause the damage of the jointed rock and lose the supporting effect. Based on the rock properties of the Huangdao underground oil depot, the bolts with 15% elongation are better.
(2) A new numerical simulation method for shear behavior of bolted jointed rock is presented. Model can effectively replicate the shear experiments and simulation results are in good agreement with the experimental results. The results show that the numerical simulation method can be applied to explore the shearing process of joint surface.
(3) Numerical simulations indicate that the fundamental reason for rock failure is that the deformation between the bolt and the surrounding rock is mismatched, and the tensile stress between the bolt and the rock leads to rock rupture near the bolt hole. Numerical modeling also shows that the bolts with 15% elongation are better to provide support.

Author Contributions

The authors S.Z., G.W., Y.J., X.W., G.L., P.H., J.Y. and L.S. contributed equally to this work. All authors have read and agreed to the published version of the manuscript.

Funding

This study was funded by the National Natural Science Foundation of China (No. 51479108, 51379117 and 41672281).

Acknowledgments

This study was funded by the National Natural Science Foundation of China (No. 51479108, 51379117 and 41672281).

Conflicts of Interest

The authors declare no conflict of interest. The founding sponsors had no role in the design of the study; in the collection, analyses, or interpretation of data; in the writing of the manuscript, and in the decision to publish the results.

References

  1. Cai, M. Rock Mass Characterization and Rock Property Variability Considerations for Tunnel and Cavern Design. Rock Mech. Rock Eng. 2011, 44, 379–399. [Google Scholar] [CrossRef]
  2. Boon, C.W.; Houlsby, G.T.; Utili, S. Designing Tunnel Support in Jointed Rock Masses Via the DEM. Rock Mech. Rock Eng. 2015, 48, 603–632. [Google Scholar] [CrossRef]
  3. Li, W.; Yang, N.; Mei, Y.; Zhang, Y.; Wang, L.; Ma, H. Experimental investigation of the compression-bending property of the casing joints in a concrete filled steel tubular supporting arch for tunnel engineering. Tunn. Undergr. Space Technol. 2020, 96, 103184. [Google Scholar] [CrossRef]
  4. Wang, G.; Wang, K.; Wang, S.; Elsworth, D.; Jiang, Y. An improved permeability evolution model and its application in fractured sorbing media. J. Nat. Gas Sci. Eng. 2018, 56, 222–232. [Google Scholar] [CrossRef]
  5. Yang, X.; Qiao, W. Numerical investigation of the shear behavior of granite materials containing discontinuous joints by utilizing the flat-joint model. Comput. Geotech. 2018, 104, 69–80. [Google Scholar] [CrossRef]
  6. Stimpson, B. A simplified rock mass-rock bolt interaction analysis for horizontally layered strata. Geotech. Geol. Eng. 1991, 9, 27–51. [Google Scholar] [CrossRef]
  7. Wang, G.; Han, W.; Jiang, Y.; Luan, H.; Wang, K. Coupling Analysis for Rock Mass Supported with CMC or CFC Rockbolts Based on Viscoelastic Method. Rock Mech. Rock Eng. 2019, 52, 4565–4588. [Google Scholar] [CrossRef]
  8. Bjurström, S. Shear strength of hard rock joint hard rock joints reinforced by grouted untensioned bolts. In Proceedings of the Third Congress of the International Society for Rock Mechanics, Denver, CO, USA, 1–7 September 1974; pp. 1194–1199. [Google Scholar]
  9. Gerrard, C. Rock Bolting in Theory-A Keynote Lecture. In Proceedings of the International Symposium on Rock Bolting, Abisko, Sweden, 28 August–2 September 1983; A. A. Balkema: Rotterdam, The Netherlands, 1984; pp. 3–32. [Google Scholar]
  10. Spang, K.; Egger, P. Action of fully-grouted bolts in jointed rock and factors of influence. Rock Mech. Rock Eng. 1990, 23, 201–229. [Google Scholar] [CrossRef]
  11. Chen, N.; Zhang, X.; Jiang, Q.; Feng, X.; Wei, W.; Yi, B. Shear Behavior of Rough Rock Joints Reinforced by Bolts. Int. J. Geomech. 2018, 18, 04017130. [Google Scholar] [CrossRef]
  12. Zhang, X.; Jiang, Q.; Kulatilake, P.; Xiong, F.; Yao, C. Influence of Asperity Morphology on Failure Characteristics and Shear Strength Properties of Rock Joints under Direct Shear Tests. Int. J. Geomech. 2018, 19, 04018196. [Google Scholar] [CrossRef]
  13. Pellet, F.; Egger, P. Analytical model for the mechanical behaviour of bolted rock joints subjected to shearing. Rock Mech. Rock Eng. 1996, 29, 73–97. [Google Scholar] [CrossRef]
  14. Ferrero, A.M. The shear strength of reinforced rock joints. Int. J. Rock Mech. Min. Sci. Geomech. Abstr. 1995, 32, 595–605. [Google Scholar] [CrossRef]
  15. Liu, A.Q.; Ju, W.J. Analysis of Shear Resisting Action of Full-length Anchored Bolt with Pre-stress. Coal Min. Technol. 2012, 17, 45–48. [Google Scholar]
  16. Selvadurai, A.P.S.; Yu, Q. Mechanics of a discontinuity in a geomaterial. Comput. Geotech. 2005, 32, 92–106. [Google Scholar] [CrossRef]
  17. Bahaaddini, M.; Sharrock, G.; Hebblewhite, B.K. Numerical direct shear tests to model the shear behaviour of rock joints. Comput. Geothech. 2013, 51, 101–115. [Google Scholar] [CrossRef]
  18. Zhou, Y.; Misra, A.; Shunchuan, W.U.; Zhang, X. Macro-and meso-analyses of rock joint direct shear test using particle flow thory. Chin. J. Rock Mech. Eng. 2012, 31, 1245–1256. [Google Scholar]
  19. Park, J.W.; Song, J.J. Numerical simulation of a direct shear test on a rock joint using a bonded-particle model. Int. J. Rock Mech. Min. Sci. 2009, 46, 1315–1328. [Google Scholar] [CrossRef]
  20. Zhao, T.B.; Yin, Y.C.; Tan, Y.L.; Qiu, Y. Mechanical Test of Bolt Interface and Microscopic Simulation of Transfer Law for Shear Stress. J. Min. Saf. Eng. 2011, 28, 220–224. [Google Scholar]
  21. Dugdale, D.S. Yielding of steel sheets containing slits. J. Mech. Phys. Solids 1960, 8, 100–104. [Google Scholar] [CrossRef]
  22. Barenblatt, G.I. The Mathematical Theory of Equilibrium Cracks in Brittle Fracture. Adv. Appl. Mech. 1962, 7, 55–129. [Google Scholar]
  23. Qiao, P.; Chen, Y. Cohesive fracture simulation and failure modes of FRP–concrete bonded interfaces. Theor. Appl. Fract. Mech. 2008, 49, 213–225. [Google Scholar] [CrossRef]
  24. Hawileh, R.A.; Naser, M.Z.; Abdalla, J.A. Finite element simulation of reinforced concrete beams externally strengthened with short-length CFRP plates. Compos. Part B Eng. 2013, 45, 1722–1730. [Google Scholar] [CrossRef]
  25. Cameselle-Molares, A.; Vassilopoulos, A.P.; Renart, J.; Turon, A.; Keller, T. Numerical simulation of two-dimensional in-plane crack propagation in FRP laminates. Compos. Struct. 2018, 200, 396–407. [Google Scholar] [CrossRef]
  26. Su, X.T.; Yang, Z.J.; Liu, G.H. Monte Carlo simulation of complex cohesive fracture in random heterogeneous quasi-brittle materials: A 3D study. Int. J. Solids Struct. 2010, 47, 2336–2345. [Google Scholar] [CrossRef]
  27. Xu, H.B.; Du, X.L.; Yang, Z.J. Seismic failure analysis of Koyna gravity dam using cohesive interface elements. J. Vib. Shock 2014, 33, 74–79. [Google Scholar]
  28. Barton, N.; Choubey, V. The shear strength of rock joints in theory and practice. Rock Mech. 1977, 10, 1–54. [Google Scholar] [CrossRef]
  29. Barton, N. Review of a new shear-strength criterion for rock joints. Eng. Geol. 1973, 7, 287–332. [Google Scholar] [CrossRef]
  30. Wang, G.; Zhang, Y.; Jiang, Y.; Liu, P.; Guo, Y.; Liu, J.; Ma, M.; Wang, K.; Wang, S. Shear Behaviour and Acoustic Emission Characteristics of Bolted Rock Joints with Different Roughnesses. Rock Mech. Rock Eng. 2018, 51, 1885–1906. [Google Scholar] [CrossRef]
  31. Li, Z.; Jin, A.; Wei, J. Engineering Geology; Chemical Industry Press: Beijing, China, 2008; pp. 34–36. [Google Scholar]
  32. Jing, L.; Stephansson, O.; Nordlund, E. Study of rock joints under cyclic loading conditions. Rock Mech. Rock Eng. 1993, 26, 215–232. [Google Scholar] [CrossRef]
  33. Jiang, H.; Meng, D. 3D numerical modelling of rock fracture with a hybrid finite and cohesive element method. Eng. Fract. Mech. 2018, 199, 280–293. [Google Scholar] [CrossRef]
  34. Hooputra, H.; Gese, H.; Dell, H.; Werner, H. A comprehensive failure model for crashworthiness simulation of aluminium extrusions. Int. J. Crashworthiness 2004, 9, 449–464. [Google Scholar] [CrossRef]
Figure 1. Traction separation criteria. (a) Normal mode and (b) Shear mode.
Applsci 10 00062 g001
Figure 2. Standard Joint Roughness Coefficient (JRC) Graph (Modified after Barton [15,16]).
Applsci 10 00062 g002
Figure 3. Cylinder and shear specimen dies.
Applsci 10 00062 g003
Figure 4. Experimental preparation. (a) Bolt types and (b) Specimen.
Applsci 10 00062 g004
Figure 5. Uniaxial compression experiment apparatus.
Applsci 10 00062 g005
Figure 6. Mohr’s circles obtained from triaxial compression experiments.
Applsci 10 00062 g006
Figure 7. The shear experimental apparatus.
Applsci 10 00062 g007
Figure 8. Experiment results of specimens with different bolts and different joint roughness.
Applsci 10 00062 g008
Figure 9. Comparison of shear strength of specimens bolted with different roughness under the same bolted mode. (a) (S1-S3)-MG1; (b) (S1-S3)-MG2; (c) (S1-S3)-MG3; (d) Relationship between JRC and shear strength.
Applsci 10 00062 g009
Figure 10. Comparison of shear strength of three bolt materials under the same roughness. (a) S1-(MG1-MG3); (b) S2-(MG1-MG3); (c) S3-(MG1-MG3).
Applsci 10 00062 g010aApplsci 10 00062 g010b
Figure 11. Numerical model of the cylindrical specimen. (a) Solid element and (b) Cohesive elements insertion.
Applsci 10 00062 g011
Figure 12. Comparison of failure modes between simulated and experimental specimens. (a) Simulation result and (b) experimental results.
Applsci 10 00062 g012
Figure 13. Numerical model for the shear experiment. (a) boundaries and (b) cohesive elements insertion.
Applsci 10 00062 g013
Figure 14. Macro comparison of experiment and simulation results. (a) S1-MG1 Comparison of experimental and simulation results; (b) S2-MG1 Comparison of experimental and simulation results; (c) S3-MG1 Comparison of experimental and simulation results.
Applsci 10 00062 g014
Figure 15. Comparison of simulation and experimental results. (a) S1-MG1; (b) S2-MG1; (c) S3-MG1.
Applsci 10 00062 g015
Figure 16. Two meshes with different element size and cohesive elements (a) Fine mesh (Node spacing: 1 mm); and (b) Coarse mesh (Node spacing: 2 mm).
Applsci 10 00062 g016
Figure 17. Comparison the results of different mesh (a) Crack evolution (fine mesh); (b) Crack evolution (coarse mesh); (c) Shear strength comparison.
Applsci 10 00062 g017
Figure 18. Shear stress of bolt (S1-MG1) as a function of distance from the joint.
Applsci 10 00062 g018
Figure 19. Normal stress contour of the jointed rock.
Applsci 10 00062 g019
Figure 20. Axial stress of bolt under different shear displacements.
Applsci 10 00062 g020
Figure 21. Comparison of axial stress of three bolted modes with 2 mm shear displacement.
Applsci 10 00062 g021
Figure 22. Numerical results of shearing process of jointed rock with three different bolts (a) Shearing process with bolt of 25% elongation; (b) Shearing process with bolt of 15% elongation; (c) Shearing process with bolt of 5% elongation.
Applsci 10 00062 g022
Table 1. Material and elongation for three different bolts.
ParametersBolted Mode
MG1MG2MG3
Materials1060 aluminum alloy6063 aluminum alloyLY12 aluminum alloy
Elongation25%15%5%
Table 2. Experimental matrix.
Roughness LabelJRCBolt ElongationBolted Mode DesignationNormal Stress (MPa)Shear Rate (mm/min)Jointed Rock Labeling
S12–425%MG1100.06S1-MG1
S210–1215%MG2100.06S2-MG2
S318–205%MG3100.06S3-MG3
S12–415%MG2100.06S1-MG2
S210–125%MG3100.06S2-MG3
S318–2025%MG1100.06S3-MG1
S12–45%MG3100.06S1-MG3
S210–1225%MG1100.06S2-MG1
S318–2015%MG2100.06S3-MG2
Table 3. Physical and mechanical parameters of rock-like specimens.
Material TypeDensity kg/m3Modulus/GPaUniaxial Compressive Strength/MPaPoisson’s RatioCohesion/MPaInternal Friction Angle/°
rock-like Specimens235032.04101.650.1225.4435.88
Granite2500~284029.82~61.08100~2500.17~0.3614~5045~60
Table 4. Summary of peak shear strength.
Joint Surface LabelingPeak Shear Strength (MPa)
MG1MG2MG3
S111.6112.0712.06
S213.8114.7914.21
S314.6515.0314.53
Table 5. Mechanical parameters used in the numerical simulation.
Element TypeDensity kg/m3Young’s Modulus (GPa)Stiffness (GPa/m)Poisson’s RatioDamage Stress/MPaFracture Energy (N/mm)
Cohesive element2350/179000.1225.440.18
Solid element235032.04////
Table 6. Mechanical parameters of bolt.
ParametersBolted Mode
MG1MG2MG3
Material1060 Aluminum alloy6063 Aluminum alloyLY12 Aluminum alloy
Tensile strength σbo (MPa)95~125250410
Equivalent strength σb1 (MPa)224272
Table 7. Comparison of test and simulation results.
Joint TypePeak Shear Strength (MPa)
TestSimulationDifference
S1-MG111.6112.467.3%
S2-MG113.8115.7013.7%
S3-MG114.6515.968.9%
S1-MG111.6112.467.3%
S1-MG212.0713.148.9%
S1-MG312.0614.7922.6%

