1. Introduction
Water distribution systems (WDSs) are one of the fundamental social factors for reliably supplying the water required for all human activities in modern society. The main purpose of WDSs is to provide sufficient amounts of water with excellent quality at sufficient pressure. To satisfy these objectives, research has been performed for optimal operation/maintenance and design. The optimal design of WDSs started with a cost-effective objective while satisfying the hydraulic and water quality constraints. Early WDSs were designed by trial and error based on the experience of designers. However, such designs could not guarantee optimal or near-optimal solutions, because they overly relied on professional experience. Subsequently, the mathematical design algorithms such as linear programming [
1], dynamic programming [
2], and non-linear programming [
3] have been explored for achieving optimal cost design. Mathematical optimization algorithms are easy to apply in small-scale systems in which the elements of all systems can be easily expressed in equations. However, it is not easy to apply in real-world systems [
4]. This is relevant because the governing equations of WDSs (i.e., the energy and conservation of mass equations) are characterized by non-linearity for the hydraulic analysis. In the case of distribution networks characterized by the loop form, the flow direction through each pipe is variable. Taken together, an increase in the number of joint points and pipes exponentially increases the range of possible solutions. Therefore, there are limitations for optimal cost design using mathematical equations. For these reasons, a metaheuristic algorithm was developed and applied in WDSs design to overcome the drawback of previous approaches.
There are examples of metaheuristic techniques being applied in the optimal cost design of water distribution networks, such as genetic algorithm (GA) [
5,
6], simulated annealing (SA) [
7], ant colony optimization (ACO) [
8], and harmony search (HS) [
9]. Since these algorithms address the non-linearity and complexity of designing WDSs by using probability-based approaches, they have advantages over mathematical design methods. However, the application of a metaheuristic algorithm for the optimal design of WDSs has limitations in the real world. The construction of real-world WDSs considers the conditions of the construction site and the efficiency of construction (i.e., pipe continuity and abnormal conditions). On the other hand, the design using the metaheuristic algorithm generally determines the optimal pipe diameter set for minimizing construction cost under satisfactory hydraulic and water quality regulations. Yoo et al. [
10] concluded that when the optimal cost design of real-world WDSs is used by the metaheuristic algorithms, it does not satisfy the pipe size continuity of pipes, and its practical applicability declines. Moreover, they emphasized that if the optimal cost design is performed with the consideration of hydraulic constraints such as nodal water pressure and flow rate in pipes, the neighbor pipe diameter may have abnormal unevenness (e.g., a concave–convex pattern) of flow direction. They defined the pattern of the neighbor pipe diameter as a pipe continuity. If the design did not satisfy the pipe size continuity, it had low practical applicability for the WDSs construction [
11]. Therefore, these studies improved the drawback of the design approach that used the metaheuristic optimization algorithm, which determines the abnormal concave–convex pipe diameter pattern based on the objective function, e.g., minimum cost. These studies controlled the pipe size to smoothly increase and decrease, thereby obviating the abnormal unevenness pattern.
Due to increasing urbanization and population, the previous system’s capacity was exceeded, and even a minor failure in the system caused serious damage for both water users and the system. In addition, the red water problem in Incheon (2019.05, South Korea) caused approximately 10 billion KRW worth of material and serviceability damage to water users. For these reasons, the various design factors (e.g., system reliability, resilience, robustness, redundancy, energy consumption, and environmental factors) should be considered simultaneously. Therefore, practical WDSs design approaches should consider multi-objective optimization considering not only cost but also reliability, especially against accidents (shutdown of pipes and pumps) and uncertainty in spatial and temporal demand forecasts [
12,
13,
14].
Jung et al. [
15] confirmed the use of “robustness” (i.e., the coefficient of variation of stochastic pressures) to enhance the minimum cost design approach. This study performed consistently under uncertain failure conditions (i.e., pipe burst and fire flow) that were not considered in the design phase for finding best pipe diameter set. Giustolisi et al. [
16] were the first to develop the robustness indicator, which explicitly incorporates variations in stochastic pressure. It was maximized while minimizing the total system cost in their WDSs design model. The model was calculated by the residual between the average pressure head and minimum pressure head divided by the standard deviation of stochastic pressure heads. Therefore, the proposed multi-objective WDSs design seeks a design solution with high average pressure and low-pressure variations to maximize. Jung et al. [
13] proposed a robustness-constrained WDSs design and operation model to minimize total pump construction and operation costs with a constraint on the level of operational reliability. In their study, the system operational robustness measure was defined as the maximum value of nodal daily maximum pressure differences in the system. This was converted to dynamic system performance under unsteady conditions. The study confirmed that constraining the pressure variations in a day led to the installation of a greater number of small pumps than the least-cost approach did, in which a few large pumps were constructed. A non-linear trade-off relationship was identified between the daily maximum pressure difference and total pump construction and operation costs. Choi et al. [
17] applied the optimal valve installation to practical WDSs design. They developed a valve installation method that prioritizes segments based on segment total demand and the existence of important public facilities (e.g., hospital, elderly center, fire station), and selects the segments where valves should be installed to minimize the maximum undelivered segment demand under pipe break conditions. According to existing research into practical WDSs design, the design approach should reflect the construction condition (i.e., pipe continuity) and consider various design factors such as system performance measure.
This study improves upon past optimal WDSs design approaches, which considered pipe continuity. To accomplish this objective, this study proposes an improvement of the practical design technique with pipe connectivity constraints for efficient WDSs construction under a multi-objective optimization framework. To validate the proposed model, the approach is evaluated using differently configured WDSs benchmarking problems (i.e., the Hanoi and Fossolo networks) and real-world WDSs. The application of this practical design technique, which considers pipe continuity and multiple design factors, can reduce the gap between the real-world and theoretical design by accounting for construction conditions and abnormal situations.
2. Practical Design of Water Distribution Systems
This study proposes a practical approach using pipe continuity and a multi-objective optimal design approach. The traditional WDSs designs using metaheuristic optimization algorithms consider the objective function such as minimum construction cost or maximum system reliability finding the best pipe diameter set satisfying system constraints. During finding the optimal pipe diameter set, these approaches could not be considered the pipe continuity. For this reason, the design solution by the metaheuristic optimization algorithm cannot be a reasonable design solution due to the concave–convex pattern sometimes generated. However, the real-world design considers the pipe continuity to reduce head loss, pipe breakage probability, and system maintenance. Therefore, the future design approach should consider the practical point such as pipe continuity and consider not only construction cost but also system reliability, resilience, etc. simultaneously. The practical WDSs design approach proposed in this study improves these drawbacks of traditional design approaches. Chapter 2 presents the pipe continuity approach, a multi-objective optimization method for WDSs design, and model formulation.
2.1. Pipe Continuity Search Approach
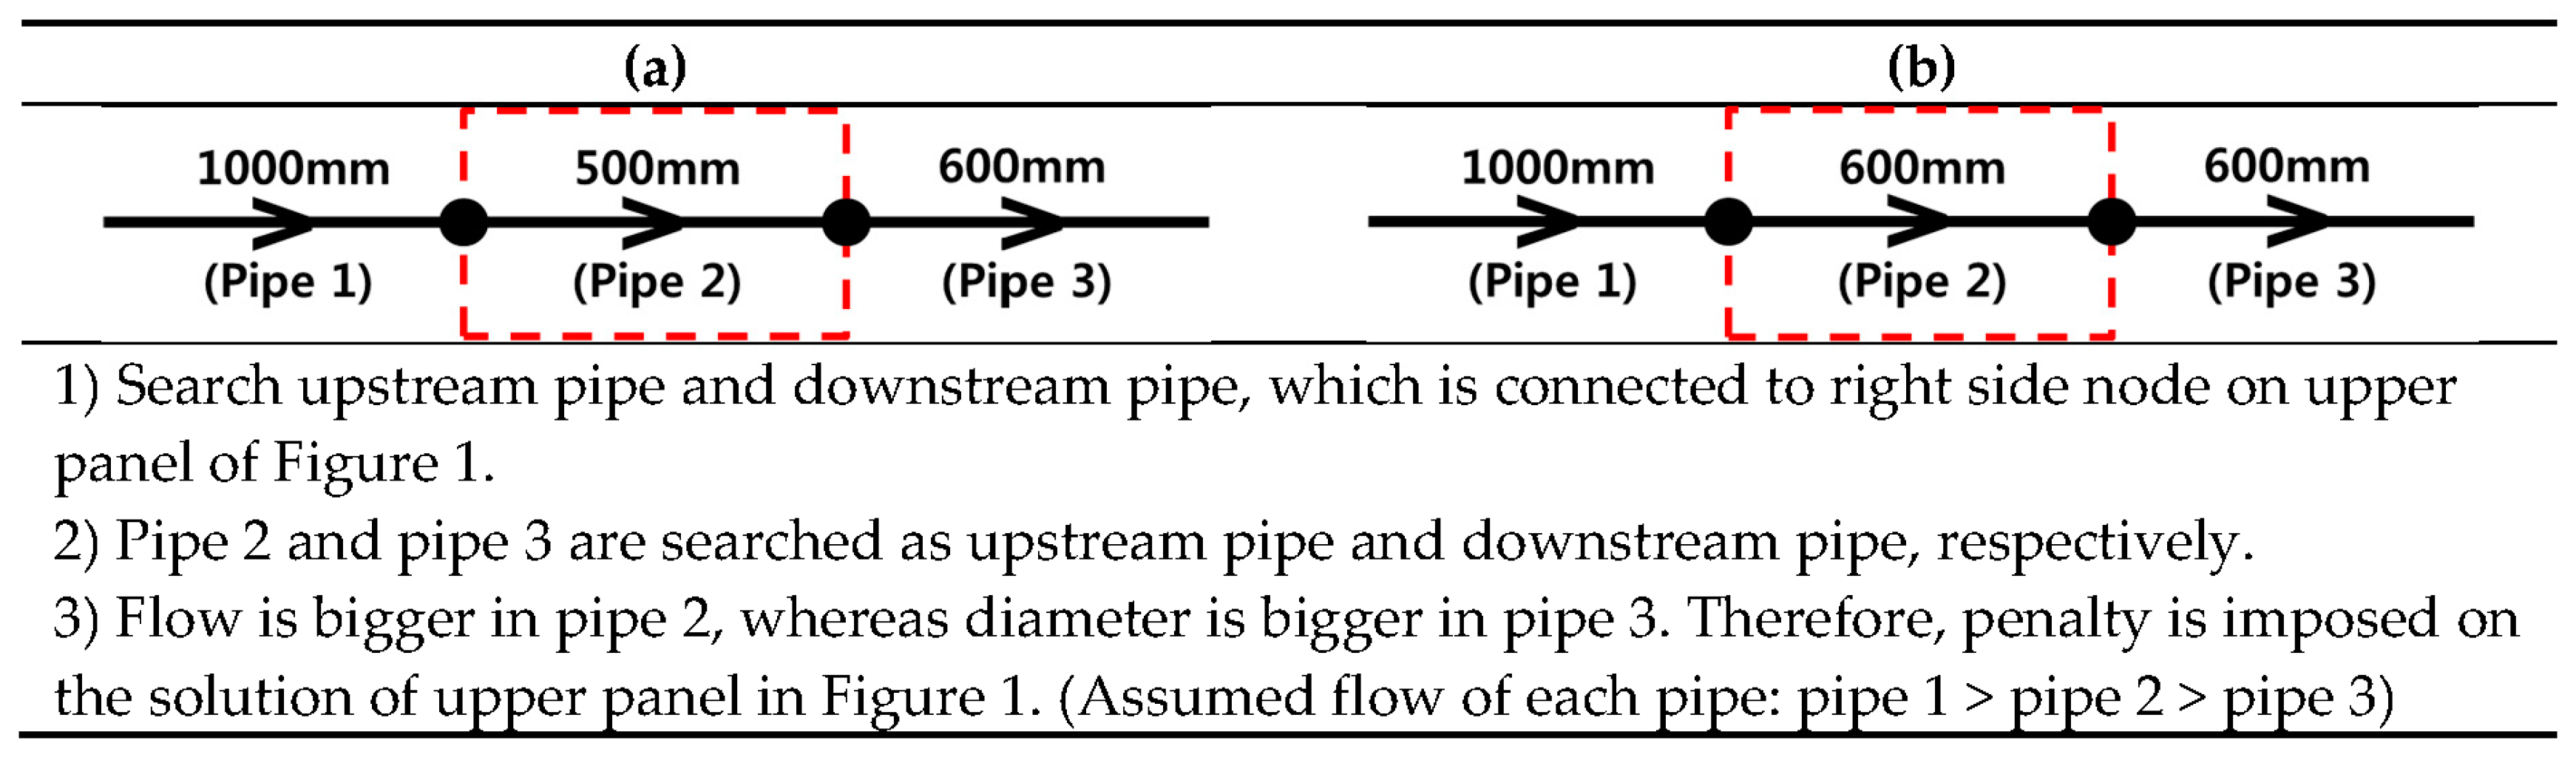
The optimal design of WDSs using a metaheuristic algorithm resulted in low efficiency real-world WDSs construction, since the neighbor pipe diameter size had abnormal unevenness (e.g., concave–convex pattern) of flow direction. Therefore, a previous study proposed a pipe continuity search approach to improve the abnormal unevenness [
10]. In the existing study, the pipe size continuity search algorithm searched all the possible flow paths in the distribution network, and the pipe size was gradually decreased on the basis of the flow direction of water, as shown in
Figure 1. The existing approaches had a rule that the diameter of the downstream pipe should be equal or smaller than that of the upstream pipe. Therefore,
Figure 1b will come up with the same diameter set, which is highlighted with the red dotted line in
Figure 1.
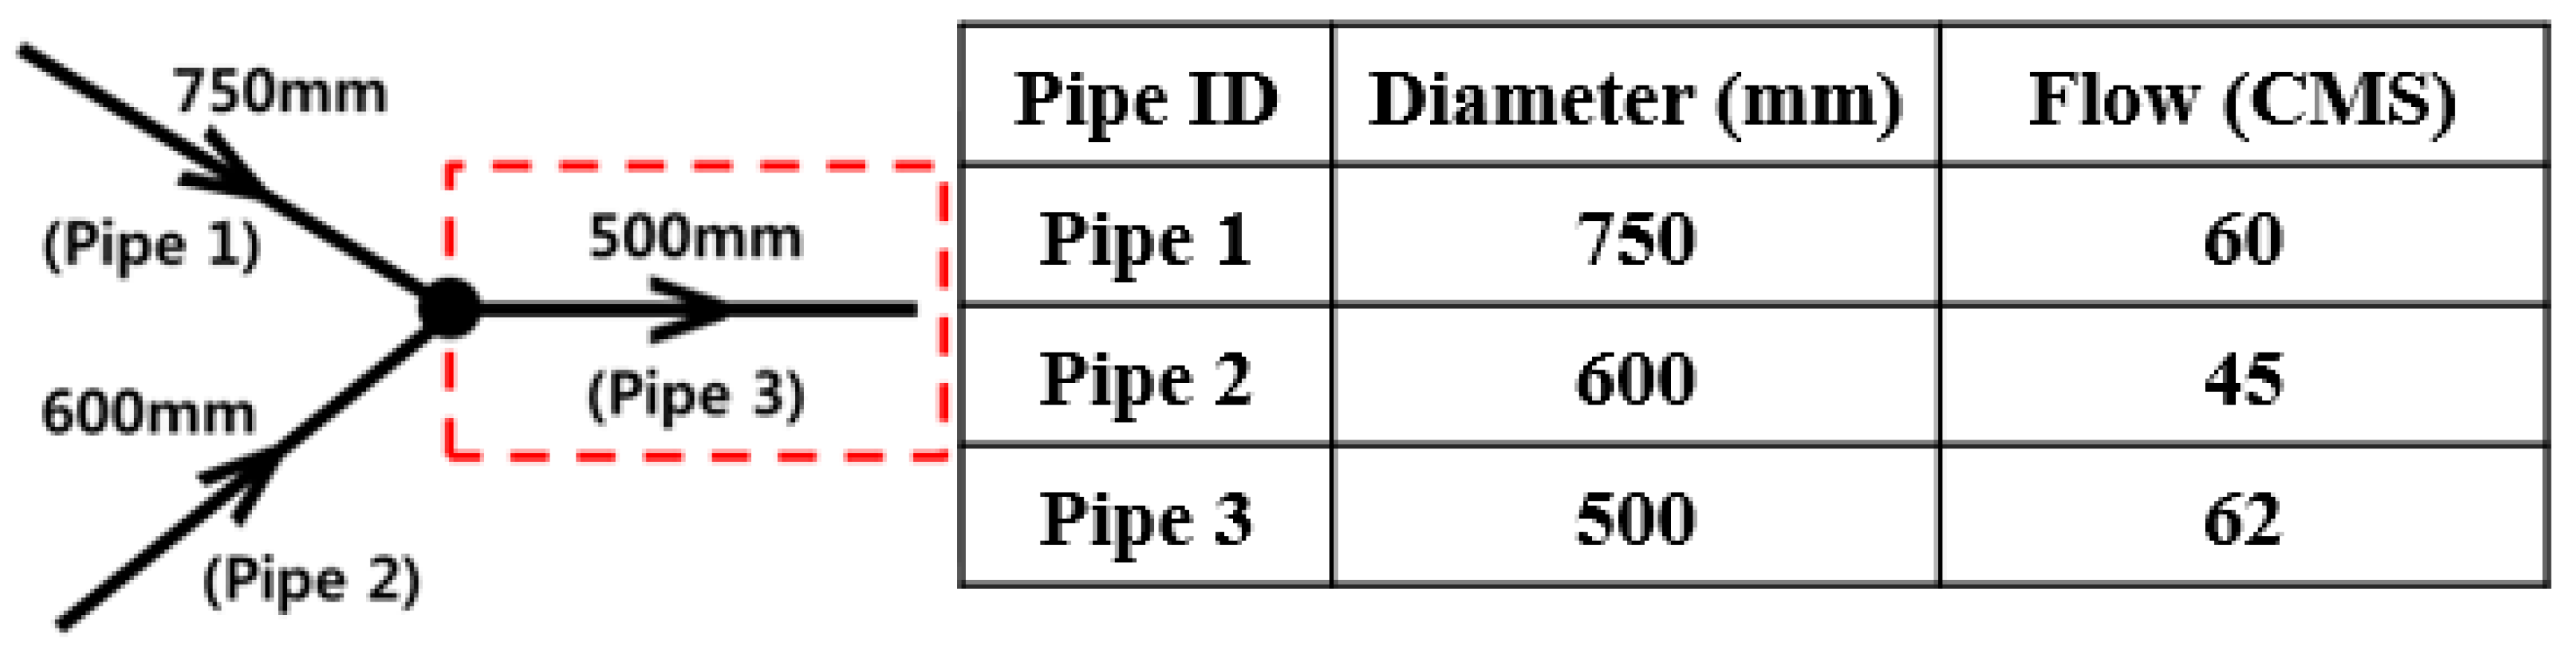
However, these approaches have limitations. When three or more pipes meet at a single node, the pipe path carrying the relatively larger flow meets the pipe with a smaller diameter. In other words, the flow and pipe size continuity cannot be reasonably determined.
Figure 2 shows an example of the limitation for the existing pipe continuity search method. Based on the previous standard, the continuity of example network is that the pipe diameter of the route for Pipe 1–Pipe 3 and Pipe 2–Pipe 3 is smaller or the same as the one following the flow direction. However, this approach cannot be considered for the flow quantity of each pipe. In this case, since Pipe 3 has the largest flow, the size of Pipe 3 needs to larger than Pipe 2 at the confluence point.
In addition, as existing pipe size continuity search algorithms search all flow paths in the distribution network, they takes relatively more time. Since the number of possible flow paths exponentially increases with the increasing size of water distribution network systems, the applicability in actual water distribution networks declines.
The proposed approach addresses the disadvantages of existing continuity search algorithms to reduce computation time and to reasonably consider pipe size continuity based on flow at the confluence point where three or more pipes meet. Existing continuity search algorithms explore all the possible flow paths between two selected nodes within the WDSs, determine whether pipe size is gradually reduced on the basis of flow directions of water, and impose penalties on designs with increasing pipe sizes. Designs with penalties are replaced by other designs during the process of optimization.
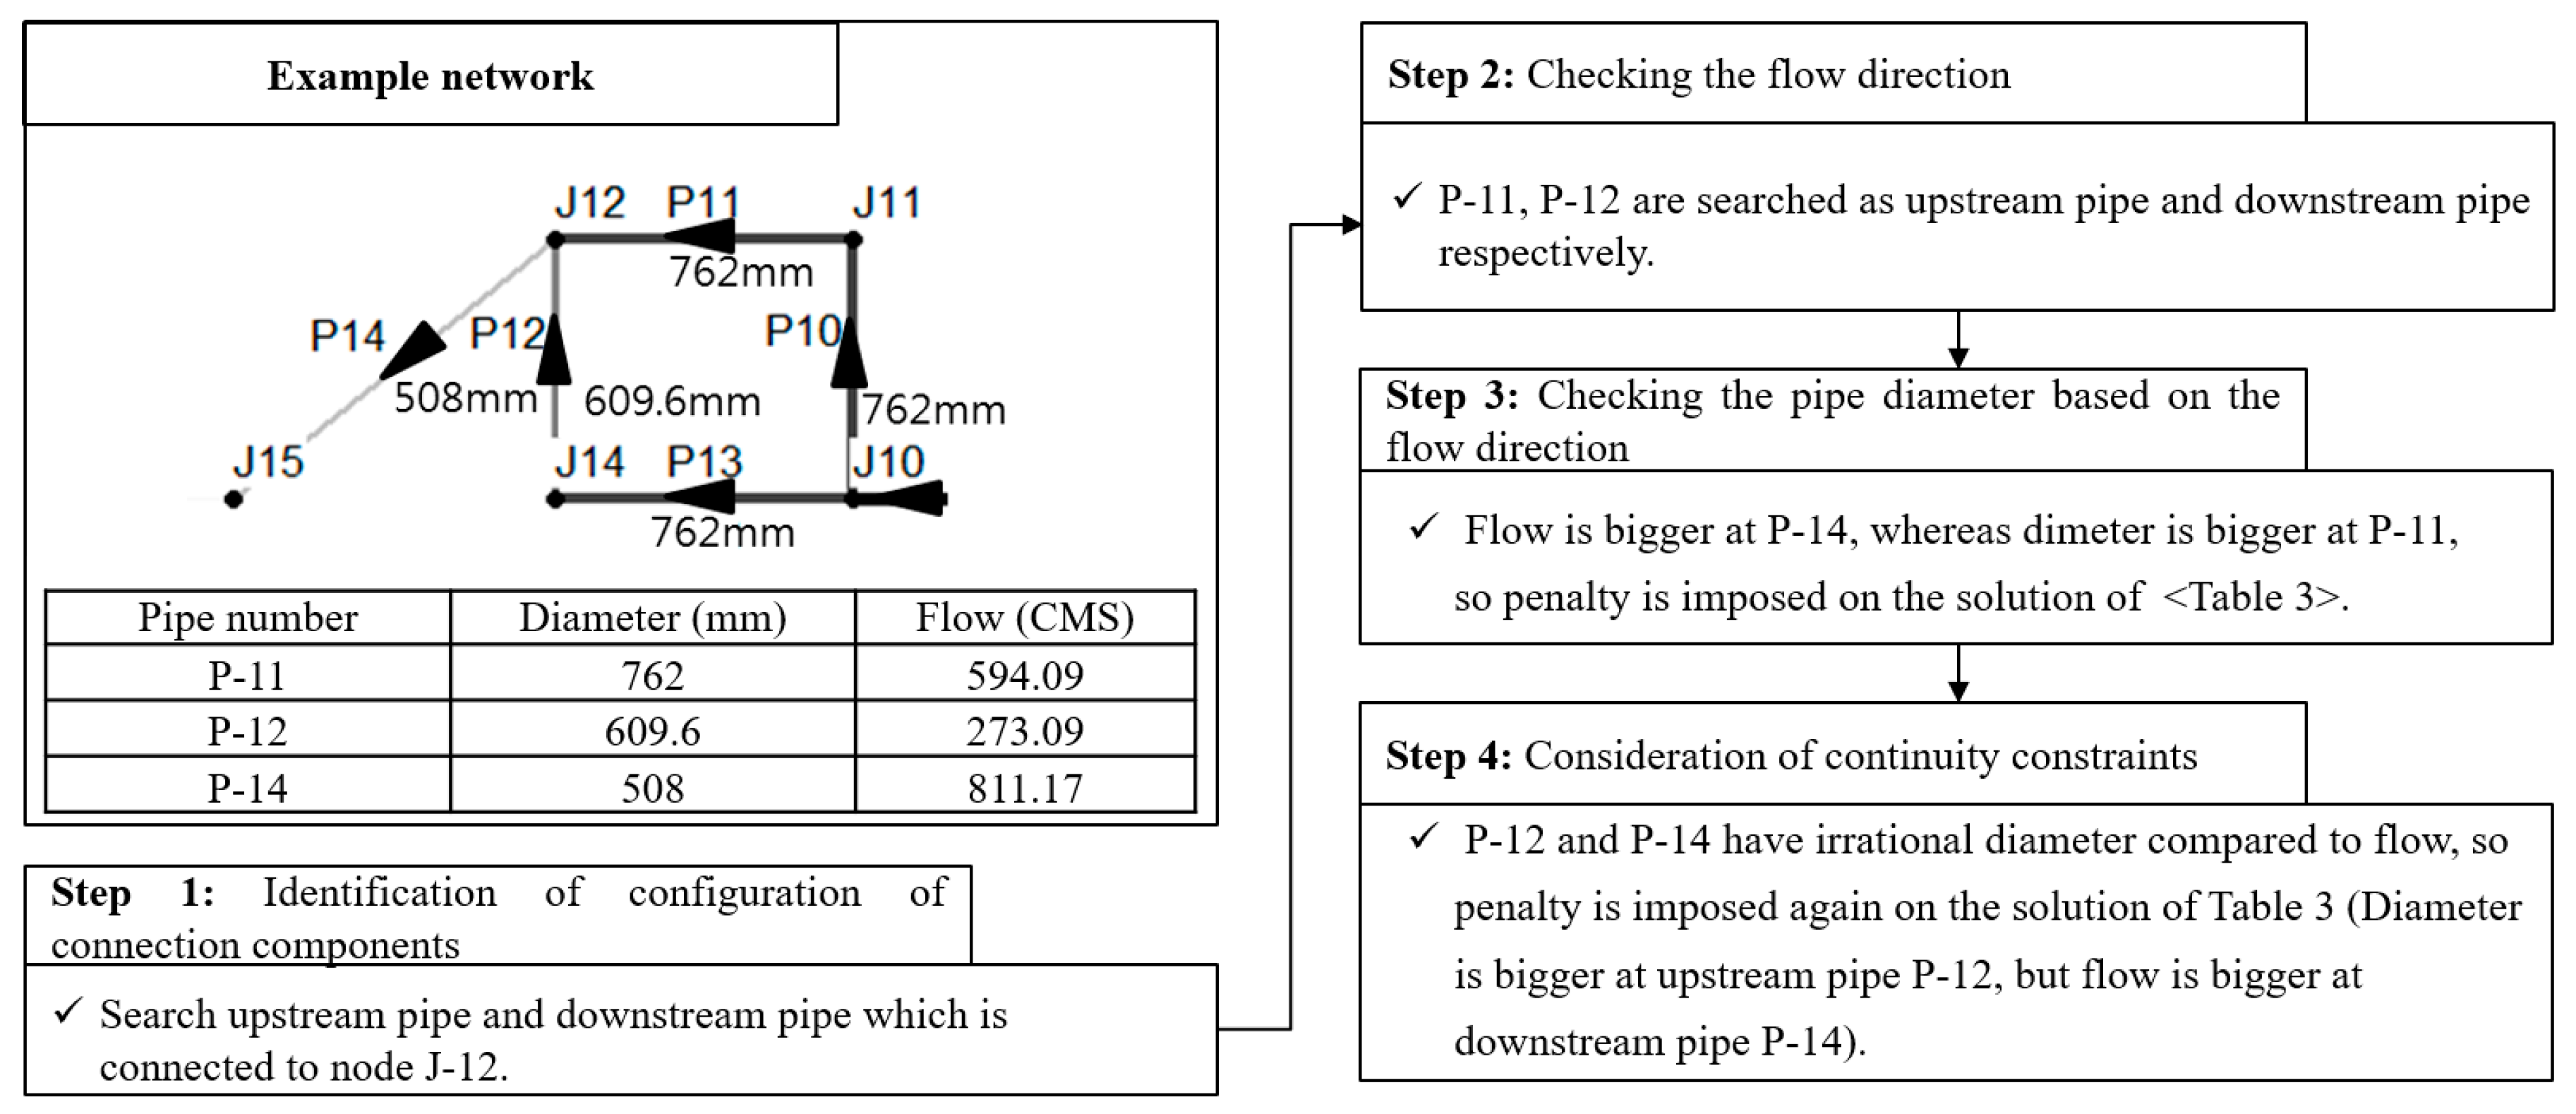
However, the proposed continuity search algorithm identifies two pipe paths connected at one selected node in the WDSs. From the node, pipes for water inflow and outflow are defined as upstream and downstream, respectively. It compares the flow rate of upstream and downstream pipes and determines whether pipe sizes are appropriate for the flow rates. If the pipe size is not appropriate for the flow rates, it is deemed to be an unsatisfactory design that does not satisfy pipe size continuity, and it is penalized. It will be eliminated during the process of optimization. The procedure can be detailed as shown in
Figure 3.
If the pipe size continuity is searched in the proposed approach, the areas that are redundantly searched by existing algorithms are substantially reduced; therefore, the time efficiency is improved. In addition, as pipe size and flow rate are simultaneously considered when the pipe size continuity is searched, the pipe size continuity can be reasonably searched in the relatively complex joint point.
Table 1 itemizes the differences in the existing pipe size continuity search algorithm and the pipe size continuity search algorithm in this study.
2.2. Multi-Objective Optimization Framework for Water Distribution Systems Design
This study applies harmony search [
9] as an optimization technique, and pipe construction cost and system resilience are considered as design objectives with a trade-off relationship. Early WDSs designs using the optimization technique considered only the network construction cost by changing pipe diameter. However, the designs that considered minimum cost as a design factor were vulnerable to uncertain future conditions. Moreover, since current water users desire a stable and reliable water supply, the approach using the multi-objective optimization was proposed in the WDSs design. In addition, the boundary pressure condition and the pipe continuity approach proposed in this study are considered as design constraints for a practical WDSs design. The following subsections detail the objective functions, constraints, penalty approach, algorithm formulation, and design performance evaluation.
2.2.1. Objective Functions
The objective of the first objective function in WDSs design is to minimize construction cost. The cost-estimation equation for network design proposed by Shamir and Howard [
18] is applied. This cost can be estimated by multiplying the cost of each commercial pipe diameter by the length of each pipe. Therefore, the sum of the cost of all pipes in the network is given by Equation (1).
where
C(Di) is the cost function of the
i-th pipe per unit length (m) of each pipe diameter, and
Li is the length (m) of the
i-th pipe.
Di is the pipe diameter (mm) of the
i-th pipe.
PN is the total number of pipes.
represents the penalty function; if the solution cannot satisfy for the constraints, the penalty function is applied.
The secondary objective function represents system resilience [
19], which defines the system’s capability to create foresight, recognize, anticipate, and defend against changing risks, before adverse consequences occur. Various resilience indicators have been proposed after such an indicator was first developed by Todini [
19]. It was expressed as a surrogate measure for hydraulic benefits. The index is based on the concept that the total input power into a network consists of the power dissipated in the network and the power delivered at demand nodes. Moreover, less power consumed internally to overcome friction results in more surplus power at demand nodes; therefore, it has the ability to counter failure conditions. The system resilience index calculated by Equation (2) was in the range from 0 to 1, where a higher index value indicates better resilience.
where
N,
NR, and
NP are the number of nodes, reservoirs, and pumps, respectively,
hj is a head at node
j,
hj* is the minimum required head at node
j,
HK is the water level of reservoir
K,
QK is water flow of reservoir
K, and
Pui is the power of pump
i.
2.2.2. Hydraulic Constraints
Hydraulic constraints such as boundary nodal pressure and pipe velocity are applied to aid in the practical design of WDSs. If each nodal pressure or the pipe velocity at each pipe does not satisfy the minimum requirement, then a large penalty value such as Equation (3) is added to each of the objective function values. The main purpose of constant α included in the penalty function is to impose the penalty in proportion to the extent of deviation from hydraulic constraints. The constant β of penalty function plays a role to eliminate the design with negligible deviation from hydraulic constraints by imposing the penalty. Constants α and β are variously applied depending on the average design cost of WDSs. Approximately 10
7, 10
8 are used.
where
hi is the pressure head at node
i (m),
vj is the water velocity at pipe
j (m/s),
hmin and
hmax are the minimum and maximum pressure heads (m), respectively,
vmin and
vmax are the minimum and maximum water velocity (m/s), respectively, and
α and
β are the penalty constants.
2.3. Metaheuristic Optimization Algorithm
This study is applied to multi-objective harmony search (MOHS) [
14] to consider the construction cost and system resilience as design factors simultaneously. MOHS was developed by combining harmony search, non-dominated sorting [
20], and the crowding distance concept [
21]. Harmony search is an optimization algorithm that can be explained in terms of the improvisation process of a musician. The search for the optimum harmony in music is equivalent to the optimum solution. When many musicians play their instruments, the various sounds generate a single harmony. A musician may gradually change to another suitable sequence and finally find an aesthetically pleasing harmony. In other words, the HS algorithm is an approach that finds the optimum harmony in music. In the HS, four parameters are used to search for the optimum solution (i.e., harmony memory (HM), harmony memory considering rate(HMCR), pitch adjust rate (PAR) and bandwitdth(Bw)), and these parameters are assigned a constant value. A search space for the instrument is limited to a memory space called harmony memory (HM), where the HM size (HMS) represents the maximum number of harmonies that can be saved. The main operators of HS are the random selection (RS), memory consideration (MC), and pitch adjustment (PA), serving to extract better solutions from the harmony memory. The main operator formulation is described by Equations (4) and (5).
After memory consideration,
where
xiNew denotes a new decision variable, and
xiLower,
xiUpper are the boundary conditions of the decision variables.
Rnd is the uniform random value, and
Bw is the bandwidth, HMCR, PAR, Bw are parameters for optimization.
3. Model Formulation
This study develops and applies a practical WDSs design approach within the multi-objective framework. For this objective, this study aims to improve time efficiency and reasonably consider pipe continuity based on flow at the confluence point. The pseudocode to solve the problems is shown in
Table 2. It describes the process of optimal cost design of WDSs by applying a metaheuristic algorithm and pipe size continuity search algorithm of this study.
3.1. Performance Measures
To quantitatively determine the design performance from a practical approach, the individual simulation is repeated 50 times, with each simulation using more than 10,000 iterations for each problem. The number of individuals run is determined by the sensitivity analysis increasing the number of runs (e.g., 5, 10, 20, 30, 50, 70, 100). Since the optimal design of WDSs using the metaheuristic has an uncertainty of the quality of solutions, for objective performance evaluation, the sensitivity analysis is necessary. As a result of sensitivity analysis, at least 50 run times are needed to show stable performance, and if the individual run is less than 50 times, the design generated by the optimization has a large variance. For this reason, this study selected the number of individual runs as 50 times, and the final solution is taken as a mean value from 50 run times, rather than the accidental best solution to show the stable and objective results.
In addition, the simulation times also are tracked for evaluating the performance and running speed simultaneously. To verify the proposed approach, this study applies the pipe continuity index (PCI), which evaluates the number that satisfies for the pipe size continuity. PCI is calculated using the rate between the total number of pipes and the number of pipes satisfying the pipe size continuity constraint by following Equation (6). When pipe size continuity is satisfied perfectly in a WDSs design, it becomes 1. On the other hand, if pipe size continuity is not satisfied, the index decreases relatively. How many pipes have a pipe size continuity problem? When all pipes violate the continuity constraint, the index would be as 0.
where
NPcon is the number of pipes satisfying the pipe size continuity and
NPtotal is the total number of pipes.
3.2. Study Network
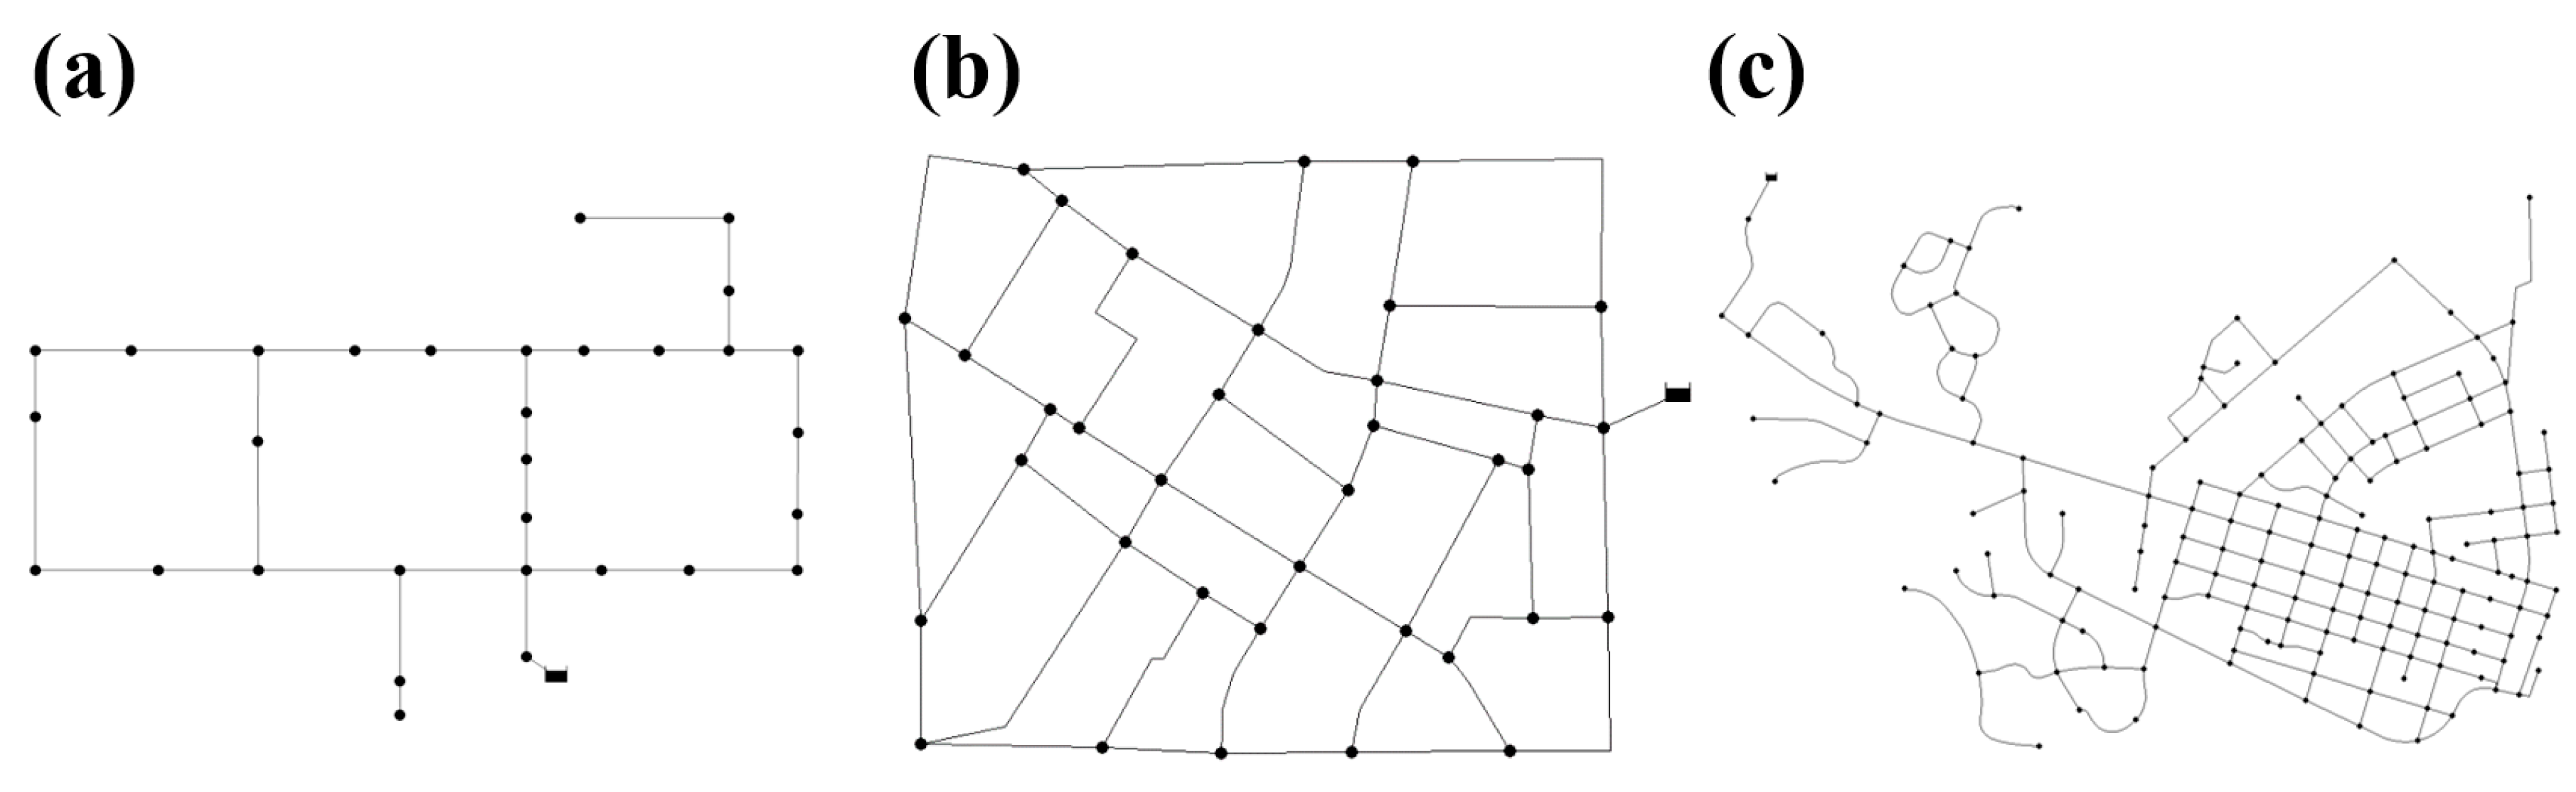
To verify the proposed practical WDSs design techniques, this study applies the three benchmark WDSs (i.e., Hanoi, Fossolo, and Cycling networks) considering single- and multi-objective frameworks. Among these applied networks, Hanoi and Fossolo networks consider a single-objective optimization for comparison with the existing technique [
10], where the minimum construction cost is used as an objective function. For the Cycling network, the multi-objective optimization problems consider the minimum construction cost and maximum system resilience simultaneously. The applied WDSs design problems apply the pipe continuity constraint and hydraulic constraints such as nodal pressure.
Figure 4 and
Table 3 provide descriptions of the study networks.
Hanoi networks are loop-type WDSs, which consist of one water source, 31 nodes, and 34 pipes. They were first introduced by Fujiwara and Khang [
22]. The Hazen–Williams (HW) roughness coefficient is 130 for all pipes. The minimum required pressure is 30 m. A total of six commercial pipe diameters ranging from 304.8 mm to 1016 mm are available. In the existing studies, the known global optimal solution for the Hanoi network cost
$6,081,088, but it contained the areas that did not satisfy pipe size continuity [
10]. To compare the computation times between the proposed algorithm and existing algorithm, we applied the proposed methodology in the Hanoi network mainly used in studies related to the optimal cost design of WDSs. The Fossolo network [
23] consists of one water source, 36 nodes, and 58 pipes. The hydraulic constraints include the minimum nodal water pressure at 40 m and the boundary condition of pipe velocity approximately 0–1 m/s. The optimization was independently performed 50 times by applying the same constraint conditions of both the existing algorithm and the proposed algorithm in this study. The Cycling network is composed of nine closed loops, one reservoir, 165 nodes, and 242 pipes. The total length of the network is 65.38 km. A total of 10 commercial pipe diameters are used. The water pressure at each node in the pipeline denotes the hydraulic constraints. The constraints are 28 m for the minimum pressure at each node. A total of 500,000 iterations was set as the termination condition for each network.
4. Application and Results
This section presents the results of the computational experiments obtained using the practical WDSs design approach for the pipe size continuity of the three WDSs introduced in the previous section. For the hydraulic analysis, the Application for Modeling Drinking Water Distribution Systems (EPANET) [
24] hydraulic solver was used to calculate the hydraulics and check the necessary hydraulic constraints. This model contains a flow conservation method and various types of head loss formulations (i.e., Hazen–Williams, Darcy–Weisbach, and Chez–Manning equations). Combining this model with the proposed WDSs design approach, the hydraulic analysis results (i.e., the nodal pressure and pipe velocity) and flow direction (i.e., upstream and downstream) were checked as design constraints. The simulation was performed on a Windows 7 Home Premium K 64-bit OS, Intel i7 CPU 3.40 GHz processor and 8.00 GB RAM computer. The parameters of the optimization algorithm are applied through the sensitivity analysis. The HMCR is varied from 0.7 to 0.95, and the PAR is varied from 0.05 to 0.3 in 0.05 intervals. Therefore, a total of 36 parameter sets are used for 10 independent optimization runs. The 10 results for each test problem and optimization algorithm are compared using performance and the best parameter set is decided. For the same comparison, the parameters and penalty function are the same in the results applying the existing study and the proposed continuity approach.
First, design problems i.e., the Hanoi network is used to compare the performance of the proposed approach and the existing study [
10] on optimal design cost and computation time for each standard iteration number. The Fossolo network shows continuity at the confluence point, which is an improvement of the proposed continuity approach. This network is performed in a single-objective optimization framework condition such as the Hanoi network. The Cycling network is applied to the multi-objective optimization framework. The simulation results compare the pipe diameter distribution and network configuration for the proposed technique and existing approach. The following chapter shows the simulation results for these three applied WDSs.
4.1. Hanoi Network
Optimal cost design is performed considering pipe size continuity in the Hanoi network. As a result, the design cost using the proposed pipe size continuity approach is
$6,093,181, which is the same optimal cost design from the existing study. However, the average computation time for the optimal cost design is lowered by approximately 83%. The results of comparing the computation time depending on the iteration number between the existing pipe continuity approach and the proposed algorithm of this study are shown in
Table 4.
The existing approach [
10] requires a relatively long time to derive the design considering pipe size continuity. The reason is that the approach searched all of the flow paths in WDSs and determined whether each path satisfied continuity. However, since the proposed technique in this study is repeatedly performed to examine the pipe size continuity of two adjacent pipes around one node, it takes a short time compared to the existing approach. In other words, the time spent for the continuity search is improved, as it substantially reduced the redundant time to examine the pipe size continuity in the existing algorithm. As the Hanoi network consisted of one water source, 31 nodes, and 34 pipes, it can be categorized to relatively small-scale distribution networks. Since the existing pipe continuity approach finds all the flow paths and checks the continuity, when the scale of distribution networks is enlarged with an increasing number of nodes and pipes, the time for calculation is exponentially increased. However, the proposed technique reduced the redundant research process and considered the pipe continuity at each joint simultaneously. Therefore, the optimal design solutions after applying each of the continuity approaches showed the same, but the average computation time spent to design the Hanoi network was lower by 83% compared to the existing approach (when the number of iterations was 500,000, approximately 13 h were reduced). Therefore, it is expected to substantially shorten the search time with the even larger scale of WDSs.
4.2. Fossolo Network
Optimal cost design was performed considering pipe size continuity in a Fossolo network. The results of the existing algorithm were compared to the results from the algorithm of this study. As a result of the pipe size continuity search algorithm in this study, we derived the optimal cost design satisfying pipe size continuity in which reasonable pipe sizes were placed at various joint points in the Fossolo network with consideration of flow. The average computation time for the optimal cost design was reduced by approximately 87% when compared to the existing algorithm.
The results regarding the design costs and the average computation time in each algorithm applied in the Fossolo network are shown in
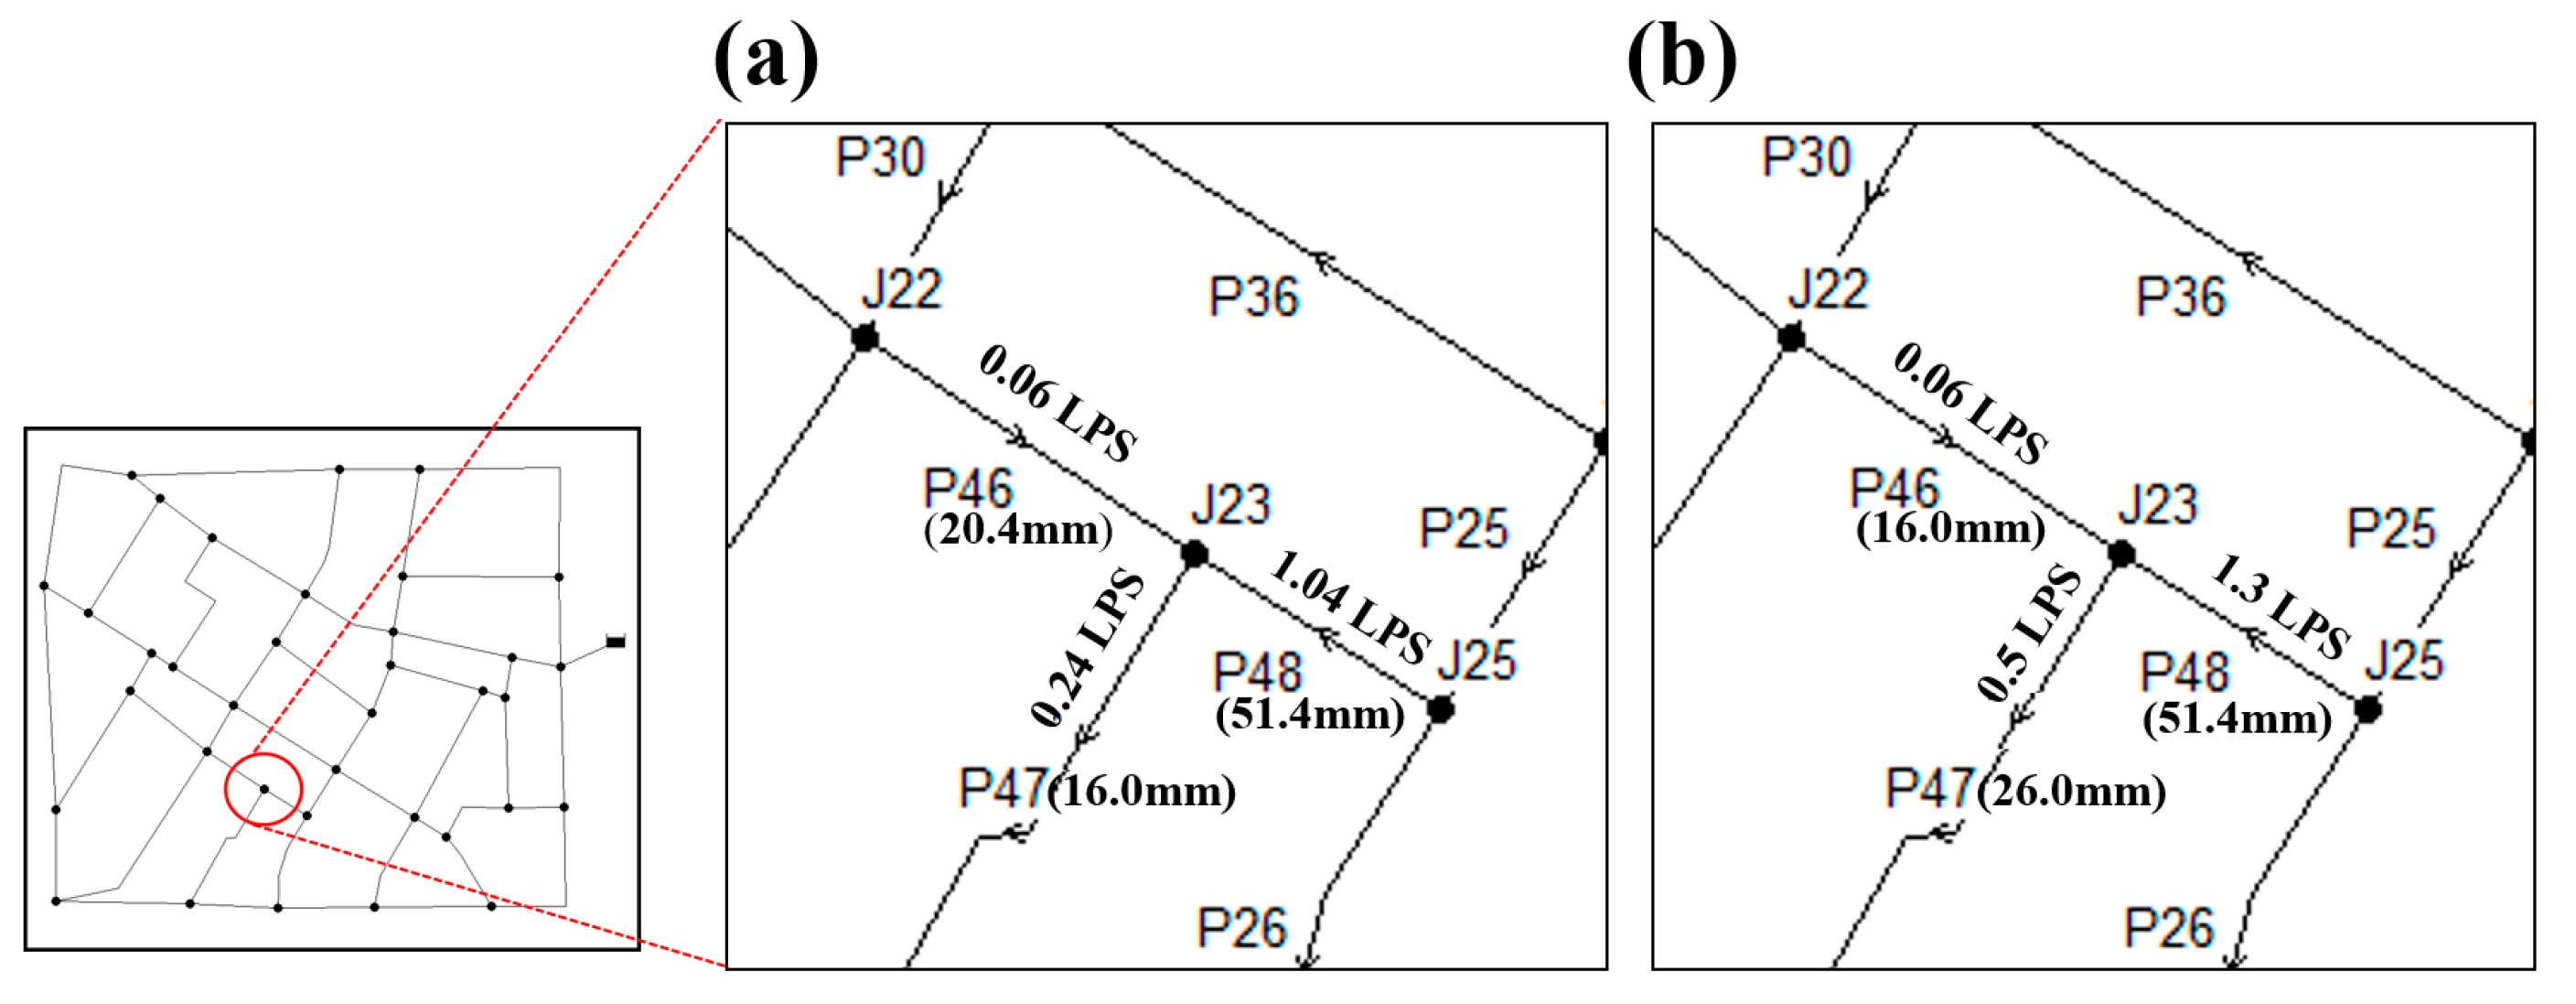
Table 5. In the left panel of
Figure 5, the red circle indicates the joint point showing the differences between the existing algorithm and the algorithm of this study. In the right panel of
Figure 5, a magnified view of the red circle indicates the node number, pipe number, and flow direction. In other words, pipes P46 and P48 meet at node J23, then the water moves to pipe P47. The flow is increased from pipe P46 to pipe P47. However, the existing approach places the smaller size pipe in the position of pipe P47 rather than pipe P46. It is against the reasonable pipe size continuity considering the flow.
On the other hand, the pipe size continuity search algorithm of this study reasonably places the pipe with a larger size pipe than pipe P46, because the increased flow at the pipe P47 is considered. Since we derive a design in which the larger pipe is placed in the position of pipe P47, the design cost is €28,971.63, which is higher than that of the existing algorithm. However, reasonable pipe size continuity handling with consideration of flow can be made at the joint point where more than three pipes meet. The average time spent for the pipe size continuity search is reduced by 87% when compared to the existing algorithm. When the number of iterations was 500,000, the computation time was reduced by 43 h. When compared with the results of applying the algorithm in the Hanoi network, the reduction rate was changed from 83% to 87%, which was not a significant difference when compared with the existing algorithm. However, when the actual reduced time was compared with iterations = 500,000, it had changed by 30 h—from 13 h to 43. This suggests that the reduced search time appears more clearly when the number of nodes and pipes is increased, and the scale of the distribution network is increased.
When the pipe size continuity search algorithm of this study is applied in the Fossolo network, the result demonstrates its pipe size continuity handling ability at the joint point. When it is compared with results of applying it in a Hanoi network, it is confirmed that the search time in a Fossolo network with a relatively larger scale is substantially reduced.
4.3. Cycling Network
The Cycling network is designed into the multi-objective optimization considering the least cost and maximum resilience with the pipe size continuity approach proposed this study. The optimization was independently performed 10 times by applying the same constraint conditions of both cost optimization only and the proposed approach in this study. As a result of the pipe size continuity search algorithm in this study, we derived the optimal cost design satisfying pipe size continuity in which reasonable pipe sizes were placed at various joint points in Cycling network with consideration of flow.
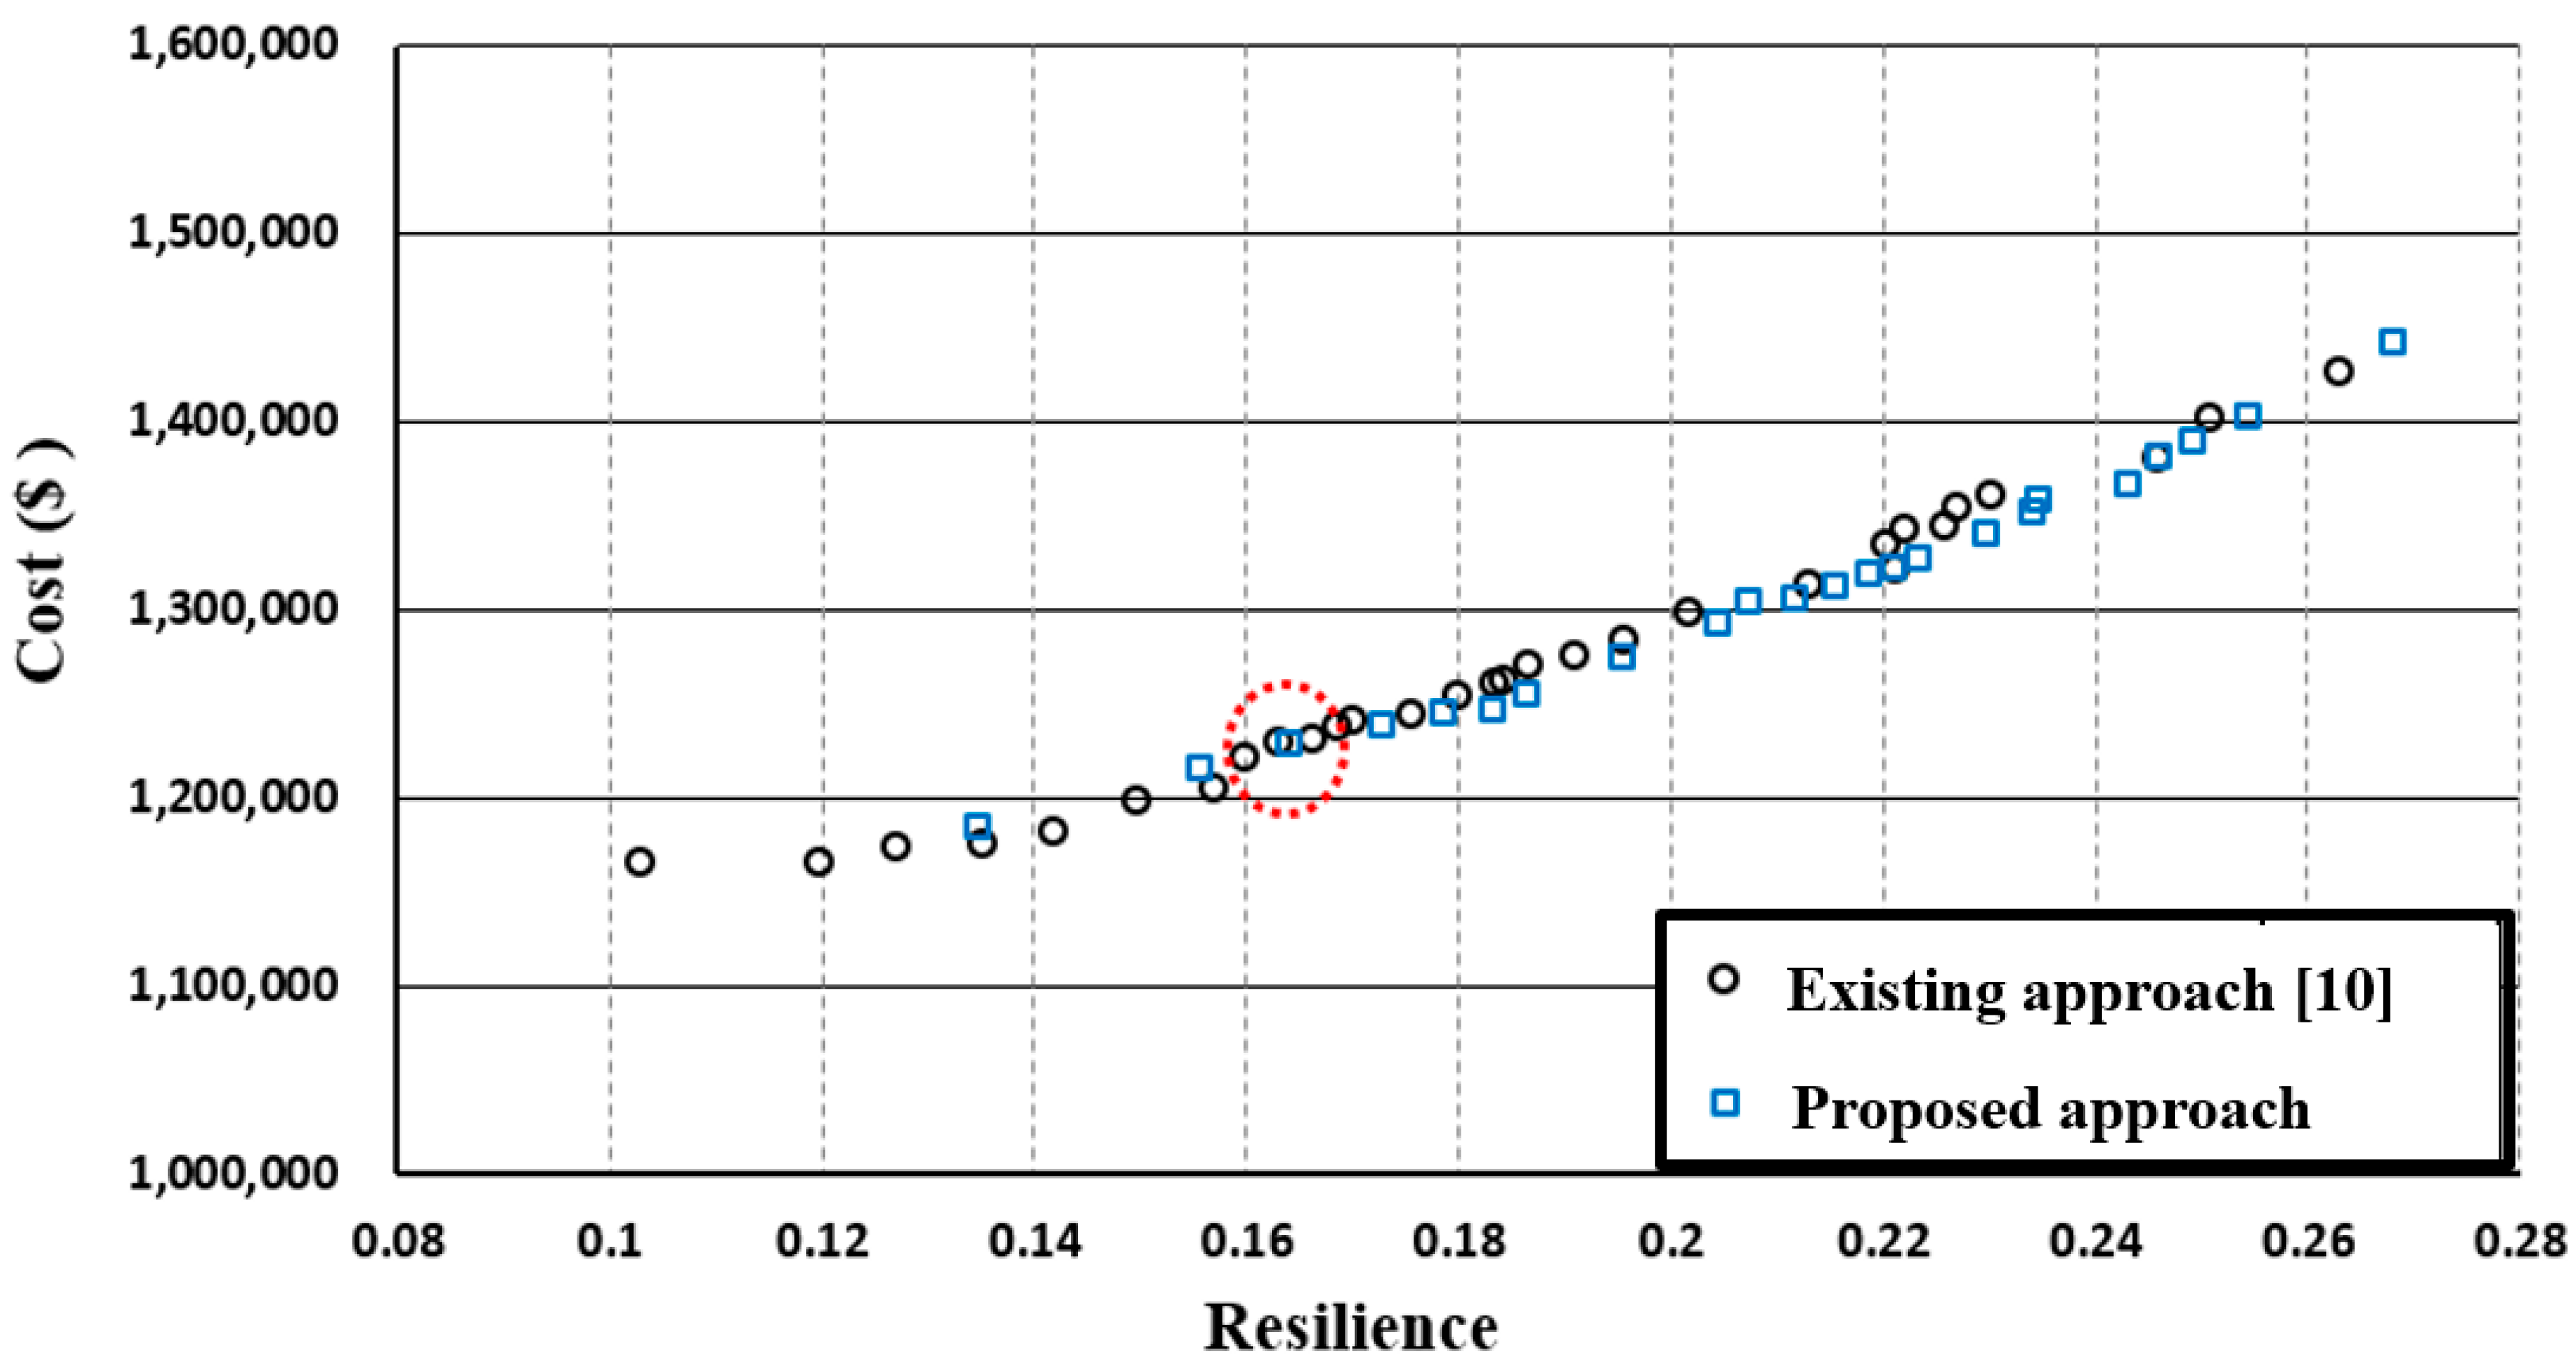
Figure 6 shows the Pareto optimal solution of the Cycling network, comparing the existing continuity approach and the proposed approach. The trend of Pareto fronts is the same, but the range of the solution using the existing approach is wider than the proposed approach. Moreover, even though the existing approach’s solution had better diversity, 75% of the solutions in the Pareto optimal solution convergences for the proposed continuity approach were better. The results of the design cost statistic and continuity index in each algorithm applied in the Cycling network are in
Table 6.
The pipe size continuity search proposed in this study derives a design with a continuity index of 1, which means that the pipe size continuity is fully satisfied. Meanwhile, a cost optimization-only trial showed a mean continuity index of 0.732. The quantification indicators of pipe size continuity and mean continuity index show a big difference between only cost optimization and a pipe size continuity search. The results from the Cycling network have shown that the pipe size continuity search of this study has a strong point when it compares the continuity index, but it has better convergence of design cost and resilience. When practical applicability is considered essential, the proposed pipe size continuity search is relatively competitive compared to existing WDSs optimization methods.
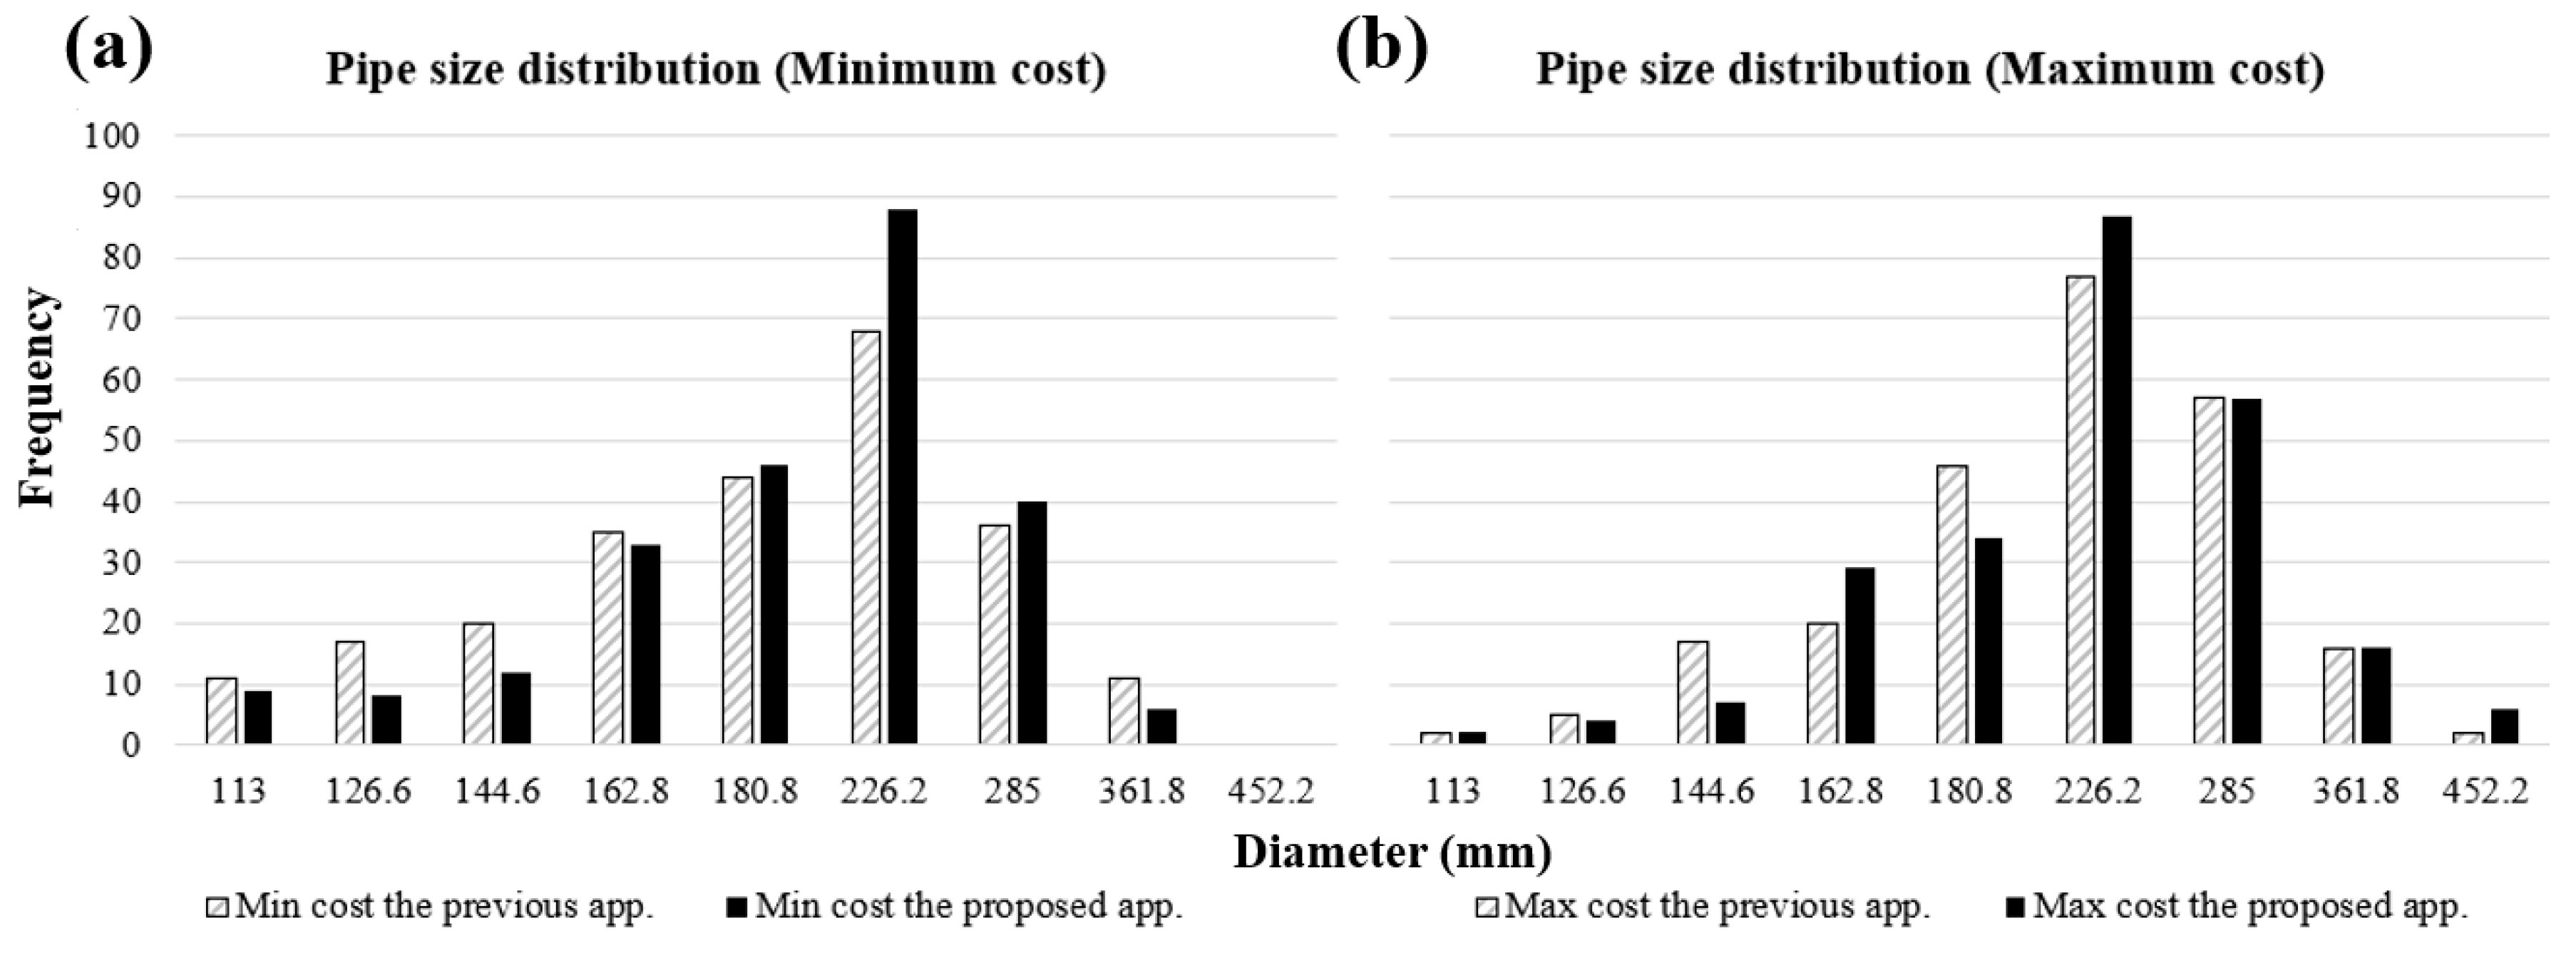
The diameter distribution of the multi-objective optimal design using the pipe continuity approach is shown in
Figure 7. The diameter of highest frequency is 226.2 mm in four cases, but the design of pipe size continuity proposed by this study uses larger pipes than the existing continuity approach. It means that the proposed approach considers flow at the confluence point.
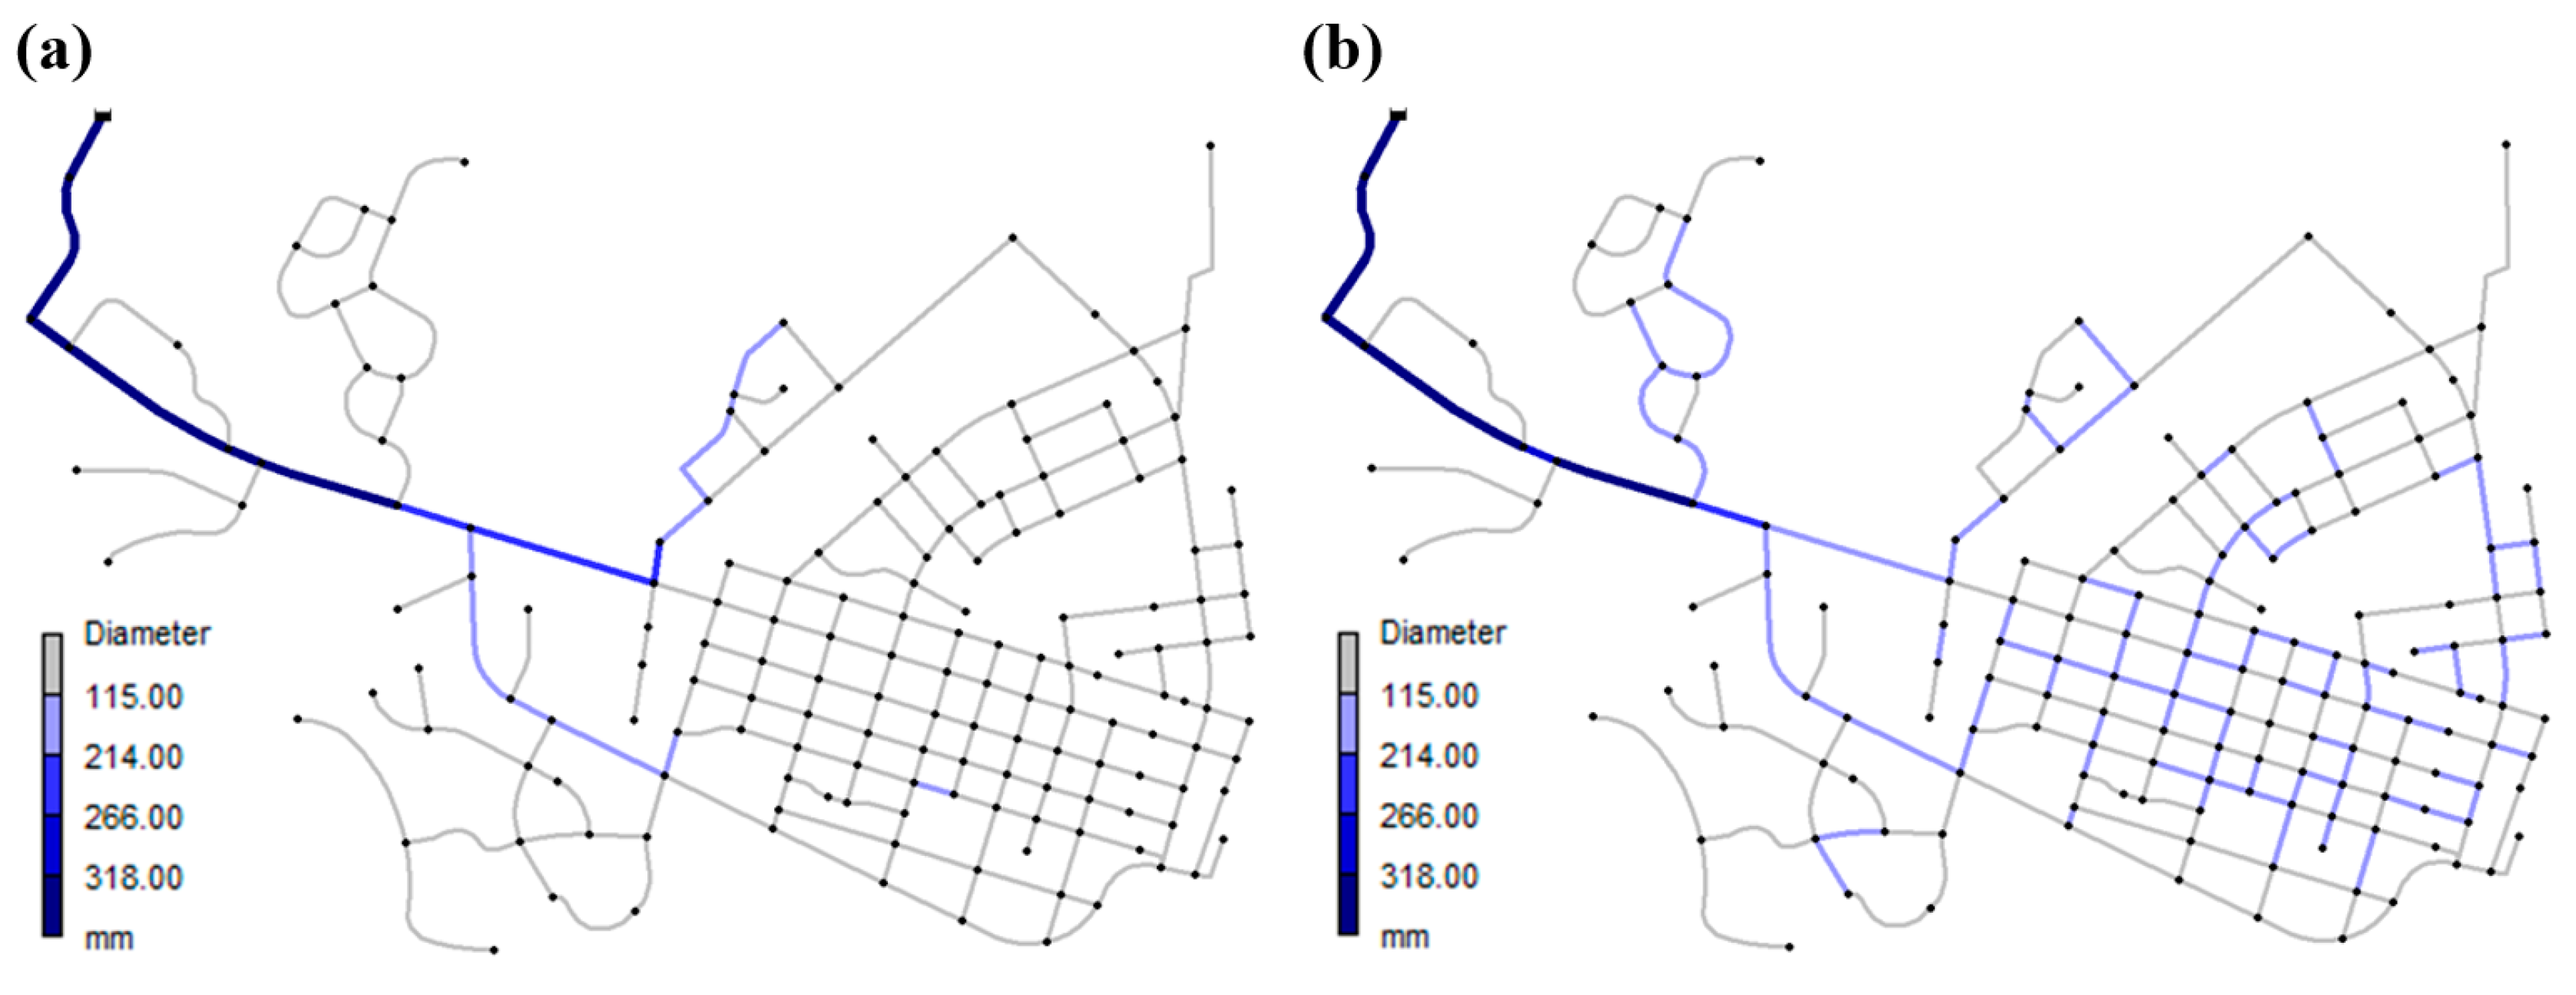
{ TC “Figure 4.3.2 Diameter histogram of HSA applied pipe size continuity” \f C \l “1” }The existing continuity approach considered all the possible flow paths in the distribution network, and the pipe size was gradually decreased on the basis of the flow direction of water, whereas this continuity approach considers not only the flow direction but also water flow at the confluence point. Therefore, relatively, many large pipes are needed after the confluence point, as shown in
Figure 8.
5. Conclusions
In this study, a new approach was proposed and applied in order to improve the practical field applicability considering the pipe size continuity search algorithm and the multi-objective optimization approach. The proposed pipe continuity search algorithm improved the computation time and reasonably considered pipe size continuity based on flow at the confluence point where three or more pipes meet.
When the methodology of this study was applied to the Hanoi network, the time spent for the optimal cost design of WDSs was reduced by approximately 83%. Therefore, it was confirmed that the efficiency is improved. In case of the Fossolo network, the pipe size continuity was reasonably handled at the joint where more than three pipes meet and the flow was considered. In addition, the time spent for optimal cost design was reduced by up to 87%. The reduction rates in the Hanoi and Fossolo networks compared to the existing algorithm are 83% and 87%, respectively, i.e., not a big difference. However, when expressed in actual search time based on iterations = 500,000, the reduced time in the Hanoi and Fossolo networks was 13 h and 43 h, respectively. Therefore, the time difference between the methods was approximately 30 h. This suggested that the reduction effects expressed in actual time increase exponentially with increasing size of WDSs, leading to greater efficiency.
Comparing results between the existing and the proposed approach, the Pareto optimal solution of the proposed approach’s convergence was better by about 75%. In addition, it was convincingly shown by the pipe size continuity index proposed in this study. The proposed approach derives a design with a continuity index of 1; meanwhile, a cost optimization-only trial showed a mean continuity index of 0.732. It means that the proposed approach’s pipe size continuity was fully satisfied. It can be said that this was a reasonable design with practical applicability.
The pipe size continuity search algorithm proposed in this study can be applied in the optimal cost design of water distribution systems together with various metaheuristic algorithms such as GA and SA instead of HS. In addition, the pump operating cost and water age, which is the indicator of water quality, can be applied as hydraulic constraints in addition to the nodal water pressure and the flow velocity in pipes.
Therefore, if the pipe size continuity search algorithm is applied together with various metaheuristic algorithms and objective functions and constraints in the actual large-scale network, a more effective, efficient, and practical optimal WSDs cost design can be made. A normal optimal design made by a metaheuristic algorithm may cause lower applicability onsite because of the pipe size continuity problem. We wish it to be known by engineers in the field that the proposed algorithm is better because it considers pipe size continuity. Improving the applicability has the potential to reduce labor costs and material costs, which may arise due to the pipe size continuity problem.


