Article

Identification of Critical Pipes Using a Criticality Index in Water Distribution Networks

Department of Civil Engineering, Kyung Hee University, Giheung-gu, Yongin-si, Gyeonggi-do 17104, Korea
*
Author to whom correspondence should be addressed.
Appl. Sci. 2019, 9(19), 4052; https://doi.org/10.3390/app9194052
Submission received: 3 August 2019 / Revised: 16 September 2019 / Accepted: 25 September 2019 / Published: 27 September 2019
(This article belongs to the Special Issue Emerging Issues of Urban Water Systems Modeling and Analysis)

Abstract

:
A water distribution network (WDN) is a critical infrastructure that must be maintained, ensuring a proper water supply to widespread customers. A WDN consists of various components, such as pipes, valves, pumps, and tanks, and these elements interact with each other to provide adequate system performance. If the elements fail due to internal or external interruptions, this may adversely impact water service to different degrees depending on the failed elements. To determine an appropriate maintenance priority, the critical elements need to be identified and mapped in the network. To identify and prioritize the critical elements (here, we focus on the pipes only) in the WDN, an element-based simulation approach is proposed, in which all the composing pipes of the WDN are reviewed one at a time. The element-based criticality is measured using several criticality indexes that are newly proposed in this study. The proposed criticality indexes are used to quantify the impacts of element failure to water service degradation. Here, four criticality indexes are developed: supply shortage (SS), economic value loss (EVL), pressure decline (PD), and water age degradation (WAD). Each of these indexes measures different aspects of the consequences, specifically social, economic, hydraulic, and water quality, respectively. The separate values of the indexes from all pipes in a network are then combined into a singular criticality value for assessment. For demonstration, the proposed approach is applied to four real WDNs to identify and prioritize the critical pipes. The proposed element-based simulation approach can be used to identify the critical components and setup maintenance scheduling of WDNs for preparedness of failure events.

1. Introduction

A water distribution network (WDN) is an essential infrastructure supplying water to maintain daily and economic activities of the users connected to it. The WDN itself is composed of many elements that are interconnected and state a certain degree of functionality for the network. A disruption event upon the network will result in a loss of network functionality, which will consequently affect the customers to a certain degree.
Among the many elements in a WDN, pipes are the primary components connecting each other. Each of these pipes can be afflicted by failure (i.e., breakage), which renders the pipe unusable. In the event of a pipe failure, it has to be isolated from the network, and the network functionality will decrease depending on the importance of the removed pipe. By calculating the functionality decrement of individual pipes, the criticality of each pipe can be estimated. The criticality of the pipe is valuable information that can be used to determine the proper maintenance priority accordingly [1]. Since a WDN is an infrastructure with hydraulic capability that serves many users, a failure event will impact both the inner workings and the receiving side.
Wagner et al. [2] introduced the primary concepts of WDN design reliability into mechanical and hydraulic reliability. According to Mays [3], the mechanical reliability focuses on the network topology, evaluating system connectivity given the failure conditions, and the hydraulic reliability refers to the ability of a system to meet the requirements of water flow and pressure.
In the context of mechanical reliability, Su et al. [4] suggested a mechanical reliability indicator using a concept of pipe availability based on pipe failure statistics. Later, Fujiwara and Tung [5] advanced this pipe availability indicator by estimating the failure probability according to a pipe size variation. Khomsi et al. [6] also advanced the pipe availability by considering the water availability under a simulation of pipe failure and repair events. On the other hand, in the context of hydraulic reliability, Xu and Goulter [7] estimated system reliability based on the nodal pressure simulated, and later Shi and O’Rourke [8] suggested a reliability index using actual demand and pressure at demand nodes.
The available pressure and supplied flows can be considered simultaneously as an energy term. The resilience index (RI) is a well-known measurement of WDN reliability based on nodal flow and excessive pressure [9]. The RI has been used to evaluate system performance and contributed to the development of various post-indexes. For example, Prasad and Park [10] developed the network resilience index (NRI) by considering network connectivity. The NRI is known as a representative hydraulic-topological combined reliability index. Jayaram and Srinivasan [11] developed the modified resilience index (MRI), which calculates redundancy of WDN using surplus energy and minimum required energy. Recently, the resilience indexes were revisited by Jeong et al. [12] by suggesting a new definition of surplus and the minimum required head at a node considering the flow direction in pipes and the hydraulic gradient of the network.
Besides the resilience-type indexes, there are many other indicators developed using the energy-based concepts. Cabrera et al. [13] proposed five energy-efficiency indicators to evaluate the WDN capacity, and later Cabrera et al. [14] suggested a new method for assessing the energy states in WDNs. Similarly, Dziedzic and Karney [15] analyzed water distribution sustainability using different energy classifications in water networks, such as supplied, delivered, lost, and dissipated energy. Moreover, Hashemi et al. [16] proposed five energy metrics based on six energy categories, including supplied, delivered, required, downstream flow, leakage, and friction energy in WDNs.
Recently, several water quality indicators were developed. Alsaqqar et al. [17] summarized various water quality measurements and introduced quantification indexes for water quality assessment, such as the Langelier saturation index (LSI) and Ryznar stability index (RSI). Moreover, Mortula et al. [18] demonstrated various water quality indicators by spatial, temporal, and hotspot analysis using Moran’s index (correlation) and Getis-Ord Gi (spatial clustering).
Summarizing the previous research, the majority of indexes focused on the hydraulic outcomes of WDNs and few studies introduced water quality aspect. None of them seek multiple aspects of WDNs services (e.g., social, water quality, and economic, etc.), rather focus on a single item. In addition, the aforementioned metrics are based on a system-based analysis to measure the functional capability of the entire network. By applying these metrics, however, no information on the location of the vulnerable part can be obtained. To overcome the drawbacks of the conventional metrics, we propose an element-based analysis in which individual components are evaluated using several performance quantification metrics to identify the critical elements in WDNs. By locating and prioritizing the critical elements of the network, actions can then be accordingly planned to improve the network resiliency against potential disturbances.
The objective of this study is to identify critical pipes in a WDN. To that end, first, several criticality indexes are developed to measure the network performance loss during a disturbance event. The indexes are then applied to several networks to analyze the responses. The responses from the separate indexes are then combined to determine the overall criticality of individual pipes. Finally, a verification of the proposed criticality indexes is conducted by comparing them with the resilience index (RI).

2. Criticality Indexes

To identify the critical elements in WDNs, indexes are useful to quantify the criticality of individual pipes. The proposed indexes are intended to measure the loss of network functionality in four different aspects: social, economic, hydraulic, and water quality. All the developed indexes range from 0 to 1, where a value closer to 0 states a lesser criticality and a value closer to 1 states a greater criticality of the pipe in the network.

2.1. Social Index

If demand at a node is not fully supplied, there will be a certain level of dissatisfaction of the users connected to the node. The level of dissatisfaction is related to the ratio of supply and demand. That is, higher dissatisfaction will occur with the lower demand supplied. Here, a supply shortage (SS) index is proposed by calculating the ratio of supply and demand at each node during the isolation of a certain pipe. Equation (1) expresses the SS index proposed.
S S i = j = 1 N 1 Q e , j Q n , j N ,
Here, S S i is the supply shortage index with the isolation of pipe i; N is the total number of nodes in the WDN; Q e , j is the supplied demand at node j after an event (i.e., isolation of a pipe); and Q n , j is the normal demand at node j.

2.2. Economic Index

The reduced water supply will incur an economic loss on the user side. Water has different economic value depending on the user. For municipal users, the supply shortage will disrupt daily activities and commerce. Meanwhile, for an industrial area, the water shortage will decrease the product amount or halt the manufacturing process, resulting in higher economic loss compared to the municipal area. Here, an economic value loss (EVL) index is developed to quantify the economic loss due to a disruption event of a WDN. Equation (2) represents the equation of the EVL index.
E V L i = 1 j = 1 N Q e , j × T r i × u j j = 1 N Q n , j × T r i × u j ,
Here, E V L i is the economic value loss index with the isolation of pipe i; T r i is the time to repair the pipe i; and u j is a unit value of water at node j.
In this study, the unit values of water are 0.1577 $/m3 for the municipal sector and 0.2293 $/m3 for the industrial sector [19]. T r i is the average time spent to repair a pipe depending on the pipe diameter and is calculated using a regression curve proposed by Walski and Pelliccia [20]. Equation (3) expresses the equation of T r i in hours.
T r i = 6.5 D i 0.285 ,
Here, D i is the diameter of pipe i in inches.

2.3. Hydraulic Index

During a failure event, the network pressure is likely to decrease, since isolating a pipe may block the regular flow path and detouring other longer paths will increase the flowrate and overall head losses. The reduction of pressure at the nodes is measured using a pressure decline (PD) index, which compares the normal pressure and declined pressure during a failure event while considering the nodal demand as a weighting factor; this is so that a node with a higher demand has more influence on the index. Equation (4) represents the calculation of the PD index.
P D i = j = 1 N [ ( 1 P e , j P n , j ) × Q n , j ] j = 1 N Q n , j ,
Here, P D i is the pressure decline index with the isolation of pipe i; P e , j is the pressure at node j after the event; and P n , j is the normal pressure at node j.

2.4. Water Quality Index

Various water quality issues exist in WDNs, such as disinfection by-product formation, microbial regrowth, sediment deposition, and odor/taste of chlorine [21]. However, these issues are difficult to simulate and it is hard to develop a quantification index for them. Meanwhile, water age is relatively simple to simulate, thus can be used as an indicator for measuring water quality in WDNs. Water age of a node is defined as the time for water to travel from a source to the particular node. Here, the water age is calculated using a chemical option in EPANET. A chemical with zero decay is put at the source and elapsed time is recorded for individual nodes when a node firstly detects the arrival of the chemical. Here, the water age growth due to pipe isolation is measured using a water age degradation (WAD) index. The nodal demand is considered as a weighting factor so that a node with higher demand has a greater impact on the index. Equation (5) expresses the calculation of the WAD index.
W A D i = j = 1 N ( 1 T n , j T e , j ) × Q n , j j = 1 N Q n , j ,
Here, W A D i is the water age degradation index with the isolation of pipe i; T e , j is the water age at node j after the event; and T n , j is the normal water age at node j.

3. Modeling Process

The model was developed using Python 3 [22] and the EPANETTOOLS 1.0.0 Python package to repeatedly call the EPANET programmers toolkit functions [23]. This specific Python package provides a pressure-driven analysis (PDA) based on EPANET-Emitter [24], which adjusts the demand according to the pressure to avoid negative pressure. The package utilizes the emitter functionality of EPANET by enabling the standard emitter function for all nodes. The nodal demand is partially supplied when a minimum pressure is not met, and the supplied demand reaches zero if it is impossible to satisfy a positive pressure at the node. Using this package, the minimum pressure is set to 10 m, and the exponent of the emitter function is assumed to be 0.5. First, the model simulates a normal condition and retrieves the simulation results. Then, the individual pipes are closed one at a time sequentially while recording the simulation results and calculating the criticality indexes. Figure 1 illustrates the flowchart of the overall computing steps.

4. Application Studies

4.1. Study Networks

For demonstration purposes, the proposed four criticality indexes are applied to four benchmark networks. The networks are real WDNs that are currently under operation and all information is obtained from network managers via personal contact. Note that a flat average demand pattern without temporal variation is applied for simplicity. Table 1 summarizes the network parameters and Figure 2 depicts the network layouts. Here, the system-average degree of node (DoNsys) is defined as the average number of pipes a node is connected to, as expressed in Equation (6), and the higher value indicates that a network is densely looped. Among the four networks, Network 4 shows the highest DoNsys, while Network 2 has the lowest DoNsys.
D o N s y s = j = 1 N N o d e C o n j N ,
Here, D o N s y s is the system-average degree of node and N o d e C o n j is the number of pipes connected to node j.

4.2. Criticality Assessment

The proposed criticality indexes yield values in a range of 0–1. For a better comparison of pipe criticality, the index values are then ranked within a network. Given the values of the four indexes, finally, the OVERALL criticality of the individual pipes are estimated. The OVERALL criticality is calculated by summing the rank of each index, and then the summed values are ranked. Note the OVERALL criticality assumes the same weight for each critical index. Visualizations of these results for each network are presented in Figure 3, Figure 4, Figure 5 and Figure 6 using a percentile ranking. The four colors represent the quantile of the pipe criticality, while the grey color indicates zero criticality of the pipe (blue: 0%–25%; green: 25%–50%; yellow: 50%–75%; red: 75%–100%). Note that a higher percentile indicates a higher criticality of the pipe.
For all the networks, the pipes that are closer to the source tend to have a higher OVERALL criticality value compared to other pipes in the network. Failure of pipes sourcing from the reservoir would result in great loss, as the effect will reverberate downstream, thus affecting more users. Tracing down along the main lines from the reservoir, the model is capable of deciding how far the critical part of the main line is and which direction and branch are more critical. This response can be seen in Network 1 (Figure 3) as the critical main lines cease at the 6th pipe from the reservoir, and the right-hand-side branch from the first pipe is deemed less critical compared to the left-hand-side branch. Critical pipes located further from the source are primarily seen on paths that do not have a loop or around the nodes with higher demand. A clear example of this response can be seen in Network 4 (Figure 6), as the pipes in loops are deemed critical because they are servicing high-demanded nodes.
Each of the indexes has different responses, which is more prominently seen in Network 1 (Figure 3). The SS and EVL indexes for some of the pipes in Network 1 are colored grey, indicating that the failure of the relevant pipes does not have any effect on the social and economic aspects; however, there are clear responses in the hydraulic and water quality aspects from those failures. The distinct response from each index shows that the proposed indexes can quantify the criticality of individual components for different aspects of losses. Another interesting result can be seen from Network 3 (Figure 5), in which the SS, EVL, and PD index values are quite similar to each other, while the WAD results are more variable than other indexes. By taking into consideration all of the indexes as a sum, the OVERALL criticality may provide more accurate and balanced results for identification of the critical pipes.
Network 1 features a densely looped network (DoNsys = 2.59), while Network 2 is a branch-loop hybrid network with DoNsys of 2.31. Considering the different characteristic of both networks, they are chosen as representatives for further analyses. Figure 7 shows the pressure distribution on both networks to provide more details. The comparison of four individual indexes to the OVERALL criticality is shown in Figure 8.
From Figure 8a,b, based on the SS and EVL indexes, it is observed that the pipes in Network 1 (red markers) are clearly divided into two groups: zero critical and highly critical pipes. Network 2 (blue markers) is not biased compared to Network 1, showing more variations in criticality. This different reaction is caused by the discrepancy in the network type. Network 1 is densely looped, still being able to supply water when the zero-criticality pipes are closed. In contrast, Network 2 is a hybrid-type, where pipe failure at the branch segment will disable access to water for downstream users. The most critical pipes might be identified using the SS and EVL indexes, but the rest of the pipes would not be ranked suitably since the indexes only react to a major failure.
In Figure 8c, PD index values are evenly distributed for Network 1 (red markers), except several pipes with zero criticality. Meanwhile, in Network 2 (blue markers), many pipes show very low PD percentile rank values. For Network 2, it is observed that the pipes with low SS and EVL values also contain low PD values as well. These pipes can be simply regarded as less critical components using these three indexes. From Figure 8d, it is observed that WAD values are evenly distributed for the entire range for both networks. The results indicate that every single pipe in the network will surely have some effect on water age growth in the case of a failure.
As seen, all the indexes play an important role in determining the OVERALL criticality. By considering the SS, EVL, PD, and WAD indexes simultaneously, the OVERALL index can achieve a balanced assessment of pipe criticality within a network.

4.3. Correlation between Criticality and Pipe Parameters

Correlations between the OVERALL criticality with the pipe diameter, flowrate, and degree of nodes (DoNpipe) are shown in Figure 9 and Figure 10 for Networks 1 and 2, respectively. Here, the pipe-based degree of nodes (DoNpipe) is defined as the average DoN for the start and end nodes of the pipe, as expressed in Equation (7).
D o N p i p e , i = N o d e C o n S t a r t i + N o d e C o n E n d i 2 ,
Here, D o N p i p e , i is the degree of nodes for pipe i; and N o d e C o n S t a r t i and N o d e C o n E n d i are the number of pipes connected to the start node and end node of pipe i, respectively.
Analyzing Figure 9 and Figure 10, a consistent trend is observed between the OVERALL criticality and pipe diameter and flow. That is, the pipes with a bigger diameter and servicing a larger flow tend to be more critical. These components are the main transmission lines located close to the source. Thus, a disturbance occurring at this location will likely incur large losses that require more attention. In addition, the pipes serving large-demand nodes also yield high criticality although they have a small diameter. These observations are commonly noticed in both networks.
Interesting results are observed from the relation between the criticality and DoNpipe for the different types of networks. For Network 1, which is densely looped, there is a slight trend that the pipes with higher DoNpipe are more critical (Figure 9c). Meanwhile, Network 2 with branch-sectors shows an inverse-relation between DoNpipe and the criticality (Figure 10c). This response is related to the network characteristic, that is, most pipes in a looped network have a high DoNpipe, and disruption of this pipe will affect a considerable loss in the network. For a less looped network or branch-typed network, a pipe with a low DoNpipe in the branch-sector serving a bigger demand will have a significant effect to the network, as there is no alternative flow path. Reviewing these results, the diameter and flowrate of a pipe can be used as primary predictors to assess pipe criticality, while DoNpipe can be applied for secondary consideration.

4.4. Comparison with Resilience Index (RI)

The newly proposed indexes are compared with the widely applied resilience index (RI) for verification. Figure 11 and Figure 12 show the comparison between the value of the criticality indexes and RI for Network 1 and 2, respectively. RI is plotted on a reverse scale to achieve a more comprehensible comparison with the criticality indexes since the value of RI closer to 1 shows a better resilience (less criticality), while a lower RI value indicates less resilience (more criticality). Note that RI measures the excess pressure, thus it can be lower than 0 if the available pressures are lower than the required pressure.
It can be seen from Figure 11 and Figure 12 that the proposed criticality indexes behave in similar patterns with RI. More importantly, they identically show peaks for the pipes with higher criticality. Note that RI has been widely applied as a representative metric for measuring WDN resilience for normal and abnormal operating conditions. The same manner of responses verifies that the proposed indexes can apply for component-based criticality assessment in WDNs. Furthermore, the criticality indexes intend to quantify four different aspects of WDN functionality, while RI only considers the hydraulic aspect. Having more parameters to consider, the proposed criticality indexes can efficiently identify the critical pipes.

5. Discussion and Conclusions

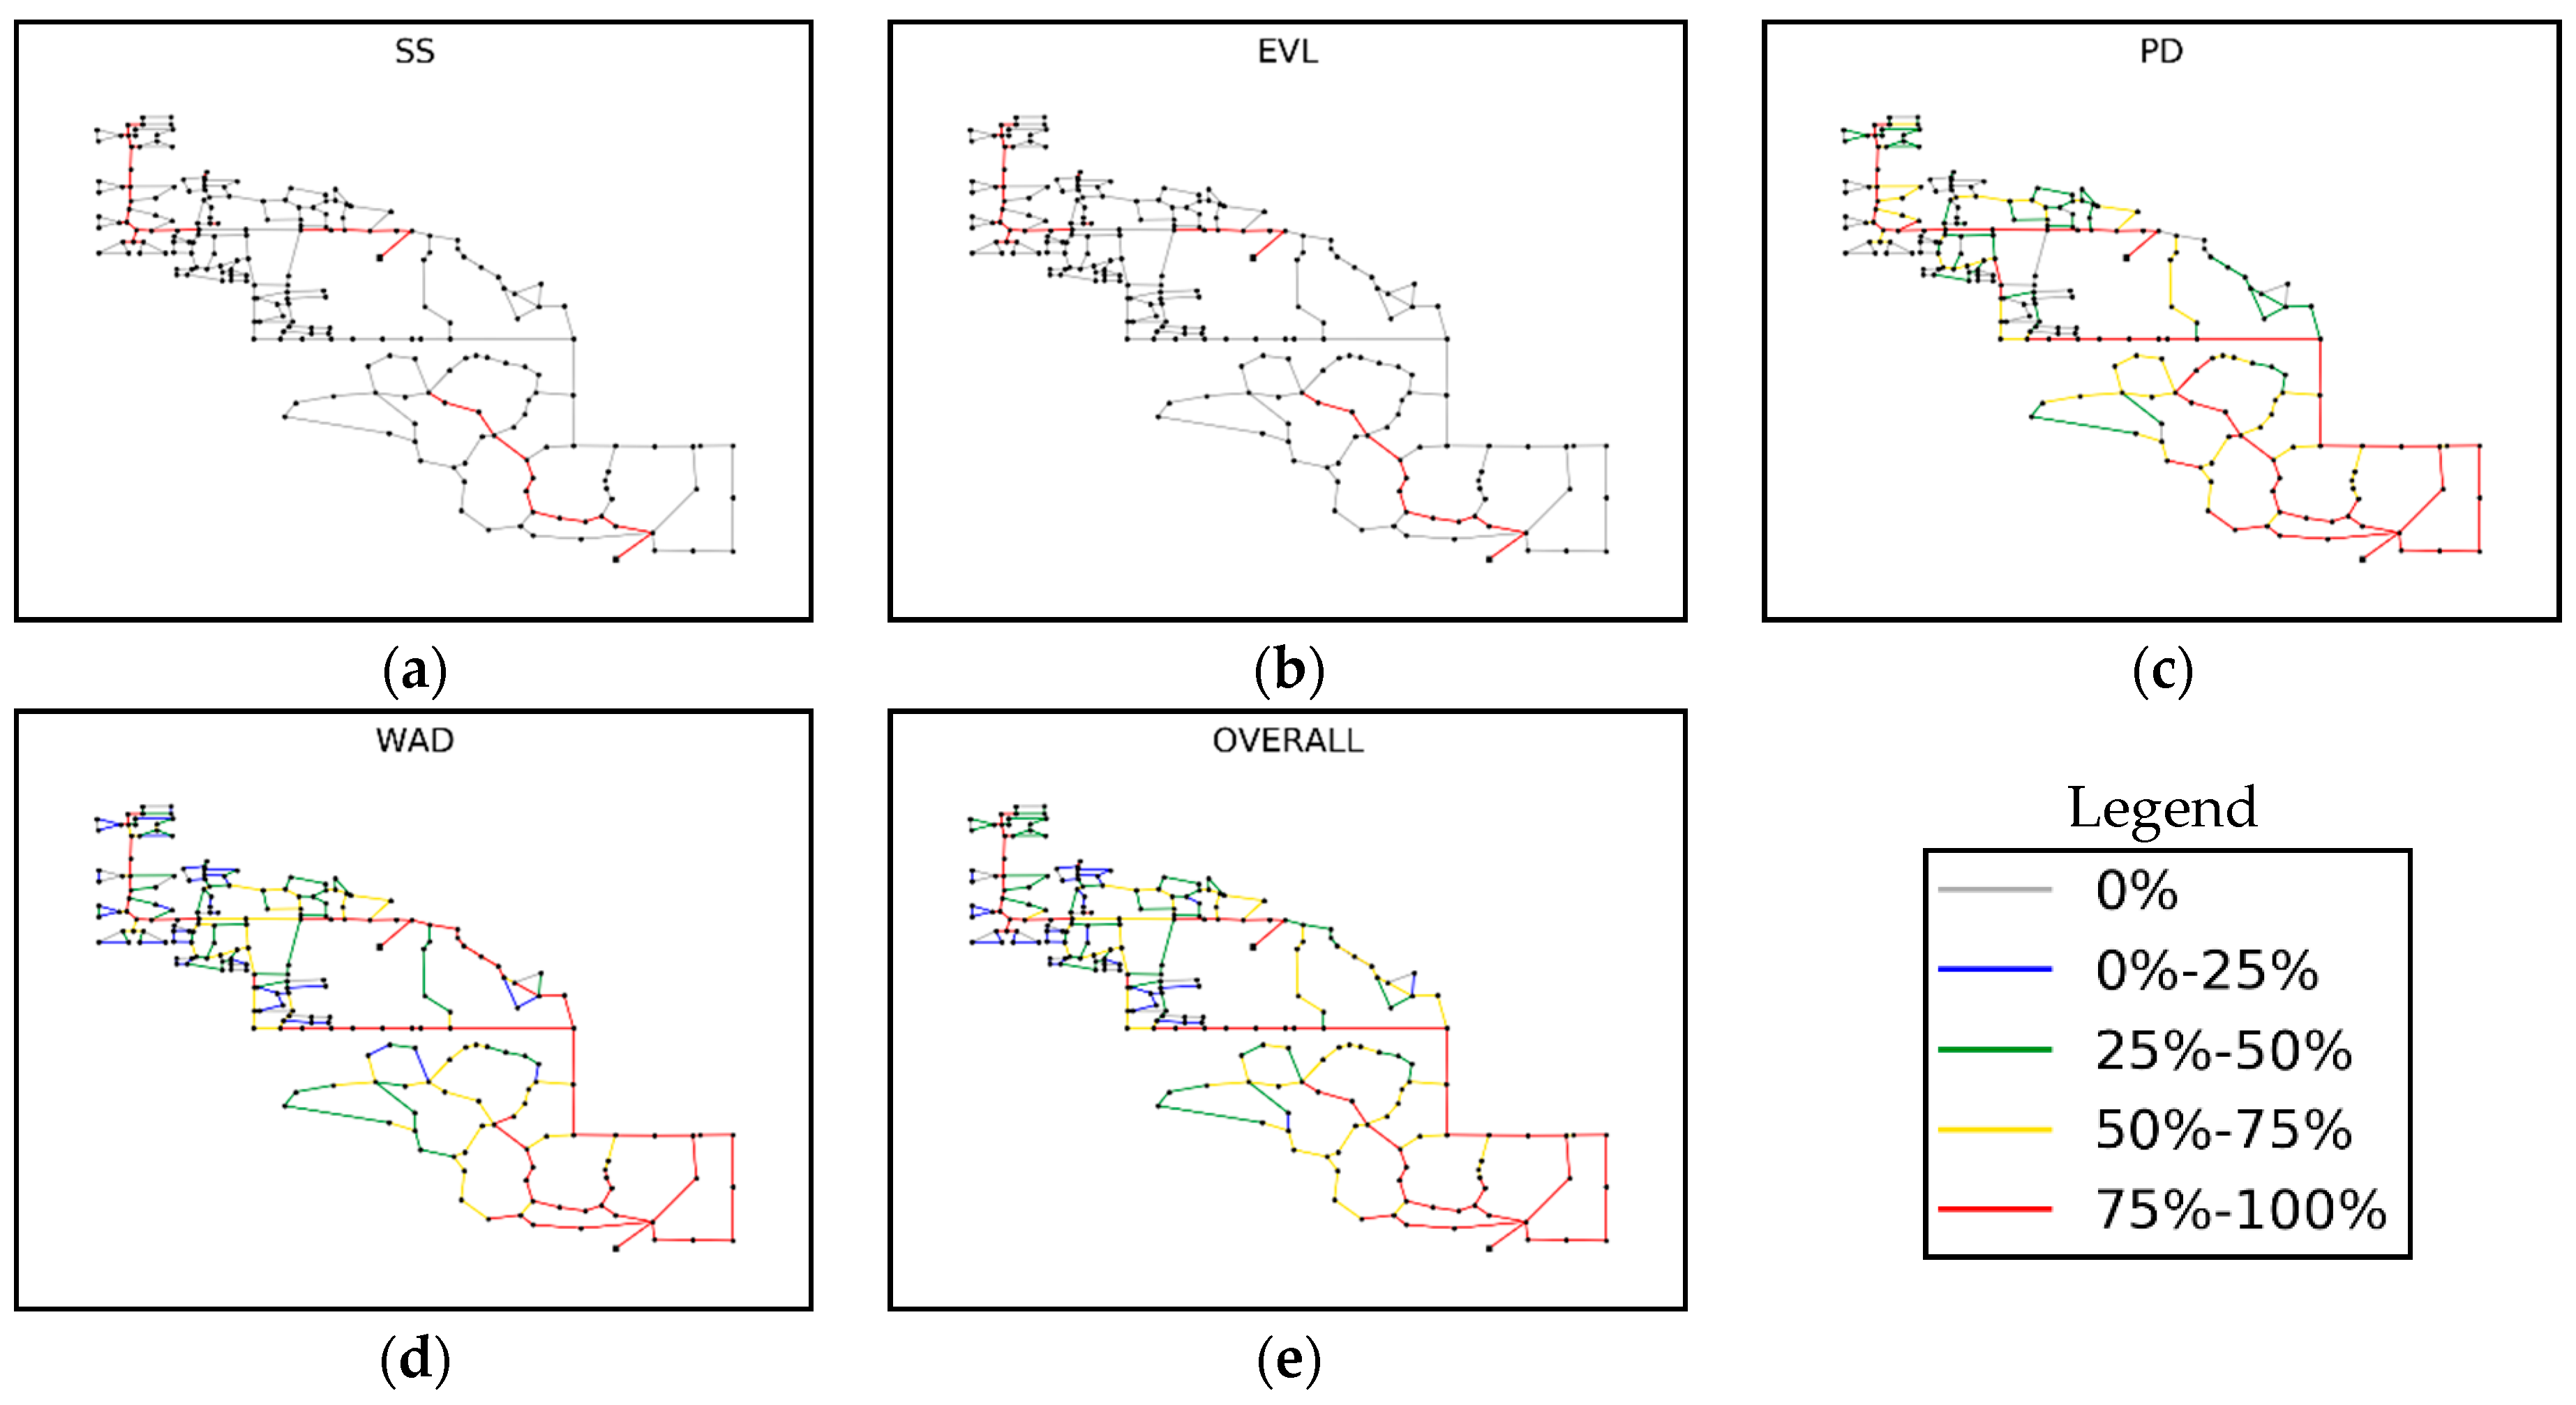
To identify and prioritize the critical pipes in a WDN, an element-based simulation approach is proposed. The element-based criticality is measured using four criticality indexes, including supply shortage (SS), economic value loss (EVL), pressure decline (PD), and water age degradation (WAD). These indexes measure different aspects of performance degradation, specifically social, economic, hydraulic, and water quality, respectively. Evenly weighting the four indexes, the OVERALL criticality is calculated to identify and prioritize the critical pipes.
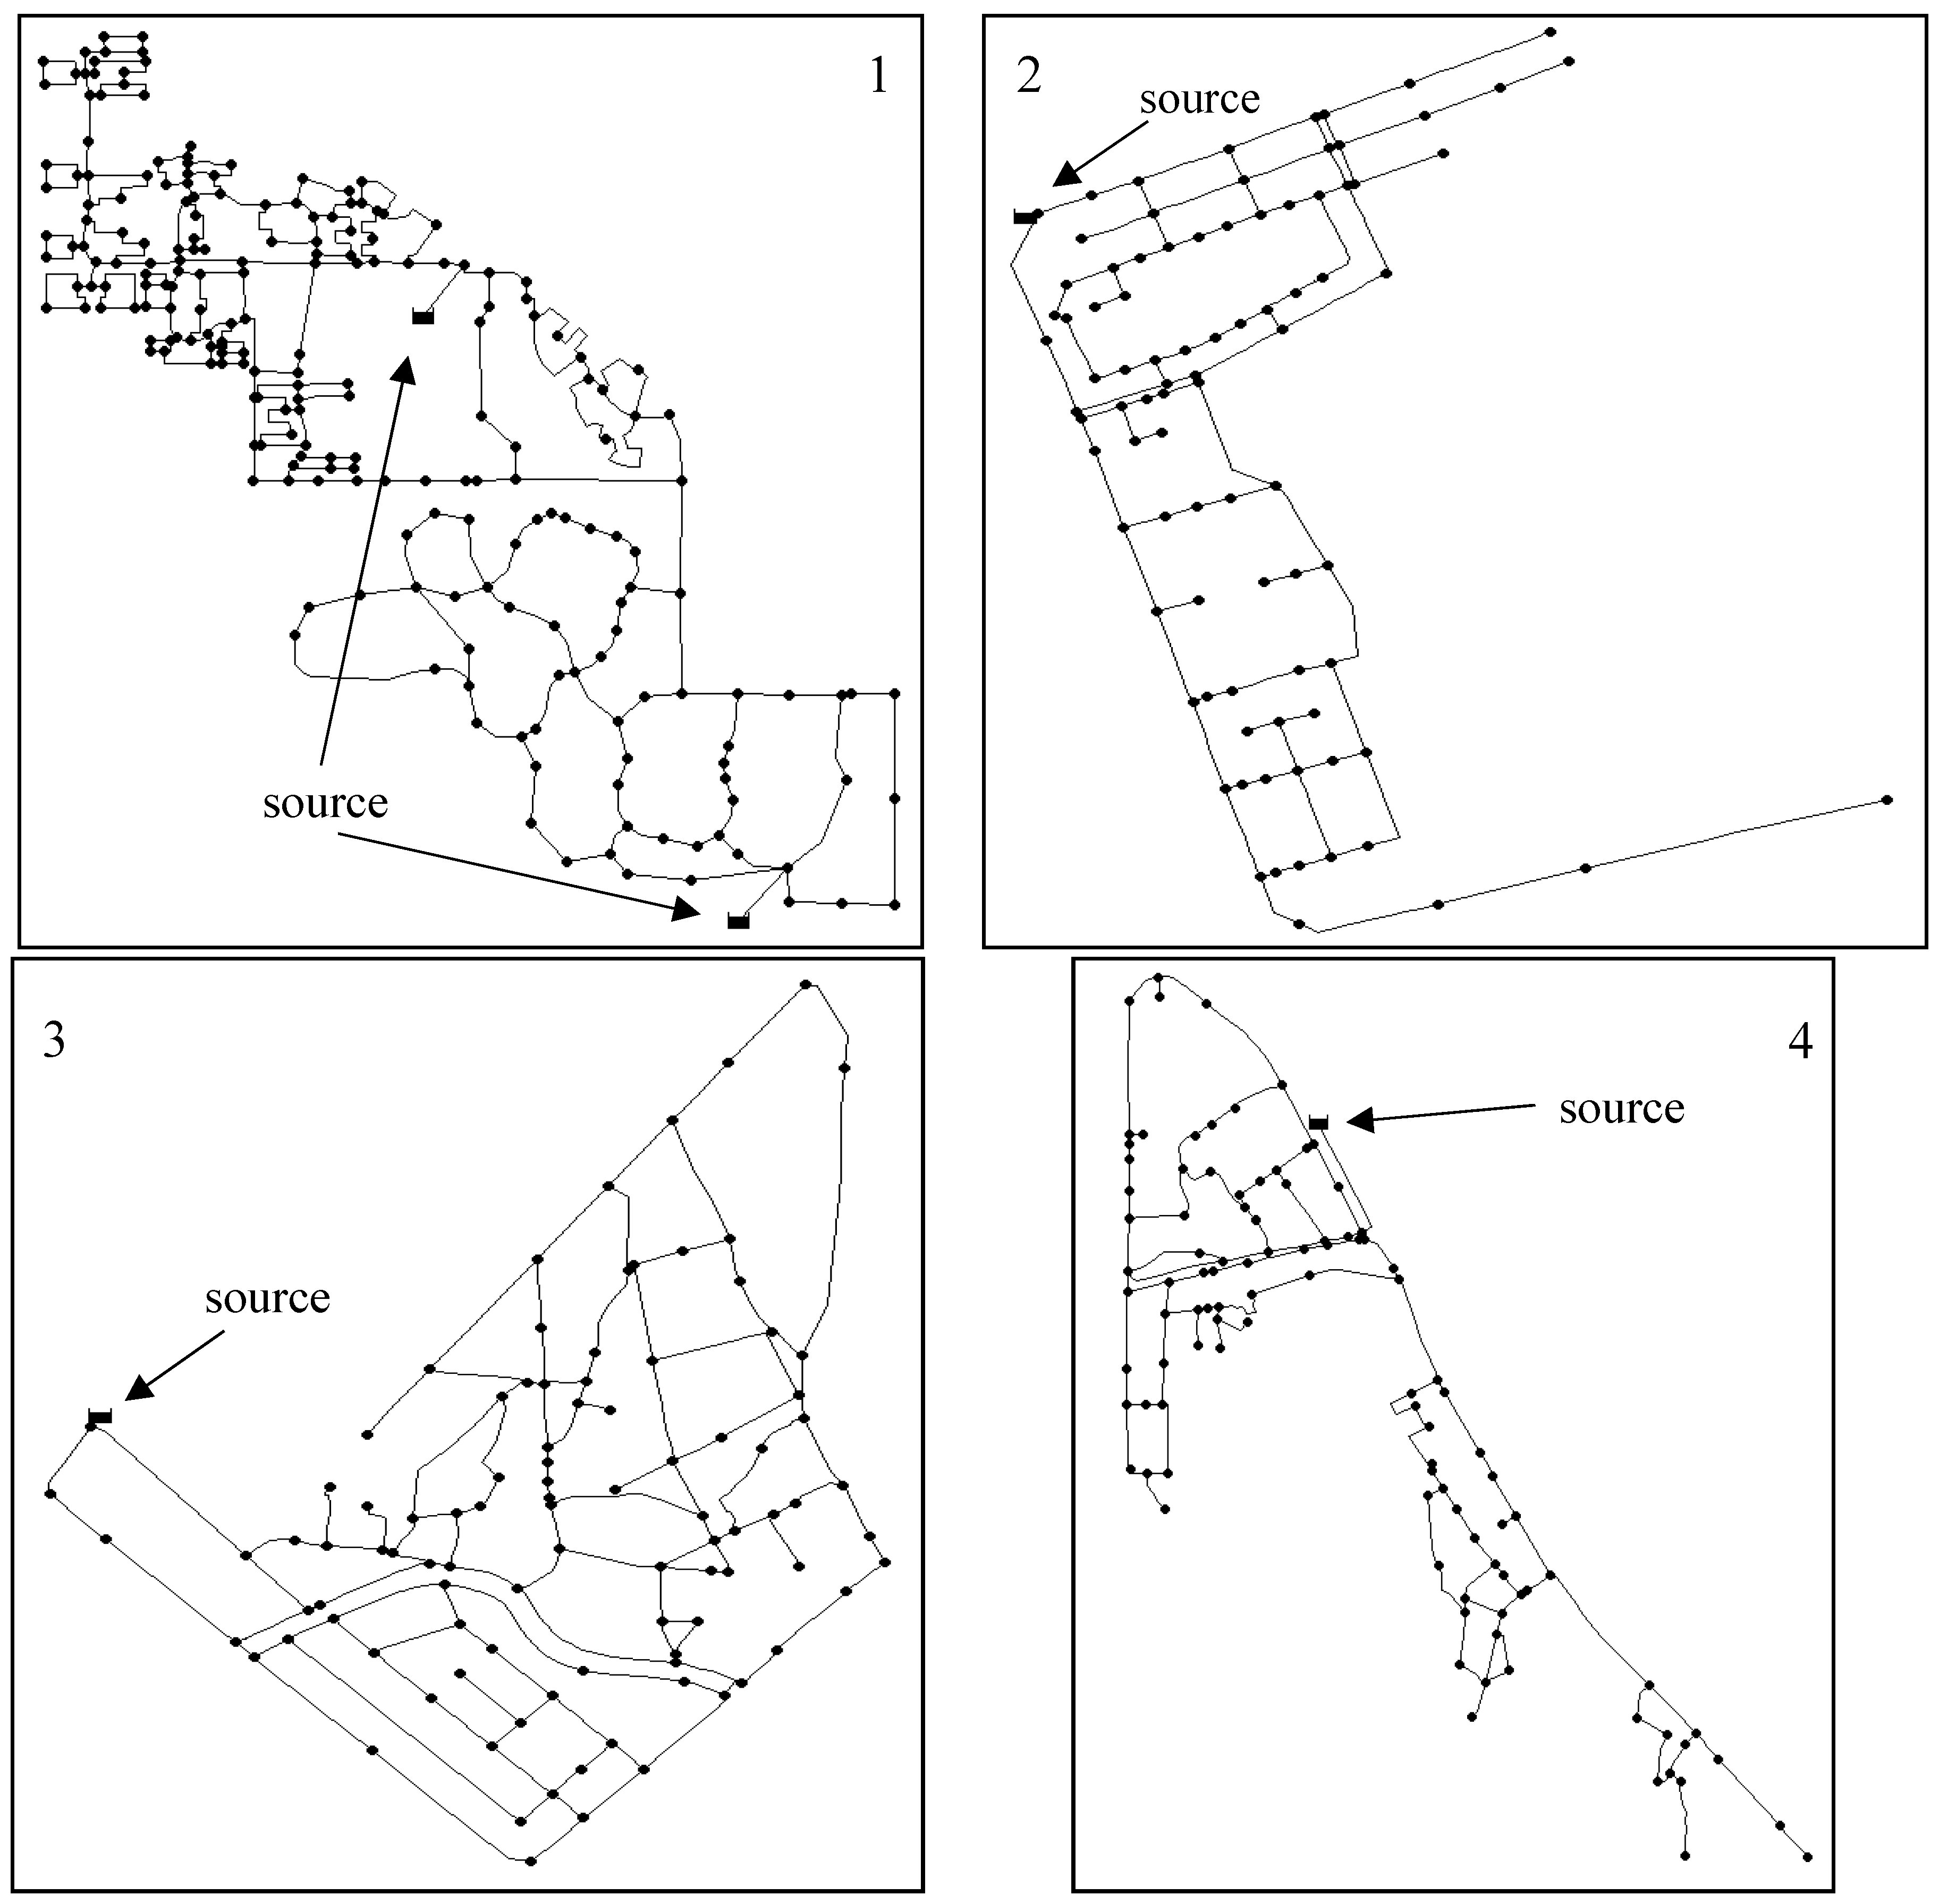
For demonstration, the proposed indexes are applied to four networks that have different characteristics. The results show that each index representing different aspects yields variable criticality ranks per pipes. The individual results are then combined into a single criticality value to provide the overall assessment of criticality of individual pipes. The network type also affects the criticality results; here, we have compared four different networks from the densely loop to the branch-loop hybrid type. Generally, it was found that the pipes with large sizes and serving high-demand nodes tend to show greater criticality. However, the topological parameter (DoN) shows a certain relation with the pipe criticality depending on the network type. For verification of the proposed indexes, a comparison test with the well-known RI was conducted. Both results indicate similar patterns and commonly identify the critical pipes. It is noteworthy that the proposed indexes quantify four distinct aspects of WDNs service, while the RI only deals with the hydraulic performance. Thus, the proposed indexes are likely to improve the criticality assessment of a pipe network.
The proposed element-based simulation approach can be used to identify the critical pipes in a network, and using this information, the area with a high maintenance priority can be determined to maintain network function. Overall, the proposed element-based index can be utilized to setup maintenance scheduling for preparedness of potential failure events. The proposed approach can be further improved for assessment of other components in WDNs, and various operation aspects can also be added in future development.

Author Contributions

Conceptualization, M.S.M. and D.K.; methodology, M.S.M.; software, M.S.M. and G.J.; investigation and data analysis, M.S.M., G.J., and D.K.; writing—original draft, M.S.M. and G.J.; writing—review and editing, M.S.M., G.J., and D.K.

Funding

This work was supported by (1) the Korea Environment Industry & Technology Institute (KEITI) through the Advanced Water Management Research Program, funded by the Korea Ministry of Environment (Grant 83079) and (2) the EDISON* Program through the National Research Foundation of Korea (NRF) funded by the Ministry of Science, ICT & Future Planning (2017M3C 1A6075016). *Education-research Integration through Simulation On the Net.

Conflicts of Interest

The authors declare no conflict of interest.

References

  1. Jun, H.; Loganathan, G.V.; Kim, J.H.; Park, S. Identifying pipes and valves of high importance for efficient operation and maintenance of water distribution systems. Water Resour. Manag. 2008, 22, 719–736. [Google Scholar] [CrossRef]
  2. Wagner, J.M.; Shamir, U.; Marks, D.H. Water distribution reliability: Simulation methods. J. Water Resour. Plan. Manag. 1988, 114, 276–294. [Google Scholar] [CrossRef]
  3. Mays, L.W. Reliability analysis of water distribution systems. Reliab. Anal. Water Distrib. Syst. 1989, 120, 472–532. [Google Scholar]
  4. Su, Y.C.; Mays, L.W.; Duan, N.; Lansey, K.E. Reliability based optimization model for water distribution systems. J. Hydraul. Eng. 1987, 113, 1539–1556. [Google Scholar] [CrossRef]
  5. Fujiwara, O.; Tung, H. Reliability improvement for water distribution networks through increasing pipe size. Water Resour. Res. 1991, 27, 1395–1402. [Google Scholar] [CrossRef]
  6. Khomsi, D.; Walters, G.A.; Thorley, A.R.D.; Ouazar, D. Reliability tester for water distribution networks. J. Comput. Civ. Eng. 1996, 10, 10–19. [Google Scholar] [CrossRef]
  7. Xu, C.; Goulter, C. Reliability-based optimal design of water distribution networks. J. Water Resour. Plan. Manag. 1999, 125, 352–362. [Google Scholar] [CrossRef]
  8. Shi, P. Seismic Response Modeling of Water Supply Systems. Ph.D. Thesis, Cornell University, Ithaca, NY, USA, January 2006. [Google Scholar]
  9. Todini, E. Looped water distribution networks design using a resilience index based heuristic approach. Urban Water 2000, 2, 115–122. [Google Scholar] [CrossRef]
  10. Prasad, T.D.; Park, N.S. Multiobjective genetic algorithms for design of water distribution networks. J. Water Resour. Plan. Manag. 2004, 130, 73–82. [Google Scholar] [CrossRef]
  11. Jayaram, N.; Srinivasan, K. Performance-based optimal design and rehabilitation of water distribution networks using life cycle costing. Water Resour. Res. 2008, 44. [Google Scholar] [CrossRef]
  12. Jeong, G.; Wicaksono, A.; Kang, D. Revisiting the resilience index for water distribution networks. J. Water Resour. Plan. Manag. 2017, 143, 04017035. [Google Scholar] [CrossRef]
  13. Cabrera, E.; Pardo, M.A.; Cobacho, R.; Cabrera, E., Jr. Energy audit of water networks. J. Water Resour. Plan. Manag. 2010, 136, 669–677. [Google Scholar] [CrossRef]
  14. Cabrera, E.; Gómez, E.; Cabrera, E., Jr.; Soriano, J.; Espert, V. Energy assessment of pressurized water systems. J. Water Resour. Plan. Manag. 2014, 141, 04014095. [Google Scholar] [CrossRef]
  15. Dziedzic, R.M.; Karney, B.W. Energy Metrics for Water Distribution Assessment. In Proceedings of the 46th Annual Stormwater and Urban Water Systems Modeling Conference, Brampton, ON, Canada, 2013. [Google Scholar] [CrossRef]
  16. Hashemi, S.; Filion, Y.R.; Speight, V.L. Pipe-level energy metrics for energy assessment in water distribution networks. Procedia Eng. 2015, 119, 139–147. [Google Scholar] [CrossRef]
  17. Alsaqqar, A.S.; Khudair, B.H.; Ali, S.K. Evaluating water stability indices from water treatment plants in Baghdad City. J. Water Resour. Prot. 2014, 6, 1344. [Google Scholar] [CrossRef]
  18. Mortula, M.M.; Ali, T.A.; Sadiq, R.; Idris, A.; Al Mulla, A. Impacts of Water Quality on the Spatiotemporal Susceptibility of Water Distribution Systems. CLEAN Soil Air Water 2019, 47, 1800247. [Google Scholar] [CrossRef]
  19. Renzetti, S. The Economics of Water Demands; Springer Science & Business Media: Berlin/Heidelberg, Germany, 2012; Volume 22. [Google Scholar]
  20. Walski, T.M.; Pelliccia, A. Economic analysis of water main breaks. J. Am. Water Works Assoc. 1982, 74, 140–147. [Google Scholar] [CrossRef]
  21. American Water Works Association. Effects of Water Age on Distribution System Water Quality; American Water Works Association: Denver, CO, USA, 2002. [Google Scholar]
  22. Van Rossum, G.; Drake, F.L., Jr. Python Reference Manual; Centrum voor Wiskunde en Informatica: Amsterdam, The Netherlands, 1995. [Google Scholar]
  23. Pathirana, A. Epanet 2.0 Python Calling Interface. 2018. Available online: https://pypi.org/project/EPANETTOOLS/ (accessed on 25 March 2019).
  24. Pathirana, A. EPANET2 Desktop Application for Pressure Driven Demand Modeling. ASCE Conf. Proc. 2010, 425, 65–74. [Google Scholar] [CrossRef]
Figure 1. Flowchart of the calculation steps.
Applsci 09 04052 g001
Figure 2. Layout of the networks.
Applsci 09 04052 g002
Figure 3. Critical pipe assessment for (a) supply shortage (SS), (b) economic value loss (EVL), (c) pressure decline (PD), (d) water age degradation (WAD), and (e) OVERALL of Network 1.
Applsci 09 04052 g003
Figure 4. Critical pipe assessment for (a) supply shortage (SS), (b) economic value loss (EVL), (c) pressure decline (PD), (d) water age degradation (WAD), and (e) OVERALL of Network 2.
Applsci 09 04052 g004aApplsci 09 04052 g004b
Figure 5. Critical pipe assessment for (a) supply shortage (SS), (b) economic value loss (EVL), (c) pressure decline (PD), (d) water age degradation (WAD), and (e) OVERALL of Network 3.
Applsci 09 04052 g005
Figure 6. Critical pipe assessment for (a) supply shortage (SS), (b) economic value loss (EVL), (c) pressure decline (PD), (d) water age degradation (WAD), and (e) OVERALL of Network 4.
Applsci 09 04052 g006
Figure 7. Pressure distributions of (a) Network 1 and (b) Network 2.
Applsci 09 04052 g007
Figure 8. Comparison of the OVERALL criticality with (a) supply shortage (SS), (b) economic value loss (EVL), (c) pressure decline (PD), and (d) water age degradation (WAD) for Networks 1 and 2.
Applsci 09 04052 g008
Figure 9. Relation of OVERALL criticality with (a) diameter, (b) flowrate, and (c) DoNpipe for Network 1.
Applsci 09 04052 g009
Figure 10. Relation of OVERALL criticality with (a) diameter, (b) flowrate, and (c) DoNpipe for Network 2.
Applsci 09 04052 g010
Figure 11. Comparison of the four criticality indexes with Resilience Index (RI) for Network 1.
Applsci 09 04052 g011
Figure 12. Comparison of the four criticality indexes with Resilience Index (RI) for Network 2.
Applsci 09 04052 g012
Table 1. Network parameters.
Network IDNo. of NodesNo. of PipesDegree of Node (DoNsys)Inflow (m3/h)Average Node Demand (m3/h)Average Pressure Head (m)
12132762.591164.45.5213.6
2891032.31329.63.7529.8
3991262.55244.32.4914.2
41041202.67262.12.5419.8

