Featured Application
Low-cost MEMS (Micro Electro-Mechanical Systems) accelerometers are very interesting sensors with which to monitor land and infrastructure. The synergy between accelerometers and low-cost GNSS (Global Navigation Satellite System) receivers represents both an interesting topic and a highly promising technique for monitoring angular and linear deformations through an integrated approach.
Abstract
Observation and monitoring of landslides and infrastructure is a very important basis for land planning, human activities, and safety. Geomatic techniques for deformation monitoring have usually involved GNSS and total station measurements or, more generally, expensive geodetic instruments, but other techniques, such as SAR (Synthetic Aperture Radar), can be efficiently applied. Using low-cost sensors could be an interesting alternative solution if the accuracy requirements can be satisfied. This paper shows the results obtained for tilt measurements using MEMS accelerometers, which were combined with mass-market GNSS sensors for monitoring five sites located on landslides. The use of a MEMS-like inclinometer requires an important calibration process to remove bias and improve the solution’s accuracy. In this paper, we explain the MEMS calibration procedure employed, with a simple and cheap solution. The results indicate that with a simple calibration, it is possible to improve measurement accuracy by one order of magnitude, reaching an angular accuracy of a few hundredths of a degree, verified by an independent technique.
1. Introduction
The measurement and monitoring of landslide or infrastructure tilt, together with position variation monitoring, is an important feature of deformation control [1] that is usually detected with GNSS or total station instruments. Displacements are also usually monitored with total stations and GNSS receivers [2], but other techniques, such as SAR, can be efficiently applied [3]. It may be useful to measure the variations in the inclination of a structure or rock mass or the support of a GNSS antenna with independent instruments. For example, if the GNSS antenna is placed on high poles to avoid surrounding obstacles, its inclination gives erroneous indications about the movement of the ground at the base. Complete information about a structure’s movements can be obtained using both GNSS displacements and tilt measurements.
Low-cost inclination sensors generally have very large systematic errors, with a very variable range from sensor to sensor. If these errors are stable over time, their individual calibration can improve the accuracy obtained by one or two orders of magnitude. A number of methods are possible for obtaining the tilt measurements—one of these is based on electronic levels. We can see one example in Microplan levels [4]. These levels use a pendular device in an oil bath, which provides high accuracy and resolution, even up to one microradiant, but inside a modest operative range (a few arc minutes). The devices are mainly used in closed environments, as their use is unsuitable in open environments with strong temperature variations.
Another tilt-measuring instrument is the gyroscope. The angle is obtained by integrating the angular velocity ω over time. An uncompensated bias in the angular velocity causes a linear drift in the angular measurement. The solution cannot therefore be maintained for a long time with high accuracy [5,6].
A different approach to tilt measurements uses an accelerometer, which is able to measure acceleration through the forces acting on a known mass. In the absence of external accelerations, the only force measured is the acceleration due to gravity. Sensors based on micro-electro-mechanical systems (MEMSs) have recently been developed, which can provide a low-cost solution and are already commonly used in inertial navigation systems (INSs).
In this paper, we analyse only the use of the accelerometer as a tilt measuring device. MEMSs are commonly produced using silicon components, which possesses significant electrical and mechanical advantages over other materials [5,7]. Unfortunately, a variety of systematic errors affects the performance characteristics of these accelerometers. Section 2 describes the operating principles of MEMS accelerometers, Section 3 introduces calibration methods to reduce their systematic errors, and Section 4 describes the instruments used and the results of the calibration of eight MEMS accelerometers. Section 5 introduces an independent method to verify the tilt accuracy based on angular measurements using a total station. Section 6 shows an application installed integrally with the ground planes of six GNSS antennas. Finally, the conclusions follow in Section 7.
2. Principles of Acceleration Measurement and Application to Tilt Measurement
In most accelerometer sensors, the operating principle is the same: the detection of inertia, i.e., the resistance to motion variation of a mass subjected to acceleration. The mass is suspended on an elastic spring, while some type of sensor detects its displacement with respect to the fixed structure of the device. For a conceptual diagram of a 3D mechanical accelerometer, we can use a sphere in the center of a cube, suspended by three springs (Figure 1). Moving the cube in space, the sphere will move inside, stretching and compressing the springs holding it in place. Measurement of the degree of compression of the springs makes it possible to determine whether there has been an acceleration and to quantify this in value and direction with respect to a reference body system.
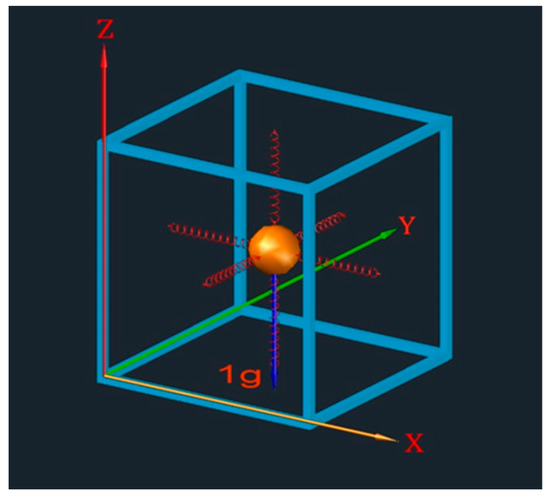
Figure 1.
Conceptual scheme of a thee-axis accelerometer.
A capacitive accelerometer uses, as a principle for detecting mass displacement, the variations in measurable capacity and voltage between its armatures under the effect of movement due to the acceleration of the proof mass.
We can write the linear law that links the displacement x between the armatures, with respect to the initial distance d, with the variation of capacity ΔC and the voltage VX compared to the initial values C0 and V0 [5,8]:
The displacement x is proportional to the force F through the elastic constant k:
If the body is subject only to the force of gravity, a triaxial accelerometer can measure the direction of the tilt angles Ω and Φ, or their composition Ψ, through measuring the three components of acceleration Ax, Ay, and Az.
The tilt components can be obtained with the classic method of converting from rectangular to spherical polar coordinates (4) (Figure 2). It is not possible, though, to determine the yaw angle in this way.
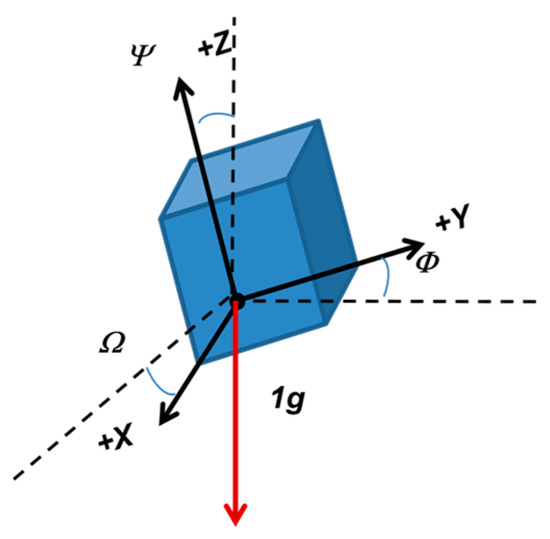
Figure 2.
Scheme of triaxial accelerometer.
Based on the electrical response generated, there are two families of accelerometers [9]: AC response (analog) and DC response (digital). DC accelerometers can also give zero Hz responses and can therefore be used both for static and dynamic measurements.
The monitoring of the angular values with acceleration measurements is theoretically independent of time, as it does not require integrations as in the case of gyroscopes. This makes the accelerometric angular measurement time-independent.
3. Calibration with the Six-Faces Method
The performance characteristics of accelerometers are affected by a variety of errors. Most errors can be classified into: sensor bias, scale factor, axes misalignment, and noise [10]. The calibration of these instruments is required to decrease the errors, as well as those in the INS-derived position, velocity, and attitude behaviours of moving platforms. The six-position static and rate tests are among the most commonly used [8,9] calibration methods. They require the inertial system to be mounted on a leveled surface, with each sensitive axis of every sensor pointing alternately up and down [11,12].
The error model can be expressed in the matrix form (5) through the calibration matrix E[ei,j].
In (5) the terms of the E matrix represent the following biases:
- The diagonal elements of the matrix are the scale factors of the three axes;
- Off-diagonal elements represent non-orthogonality factors or misalignment;
- The fourth column contains the translational bias values on the three axes.
lx, ly, and lz are the measures on the three axes, while tx, ty, and tz represent the theoretical values that these measures should have. For the six-faces calibration procedure, the six theoretical values are as follows [8,5]:
Equation (5) can be developed in this form:
If the instrument measurements are in “units of g”, then the terms in the matrix are all equal to ±1 or zero. The value ± indicates the positive or negative sign for the normal vector to the face in a concordant or discordant direction with respect to the gravity vector. We can write three of Equation (7) for each measure on each of the six faces. The redundant and linear system (7) in the 12 unknown parameters x can be synthetically rewritten:
where the A design matrix contains 0, 1, and ±g. The measured and known values of acceleration is the vector l0 and the vector v contains the residuals. Cll in (9) is the covariance matrix of the measurements. The least-squares solution [13] estimates the 12 calibration parameters with 18 measurement series in this way:
The variance-covariance matrix of the parameters is:
With:
where (n − r) is the global redundancy. In the absence of stochastic information on the measurement of accelerations, we set Cll = I. The 12 estimated parameters are then used to correct the measurements of the accelerometers, improving the accuracy of tilt measurements.
4. MEMS Sensor Features and Calibration Results
Particularly interesting are the features of TE Connectivity’s silicon MEMS DC model 4030 triaxial accelerometer, used for inclinometric measurements. The device has a small size and weight, is rugged and cheap (approx. €130), and is usually recommended for structural monitoring.
This device has a variable voltage output for each axis, from 0.5 to 4.5 V, which corresponds to a dynamic range of ±2 g. The value of 1 g corresponds to a voltage of 1000 mV and 90° tilt. It is possible to convert the voltages into acceleration and angular values on the three axes and determine the corresponding tilt values, under the hypothesis of linearity between voltage output and acceleration [14].
For example, if a sensitivity and angular accuracy of 1° is required for tilt measurements, a corresponding accuracy of 1000 mV/90° = 11.1 mV for degree is required. The residual noise of the 4030 inclinometer is declared by the manufacturer as RMS = 0.24 mV, which corresponds to a value in degrees equal to 0.24 mV × 1°/11.1 mV = 0.022°.
4.1. Calibration Experiments and Results
The six-faces test must be performed in strict compliance with the orthogonality conditions, which are not always guaranteed by the sensor casing. It is therefore necessary to verify, or mechanically realize, the supports to be used in the test with high precision mechanical machining. Figure 3 and Figure 4 shows the images of some planarity and orthogonality measurements, to the hundredth of a mm, on a calibration metallic box. The references for flatness and orthogonality were calibrated stone plates—to assure the horizontality of the surface, simple precision-level vials were used. On this support, the six faces of eight TE4030 accelerometers were tested, with fifteen minutes of acceleration data acquisition for each face. The 12 estimated least-squares parameters (9) were written in the calibration matrix with the conventions reported in (5). An example is shown in Table 1, and in Table 2 we can see the corresponding standard deviation, which is at least one order of magnitude lower than the obtained values. The raw acceleration values were therefore corrected with the calibration values through the inversion of the formula (5). After the application of these parameters, it is possible to compute the tilts of the sensor (Table 3) through the formulas (4).
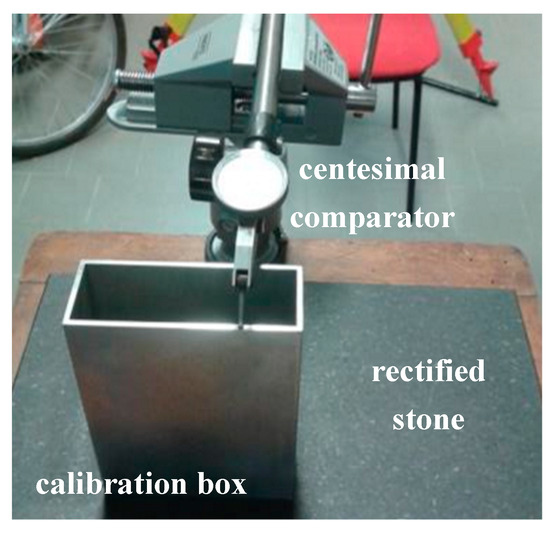
Figure 3.
Planarity and orthogonality test of the mechanical support for the six-faces test.
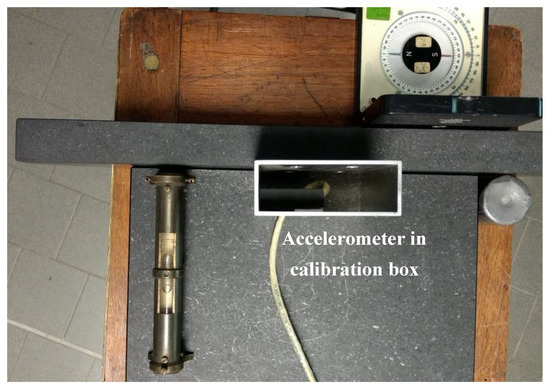
Figure 4.
The accelerometer inside a calibration box during the six-faces test.

Table 1.
The calibration matrix: scale factor in diagonal, translational bias in the last column. See (5).

Table 2.
Standard deviation of 12 calibration matrix parameters.

Table 3.
Raw calibrated acceleration values and tilts.
4.2. Some Considerations on the Calibration of a Family of TE4030 Sensors
The calibration values of the eight accelerometers and their RMS are reported in Table 4. They are very different from each other, for example, the scale factor of the three axes, i.e., the diagonal of the E matrix, varies from 10−1 to 10−3 but the value of their standard deviation has an order of magnitude of 10−5. Let us look for example at the accelerometer number two, which has lower calibration values, and the accelerometer number three with high values—the RMS of the 12 parameters are, however, of the same order of magnitude. Even the least square residuals are comparable (Figure 5 and Figure 6). Therefore, although the calibration parameters are very different from instrument to instrument, they can be correctly estimated.

Table 4.
The calibration matrix and RMS for eight accelerometers.
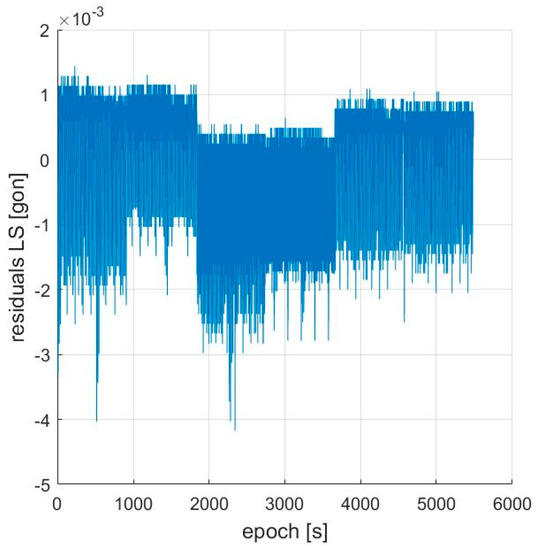
Figure 5.
LS (Least Square) residuals accelerometer ID2.
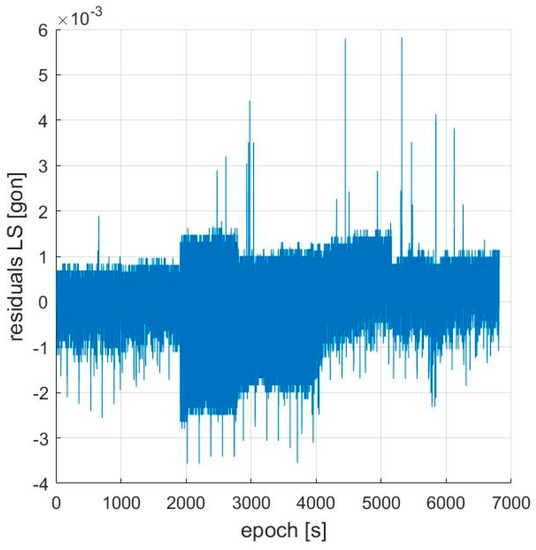
Figure 6.
LS (Least Square) residuals accelerometer ID3
It is clear that these low-cost sensors must be individually calibrated. The calibration procedure can be performed in a very simply way, starting from a rectified plane and a box with orthogonal walls. The acquisition procedures on the six faces are simple and the homemade software that produces the calibration matrix is immediately applicable. This “low-cost calibration” is suitable for these cheap sensors and can be performed by technical personnel, even those who are not particularly specialized. A robotized procedure that rotates the sensor on the six faces can be useful, but requires specific and sophisticated devices.
The accuracy obtained is a few hundredths of a gon and can be useful not only to monitor the verticality of the antenna support but also as an inclinometer, if compatible with geologically defined threshold values. No specific inclinations were required on the analyzed Madonna del Sasso site. The values recorded are not significant with respect to the accelerometer experimental accuracy. The tested accelerometer is suitable for monitoring inclinations with an accuracy of a few hundredths of a gon—in Figure 6, it is between −0.04 and +0.03 gon. Other accelerometers can be cheaper, like those inside smartphones and drones, but they are not rugged and can be problematic for very high or very low temperatures. The TE4030 is designed for outdoor use even in critical conditions (−40 + 85 °C) and also in winter or summer it continues to work properly.
5. Control of Accuracy Achieved with Total Station Measurements
To check the accuracy of the inclinometer in an independent way, the angular values calculated from the accelerations were compared with the reference values obtained with a total station with 0.2 mgon accuracy, to which the TE4030 sensor was fixed (Figure 5). By varying the elevation of the telescope, the zenith angle was compared with the value obtained from the inclinometer on each axis. The comparison was made for the angles computed with the accelerations before and after their calibration, to evaluate their impact on accuracy. In this procedure, the Y accelerometer axis is placed first, roughly in the direction of the collimation axis (a3), and then the X accelerometer axis is parallel on the secondary rotation axis (a2) (Figure 7).
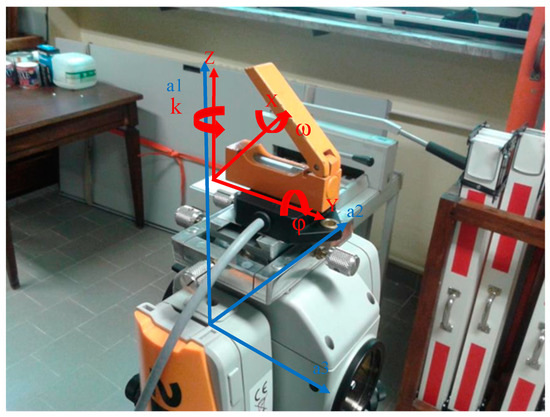
Figure 7.
Accuracy test: in red, the axis of the 4030; in blue, the axis of a total station.
These tests were performed by varying the inclination α of the telescope from −15 gon to +15 gon with constant intervals of 5 gon. Consequently, the ω inclination measurable by the accelerometer should mainly be of very similar values.
In fact, due to a few unavoidable mechanical misalignments, the accelerometer axis system (X, Y, Z) was not parallel to that of the total station (a1, a2, and a3). We labeled these angular misalignments with lowercase Greek letters: ω, φ, and, κ. Before performing this test, these values must first be estimated.
The values were therefore estimated at an elevation α = 15 gon of the telescope, the maximum tilt value of the tests. After these estimates, to impose the parallelism of the X and a3 axes and of the Y and a2 axes, we applied these rotations to transform the accelerometer system measurements to match the total station system measurements. This was achieved with the following transformation:
A “robust” procedure based on mobile median filtering with a window of 20 measurement epochs was used to remove gross errors during data acquisition.
The residuals between the tilt measurements from the accelerometer and the total station show values of a few hundredths of a gon (Figure 8). Note the great improvement of the calibrated data over the “raw” data with uncalibrated accelerations. The accuracy is improved by more than one order of magnitude—mean and standard deviation of the residuals are shown in Table 5.
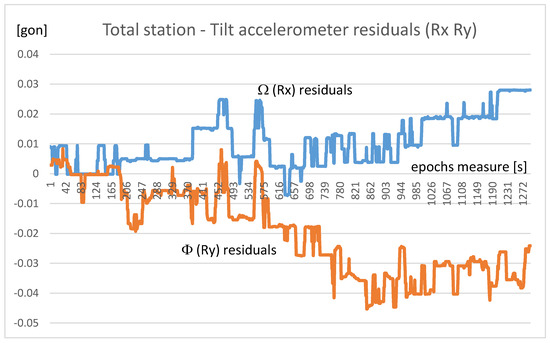
Figure 8.
Residual accelerometer tilt with respect to the angular measure of the total station.

Table 5.
Average error and standard deviation of tilt residues with respect to the total station.
6. Integration of Accelerometers into Prototype Monitoring Stations
The capacitive accelerometer used in this work displayed an accuracy for tilt measurements of 20 mgon (approximately 1.1 arc minutes, 0.3 mrad) (Table 4). It requires a calibration to remove bias and improve the accuracy of raw data by an order of magnitude. This accuracy level is consistent with the value declared by the manufacturer relative to the residual noise. The calibration of eight accelerometers of the same type show very different calibration values among them. Each accelerometer must therefore be individually calibrated.
In real time tilt monitoring operations, the voltage signal is converted to acceleration and angles. This requires linking the sensor to an interface that sends the data to a microcomputer.
To limit the system’s total cost, a control unit consisting of a NANO SG20-type PC and a wi-fi or GSM transmission unit (Figure 9) was created. These accelerometers are part of a more complex system that also integrates a single-frequency low-cost GNSS receiver, which allows a positioning accuracy of a few centimetres in real time, or better in post-processing, for monitoring slow surface deformations.
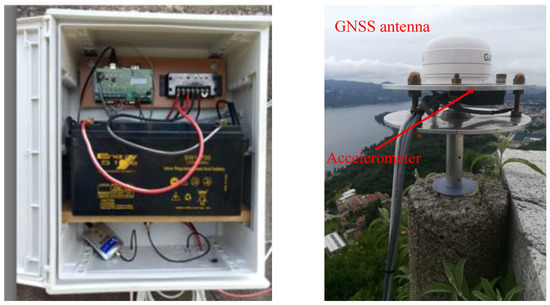
Figure 9.
Design and implementation of a multi-sensor control unit in a monitoring site.
In Figure 7, we observe the design and implementation of a multi-sensor monitoring system located on the “Madonna del Sasso” site (north of Piedmont, Italy). The mechanical support allows the GNSS antenna and the accelerometer to be installed with precision. The X axis of the accelerometer was oriented to the north to refer the tilt values measured in the north and east directions, such as the displacements obtained from the GNSS measurements.
The tilt values computed in real time are sent to a control center together with values of the external temperature, the humidity, and the voltage of the backup battery.
Tilt measurements can be difficult to perform in different ways, for example the multi-antenna GNSS systems are more complicated and less accurate.
These devices can be used to monitor the inclination of structures, rock masses, or simply, in our case, the inclination of the pillar on which the GNSS antenna is anchored.
The next steps of this research are further algorithm enhancements that include acceleration and GNSS measurements to improve system reliability.
7. Conclusions
Low-cost sensors can be used to monitor the movements and deformation of both land and sea structures. In particular, tilt measurements can be made inexpensively with an accuracy of a few hundredths of a degree with calibratable MEMS accelerometers in the laboratory. Each mass-market accelerometer needs an individual calibration.
This sensor can be an important part of a more complete monitoring system based on the integration of GNSS and other sensors. In this case, the inclinations serve to separate the movements of the antenna from the rotations of its support. In fact, in the prototype constructed for this work, the accelerometer was placed just below the GNSS antenna.
However, the triaxial accelerometer can also measure inclination changes in a landslide or an infrastructure, if it is attached to it. It is difficult to measure tilt variations with other geomatic techniques. A GNSS multi-receiver system is less practical, more expensive, and requires distancing the GNSS antennas to obtain a good angular accuracy.
The independent measurements of the inclinations using total station provided excellent and economic test results and, at the same time, verified that these biases do not vary over time.
The residuals of these comparisons can still be filtered, obtaining even better accuracy. For this purpose, the spikes still present in Figure 6 can easily be filtered by means of a robust filter at the price of obtaining a single, more accurate result, but with greater latency, every sixty seconds.
Author Contributions
The theoretical part of this work was developed by A.C. and A.M.M. and the experimental mechanic part by I.H.B.
Funding
This research was founded by CSI Piemonte.
Acknowledgments
We thank the research center and the “CSP–innovazione nelle ICT” center in Turin for the realization of the hardware and telecommunication components of the sensors.
Conflicts of Interest
The authors declare no conflict of interest.
References
- Spilotro, G.; Pellicani, R.; Canora, F.; Allasia, P.; Giordan, D.; Lollino, G. Evolution of techniques for monitoring unstable slopes. Ital. J. Eng. Geol. Environ. 2017, 17, 5–17. [Google Scholar]
- Fernández, J.; González-Matesanz, F.J.; Prieto, J.F.; Rodríguez-Velasco, G.; Staller, A.; Alonso-Medina, A.; Charco, M. GPS Monitoring in the N-W part of the volcanic Island of Tenerife, Canaries, Spain. Strategy and results. Pure Appl. Geophys. 2004, 161, 1359–1377. [Google Scholar] [CrossRef]
- Bru, G.; Escayo, J.; Fernández, J.; Iglesias, R.; Mallorquí, J.J.; Iglesias, R.; Sansosti, E.; Abajo, T.; Morales, A. Suitability assessment of X band A-DInSAR techniques for monitoring site scale slow moving landslides: The Leintz Gatzaga (Guipúzcoa, Spain) test-case. Remote Sens. 2018, 10, 936. [Google Scholar] [CrossRef]
- Microplan Group. Available online: http://www.microplan-group.com/it/prodotti/livelle-elettroniche.html (accessed on 18 July 2019).
- Wang, L.; Wang, F. Intelligent calibration method of low cost MEMS inertial measurement unit for an FPGA-based navigation system. Int. J. Intell. Eng. Syst. 2011, 4, 32–41. [Google Scholar] [CrossRef]
- Chatfield, A.B. Fundamentals of High Accuracy Inertial Navigation; American Institute of Aeronautics and Astronautics, Inc.: Reston, VA, USA, 1997; ISBN (print): 978-1-56347-243-5. eISBN: 978-1-60086-646-3. [Google Scholar]
- Jurman, D.; Jankovec, M.; Kamnik, R.; Topic, M. Calibration and data fusion solution for the miniature attitude and heading reference system. Sens. Actuators A Phys. 2007, 138, 411–420. [Google Scholar] [CrossRef]
- Titterton, D.H.; Weston, J.L. Strapdown Inertial Navigation Technology; Peter Peregrinus Ltd. on behalf of the Institution of Electrical Engineers: London, UK, 1997. [Google Scholar]
- DSPM Industria. Available online: http://www.dspmindustria.it. (accessed on 18 July 2019).
- Hou, H. Modeling Inertial Sensors Errors Using Allan Variance. Master’s Thesis, University of Calgary, Calgary, AB, Canada, 2004. [Google Scholar]
- Syed, Z.F.; Aggarwal, P.; Goodall, C.; Niu, X.; El-Sheimy, N. A new multi-position calibration method for MEMS inertial navigation systems. Meas. Sci. Technol. 2007, 18, 1897–1907. [Google Scholar] [CrossRef]
- Jeckely, C. Inertial Navigation Systems with Geodetic Applications; De Gruyer: Berlin, Germany, 2000; ISBN 13: 978-3110159035. [Google Scholar]
- Borre, K.; Strang, G. Linear Algebra, Geodesy and GPS; Wellesley Cambridge Press: Wellesley, MA, USA, 1997; ISBN-10: 0961408863. [Google Scholar]
- Fisher, J.C. AN-1057 Application Note. Analogic Devices. 2010. Available online: https://www.analog.com/media/en/technical-documentation/application-notes/AN-1057.pdf (accessed on 18 July 2019).
© 2019 by the authors. Licensee MDPI, Basel, Switzerland. This article is an open access article distributed under the terms and conditions of the Creative Commons Attribution (CC BY) license (http://creativecommons.org/licenses/by/4.0/).