Article

Nonlinear Refractive Index in Rectangular Graphene Quantum Dots

1
School of Physics and Electronic Information, Yunnan Normal University, Kunming 650500, China
2
Yunnan Key Laboratory of Opto-Electronic Information Technology, Kunming 650500, China
*
Author to whom correspondence should be addressed.
Appl. Sci. 2019, 9(2), 325; https://doi.org/10.3390/app9020325
Submission received: 18 December 2018 / Revised: 8 January 2019 / Accepted: 10 January 2019 / Published: 17 January 2019
(This article belongs to the Special Issue Graphene and Graphene-Based Composites for Electronics)

Abstract

:
Alongside its other favorable properties, the large refraction nonlinearity of graphene-related material makes it ideal for use in optoelectronics applications. Numerous experimental studies about nonlinear optical refraction have been conducted, but theoretical verification is lacking. In this paper the nonlinear refractive index for rectangular graphene quantum dots (RGQDs) was calculated using the relationship between nonlinear refractive index and the third-order nonlinear optical susceptibility. The third-order nonlinear optical susceptibility for third harmonic generation was derived employing the electronic states obtained from the Dirac equation around K point in RGQDs under hard wall boundary conditions. Results revealed that the calculated nonlinear refractive index, n 2 , was in the magnitude of 10−14 m2/W in the visible region, which is nearly five orders larger than conventional semiconductor quantum dots, while in the infrared region the nonlinear refractive index reached up to the magnitude of 10−11 m2/W for M = 3M0 sized RGQDs where the resonance enhancement occurred. The nonlinear refractive index could be tuned both by the edges and sizes.

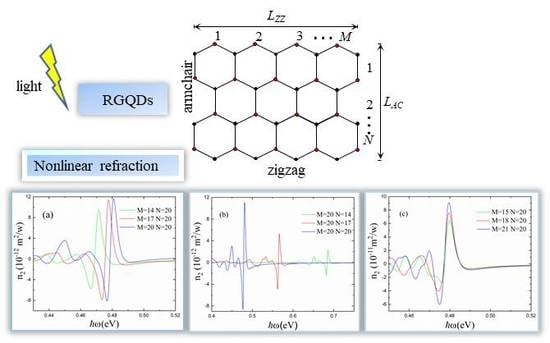
Graphical Abstract

1. Introduction

Graphene is comprised of a plane of carbon atoms arranged in honeycomb lattices, and has attracted intense attention due to its extraordinary physical and chemical properties [1,2,3]. The planar geometry of graphene is advantageous to the tailoring of various nanostructures, such as one-dimensional nanoribbons [4] and zero-dimensional quantum dots [5] with desired size, edge, and shape [6,7,8]. Due to the quantum size and edge effect, the tunable electronic and optical properties make the graphene-based nanostructures promising candidates for building blocks of future opto-electronic devices [9,10]. To this end, the integrability of the graphene quantum dot combined with its large refraction nonlinearity makes it ideal for use in several applications in optical communication and signal-processing [11].
Numerous experimental works have been conducted on the nonlinear refractive index in the graphene and related nanostructures. H. Zhang et al. showed that graphene possesses the giant nonlinear refractive index of n 2 ≃ 10−7 cm2 W−1, almost nine orders of magnitude larger than bulk dielectrics, using the Z-scan technique on loosely stacked few-layer graphene [12]. The spatial self-phase modulation was observed directly by G. Wang et al. when a focused He–Ne laser beam at 633 nm went through liquid-phase-exfoliated graphene dispersions [13]. They estimated the relative change of effective nonlinear refractive index by tuning the incident intensity or the temperature of the dispersions. By means of the ultrafast optical Kerr effect method coupled to optical heterodyne detection (OHD-OKE), E. Dremetsika’s group characterized the third-order nonlinear response of graphene and they estimated a negative nonlinear refractive index for monolayer graphene (i.e., n 2 ≃ −1.1 × 10⁻¹³ m2/W) [14].
To our knowledge, there have so far not been any theoretical calculations on the nonlinear refractive index in graphene and related nanostructures. In our previous work, we explored the two-photon absorption properties of RGQDs from the second-order perturbation theory with respect to the electron–photon interaction [15]. In this work, we report a simple theoretical calculation of the nonlinear refractive index for monolayer graphene with confining boundaries in the orthogonal directions of zigzag- and armchair-edge, which is an ideal object for us to investigate which edge plays a more important role in nonlinear refraction. Our derivation originates from the relationship between nonlinear refractive index n 2 , and the real part of the third-order nonlinear optical susceptibility χ ( 3 ) , which can be derived employing the electronic states obtained from the Dirac equation around the K point in RGQDs under hard-wall boundary conditions. The results revealed that the nonlinear refractive index n 2 for these sized RGQDs was in the magnitude of 10−14 m2/W in the visible region, which was nearly five orders larger than conventional semiconductor quantum dots. In the infrared band (~2500 nm), the nonlinear refractive index n 2 was up to 10−11 m2/W. We also found that the refractive index and the position of the refractive peak could be tuned by the sizes of both edges in RGQDs, especially the armchair-edge dimension. If we varied the size of the two edges, for non-3M0 sized RGQDs, the increase of the armchair-edge dimension brought a larger increment of refractive index than that of the zigzag-edge. There was a blue shift for the refractive peak when the size of zigzag-edge dimension increased while there was a distinct red shift when armchair-edge dimension increased. For RGQDs with M = 3M0, the peak value of nonlinear refractive index for M = 3M0 was nearly eight times of the case of M = 3M0 ± 1, because the resonance enhancement of electron transition occurred within the transitions between (1, n) states. The refractive peak did not move.

2. Theory and Calculation

In a system showing a negligible linear absorption (α0 ≈ 0), the nonlinear refractive index n 2 is proportional to the real part of the third-order nonlinear optical susceptibility χ ( 3 ) through the following expression in SI units [16]:
χ R ( 3 ) = ( 4 / 3 ) n 0 2 ε 0 c n 2 ,
where n0, ε0, and c denote, respectively, the linear refractive index of the material, the electric permittivity of free space, and the speed of light in vacuum. For the third harmonic generation effect, the resonant third-order susceptibility χ ( 3 ) ( 3 ω ) is given by [17,18]:
χ ( 3 ) ( 3 ω ) = D ε 0 μ 03 μ 32 μ 21 μ 10 × 1 ( ω 30 3 ω i Γ 30 ) ( ω 20 2 ω i Γ 20 ) ( ω 10 ω i Γ 10 )
where μ i j the dipole transition matrix element transited from ψ j state to ψ i state and μ i j = ψ i | e r | ψ j , the transition frequency ω i j = ( E i E j ) / ; D is the density of RGQDs, and Γ i j is the relaxation energy.
From Equations (1) and (2), it is found that the electronic energy states are the key for the calculation of nonlinear refractive index. We consider an isolated 2D confined graphene nanosheet with two orthogonal boundaries, which is shown in Figure 1a. The zigzag- and armchair-edge are referred to as the x- and y-axis, respectively, and thus the length of the edges can be calculated using the units M and N, respectively, by L Z Z = M a , L A C = ( N + 1 / 3 ) 3 a / 2 , where a = 2.46 Å is the lattice constant. Within the effective mass approximation, the Dirac equation of the electrons around the K = (4π/3a, 0) and K’ = (−4π/3a, 0) points in momentum space can be expressed as [19,20]:
H Ψ = v F ( 0 k x i k y 0 0 k x + i k y 0 0 0 0 0 0 k x + i k y 0 0 k x i k y 0 ) ( ψ A ψ B ψ A ψ B ) = E ( ψ A ψ B ψ A ψ B ) ,
where v F 1 × 10 6   m / s is the Fermi velocity at the Dirac points [15,21], and k x ( y ) = i x ( y ) is the small wavevector perturbations from K and K’ points. The electron band structure of the RGQD is studied by the effective mass model, which is reasonable to adopt since we are discussing the low-energy carrier states near the K and K’ Dirac points [22,23]. The total wave function Ψ (r) of the sublattice A and B mixed with wavefunctions of valley K and K’ is written as [23]:
{ Ψ A ( r ) = e i K · r ψ A ( r ) + e i K · r ψ A ( r ) Ψ B ( r ) = e i K · r ψ B ( r ) + e i K · r ψ B ( r ) .
The corresponding eigenenergy is given as:
E = ± v F | k | = ± v F k x 2 + k y 2 .
As for the RGQD structure mentioned above, the electron obeys the same Dirac equation, but different boundary conditions for zigzag-edge and armchair-edge [23,24]. For the zigzag edge along the x axis, the boundary conditions are given as:
{ Ψ A ( y = 0 ) = 0 Ψ B ( y = L A C ) = 0 ,
while for armchair-edge along the y axis, the boundary conditions are given as:
{ Ψ A ( x = 0 ) = Ψ A ( x = L Z Z ) = 0 Ψ B ( x = 0 ) = Ψ B ( x = L Z Z ) = 0 .
These boundary conditions were successfully used to work out the band structures of the graphene nanoribbons with different edges and the energy spectrum of RGQDs. They originate from the requirement that the electron probability amplitude at the hard wall around RGQDs must vanish [20]. Applying the above boundary conditions for a RGQD, we can solve Equation (3), the solution of which can be expressed as:
{ ψ A = Z e i k x x sin ( k y y ) ψ A = Z e i k x x sin ( k y y ) ,
and
{ ψ B = Z e i k x x sin ( θ k + k y y ) ψ B = Z e i k x x sin ( θ k + k y y ) ,
where θk = arctan(ky/kx), and Z is the normalization constant determined by the normalization condition [15]:
Z = [ 2 L Z Z L A C + L Z Z sin ( 2 θ k ) / k y ] 1 / 2 .
It can be seen from Equation (5) that the energy has the same linear dispersion relation as graphene. The difference of energy dispersions between 2D graphene and RGQDs is that the wave vectors around the K point are discrete in RGQDs, since they should satisfy the quantized condition [15]:
{ ( K 0 + k x ) L Z Z = m k π θ k + k y L A C = n k π ,
where m k and n k are integers. So, the energy levels are instead predicted to be discrete for the continuous energy band. We adopt the symbol (m, n) to present every electronic state, where m and n are determined by the orders of k x and k y , respectively.
After the obtainment of energy states of RGQDs, we can derive the dipole transition matrix element, with the assumption that the incident light polarization is along the y direction:
μ i j = ψ i | e r | ψ j = 0 L Z Z 0 L A C 4 e Z i Z j sin [ ( K 0 + k x i ) x ] sin [ ( K 0 + k x j ) x ] sin ( k y i y ) sin ( k y j y ) y d x d y + 0 L Z Z 0 L A C 4 e Z i Z j sin [ ( K 0 + k x i ) x ] sin [ ( K 0 + k x j ) x ] sin ( θ k i + k y i y ) sin ( θ k j + k y j y ) y d x d y = 4 e Z i Z j A 1 ( B 1 + B 2 )
with
A 1 = 1 / 2 L Z Z δ m i , m j 1 / 2 L Z Z δ m i , m j ,
B 1 = L A C 2 2 ( n i π θ i n j π + θ j ) [ sin ( n i π θ i n j π + θ j ) + cos ( n i π θ i n j π + θ j ) 1 n i π θ i n j π + θ j ] L A C 2 2 ( n i π θ i + n j π θ j ) [ sin ( n i π θ i + n j π θ j ) + cos ( n i π θ i + n j π θ j ) 1 n i π θ i + n j π θ j ]
and
B 2 = L A C 2 2 ( n i π θ i n j π + θ j ) 2 [ cos ( n i π n j π ) cos ( θ i θ j ) ] L A C 2 2 ( n i π θ i + n j π θ j ) 2 [ cos ( n i π + n j π ) cos ( θ i + θ j ) ]
The transitions can only occur when quantum numbers satisfy m i = ± m j .

3. Results and Discussion

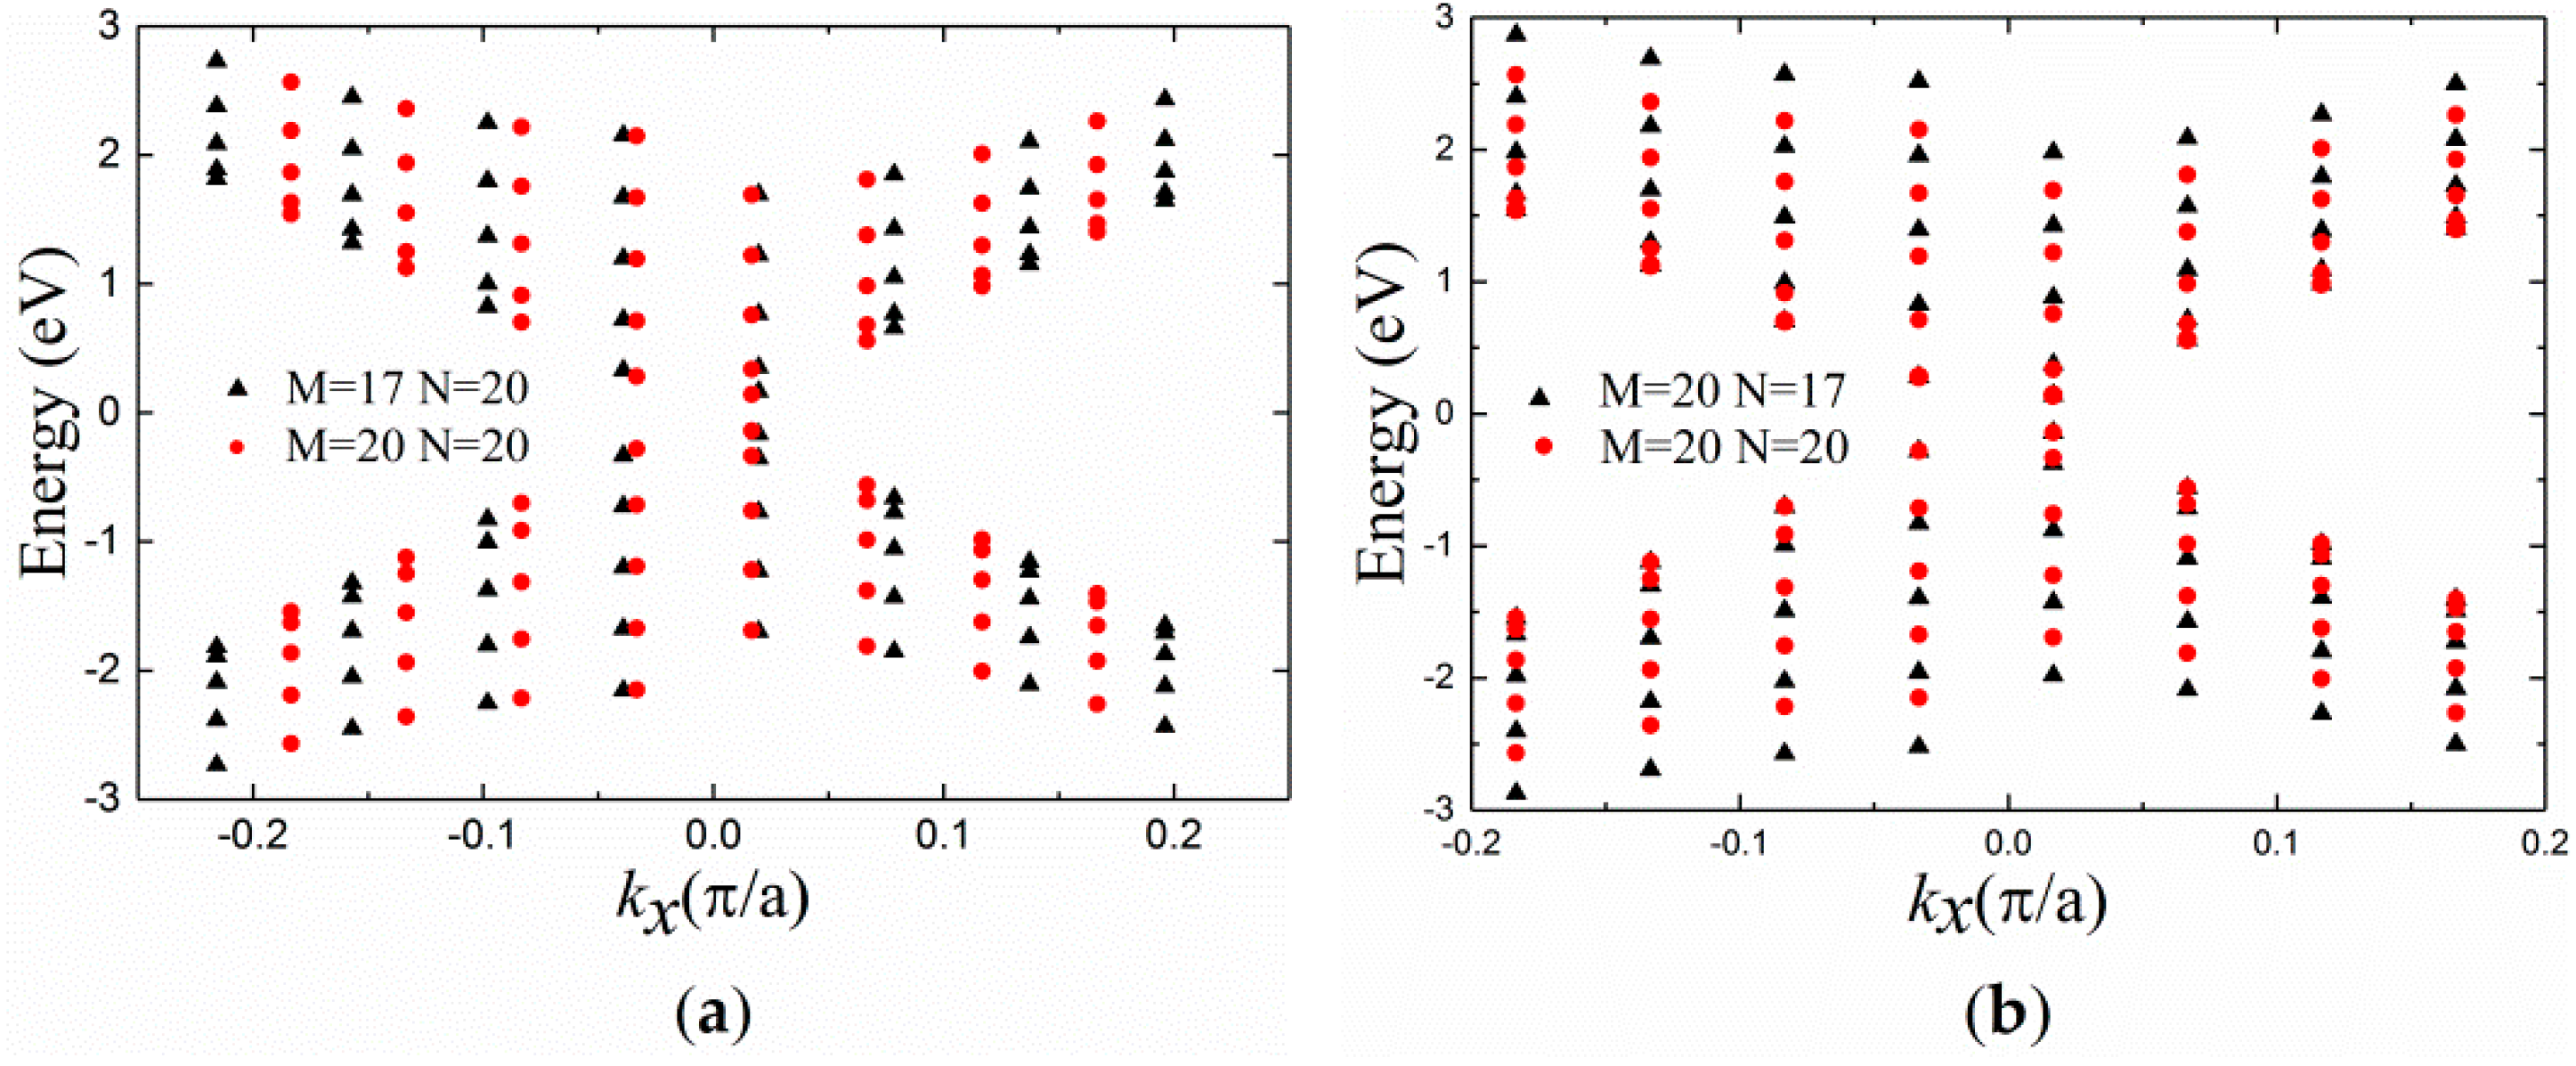
Following the analytical expressions derived above, we performed calculations to predict the nonlinear refractive index for RGQDs associated with intra conduction band transitions near the K point. In our calculations the following parameters were adopted: D = 3 × 1024 m−3, and Γ i j = 10 meV [15]. Firstly, we displayed the energy spectra of electrons and holes as a function of k x for RGQDs with different sizes in order to discuss how the size and edge influenced the energy levels. Figure 2a shows the energy levels of RGQDs for M = 17 and M = 20 with fixed N = 20. It could be seen that when we increased M, that is, the length of the zigzag dimension, the corresponding allowed value of k x changed and tended to be closer. Additionally, the energy levels moved to the lower energy direction. However, the energy level intervals increased slightly, in the magnitude of 10−2 eV. For N = 17 and N = 20 with fixed M = 20 in Figure 2b, k x did not change. The energy levels also moved to the lower energy direction since k y decreased, except for the lowest energy level in conduction band which remained the same, since k y = 0 there. So, the density of states increased. Conversely, where M = 17 and M = 20 with fixed N = 20, the energy level intervals decreased in the magnitude of 10−1 eV. The above two situations were both M = 3M0 ± 1 (M0 is an integer), in which the lowest energy was non–zero and the quantum dot was a semiconductor.
In the case of M = 3M0, we plotted the energy spectra in Figure 3. It was very different from the case of M = 3M0 ± 1. Firstly, the lowest energy of electron was zero, so it was metallic; secondly, the (1, n) states, that is, the states where k x = 0 , did not change once N was fixed even if M varied. For these states, ky = 0 or (l − 1/2)π/LAC with l an integer, the neighboring energy difference between (1, n) states kept the exact values: the energy difference between the lowest two states was ħvFπ/(2LAC) while ħvFπ/LAC for other neighboring states, and so, it provided the possibility for transition resonance.
After getting the energy states of RGQDs, we calculated the nonlinear refractive index for RGQDs with different sizes in order to explore the influence of the size and edge. Figure 4a,b shows the size-dependent nonlinear refractive index spectra of RGQDs with non-3M0 sizes as a function of incident photon energy, calculated by the theoretical model presented in the previous section. We could see that the peak value of nonlinear refractive index n 2 for these sized RGQDs was in the magnitude of 10−11 to 10−12 m2/W. If we varied the sizes, either armchair-edge dimension or zigzag-edge dimension, the peak value of n 2 increased. However, the amplitude of the increase contributed from the same three units was not the same. It was observed that the increase amplitude of n 2 was much larger when N increased every three units than that of M. This could be explained by the fact that the transition matrix element was proportional to LZZ while the square of LAC, which could be concluded from Equations (12)–(15). Additionally, the increase of the density of states for RGQDs with M = 20 and N = 14, 17, 20 that we mentioned previously was another important reason. In addition, it was obvious that there was a blue shift for the refractive peak when M increased, while there was a distinct red shift when N increased. This was due to the fact that the energy level intervals increased for N = 20 and M = 14, 17, 20, while they decreased for M = 20 and N = 14, 17, 20, which is mentioned above.
For 3M0-sized metallic RGQDs, we plotted the nonlinear refractive index spectra in Figure 4c for M = 15, 18, 21, and N = 20. Comparing Figure 4a with Figure 4c, we found that when the armchair-edge dimension was fixed at 20, the peak value of nonlinear refractive index for M = 3M0 was nearly eight times larger than the case of M = 3M0 ± 1. Furthermore, the refractive peak did not move once N was fixed. In Figure 4c we inserted the contributions from the transitions between (1, n) states, which played a dominant role in the refractive spectrum. These phenomena result from the uniformly spaced (1, n) states, where resonant transition enhancement occurred at around ħω = ħvFπ/(2LAC) and ħvFπ/LAC. The nonlinear refractive index values of both our theoretical calculations and other groups’ experimental measurements in related materials, such as conventional semiconductor quantum dot, 2D graphene, and transition metal dichalcogenides (TMDCs) are listed in Table 1 for comparison. The nonlinear refractive index of RGQDs was nearly five orders of magnitude greater than that of same-sized conventional semiconductor QDs in the visible region. The giant discrepancy was due to the relatively uniform energy levels in RGQDs, which could bring the transition resonance. Comparing RGQDs with layered graphene and TMDCs in the visible region, the magnitude of nonlinear refractive index for RGQDs was 1–3 orders lower. In the infrared region, the n 2 in RGQDs, especially with 3M0 size, was nearly 2–3 orders higher than that of TMDCs, and several times of that in 2D graphene in the visible band.

4. Conclusions

In this paper, we derived the nonlinear refractive index n 2 which is proportional to the real part of the third-order nonlinear optical susceptibility χ(3), starting from solving the electronic Dirac equation in momentum space analytically under hard-wall boundary conditions for different edges. The results revealed that the nonlinear refractive index n 2 for these sized RGQDs was in the magnitude of 10−14 m2/W in the visible region and 10−11 m2/W in the infrared region. For non-3M0 sized RGQDs, with the increase of the size—in either armchair-edge dimension or zigzag-edge dimension—the peak value of n 2 increased. However, the increase of armchair-edge dimension contributed much more. There was also a blue shift for the refractive peak when M increased, while there was a distinct red shift when N increased. For an RGQD with M = 3M0, the nonlinear refractive index was enhanced several times compared to that of M = 3M0 ± 1, and there was no peak shift. We gave explanations to these phenomena, including different peak shift directions, peak value increase, and so on, by the quantized energy level interval, as well as the size-dependence of transition matrix element in RGQDs. These theoretical analyses are of great importance to applications based on optical communication, as well as academic interest.

Author Contributions

All the authors have contributed equally to the conception and idea of the paper, implementing and analyzing the calculation methods, evaluating and discussing the calculation results, and writing and revising this manuscript.

Funding

This work was supported by the National Natural Science Foundation of China (NSFC) (Grant No. 11304275, 11764047) and Applied Basic Research Foundation of Yunnan Province (Grant No. 2017FB009). It was also supported in part by Candidate Talents Training Fund of Yunnan Province (Grant No. 2014HB010).

Conflicts of Interest

The authors declare no conflict of interest.

References

  1. Zhu, Y.; Murali, S.; Cai, W.; Li, X.; Suk, J.W.; Potts, J.R.; Ruoff, R.S. Graphene and graphene oxide: Synthesis, properties, and applications. Adv. Mater. 2010, 22, 3906–3924. [Google Scholar] [CrossRef] [PubMed]
  2. Geim, A.K. Graphene: Status and prospects. Science 2009, 324, 1530–1534. [Google Scholar] [CrossRef]
  3. Geim, A.K.; Novoselov, K.S. The rise of graphene. Nat. Mater. 2007, 6, 183–191. [Google Scholar] [CrossRef]
  4. Gunlycke, D.; Lawler, H.M.; White, C.T. Room-temperature ballistic transport in narrow graphene strips. Phys. Rev. B 2007, 75, 085418-1–085418-5. [Google Scholar] [CrossRef]
  5. Güttinger, J.; Stampfer, C.; Hellmüller, S.; Molitor, F.; Ihn, T.; Ensslin, K. Charge detection in graphene quantum dots. Appl. Phys. Lett. 2008, 93, 212102-1–212102-3. [Google Scholar] [CrossRef]
  6. Novoselov, K.S.; Geim, A.K.; Morozov, S.V.; Jiang, D.; Katsnelson, M.I.; Grigorieva, I.V.; Dubonos, S.V.; Firsov, A.A. Two-dimensional gas of massless Dirac fermions in graphene. Nature 2005, 438, 197–200. [Google Scholar] [CrossRef] [PubMed] [Green Version]
  7. Hiura, H. Tailoring graphite layers by scanning tunneling microscopy. Appl. Surf. Sci. 2004, 222, 374–381. [Google Scholar] [CrossRef]
  8. Zheng, X.T.; Ananthanarayanan, A.; Luo, K.Q.; Chen, P. Glowing graphene quantum dots and carbon dots: Properties, syntheses, and biological applications. Small 2015, 11, 1620–1636. [Google Scholar] [CrossRef] [PubMed]
  9. Tang, L.; Ji, R.; Cao, X.; Lin, J.; Jiang, H.; Li, X.; Teng, K.S.; Luk, C.M.; Zeng, S.; Hao, J.; et al. Deep ultraviolet photoluminescence of water-soluble self-passivated graphene quantum dots. ACS Nano 2012, 6, 5102–5110. [Google Scholar] [CrossRef]
  10. Sun, H.; Li, W.; Wei, W.; Qu, X. Recent advances in graphene quantum dots for sensing. Mater. Today 2013, 16, 433–442. [Google Scholar] [CrossRef]
  11. Thakur, S.; Semnani, B.; Majedi, A.H. Spectrally-dependent Z-scan measurement of the nonlinear refractive index of graphene. In Proceedings of the 2017 Photonics North, Ottawa, ON, Canada, 6–8 June 2017. [Google Scholar] [CrossRef]
  12. Zhang, H.; Virally, S.; Bao, Q.; Ping, L.K.; Massar, S.; Godbout, N.; Kochaert, P. Z-scan measurement of the nonlinear refractive index of graphene. Opt. Lett. 2012, 37, 1856–1858. [Google Scholar] [CrossRef] [PubMed]
  13. Wang, G.; Zhang, S.; Umran, F.A.; Cheng, X.; Dong, N.; Coghlan, D.; Cheng, Y.; Zhang, L.; Blau, W.J.; Wang, J. Tunable effective nonlinear refractive index of graphene dispersions during the distortion of spatial self-phase modulation. Appl. Phys. Lett. 2014, 104, 141909-1–141909-5. [Google Scholar] [CrossRef]
  14. Dremetsika, E.; Dlubak, B.; Gorza, S.P.; Ciret, C.; Martin, M.B.; Hofmann, S.; Seneor, P.; Dolfi, D.; Massar, S.; Emplit, P.; et al. Measuring the nonlinear refractive index of graphene using the optical Kerr effect method. Opt. Lett. 2016, 41, 3281–3284. [Google Scholar] [CrossRef] [PubMed]
  15. Feng, X.; Qin, Y.; Liu, Y. Size and edge dependence of two-photon absorption in rectangular graphene quantum dots. Opt. Express 2018, 26, 7132–7139. [Google Scholar] [CrossRef] [PubMed]
  16. Coso, R.; Solis, J. Relation between nonlinear refractive index and third-order susceptibility in absorbing media. J. Opt. Soc. Am. B 2004, 21, 640–644. [Google Scholar] [CrossRef] [Green Version]
  17. Liu, L.; Li, J.; Xiong, G. Studies of the third-order nonlinear optical susceptibility for InxGa1−xN/GaN cylinder quantum dots. Physica E 2005, 25, 466–471. [Google Scholar] [CrossRef]
  18. Shen, Y.R. The Principles of Nonlinear Optics; John Wiley & Sons: New York, NY, USA, 1984; pp. 13–41. ISBN 978-0-471-43080-3. [Google Scholar]
  19. Ando, T.; Nakanishi, T. Impurity Scattering in Carbon Nanotubes Absence of Back Scattering. J. Phys. Soc. Jpn. 1998, 67, 1704–1713. [Google Scholar] [CrossRef]
  20. Tang, C.; Yan, W.; Zheng, Y.; Li, G.; Li, L. Dirac equation description on the electronic states and magnetic properties of a square graphene quantum dots. Nanotechnology 2008, 19, 435401-1–435401-10. [Google Scholar] [CrossRef]
  21. Castro Neto, A.H.; Guinea, F.; Peres, N.M.R.; Novoselov, K.S.; Geim, A.K. The electronic properties of graphene. Rev. Mod. Phys. 2009, 81, 109–162. [Google Scholar] [CrossRef] [Green Version]
  22. Suzuura, H.; Ando, T. Phonons and electron-phonon scattering in carbon nanotubes. Phys. Rev. B 2002, 65, 205412-1–205412-15. [Google Scholar] [CrossRef]
  23. Qian, J.; Dutta, M.; Stroscio, M.A. Phonon bottleneck effects in rectangular graphene quantum dots. J. Comput. Electron. 2012, 11, 293–301. [Google Scholar] [CrossRef]
  24. Fang, T.; Konar, A.; Xing, H.; Jena, D. Mobility in semiconducting graphene nanoribbons: Phonon, impurity, and edge roughness scattering. Phys. Rev. B 2008, 78, 205403-1–205403-8. [Google Scholar] [CrossRef]
  25. Gong, H.M.; Wang, X.H.; Du, Y.M.; Wang, Q.Q. Optical nonlinear absorption and refraction of CdS and CdS-Ag core-shell quantum dots. J. Chem. Phys. 2006, 125, 024707-1–024707-4. [Google Scholar] [CrossRef] [PubMed]
  26. Yu, B.L.; Zhu, C.S.; Gan, F.X. Nonlinear optical absorption and refraction by CdTe microcrystals doped in glass. J. Appl. Phys. 2000, 87, 1759–1761. [Google Scholar] [CrossRef]
  27. Wang, K.P.; Feng, Y.Y.; Chang, C.X.; Zhan, J.X.; Wang, C.W.; Zhao, Q.Z.; Coleman, J.N.; Zhang, L.; Blau, W.J.; Wang, J. Broadband ultrafast nonlinear absorption and nonlinear refraction of layered molybdenum dichalcogenide semiconductors. Nanoscale 2014, 6, 10530–10535. [Google Scholar] [CrossRef] [PubMed]
  28. Zheng, X.; Zhang, Y.W.; Chen, R.Z.; Cheng, X.A.; Xu, Z.J.; Jiang, T. Z-scan measurement of the nonlinear refractive index of monolayer WS2. Opt. Express 2015, 23, 15616–15623. [Google Scholar] [CrossRef] [PubMed]
  29. Dong, N.N.; Li, Y.X.; Zhang, S.F.; Mcevoy, N.; Zhang, X.Y.; Cui, Y.; Zhang, L.; Duesberg, G.S.; Wang, J. Dispersion of nonlinear refractive index in layered WS2 and WSe2 semiconductor films induced by two-photon absorption. Opt. Lett. 2016, 41, 3936–3969. [Google Scholar] [CrossRef]
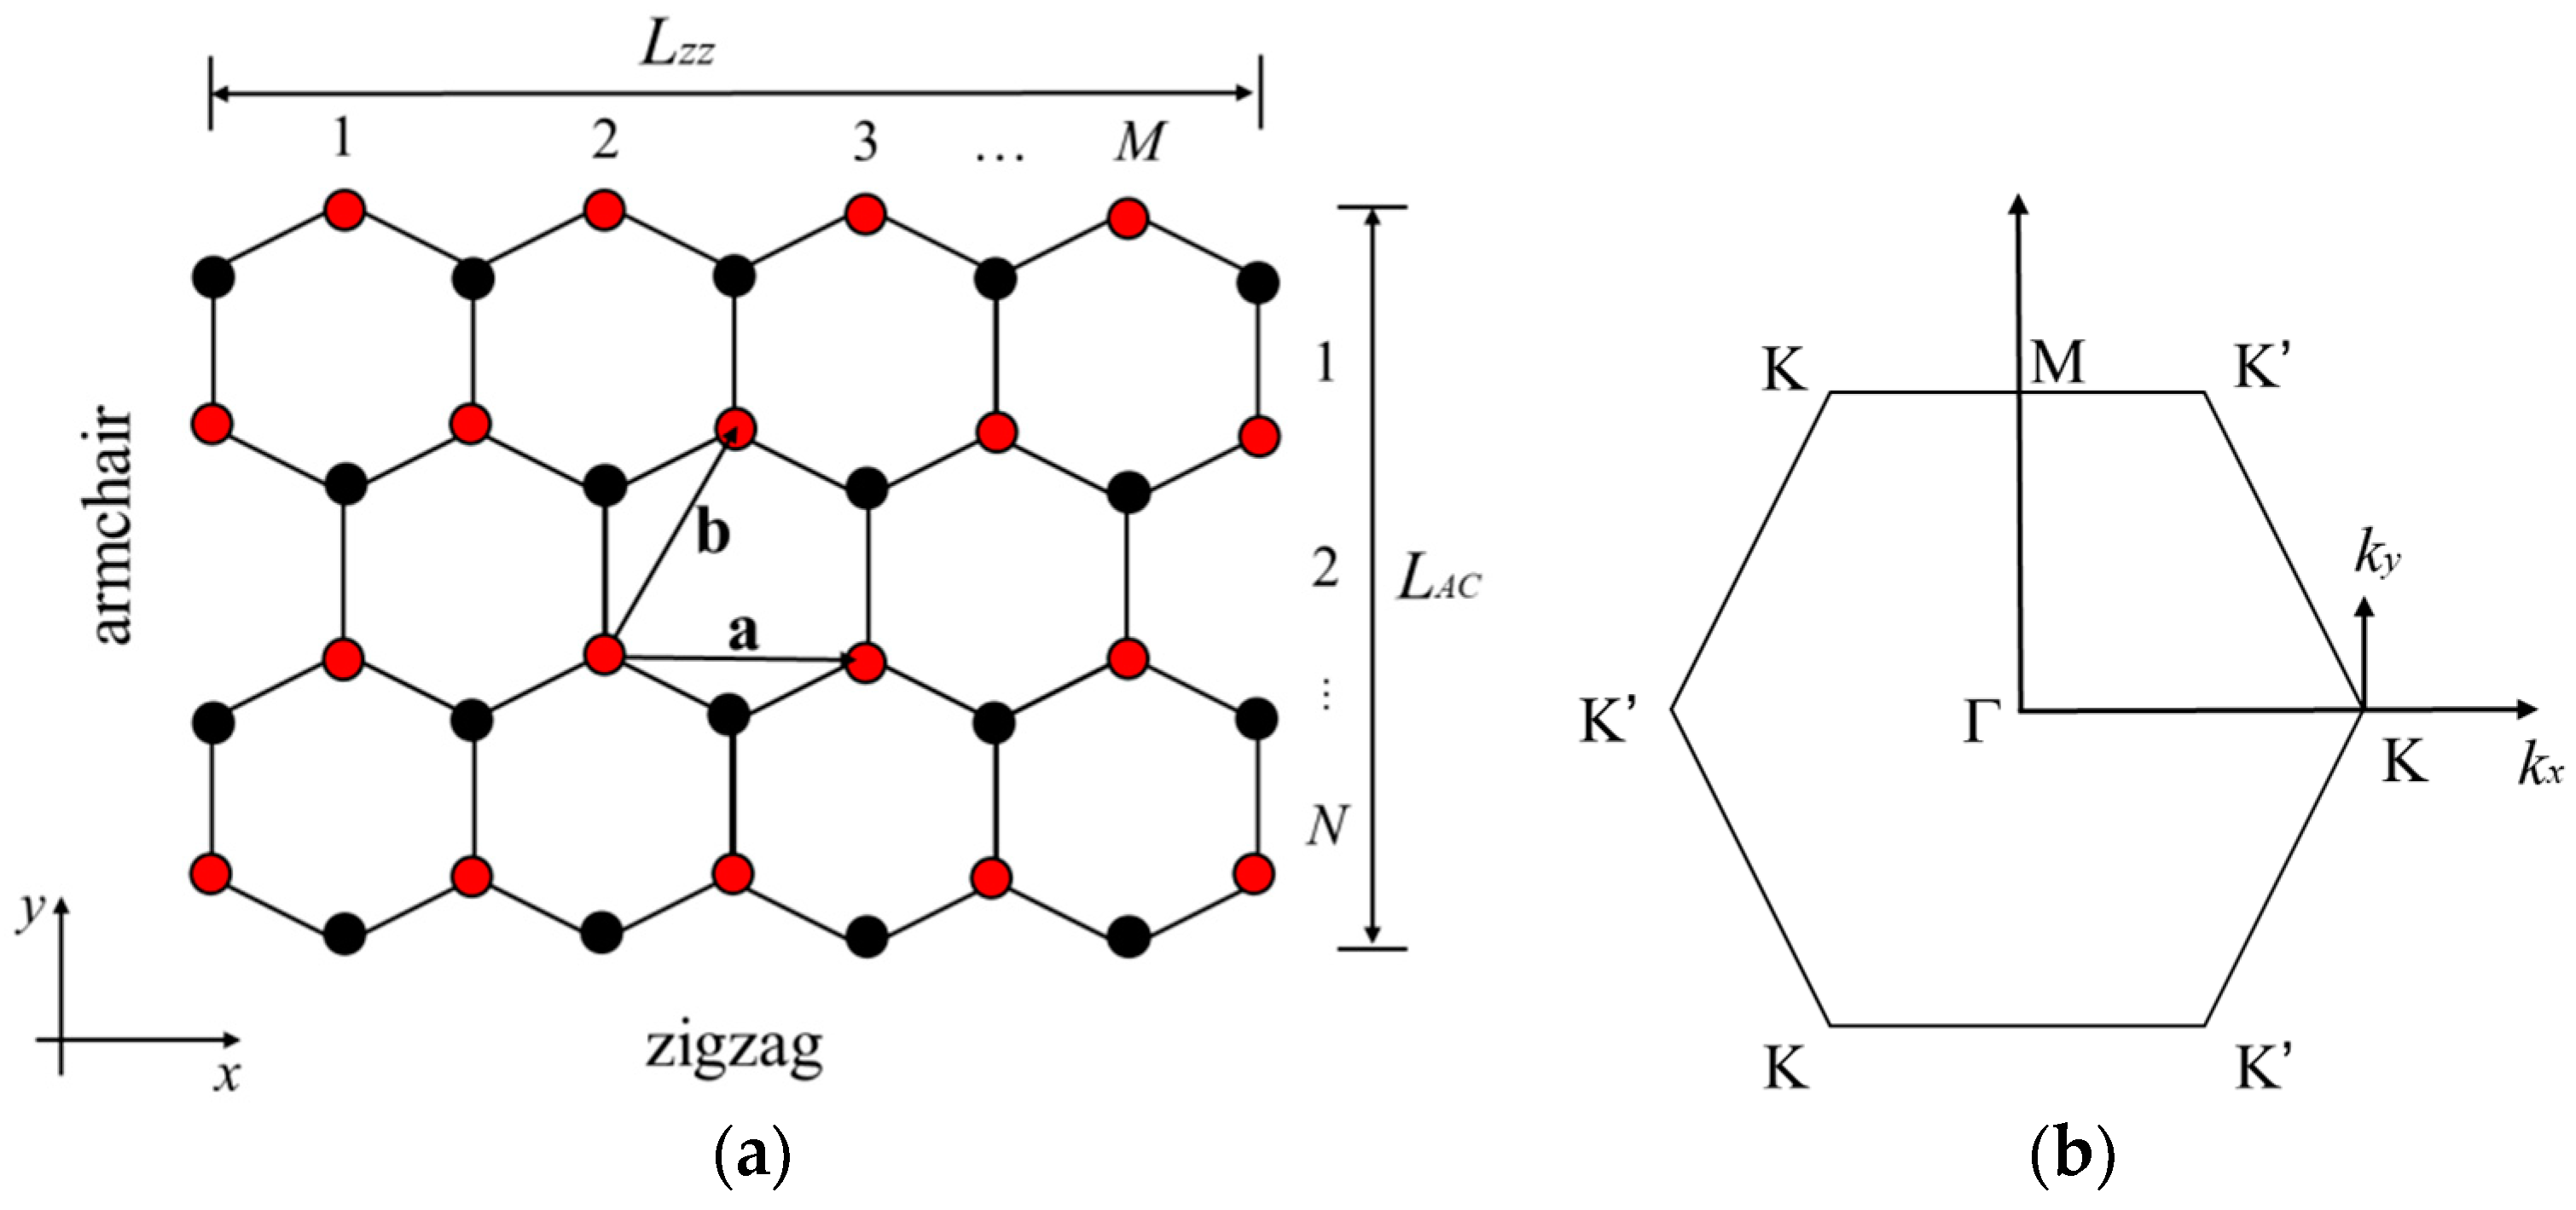
Figure 1. (a) Illustration of a monolayer rectangular graphene quantum dot (RGQD). The black and red circles are two types of carbon atoms, A and B. a and b are unit vectors. (b) The reciprocal lattice.
Applsci 09 00325 g001
Figure 2. Energy spectra of M = 3M0 ± 1 sized RGQDs as a function of kx. (a) RGQD with the sizes M = 17, 20, and fixed N = 20; (b) RGQD with the sizes N = 17, 20, and fixed M = 20.
Applsci 09 00325 g002
Figure 3. Energy spectra of 3M0 sized RGQDs as a function of kx.
Applsci 09 00325 g003
Figure 4. Nonlinear refraction spectra for different-sized RGQDs. (a) Non-3M0 sized RGQDs with the sizes M = 14, 17, 20, and fixed N = 20. (b) Non-3M0 sized RGQDs with the sizes N = 14, 17, 20, and fixed M = 20. (c) 3M0 sized RGQDs with the sizes M = 15, 18, 21, and fixed N = 20. The dashed line is the contribution from the transitions between (1, n) when M = 21 and N = 20.
Applsci 09 00325 g004
Table 1. Calculated n 2 in RGQDs and experimental data in other related materials for comparison.
MaterialsSize Wavelengthn2 (×10−12 m2/W)
(nm)ExperimentTheory
CdS QDs6.4 nm790 10−7 [25]
CdS-Ag QDs 10.1 nm790 −2.3 × 10⁻⁵ [25]
CdTe QDs20 nm1060 −6 × 10⁻⁵ [26]
Graphene1–6 layers 1550 10 [12]
monolayer1600 −1.1 × 10⁻¹ [14]
1050 1.7 [11]
1064 −13.7 [27]
532 −2.34 [27]
MoS2 1064 −(0.207 ± 0.021) [27]
532 −(2.5 ± 1.2) [27]
WS2monolayer800 0.8 [28]
0.75 nm thick1040 (1.28 ± 0.03) × 10−2 [29]
18.8 nm thick1040 (−8.55 ± 0.63) × 10−4 [29]
RGQDs6.4 nm × 6.4 nm790 −2.13 × 10⁻²
5.2 nm × 4.3 nm699 −1.75 × 10⁻²
5.2 nm × 4.3 nm1064 −6.33 × 10⁻²
3.4 nm × 4.3 nm2638 9.5
4.2 nm × 4.3 nm2594 11.4
4.9 nm × 4.3 nm2583 11.6
4.9 nm × 3.7 nm2175 5.24
3.7 nm × 4.3 nm2583 65.2
4.4 nm × 4.3 nm2583 75.9
5.2 nm × 4.3 nm2583 90.8