Article

The Characterisation and Quantification of Immobilised Concanavalin A on Quartz Surfaces Based on The Competitive Binding to Glucose and Fluorescent Labelled Dextran

by
Trinh Bich Hoang
1,
Bjørn Torger Stokke
1,2,
Ulrik Hanke
1,
Agne Johannessen
1 and
Erik Andrew Johannessen
1,*
1
Department of Microsystems, University of South-Eastern Norway, NO-3184 Borre, Norway
2
Department of Physics, Norwegian University of Science and Technology, NO-7491 Trondheim, Norway
*
Author to whom correspondence should be addressed.
Appl. Sci. 2019, 9(2), 318; https://doi.org/10.3390/app9020318
Submission received: 6 December 2018 / Revised: 8 January 2019 / Accepted: 11 January 2019 / Published: 17 January 2019
(This article belongs to the Special Issue Nano-Biointerface for Biosensing)

Abstract

:
The competition between various carbohydrates in the binding to Concanavalin A (Con A) can be exploited in gravimetric microsensors that detect changes in mass or viscoelasticity as a function of glucose concentration. Such sensors are based on the immobilisation of Con A as the ligand specific element, and a successful application requires that the binding property of Con A is retained. This paper presents a simplified immobilisation procedure of Con A on a quartz surface, a common material for gravimetric microsensors. Structural assessment with atomic force microscopy confirmed that the surface was covered with a layer of macromolecules. This layer shows the presence of entities of various sizes, presumably monomers, dimers and tetramers among which dimers of the Con A are the most dominant structure. Functional assessment using fluorescent labelled dextran (FITC and Alexa 488) suggests a surface coverage ranging from 1.8 × 10¹¹ to 2.1 × 10¹² immobilised fluorescent molecules per cm2. The assay was responsive to glucose over a concentration range from 0–40 mM, but became gradually saturated above 20 mM. Hence, the immobilised Con A is able to bind dextran, which is displaced by glucose in a concentration dependent manner, thus triggering a mass change proportional to the MW of dextran.

Graphical Abstract

1. Introduction

Concanavalin A (Con A) was first identified by Sumner and Howell in 1935 [1] and is a carbohydrate binding protein (lectin) that is extracted from the jack bean (Canavalia ensiformis). Lectins are storage proteins thought to form part of the passive defence systems of plants by exhibiting specific binding affinities to animal glycoproteins and thereby provoking a toxic response [2]. The lectin Con A binds specifically by hydrogen bonds to the 3rd, 4th and 6th carbon of the pyranosyl ring system of α-mannosyl, α-glycosyl and α-N-acetylglucosaminyl groups acting as the non-reducing termini of mono and polysaccharides [3]. This interaction has been exploited in various biological applications for example cell separation [4], immobilisation of micro-organisms [5], glycoenzyme separation [6], identification of carbohydrates [7], mapping of glycoconjugates [8] and the detection of viruses [9]. The specificity of Con A binding towards a selected group of carbohydrates have also been explored in biosensor applications, in which the lectin was incorporated as the primary ligand in the detection of biologically active metabolites. It is especially the binding affinity of the α-glycosyl group of glucose and dextran that have raised interest for use in glucose sensors based on the competitive binding between these two in their interaction with Con A [10,11,12,13]. Despite traditional enzyme sensors representing the state-of-the-art in glucose monitoring [14], they suffer from a degradation in enzyme activity [15], interfering electroactive compounds [16], changing hematocrit level [17], electrode fouling [18] and the requirement of mass transport control [19]. Although remedies have been sought to rectify parts of these challenges [20,21], lectin based sensors have the potential to bypass the drawbacks posed from the combination of enzymes with an electrochemical system. Work on non-enzymatic glucose sensors have explored the use of functionalised receptors made from carbon nanotubes [22], nanomaterials with enzyme like behaviour [23] and abiotic catalysts [24]. Inactive enzymes (e.g., apo-glucose oxidase) have been used as affinity receptors in “smart tattoos”-small capsules of glucose sensitive hydrogels that emit a shift in photoluminescence [25] as a function of glucose concentration, or in conjunction with gold nanoparticle probes that emit light through fluorescence resonance energy transfer [26]. However, non-enzymatic glucose sensors, smart tattoos and gold nanoprobes, are still at the proof of concept level and have not attained widespread commercial use.
A lectin-based sensor would require a transducer mechanism that conveys the signal by physical or optical means. One potent application permits the registration of small changes in mass or viscoelasticity associated with the binding of molecular species on a surface [27]. This form for gravimetric detection permits label free measurements of glucose to be performed without the use of any fluorophores. Moreover, the competitive binding between the smaller glucose (180 Da) and the larger dextran molecule (3–70 kDa) with Con A amplify the mass change on the surface making the accompanying change in the resonance frequency more easily detectable [28]. This change in resonance frequency can be monitored by quartz crystal microbalances (QCM) [12], acoustic Love wave (LW) resonators [29] or thin film bulk acoustic resonators (FBAR) [27]. These gravimetric sensors share a common trait of using silicon oxide based ceramics (silica, silicon dioxide, quartz) as their bulk and/or surface material, as well as the guiding layer modulating the entrapment and propagation of acoustic waves in LW devices. It is on this surface material that one of the components of the Con A affinity assay would need to be immobilised.
Immobilisation strategies described in prior art focus on immobilising dextran to the sensor surface with Con A and glucose being freely suspended in the surrounding solution [10,11,12,28]. In contrast, a direct immobilisation of Con A will reduce the amount of (expensive) protein used in the preparation of the biosensor as well as preventing any loss of this potential toxic molecule should the sensor membrane be compromised [30]. It will also permit the detection of any target molecules that are freely suspended in the surrounding environment should any related applications be explored. Although protocols for a direct immobilisation of Con A on the sensor surface exist [31,32] the immobilisation process may change the binding affinity of the protein [33]. It is therefore important to map the binding properties of any immobilized Con A as an integral part of the biosensor calibration.
The main variables which have to be taken into account considering immobilisation on silicon oxide based ceramics, is the surface roughness (effective surface area) and the number of oxygen molecules associated with Si (and the corresponding number of active bond sites available). The immobilisation starts with a silanisation process that forms an initial anchor point to the surface active OH groups. The choice of silane depends on the selection of the coupling group (e.g., amine, thiol, carboxylic acid) of the biomolecule to be immobilised and the type of crosslinker (homobifunctional or heterobifunctional) that is used [34]. The active group of Con A is an amine where both homobifunctional and heterobifunctional crosslinkers can be employed. Successful protocols exist for both silicon oxide based ceramics [35,36] and metal surfaces [31], although thiols are used at the initial attachment molecule for gold [37]. However, most immobilisation protocols involve elaborate steps and require the use of harmful chemicals [36].
In this paper, we present a simple and safe protocol for rapid Con A immobilisation on quartz surfaces based on the formation of a covalent linkage between the carboxylic acid on the immobilised silane (N-[(3-Trimethoxysilyl)propyl] ethylenediamine triacetic acid trisodium salt) and an amine group of Con A. The binding characteristics of carbohydrates to the immobilised lectin as well as its distribution per unit area was assessed by titration studies based on the competitive binding between glucose and fluorescent labelled dextran. The binding capacity of the immobilised Con A was quantitated based on the observed fluorescent intensity, whereas structural assessment was performed by atomic force microscopy (AFM). The latter approach was employed for monitoring changes in surface topography after each immobilisation step. This affinity assay will be suitable for implementation in a gravimetric glucose sensor based on acoustic wave resonators.

2. Materials and Methods

2.1. Materials and Characterisation Equipment

All materials are of analytical grade, and used without further purification. The following materials were purchased from Sigma Aldrich, St. Louis, Mo, USA: 98% sulfuric acid, H2SO4, (No. 435589), N-[(3-Trimethoxysilyl)propyl] ethylenediamine triacetic acid trisodium salt 3% (No. AB1114888), Boric acid powder (No. B6768), N-(3-Dimethylaminopropyl)-N-ethylcarbodiimide hydrochloride, EDAC, (No. 03449), 3-(N-morpholino) propanesulfonic acid, MOPS, (M3183), Concanavalin A extracted from C. ensiformis (No. C2010). The following materials were purchased from Merck Chemical, Darmstadt, Germany: 30% hydrogen peroxide, H2O2, (No. 107209), Methanol EMPLURA, MeOH, (No. 822283), 30% hydrochloric acid, HCl, (No. 100318), 96% acetic acid (No. 100062), calcium chloride dehydrate, CaCl2⋅2H2O, (No. 142000), manganese (II) chloride tetrahydrat (No. 105927). Single side polished ST-cut quartz wafers (3-inch), with an rms surface roughness of 0.6 nm was purchased from Roditi, London, U.K. Fluorescein isothiocyanate (FITC)–dextran with a molecular weight (MW) of 70 kDa (No. FD70S), and Alexa Fluor 488 dextran with a MW of 3 kDa, anionic (No. D34682) were obtained from Thermo Fisher Scientific (Life Technologies), Waltham, MA, USA.
The fluorescence imaging was performed with an inverted microscope (Olympus IX51, Tokyo, Japan) using an excitation filter BP460-490, beam splitter DM500 and a barrier filter BA520IF. The intensity of fluorescence emission was captured using a CCD DP71-1-5 camera (Olympus, Tokyo, Japan). The AFM images were recorded with a Digital Instruments, Multimode IIIa (Veeco, Plainview, NY, USA). The PPP-NCH AFM cantilevers (Nanosensors, Neuchâtel, Switzerland, nominal spring constant 42 N/m), with a tip height of 10–15 μm and guaranteed tip radius <10 nm (typical <7 nm), were employed.

2.2. Con A Immobilisation Protocol

The immobilisation protocol for Con A consists of four steps: (i) substrate treatment and cleaning, (ii) hydroxylation, (iii) silanisation and (iv) protein immobilisation. A schematic representation of the Con A immobilisation protocol is presented in Figure 1.

2.2.1. Substrate Treatment and Cleaning

The 3-inch quartz wafer was cut into 10 × 10 mm2 size samples using a dicing machine (Dicing SAW Disco DAD-2H/6T, Disco, Tokyo, Japan). The samples were initially cleaned with acetone, ethanol and deionised (DI) water, before being dried under a nitrogen stream, and then etch cleaned in “piranha solution” (7:3 v/v of 98% H2SO4 and 30% H2O2) at a temperature of 80°C for 20 minutes to remove any organic contamination. The quartz samples were subsequently rinsed three times in DI water and dried under a nitrogen stream.

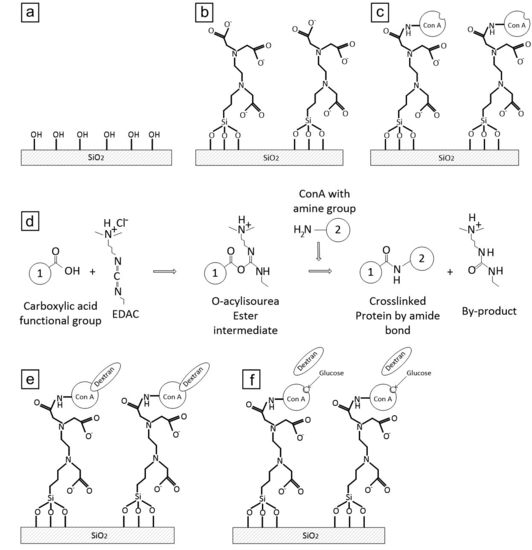
2.2.2. Hydroxylation

The hydroxyl groups required for bonding to the silanes were formed on the quartz surface by immersion in a (1:1 v/v) mixture of HCl:MeOH solution for 30 min at room temperature (Figure 1a). The samples were then rinsed in DI water and dried under a nitrogen stream.

2.2.3. Silanisation

The samples were silanised by immersion in an aqueous solution of 3% N-[3-Trimethoxysilyl propyl] ethylene diamine triacetic acid trisodium salt in 1 mM acetic acid (v/v) for 30 minutes at room temperature before being rinsed in DI water. This step permits conjugation between the hydroxyl groups on the substrate and the trihydroxysilyl group of the silane (Figure 1b).

2.2.4. Con A Immobilisation

Con A was added at a concentration of 1 mg mL−1 in an aqueous 20 mM MOPS buffer of pH 5.5 containing 10 mM CaCl2 and 10 mM MnCl2. The Ca2+ and Mn2+ ions play the role of co-factors [38] required to activate the protein for glucose binding. The MOPS buffer containing Con A was further diluted 10-fold in 50 mM Boric acid to a final concentration of 0.1 mg mL−1 protein. The covalent coupling of Con A to the silane layer (catalysed using a water soluble carbodiimide) involved conjugation of the amine groups on the protein to the carboxyl groups on the silane. The water soluble carbodiimide (EDAC) was dissolved to a final concentration of 0.5 mg mL−1. EDAC catalyses an activation of the carboxyl for the coupling of primary amines to yield amide bonds. Accordingly, 100 µL of freshly prepared solution was dispersed on the silanised quartz surface for at least 2 h at room temperature to permit the amide bonds to be completed (Figure 1c,d). After the immobilisation process, the wafers were removed from the solution, washed with MOPS buffer and DI water three times. Thereafter, the sample surface was dried under a nitrogen stream.

2.3. AFM Characterisation

The surface topography of the quartz sample, before and after the preparation steps (Figure 1), was determined using an AFM operating in tapping mode. The scan sizes ranged from 0.5 to 10 µm. The roughness parameter, Ra is given by:
R a = 1 N i = 1 , N | Z i |
where Zi is the height difference from the mean value in each sample and N the number of pixels. Ra were calculated using the analysis software (NanoScope Analysis, v. 1.40, Bruker Corporation, Billerica, MA, USA, 2012) from the AFM manufacturer or the Gwyddion software (GNU General Public License [39]). The mean values and standard deviations of the surface roughness were obtained using the data from several scans for each sample (see Table 1).

2.4. Functional Characterisation by Fluorescence

2.4.1. Fluorescence Calibration

A calibration protocol was developed to relate the observed fluorescent intensity to the number of Alexa 488 and FITC dextran molecules on the sample surface. The intensity was determined for both a dry and a wet sample environment in order to investigate possible differences. The test solutions consisted of 3 µL MOPS buffer containing 0–4 µg mL−1 Alexa 488 dextran or 0–8 µg mL−1 FITC dextran pipetted on 10 × 10 mm2 large substrates cut from one of the 3-inch quartz wafers. A glass coverslip of identical size was placed on top of the quartz substrate to permit the drop to be equally spread over the area. This also allowed for an estimation of the height of the liquid film that was sandwiched between the substrate and the coverslip. The fluorescent intensity was then recorded with the fluorophore evenly distributed in the solution (wet state). In the dry state, the samples were permitted to dry for 2 h prior to use to ensure that the solvent had been evaporated. The coverslip (acting as a lid) prevented the fluorophore from being concentrated in the centre during evaporation. Any optical diffraction from the coverslip would be minimal due to the measurements being performed with an inverted microscope with a 10x objective.
Fluorescence imaging was analysed using Cell^B software (Olympus) and Image J software (National Institutes of Health, Bethesda, MD, USA). The Image J software quantifies the intensity at a resolution of 8 bit (intensity scale from 0 to 255 a.u.). A constant exposure time (te = 2500 ms) was used throughout to optimize the range without triggering saturation of the intensity. The correlation between the concentration of fluorescent labelled dextran and the observed fluorescence intensity was based on the average intensity in the region of interest (ROI) which measured the size of the picture frame (1.3 × 1.7 mm2), and was averaged over 10 images. These 10 images were captured at four positions at the edges and six positions within the centre region of each 10 × 10 mm2 sample. The number of recordings n were scaled up by repeating the measurement on three different samples for each fluorophore concentration (n = 30).

2.4.2. Fluorescence Intensity Measurements

The functional properties of the immobilised Con A were investigated in two ways: (i) First the binding to fluorescent labelled dextran was assessed by using Alexa 488 and FITC dextran. (ii) Secondly, the competitive binding of glucose to Con A was assessed over a glucose concentration cglu range of 0–40 mM, with a titration increment of 5 mM. The presence of glucose should displace the dextran from Con A. These two functional investigations were performed by measuring the fluorescence intensity. Both types of the dextran molecules have similar fluorescent properties and could be evaluated using the same microscope settings. The maximum excitation and emission wavelengths of Alexa 488 dextran are 494 and 518 nm respectively, whereas the maximum excitation and emission wavelength of FITC-dextran is 490 nm and 520 nm, respectively.
The samples were incubated for 30 min at room temperature in a MOPS buffer containing fluorescence dextran at a concentration of 200 µg mL−1 (both for the FITC and Alexa 488 dextran). The samples were washed three times with MOPS buffer and DI water to remove the unbound fluorescent dextran after incubation. The samples were then immersed for 30 min in a MOPS solution containing different cglu in the range of 0–40 mM. After the incubation with glucose, the samples were washed three times with MOPS buffer and DI water to make sure that all the excess fluorescence dextran was washed away. The sample ID and description of the different immobilisation and experimental steps is presented in Table 1.
The observed fluorescence intensity was based in the protocol used in Section 2.4.1 (ROI averaged over 10 images captured at different positions for each of three independently prepared surfaces per observation (n = 30)).

3. Results and Discussion

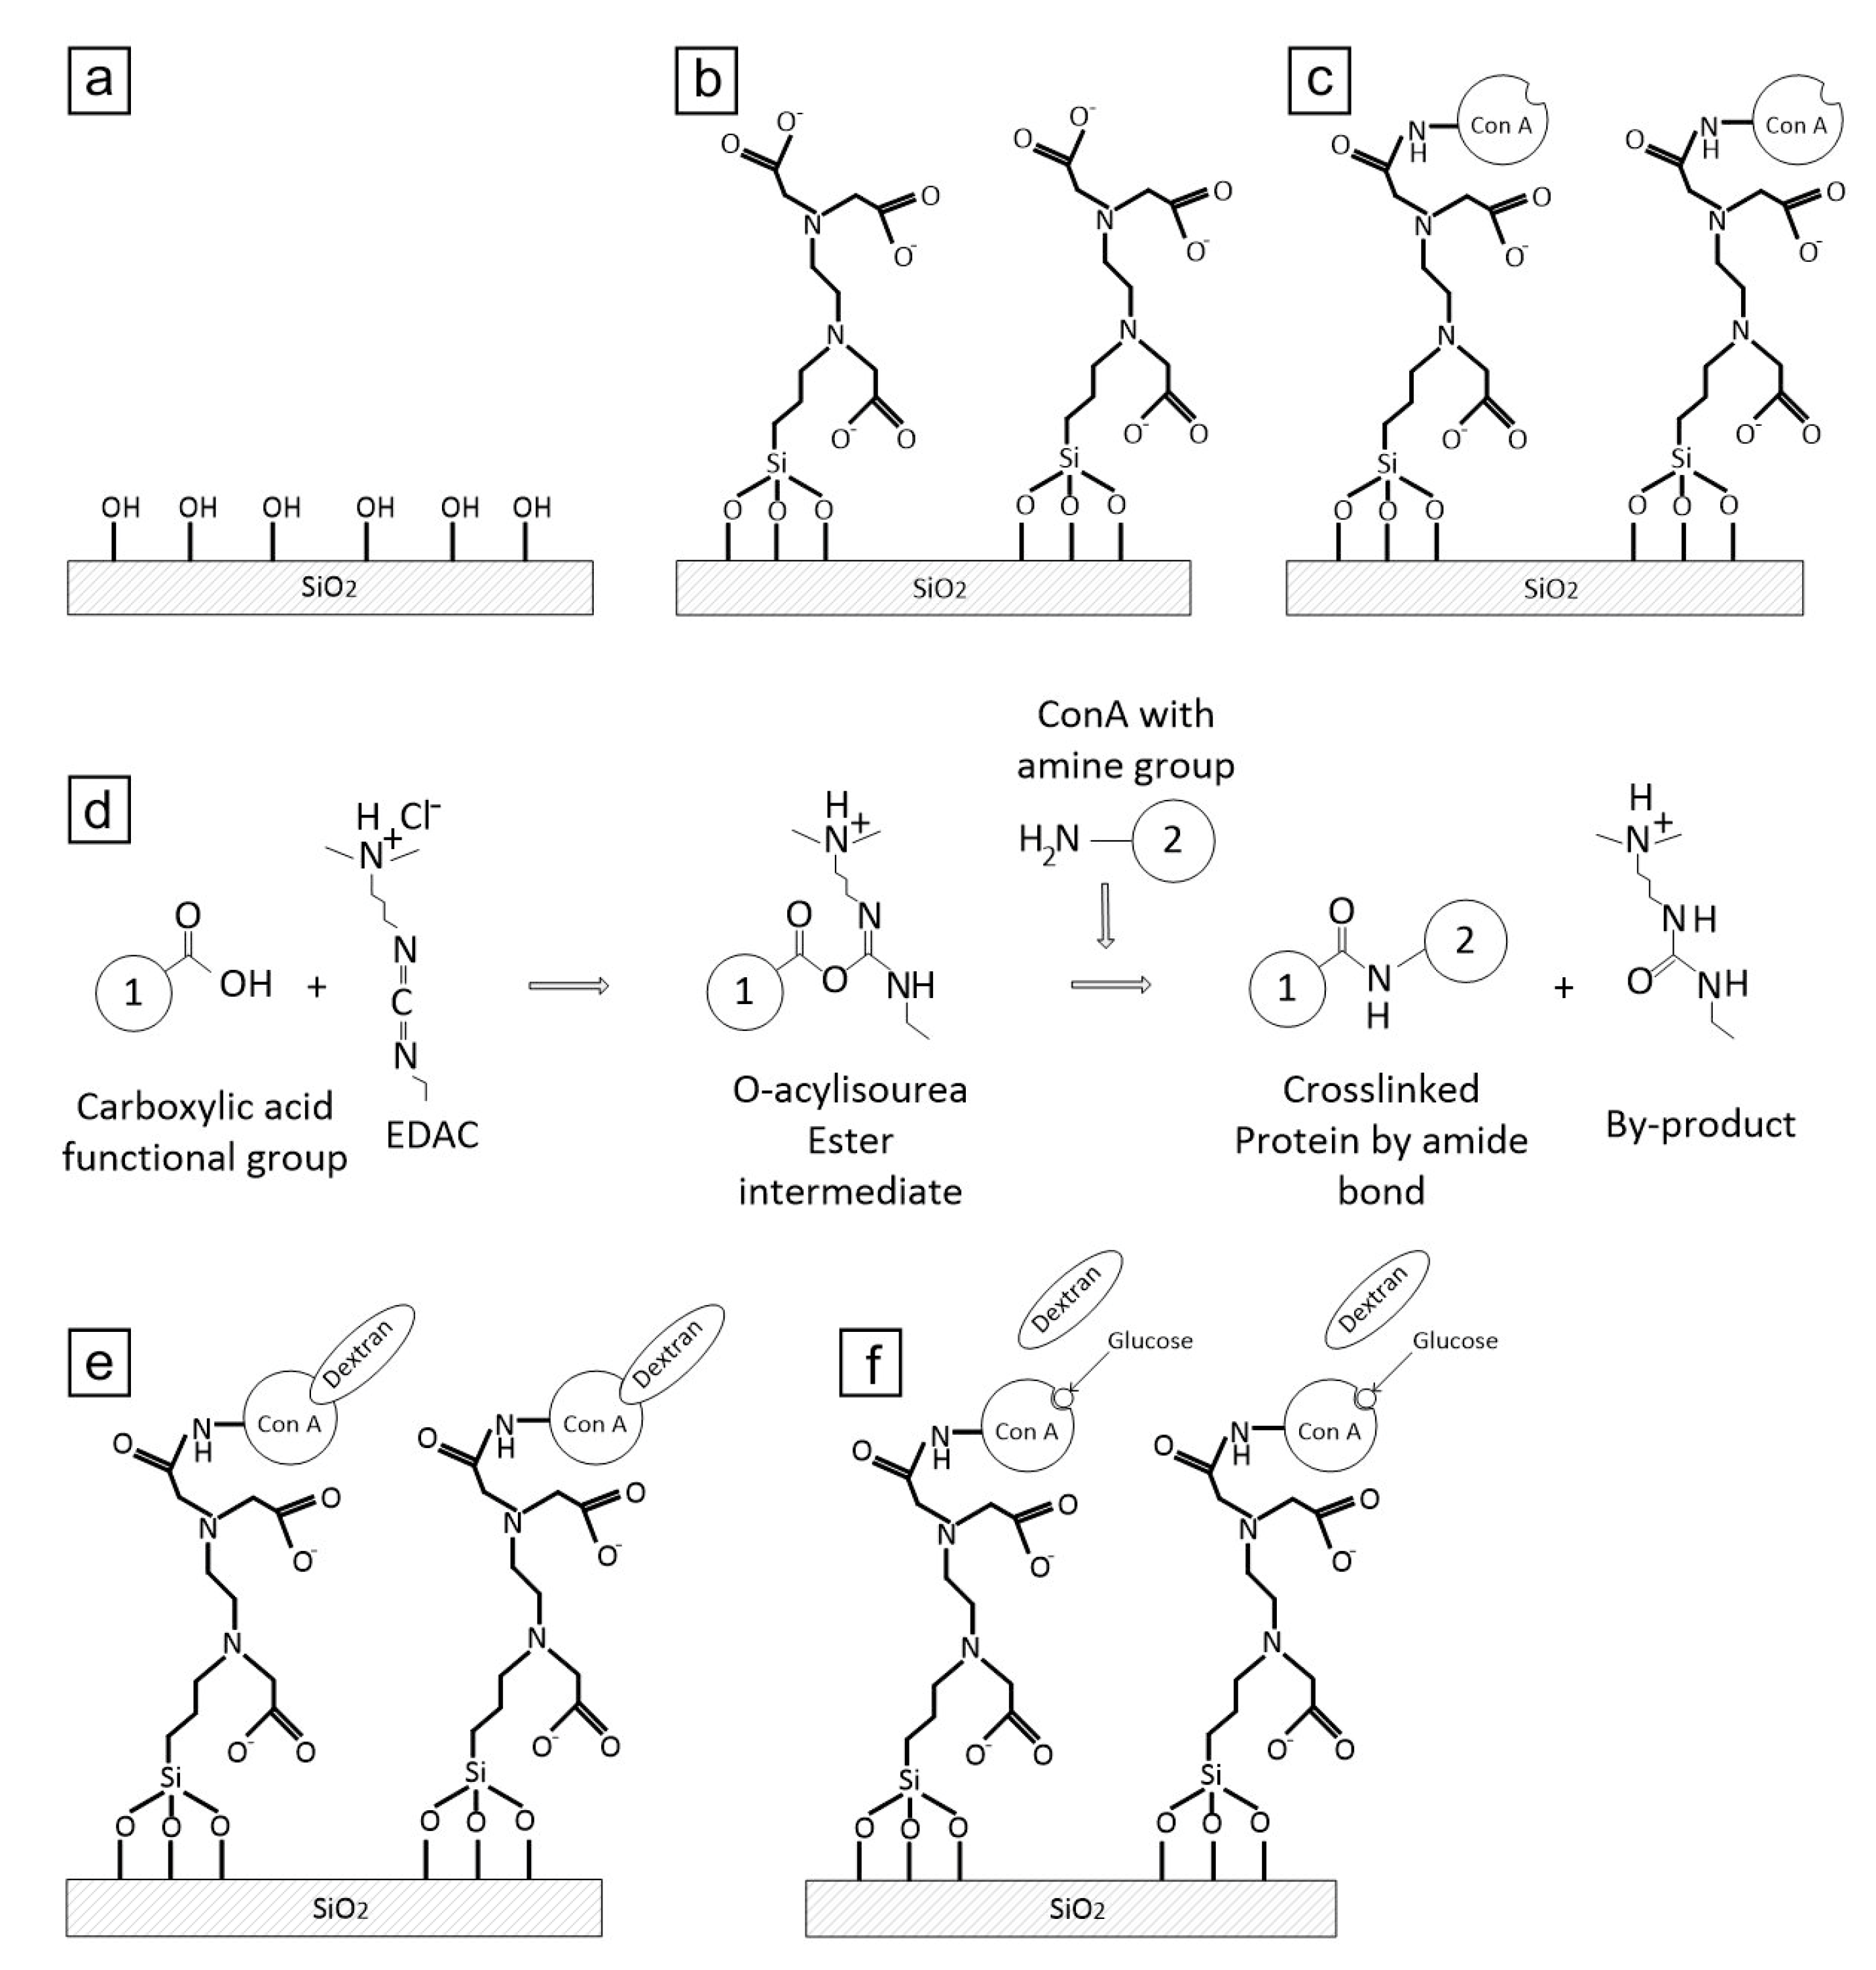
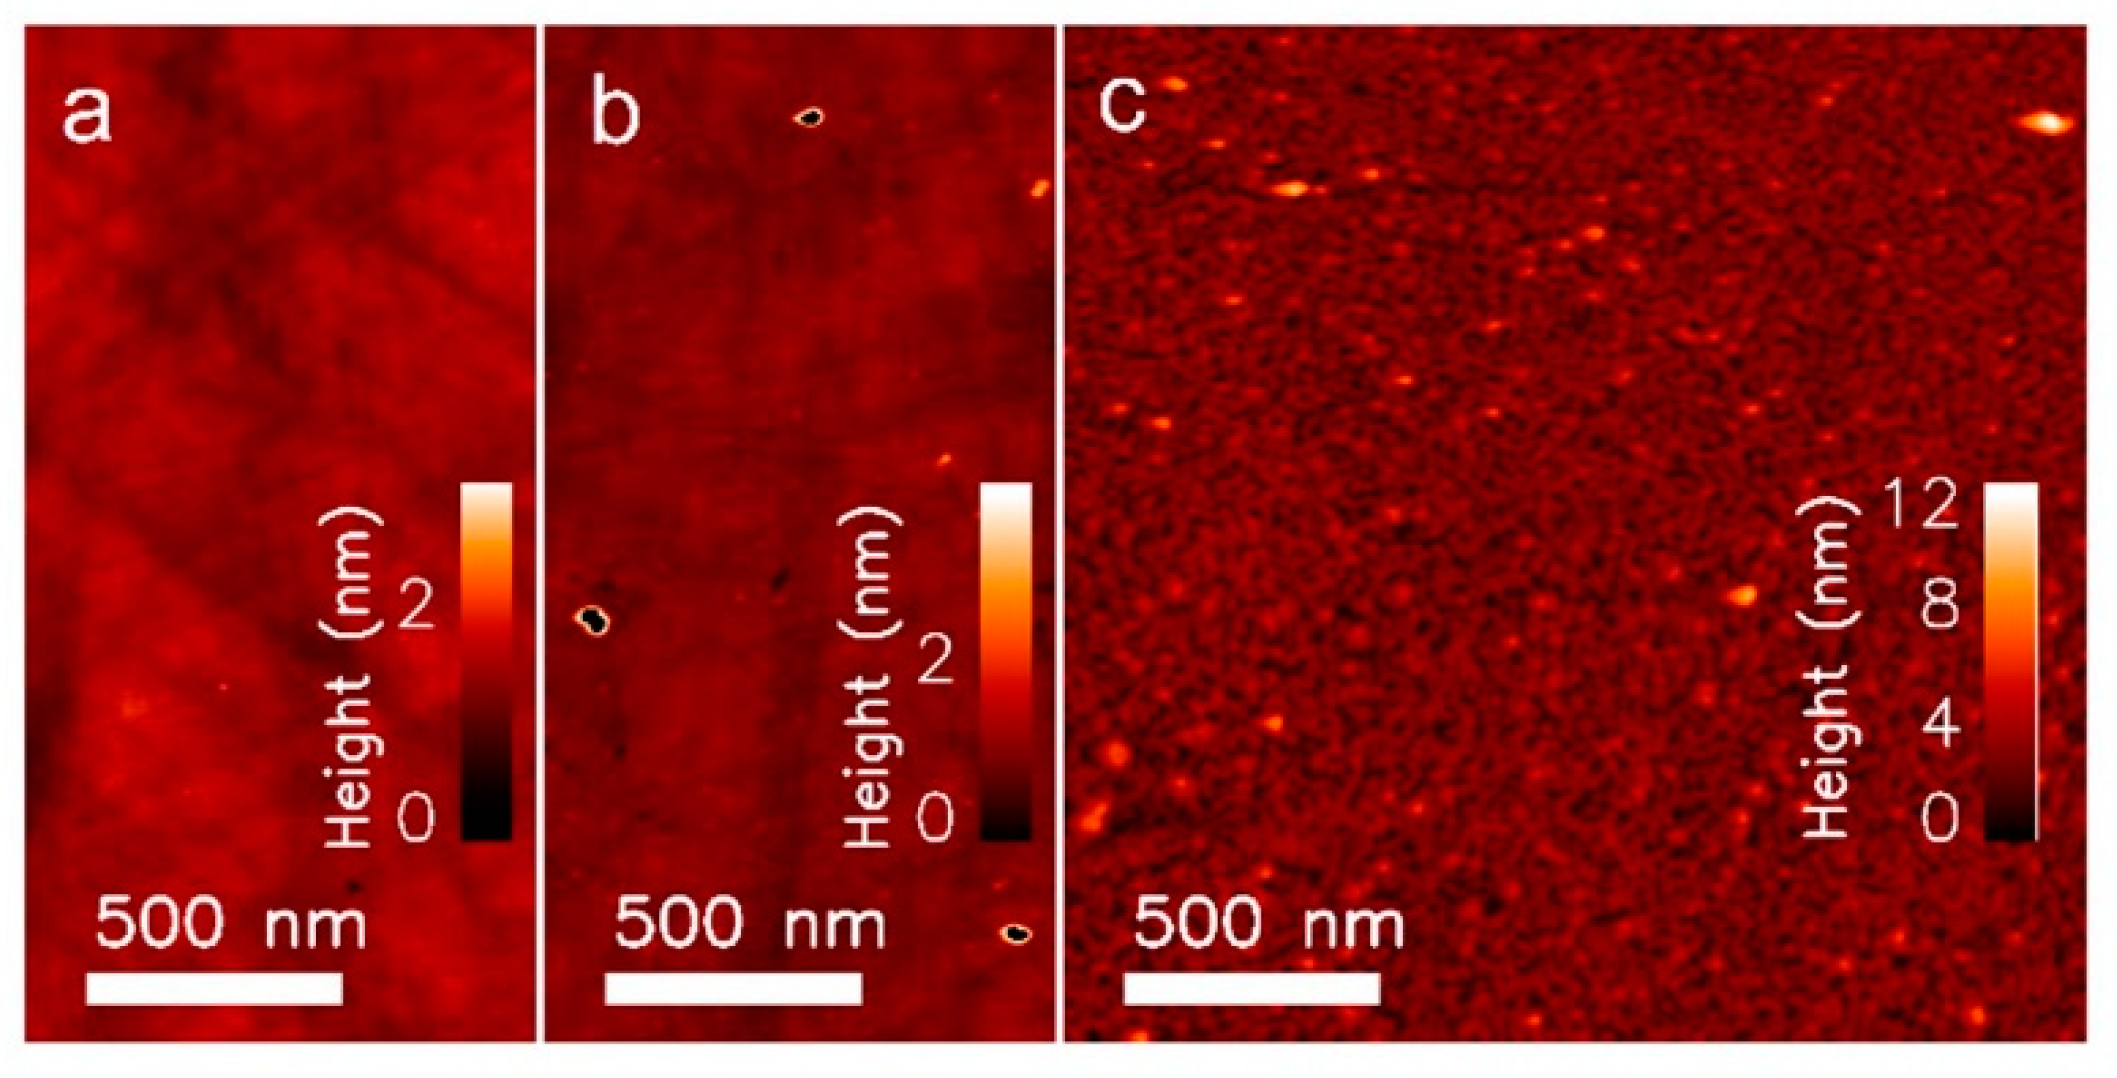
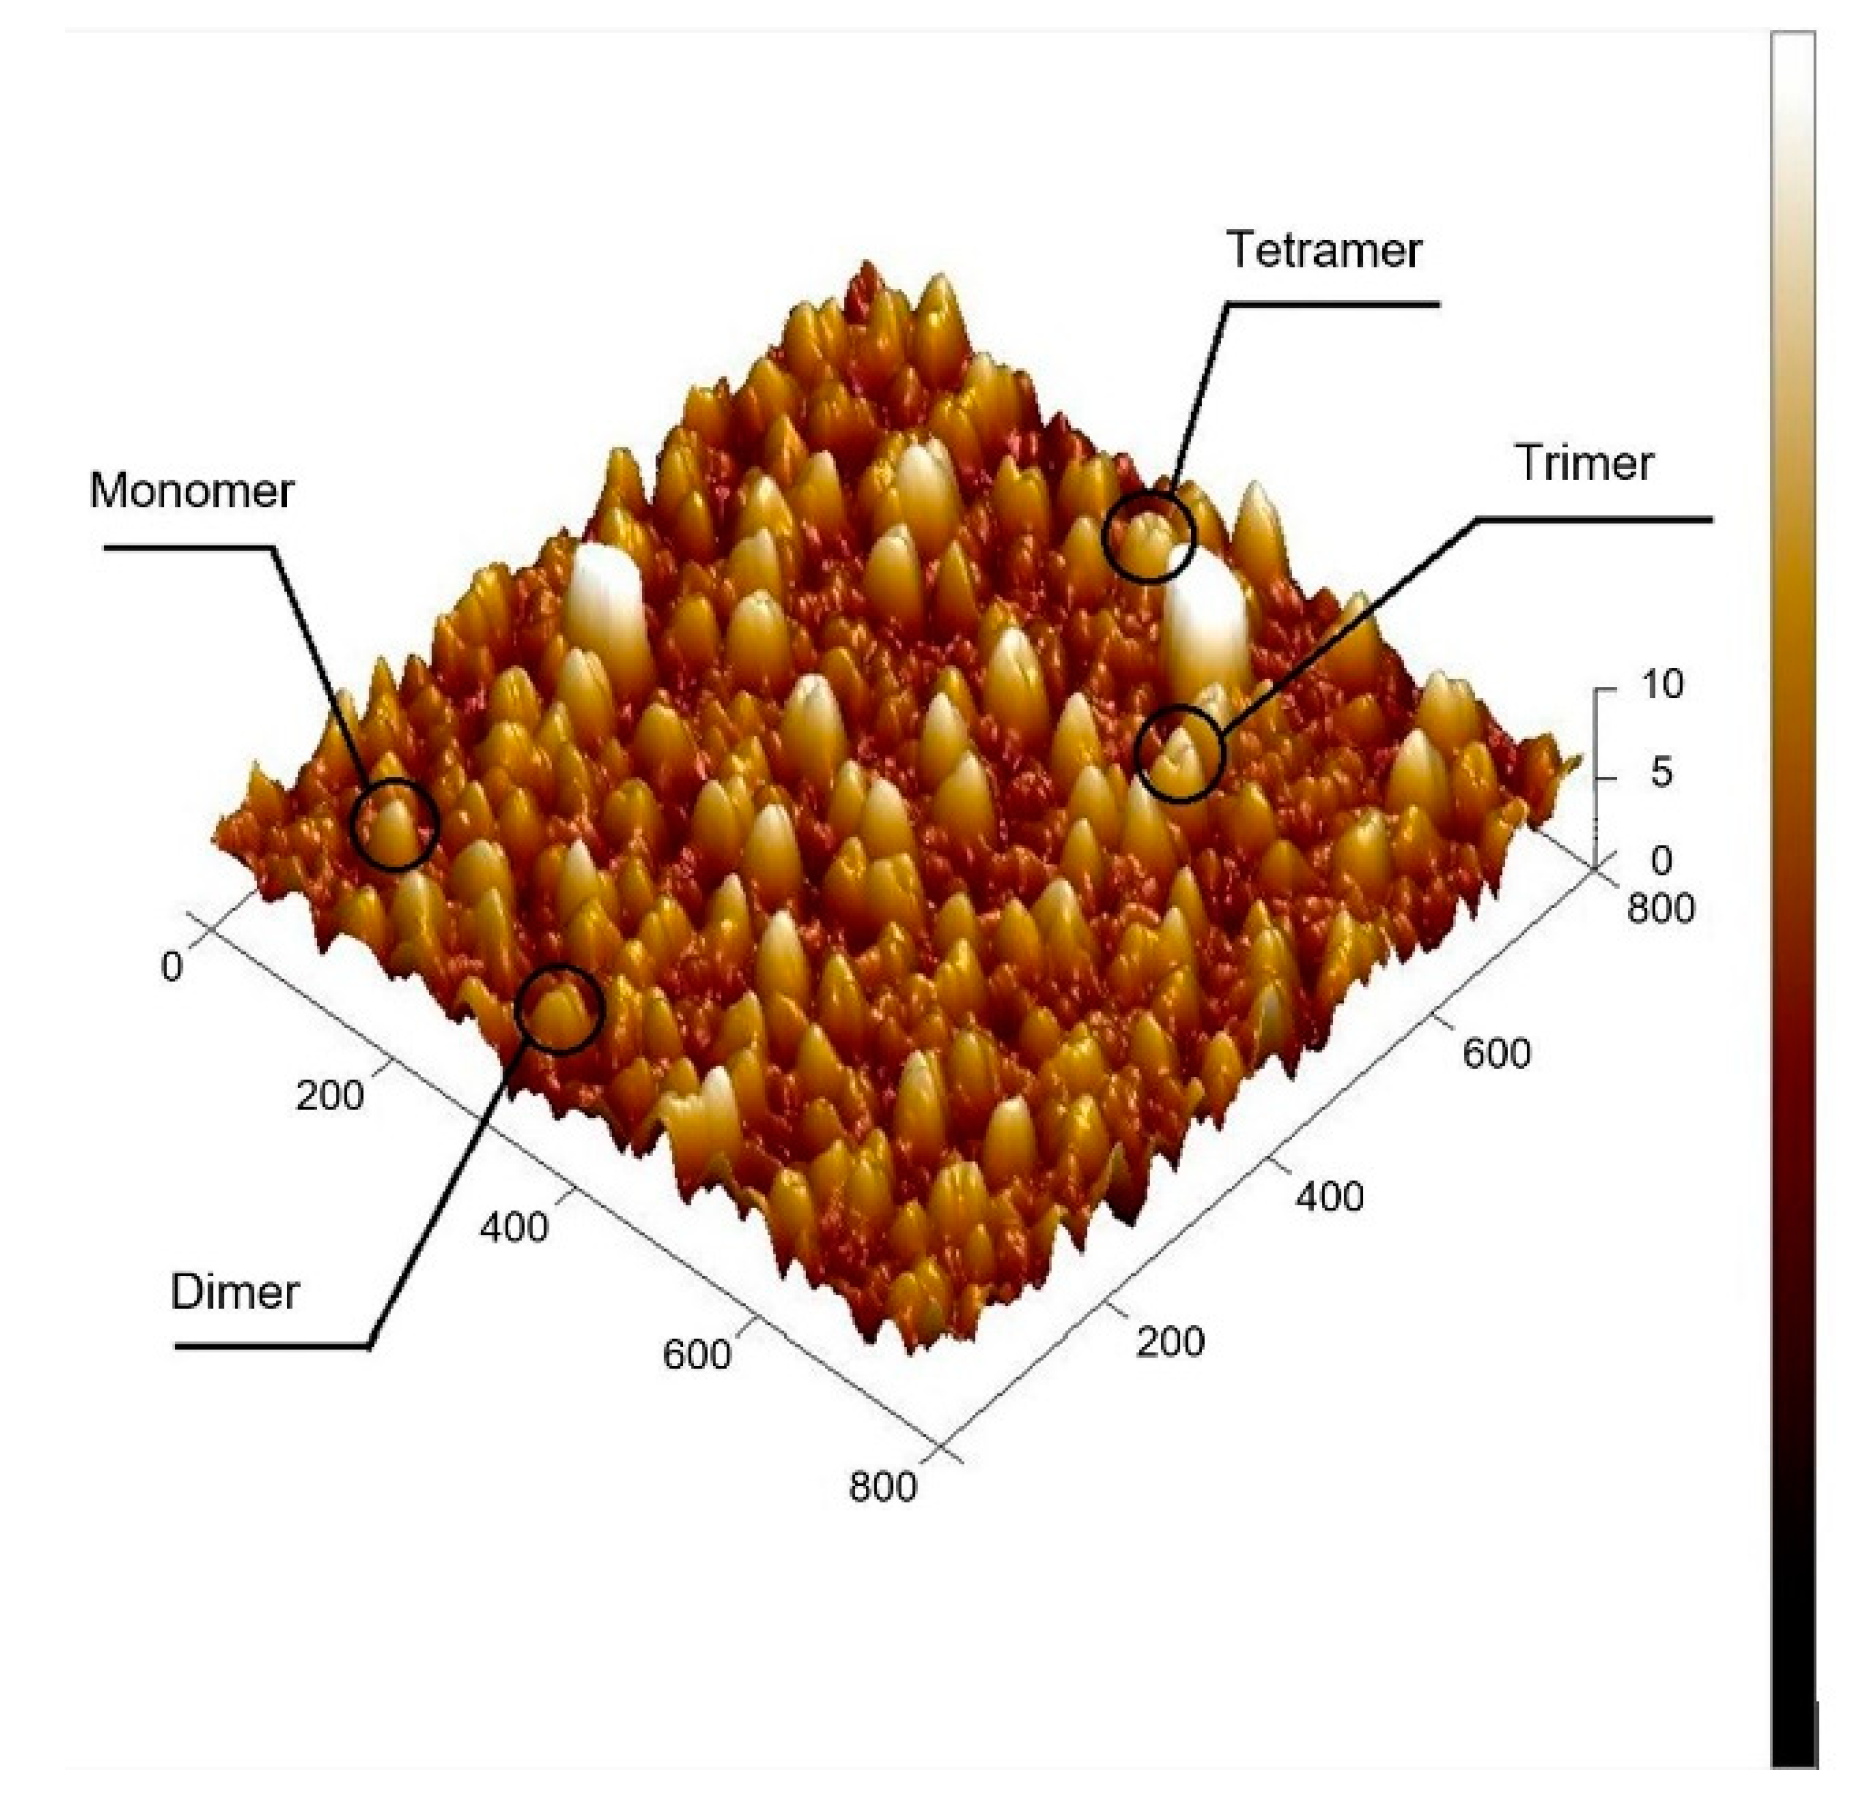
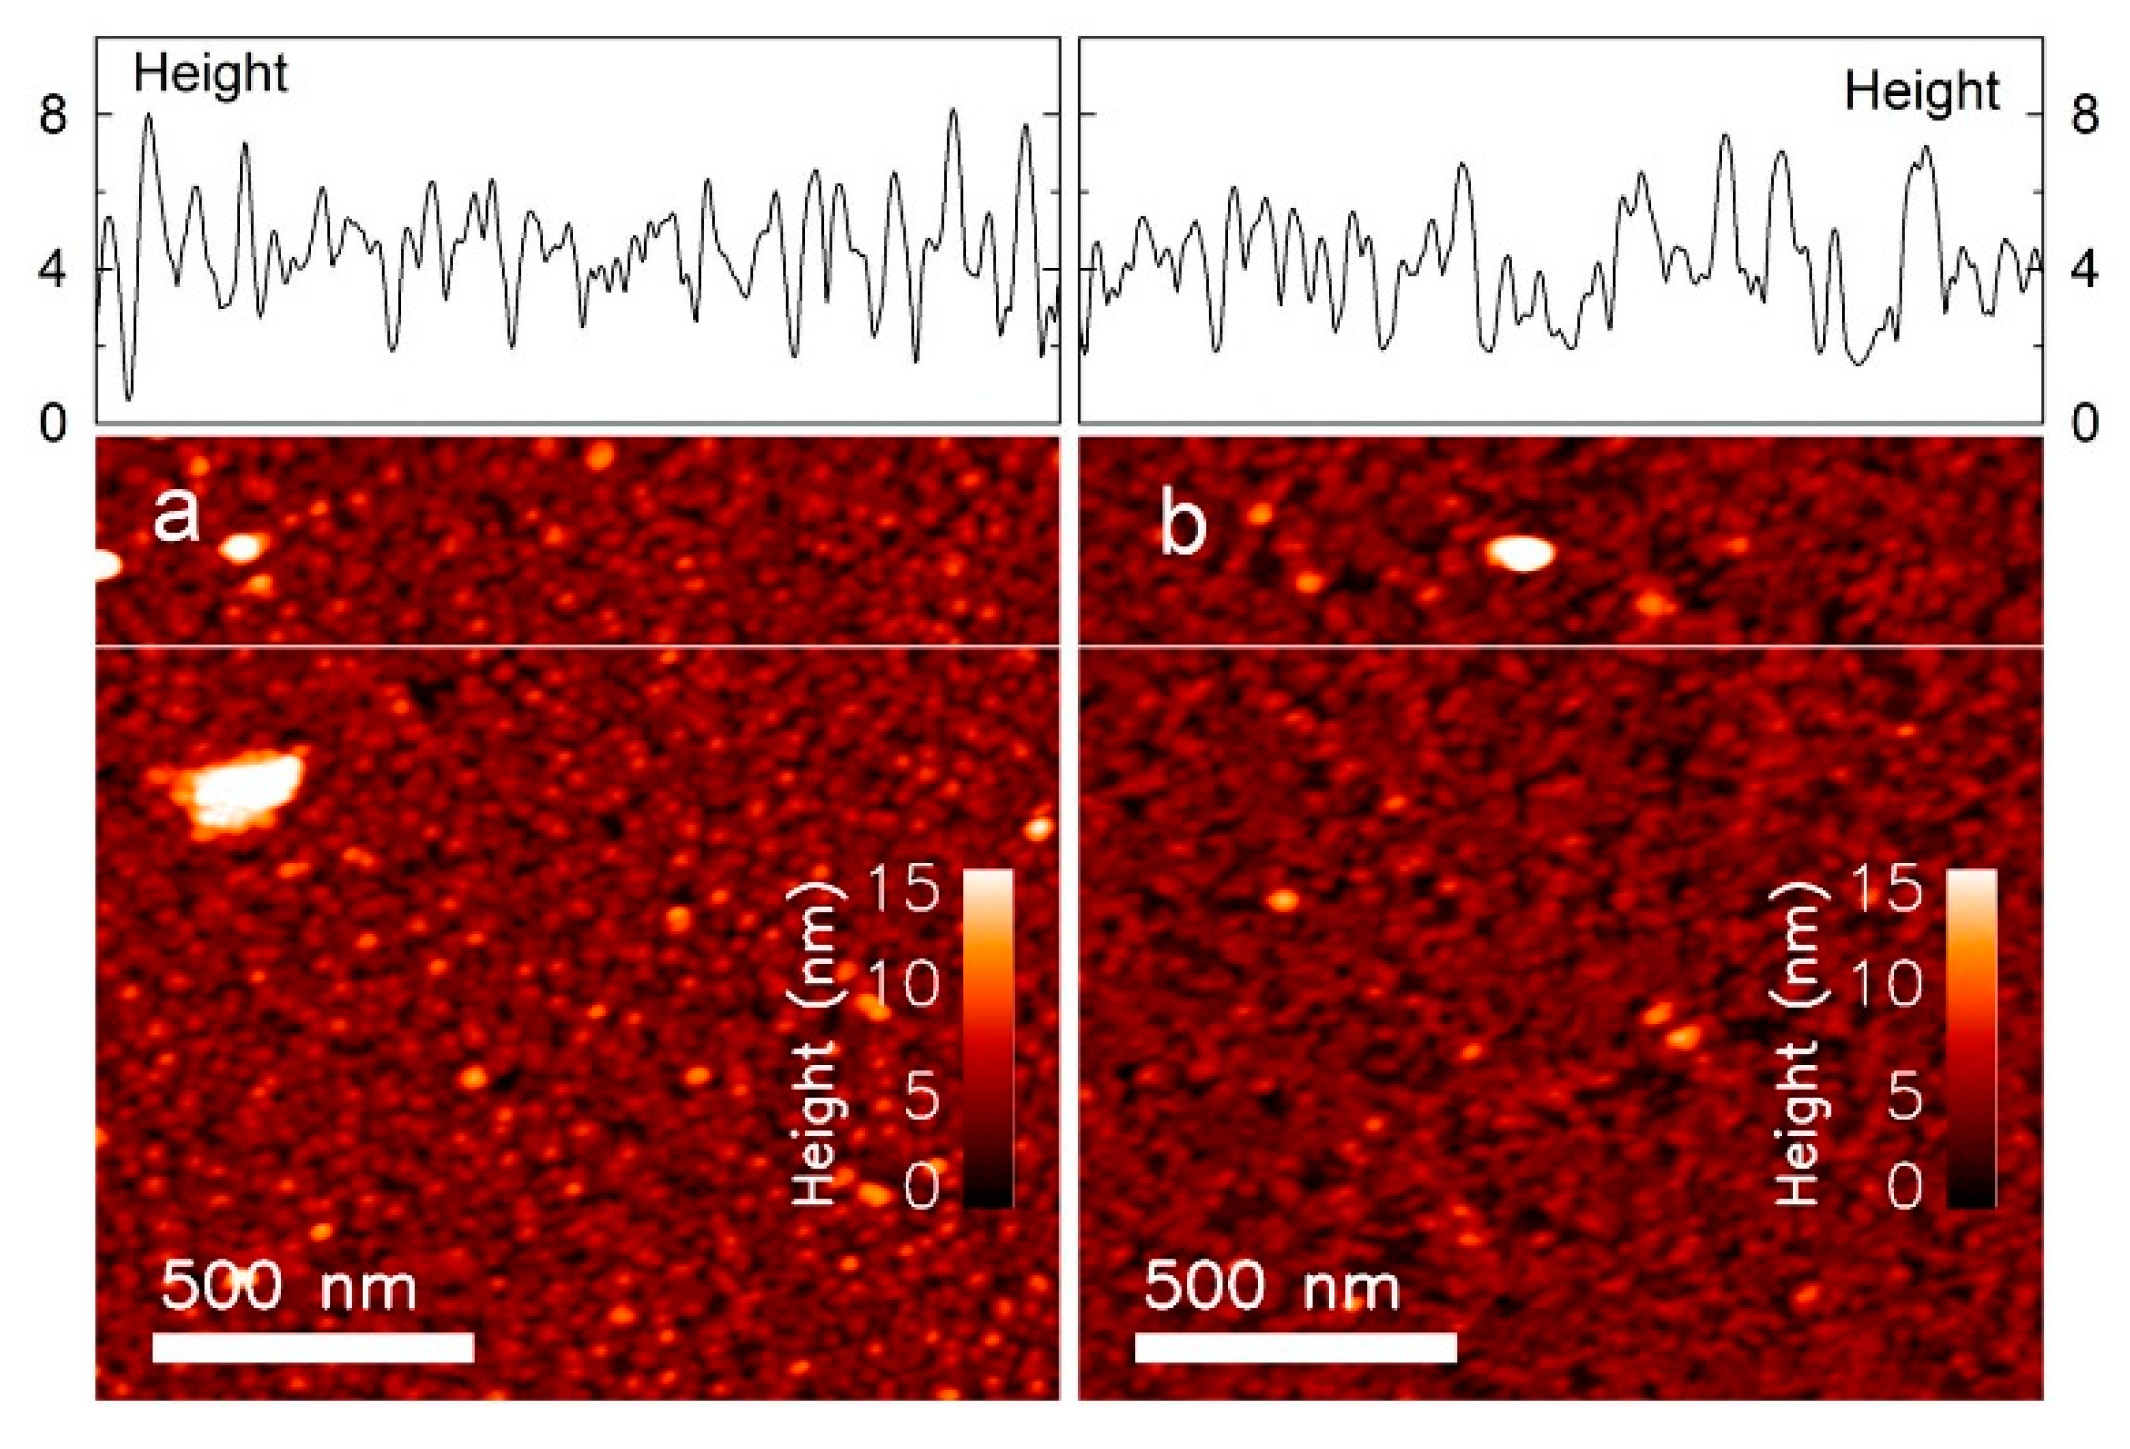
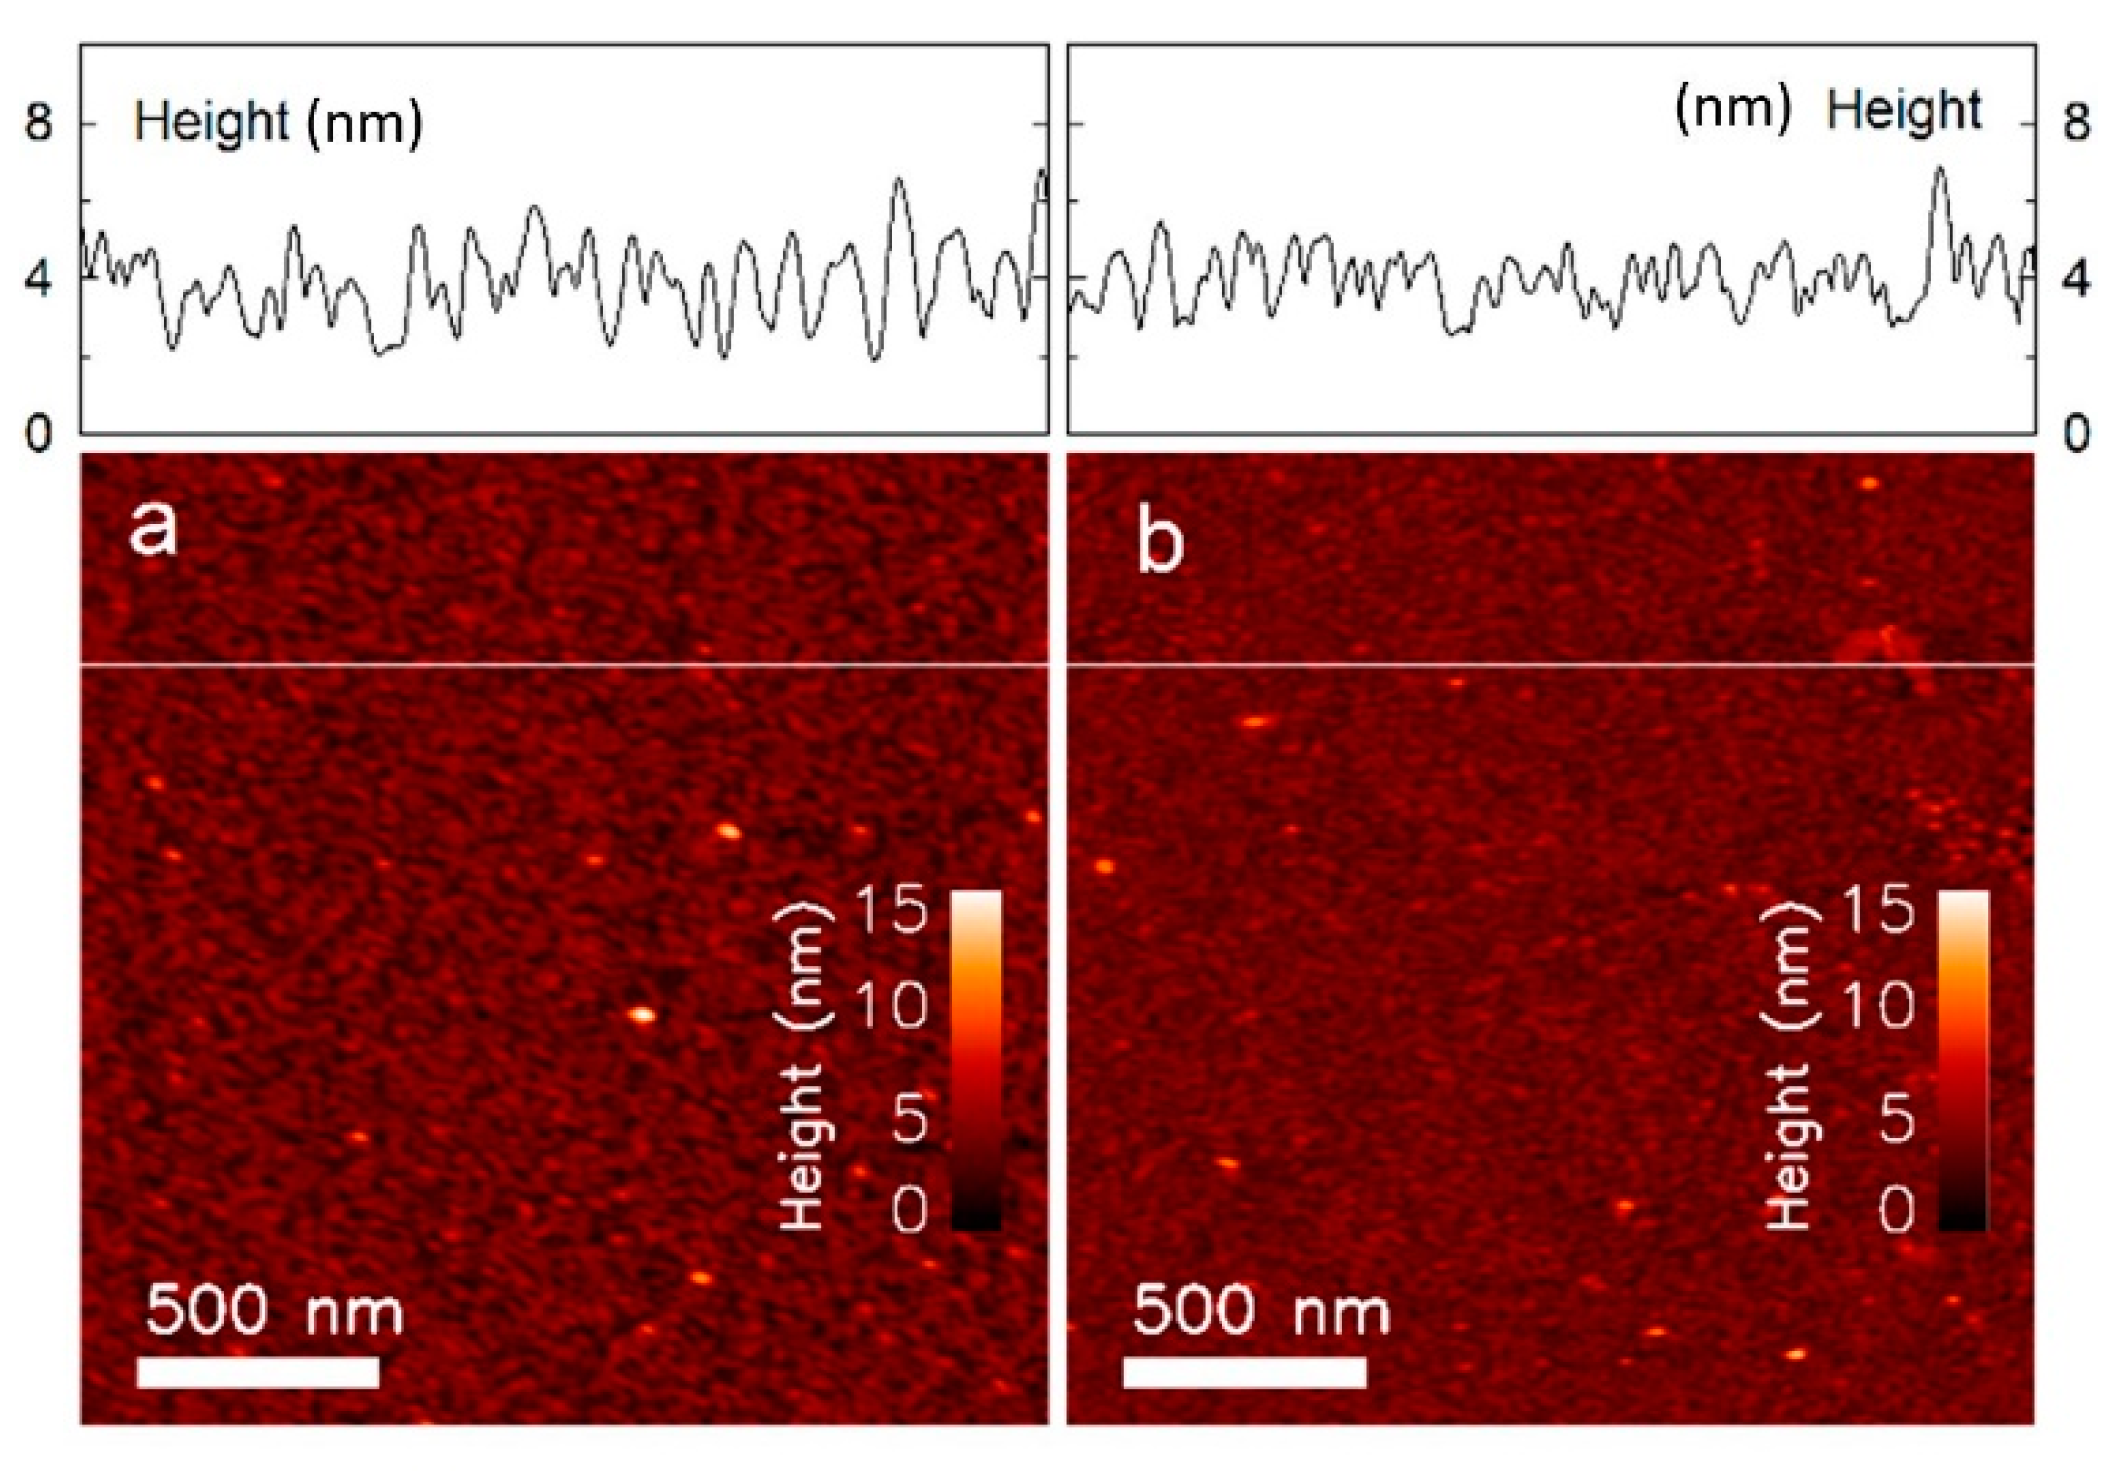
3.1. Structural Characterisation Using AFM

The immobilisation of silane resulted in only a marginal difference in surface topography (Figure 2a,b), which is most likely due to the carboxyl silane forming an equally smooth surface as the unmodified quartz. The occurrence of white spots are most likely the result of contamination from the silanisation step. In contrast, the surface topography scanned after the Con A immobilisation (Figure 2c) showed densely packed small globules. Zooming in on the 3D topographic image of the protein immobilised surface (Figure 3) revealed clustered structures of one, two, three and four units, which may be representative for Con A in its monomer, dimer, trimer and tetramer state. The lectin can adapt these quaternary states depending on the pH of the solution. However, most of the clusters seem to be dimers, which conforms to the most likely state that Con A exists in when subject to a pH from 4.5–5.6 [21]. This was also the region of pH used in the immobilisation protocol of this study (pH 5.5).
AFM images of the samples before and after incubation with MOPS buffer containing cglu = 40 mM are presented in Figure 4 and Figure 5 The samples that were initially incubated with the smaller Alexa 488 dextran show a more evenly distributed surface compared to samples incubated with the larger FITC dextran. This result is expected if the surface roughness is scaled to the molecular size.
The topographical images of the sample incubated with FITC dextran (Figure 4a,b) show peaks that are up to approximately 8 nm in height. This is larger than the 4 nm height observed with the sample incubated with Alexa 488 dextran (Figure 5a,b). These results are comparable to published data on the hydrodynamic diameter of FITC dextran (MW = 70 kDa) DF = 10.2 ± 1.4 nm [40] and Alexa 488 dextran (MW = 3 kDa) DA = 2.33 ± 0.38 nm [40], but smaller than the total height of Con A and dextran. This could be due to protein dehydration during preparation of these samples for the AFM studies (measured in dry state), while the published diameter is hydrodynamic. Other reasons could be that the lowest point detected by the AFM needle may not be the quartz substrate, or that the total height depends on the binding position of dextran to Con A. The number of peaks are reduced after incubating the samples with cglu = 40 mM, due to the displacement of the long chained dextran with the smaller glucose molecules.
The average roughness, calculated from the AFM images at each consequent immobilisation step, is presented in Table 1. The clean polished SiO2 surface (sample ID1) had an average roughness of Ra = 0.12 ± 0.04 nm, with no significant change following the silanisation step (ID2, Ra = 0.15 ± 0.05 nm). The average roughness increased to Ra = 0.60 ± 0.16 nm after Con A immobilisation (ID3), and increasing further to Ra = 0.77 ± 0.04 nm following incubation with Alexa 488 dextran (ID6), and Ra = 1.14 ± 0.35 nm with FITC dextran (ID4). The roughness observed within the AFM topographs were not changed, Ra = 0.76 ± 0.22 nm (Alexa 488 dextran, ID7) and Ra = 1.12 ± 0.50 nm (FITC dextran, ID5) after incubation in a MOPS buffer containing 40 mM glucose. This data confirms that the addition of new layers (immobilisation and dextran incubation) increases the relative surface roughness. The subsequent removal of layers (competitive displacement of dextran by glucose immersion) was not yielding a straightforward reduction in the roughness parameter, possibly due to a rather large standard deviation of the roughness. The average roughness may depend on the AFM tip radius provided that the height variations are within the same size range.

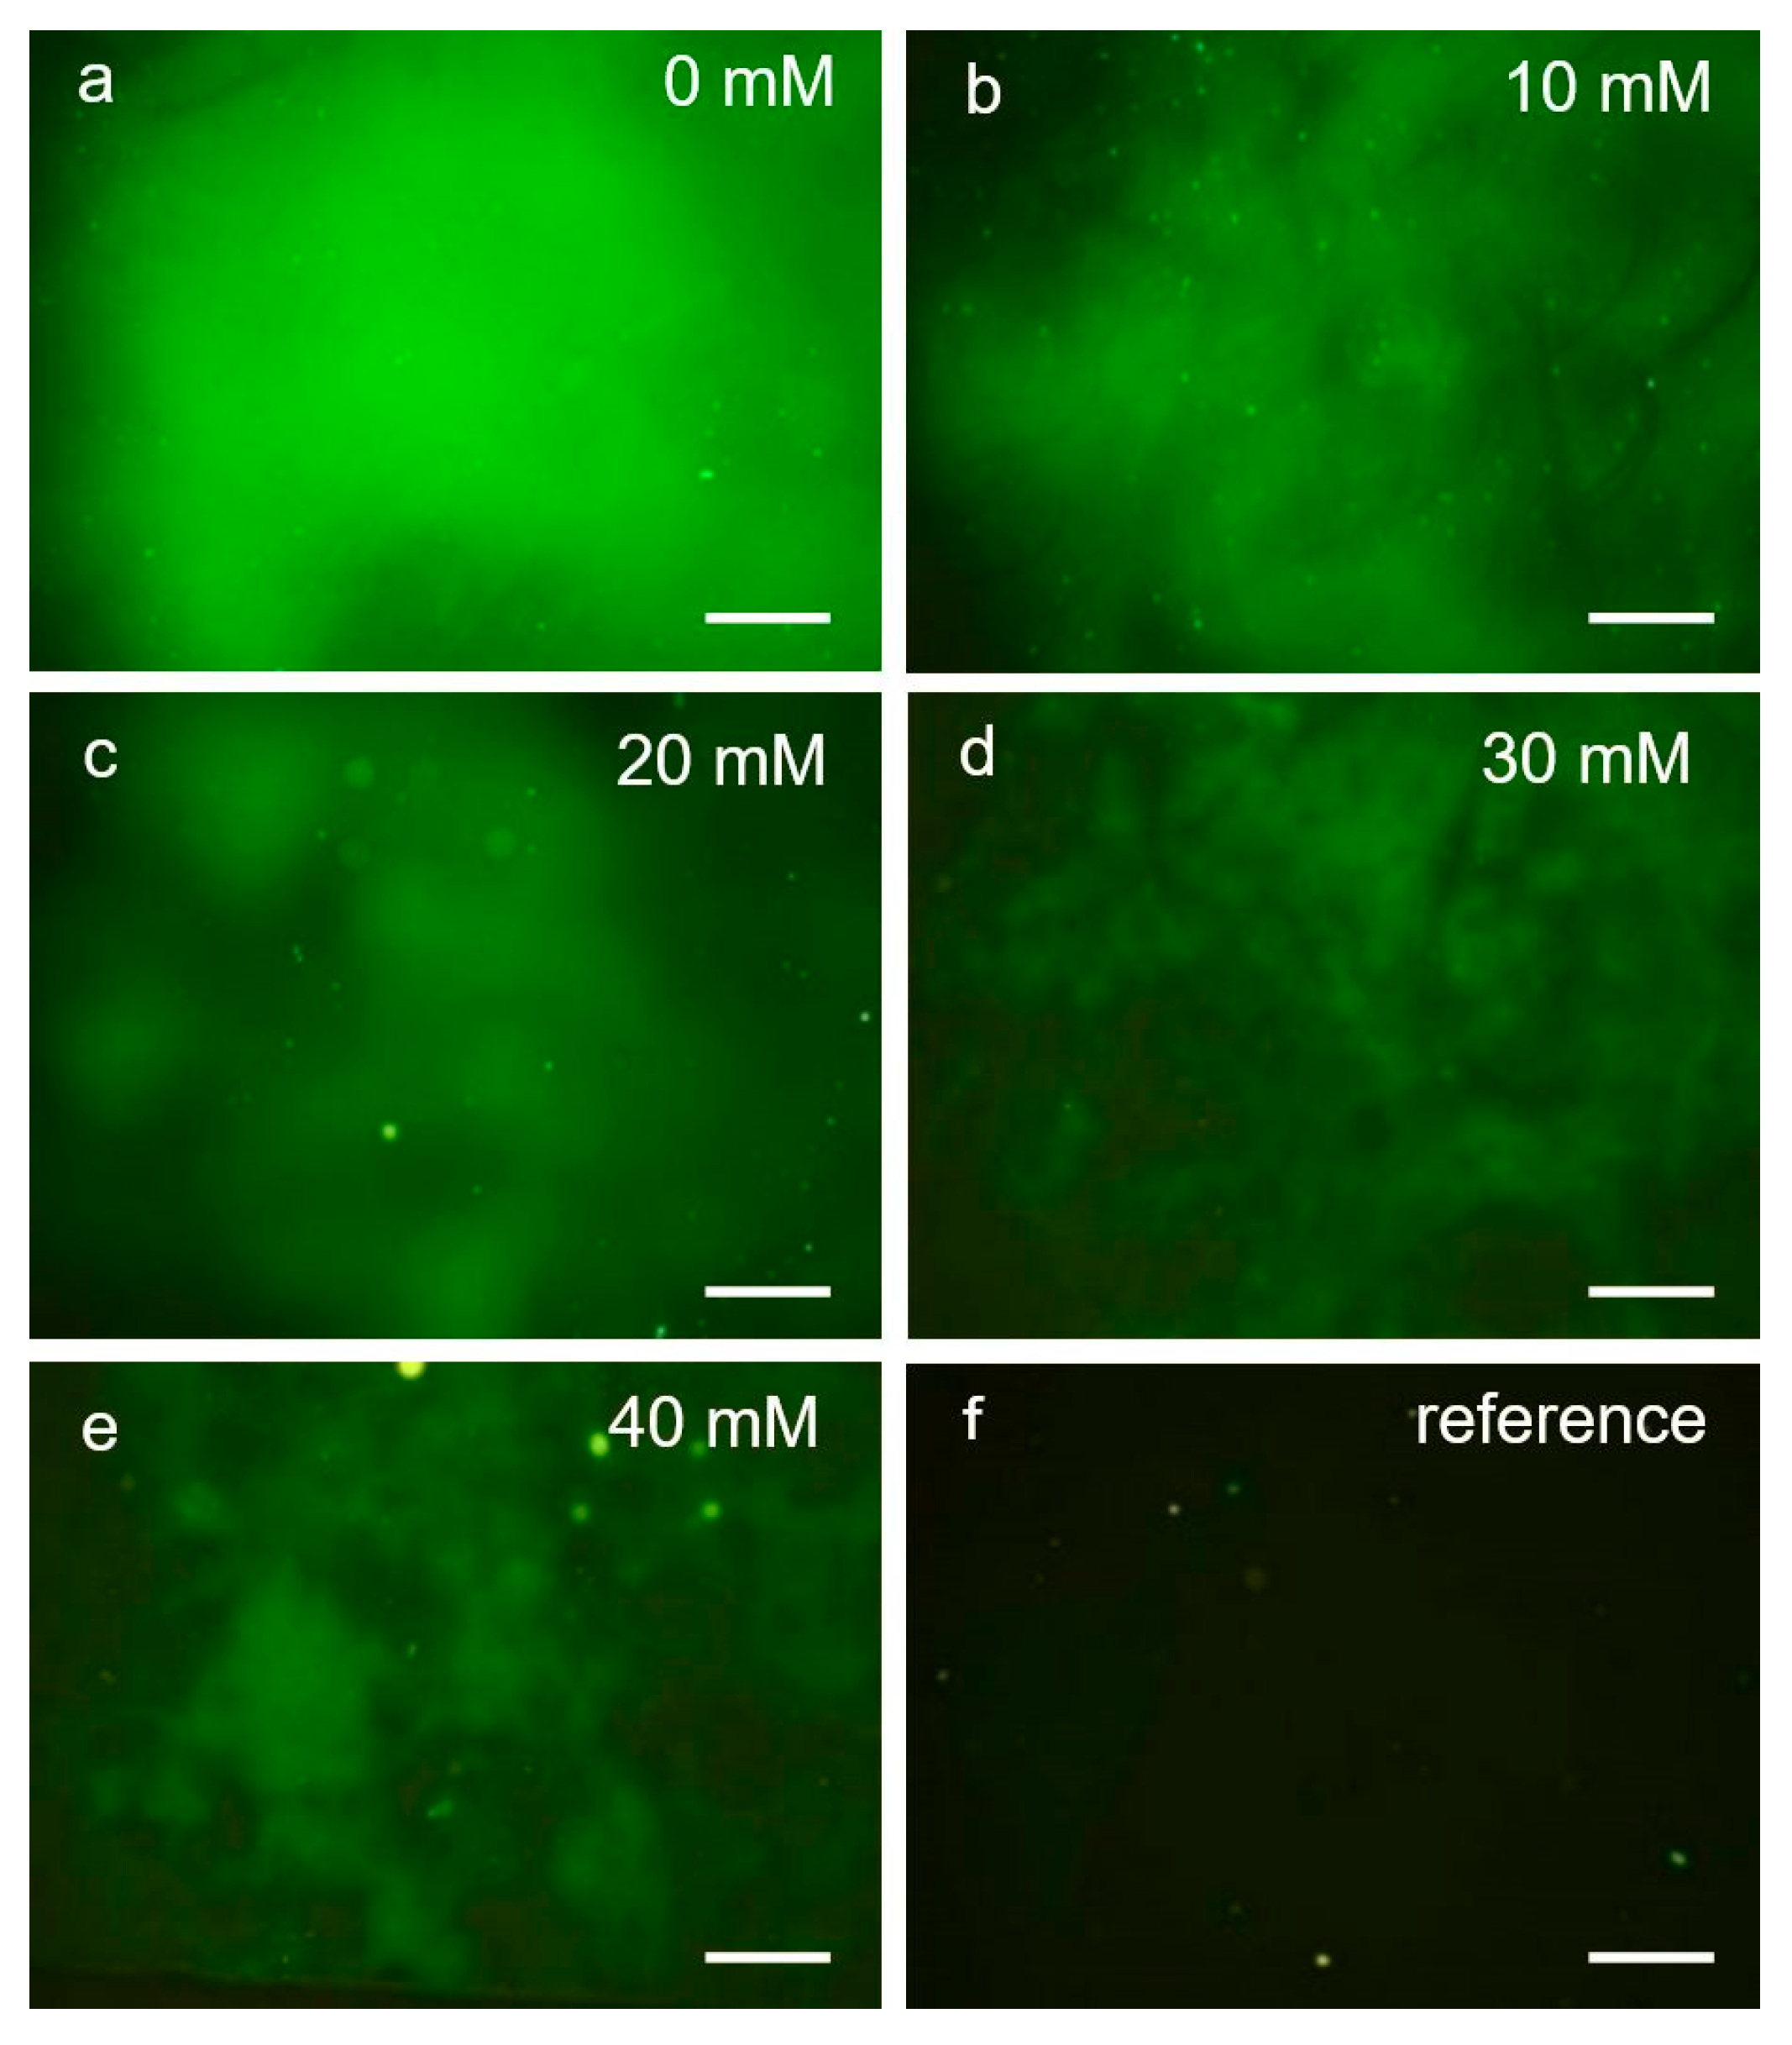
3.2. Functional Assessment of Immobilised Con A

The fluorescence intensity measurements show that the immobilised Con A was able to bind and retain both the Alexa 488 and the FITC dextran. Moreover, it was observed (Figure 6a) that the fluorescence intensity was distributed over the ROI before glucose was added. A control experiment in which the immobilisation protocol was followed except for the addition of Con A (omitting step 3, Table 1), shows that the fluorescent dextran did not bind to the surface in any unspecific manner (Figure 6f). This suggests that the presence of Con A was the main contributing factor responsible for binding dextran to the sample surface.
The fluorescence intensity decreased following incubation in MOPS buffer with increasing glucose concentration (Figure 6a–e). This result was as expected since a higher glucose concentration would be more effective in displacing bound dextran molecules, resulting in a lower concentration of the latter. This result does also agree with those obtained from the AFM measurements.
It was observed that the fluorescence intensity was not evenly distributed over the sample surface. A reason for this may be that the concentration of Con A was uneven following the immobilisation step, and which was masked out by the higher fluorescent intensities at low glucose concentrations. A more uniform distribution of the protein could in principle be achieved by ensuring that the sample is 100% clean, resulting in a perfect hydroxylation step and subsequent coverage of silane. Protein aggregation could then be reduced by agitating the solution during the Con A immobilization step (e.g., by ultrasound). However, variations will still be visible if there is a loss or reduction in the binding ability of the lectin. The AFM images revealed a range in height differences on the topograph of immobilised Con A (Figure 4 and Figure 5). This suggests that the activity of the sugar binding moieties of the lectin could also be dependent on its distance from the surface. Olmsted [33] showed that the dissociation constant (KD) for glucose was reduced from 344 μM in free solution to 41 μM with the lectin attached in direct contact with the surface. Since dextran is de facto long chained glucose molecules, the observed changes in the binding affinity between Con A and glucose, depending on the immobilization, are expected to yield similar changes in dextran binding to Con A. In this case the Con A–dextran complexes closest to the surface would be the ones that would dissociate last as the glucose concentration increased. Unfortunately, any cross correlation with the AFM images was not possible due to the higher resolution of the latter. Creating a more uniform distance from the substrate could be realized using specific molecular spacers that provide a minimum level of separation [33]. A third factor could be that some of the binding sites of Con A could be blocked by the surface due to different orientation of the immobilised lectin. Closer investigation of the Con A structure performed by Becker [41] revealed that the surface of the molecule is dominated by two large β-sheets in which one constitutes the front end and one the back end. The difference lies in the front end containing the carbohydrate binding site with one hydrophilic and one hydrophobic domain. Considering the binding site representing a discontinuity in the overall surface chemistry of the molecule, and hence the density of available amine groups, one may be inclined to think that the most probable attachment to a bifunctional chemical cross linker would be at the β-sheet constituting the back end. This would also prevent a completely random orientation of the Con A molecules once immobilized. However, a more site-specific attachment of the lectin could be achieved by chemical grafting resulting in, for example, a disulfide group, but this would require some kind of surface treatment or the substitution of amino acid residues (cloning) that in turn could alter the structure of the protein, and hence, the functionality. An uneven displacement of dextran could also be an effect if there were localised concentration differences of dextran, but this was considered secondary to those described above.
The experimentally determined average fluorescence intensity I for the two different fluorophores used in this study (Alexa 488 and FITC dextran) is presented in Figure 7 as a function of glucose concentration. The intensity was found to decrease with an increasing concentration of glucose for both of the labelled polysaccharides. The observed trend represents an exponential decay which levels out at a plateau in the cglu range of 30–40 mM. The appearance of the plateau suggests a trend towards glucose saturation of the binding sites on Con A which corroborates with results obtained from previous studies of Con A in free solutions [13].

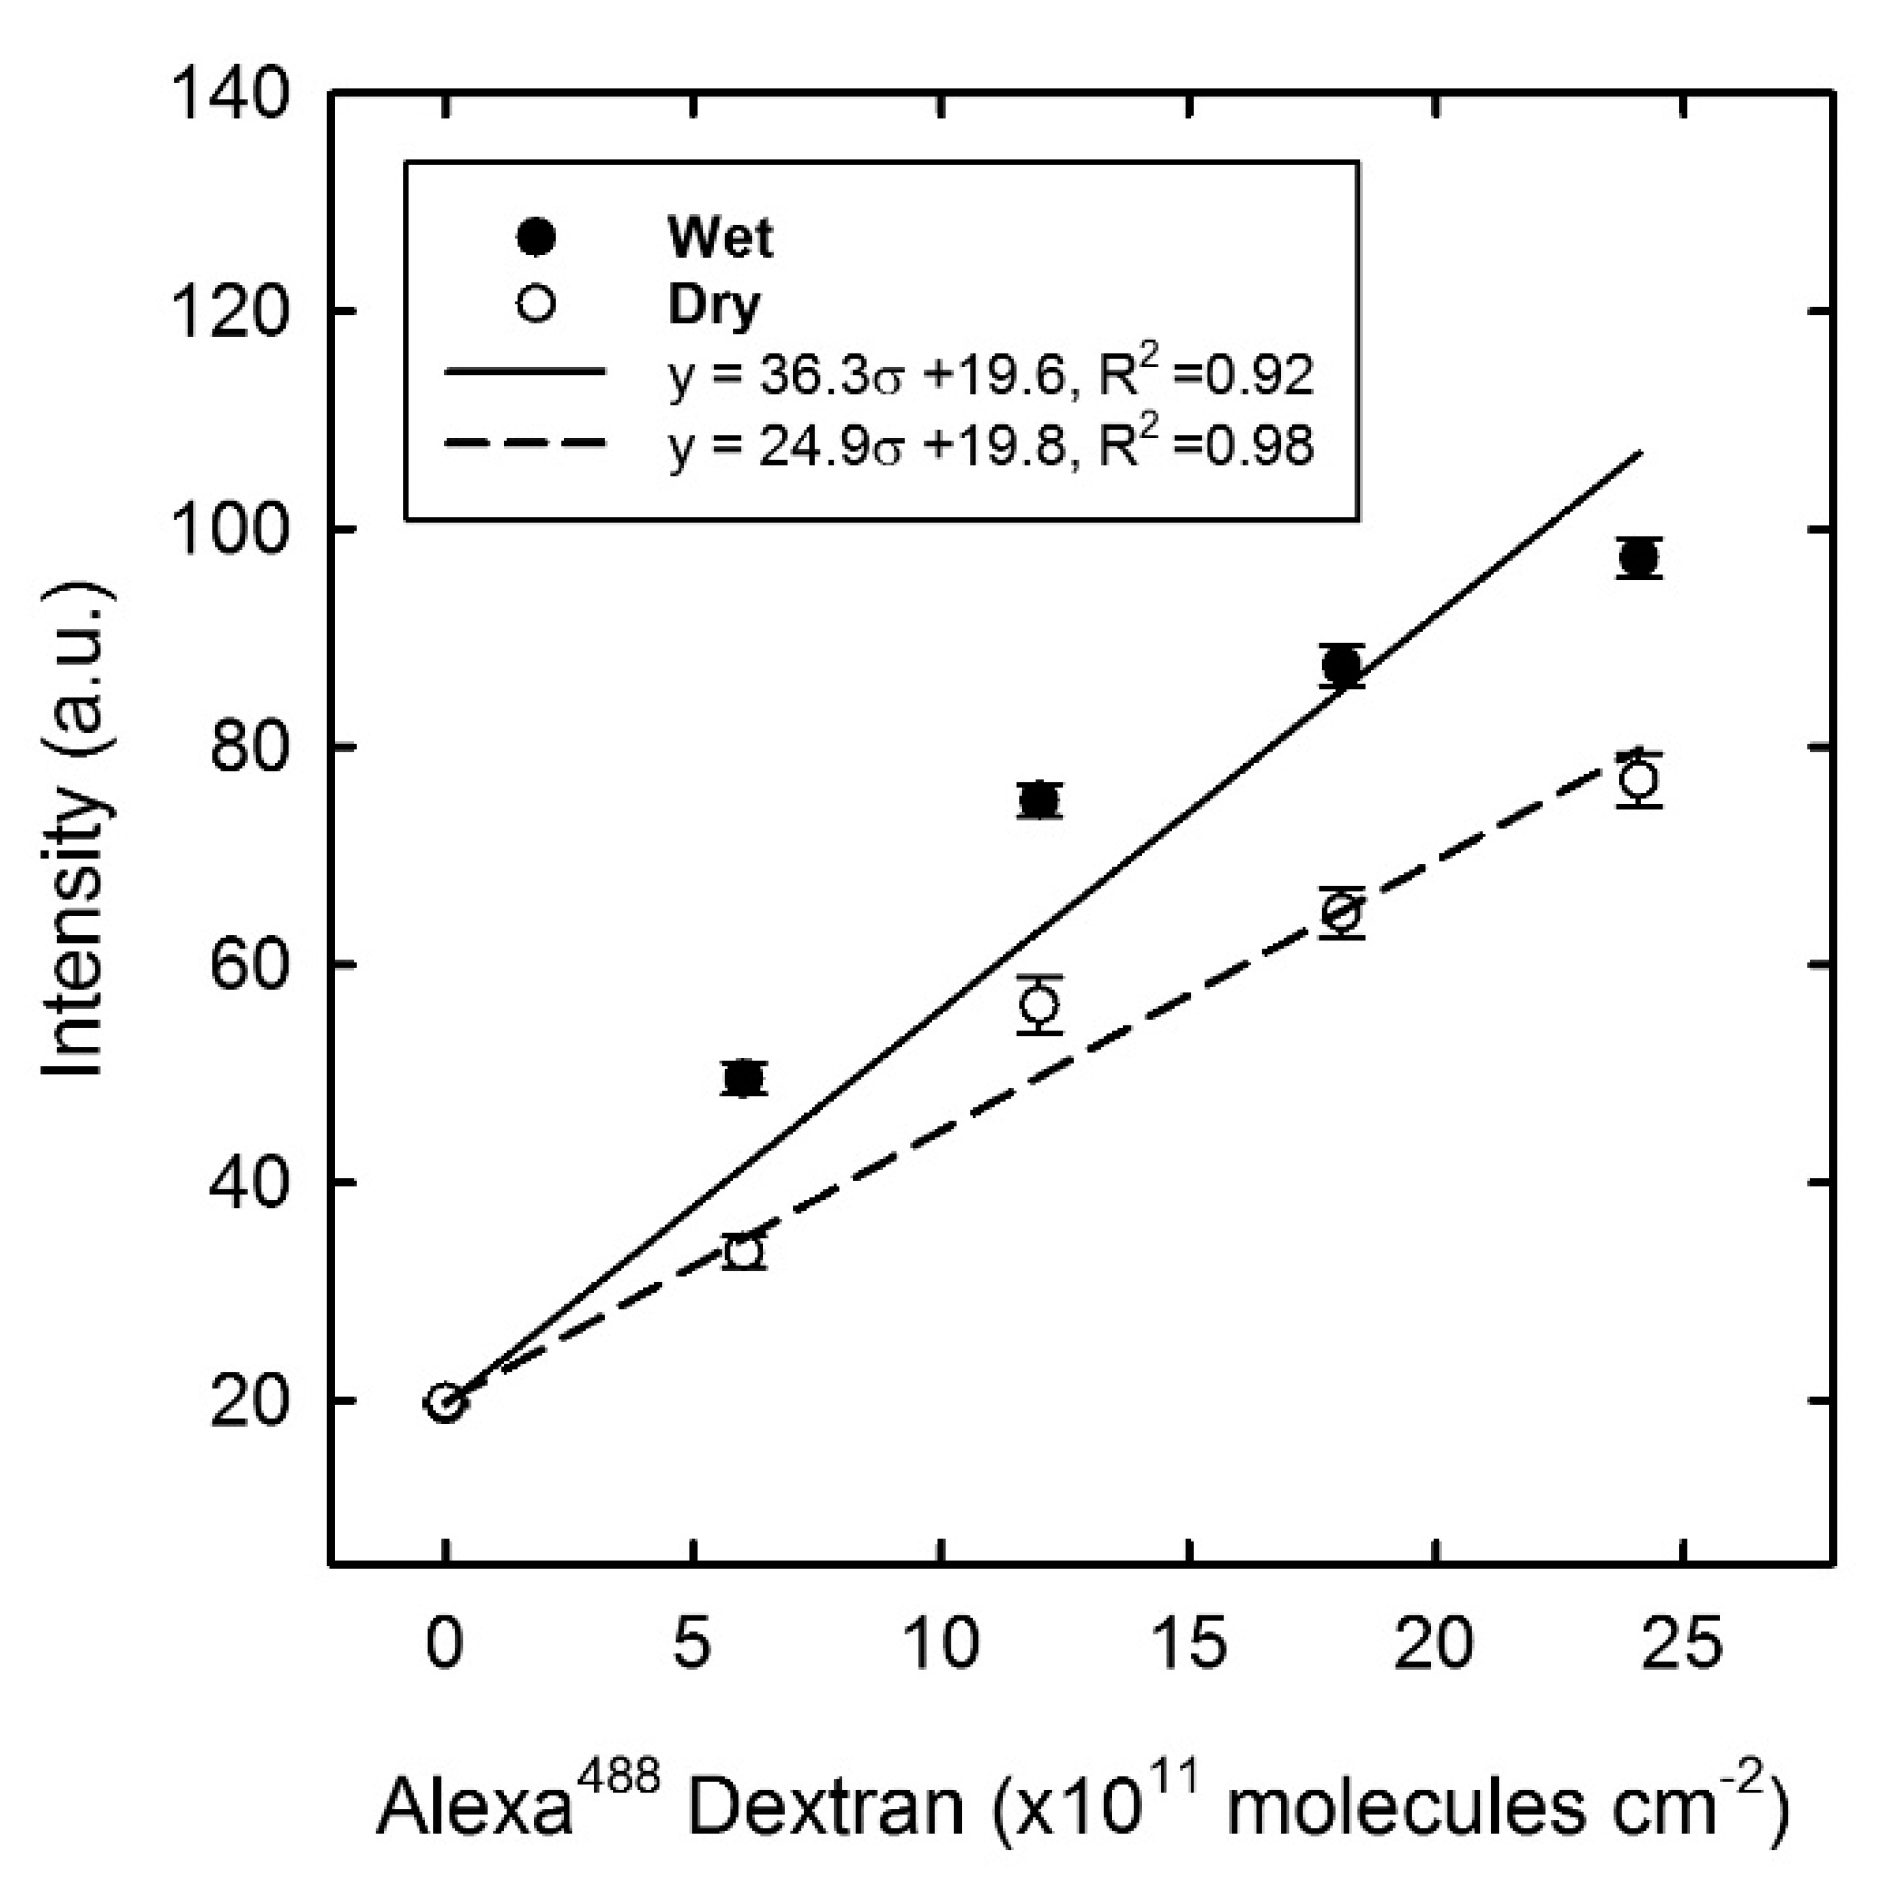
3.3. Fluorescence Calibration

3.3.1. Alexa 488 Dextran
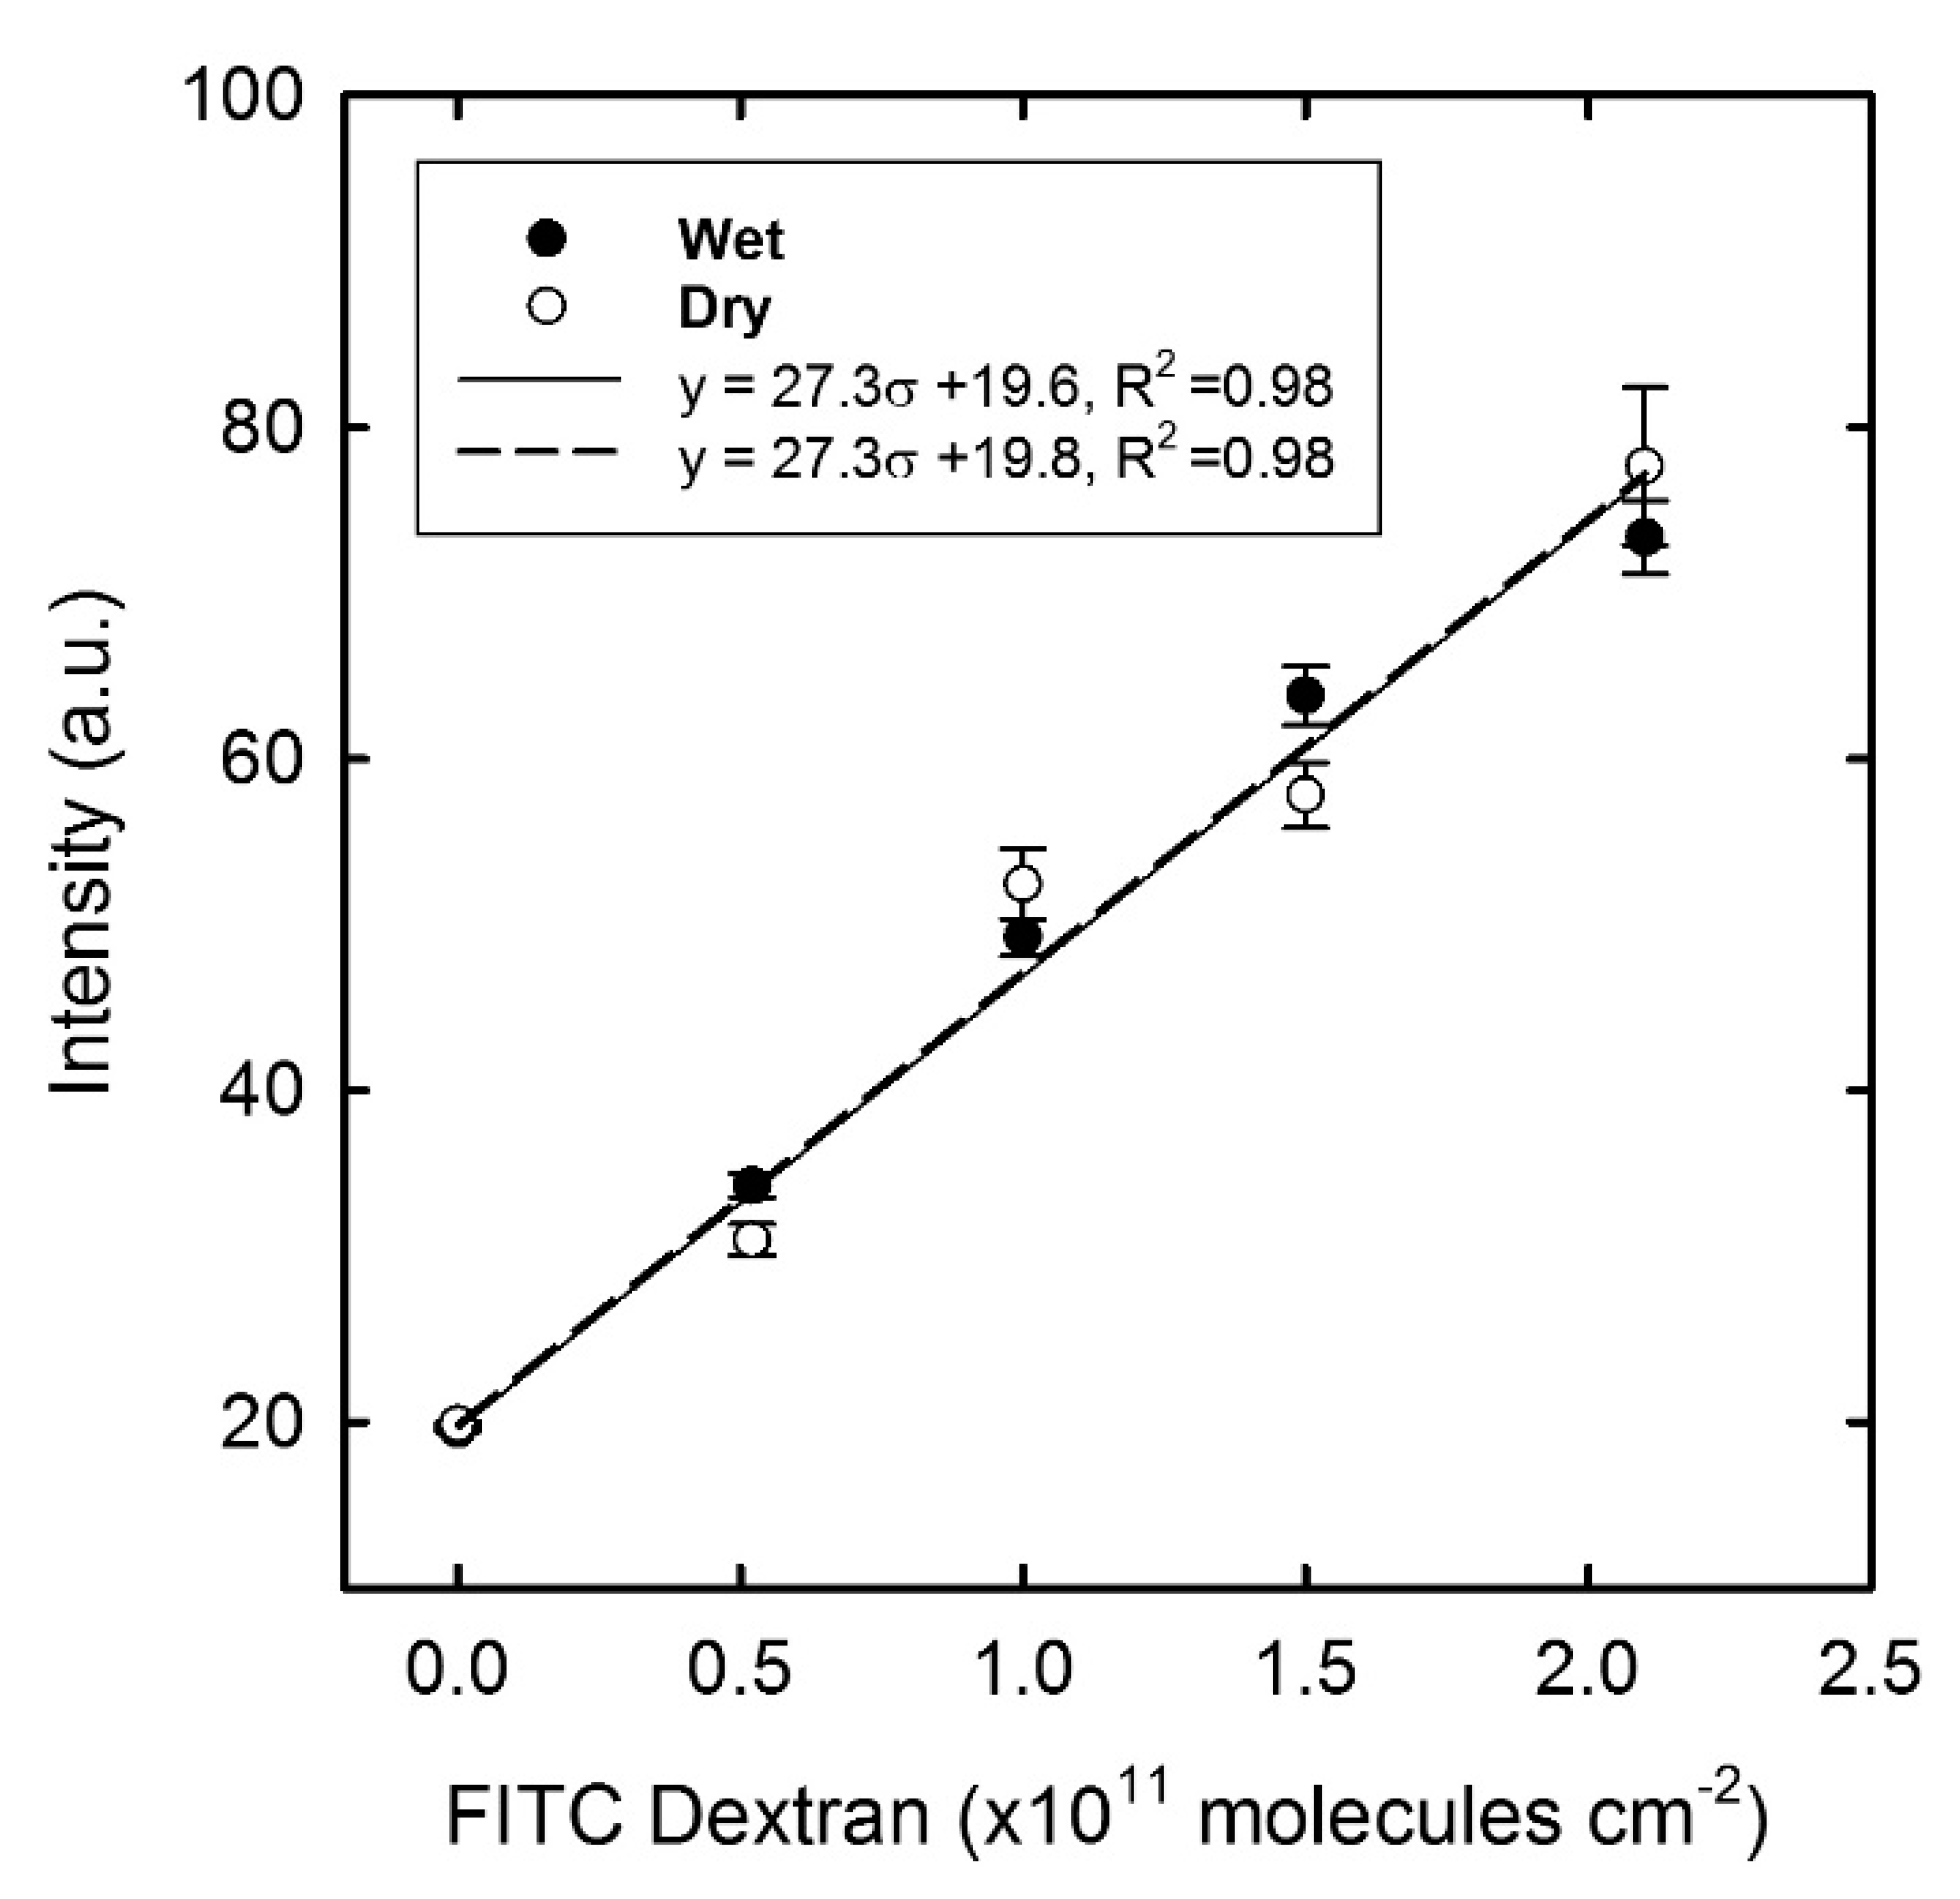
The fluorescence intensity recorded from the Alexa 488 Dextran in the calibration has been subject to a linear regression analysis as a function of the surface density σ given for both the wet and dry state (Figure 8). The density range mirrors the average fluorescence intensity recorded in the experimental results, and it became clear that the intensity from the dried specimen is lower compared to the wet state. One possible explanation comes from a difference in the quantum yield, where the fluorophore in the dehydrated state may quench the fluorescence emission [42]. The fluorescence intensity of the immobilised samples was all measured in the dry state and hence the calibration line for the “dry state” was applied to estimate the number of Alexa 488 dextran molecules on the sample surface. Thus, the observed fluorescence intensity from dextran bound to the immobilised Con A Figure 7) was then converted to the number of bound dextran molecules, in which the maximum number (2.1 × 10¹² molecules per cm2) should correlate with the number of functional Con A molecules at the surface (irrespective of their tertiary form and assuming that each Con A monomer have one carbohydrate binding site). After incubation in a MOPS buffer containing cglu = 40 mM, the number of Alexa dextran molecules remaining on the surface was reduced to 6.1 × 10¹¹ molecules per cm2.

3.3.2. FITC Dextran

The average fluorescence intensity was obtained for the σ range of FITC dextran (Figure 9) in which the maximum number of bound FITC dextran molecules after incubation (Figure 7), was estimated to be 1.8 × 10¹¹ molecules per cm2 (based on the observed calibration for the “dry state”). This number was lower compared to the value obtained with Alexa 488 dextran. A possible reason for this discrepancy is the different molecular weight of the two types of dextran molecules. The hydrodynamic diameter of FITC dextran (MW = 70 kDa) is larger than the Con A monomer molecule with a published dimension of 4.2 × 4.0 × 3.9 nm3 [43]. In fact, the size of the FITC dextran is closer to the dimension of the Con A tetramer (6.3 × 11.8 × 16.5 nm3) [44] with four binding sites. If the labelling molecule is larger than the molecule aimed to be detected, the labelling molecule may cover several active Con A molecules and hence obstruct the binding of a second dextran molecule to an active Con A. Another reason might be the association between the long chain dextran and binding sites on multiple Con A molecules [45]. Therefore, the molecular weight of dextran may have an effect on the quantitative result. The smaller Alexa 488 dextran (MW = 3 kDa) has a hydrodynamic diameter below that of Con A, which would facilitate binding to only one active Con A molecule, and with a lower tendency of obstructing the binding site of the neighbouring monomer/molecule. A similar observation was made in the paper by Shiraishi et al. [46].

3.3.3. Surface Density Analysis

The theoretical density of the immobilised Con A was calculated based on published dimensional data of a Con A monomeric unit in an aqueous solution [43]. The corresponding hydrodynamic diameter would be approximately 4 nm, and if packed side by side would yield a total number of 6.25 × 10¹² molecules per cm2, (or 7.22 × 10¹² per cm2 if stacked hexagonally). This is comparable to the calculated value published in the literature [47], and would also be the theoretical maximum number of fluorescence dextran molecules if we consider one active binding site per Con A molecule. This assumption is based on an ideally flat quartz surface, and any additional surface roughness would increase the effective area and consequently the number of immobilised Con A molecules per cm2. Hence, an increased surface roughness could potentially improve the sensitivity of a gravimetric sensor when used to detect glucose using Con A. The number of Alexa 488 dextran and FITC dextran that binds to the immobilised surface is calculated from the fluorescence intensity measurements and the results are presented in Table 2. It was found that the maximum amount of Alexa 488 dextran after immobilisation was about one third of the maximum theoretical density.
The ratio between surface density of Alexa 488 dextran and FITC dextran bound to an immobilised Con A surface is calculated to be approximately 12, which is comparable to the ratio between their hydrodynamic diameters (DF/DA)2 ≈ 19. This suggests that larger labelling molecules may cover multiple binding sites as explained in Section 3.3.2.
The difference in the number of fluorescent labelled dextran before and after incubation in cglu = 40 mM was found to be 1.5 × 10¹² per cm2 for the Alexa 488 dextran and 1.3 x 10¹¹ per cm2 for the FITC dextran. This would correspond to a theoretical mass change of 7.5 × 10⁻⁹ g per cm2 and 1.5 × 10⁻⁸ g per cm2 respectively (Table 2). Despite the Alexa 488 dextran yielding a larger change in absolute number and fluorescence intensity, the FITC dextran yields an almost 2 fold increase in mass change. This suggests that the FITC dextran will be more effective in triggering a mass change in a gravimetric glucose sensor compared to the Alexa 488 dextran in the presence of glucose.
The polished SiO2 substrates would not offer any large increase in the effective surface area, and the stacking of the Con A molecules would be a function of active binding sites to the underlying silane layer, which could have regions of defect. The estimated density assumed Con A to be in its monomeric form, and any other configurations (dimer, trimer or tetramer) or a combination thereof would most likely result in a lower stacking density due to a less ordered monolayer structure. Some of the binding sites on the Con A molecules may also have been inactive or oriented away from the surface, and as such did not bind to the dextran molecules masking away the presence of the underlying Con A. The approximately 3-fold reduction in density following incubation with 40 mM glucose demonstrates that the affinity assay is working and that glucose will displace most, but not all of the dextran molecules.

3.4. Note on Toxicity and Interferring Substances

The toxic response of Con A has been evaluated by Ballerstadt [30], who showed that the systemic effects on the body would be dependent on the dose and route of administration. Converting results from rodents into an equivalent human dose suggests that subcutaneous injections (representative of a leaking biosensor) would result in a local inflammation (hemorrhagic skin lesions) of up to a concentration of 0.9 × 10⁻² mg per kg. The equivalent amount released from an implantable biosensor used in the study would be 1.5 × 10⁻⁴ mg per kg (or 60 times smaller). In contrast, the intravenous LD50 dose was reported to be 2.2 × 10⁻² mg per kg. Given that some of the Con A could migrate from the implantation site and into the bloodstream, it is highly unlikely that a ruptured Con A based biosensor would cause any systemic toxicity. Furthermore, immobilisation of the Con A onto the sensor surface, as proposed in this study, should prevent any unwanted release of the lectin in the case of a compromised sensor.
Being a sugar binding lectin, Con A, may not be able to discriminate between glucose, dextran and other carbohydrates in the surrounding medium since it has an affinity towards α-mannosyl, α-glycosyl and α-N-acetylglucosaminyl groups. Carbohydrates are abundant in biology, and any competing ligand would play a detrimental role in the specificity of a Con A based glucose sensor. Studies performed by Krushinitskaya on key dietary components [48] showed that although competing carbohydrates exist in the human body, their concentration would generate error signals below the detection limit of conventional glucose sensors.

4. Conclusions

A simple protocol for the immobilisation of Con A on a quartz substrate has been developed. The binding activity of the immobilised Con A was assessed by measuring the intensity from fluorescent labelled dextran over a glucose concentration range from 0–40 mM whereas any structural changes to the surface topography were investigated using AFM. Complementing measurements from both the AFM and fluorescence intensity verified that a change in the intensity was accompanied with a change in the average surface roughness and thereby the composition (addition and loss of dextran) at the sample surface. Controls performed with no immobilised Con A verified that any unspecific binding of fluorescent labelled dextran did not take place. The binding of Alexa 488 dextran with a dimension smaller than Con A was found to represent a simple and rapid method to estimate the number of bound fluorescent labelled dextran, and hence, functional Con A molecules attached to the sample surface. This work has shown that Con A, immobilised on a quartz surface using the simplified immobilisation protocol described in this paper, is able to bind to a larger dextran molecule as well as to a smaller glucose molecule in a competitive manner. The substitution of dextran with glucose and vice versa will result in a mass or viscoelastic change at the interface between the immobilised Con A and the surrounding media. Although the Alexa 488 dextran exhibited larger numbers and fluorescence intensities, the FITC dextran is predicted to give a larger absolute mass change. This change as a function of glucose concentration will be explored in the design of a new, miniaturised gravimetric glucose sensor based on acoustic wave resonators.

Author Contributions

The authors have made the following contributions to the paper: Conceptualization, formal analysis, validation and investigation, all authors; Methodology and Data Curation, T.B.H. and B.T.S.; Software and Original Draft Preparation, T.B.H.; Review & Editing, Supervision, A.J., U.H., B.T.S. and E.A.J.; Visualization, T.B.H., B.T.S. and E.A.J.; Project administration, resources and funding: A.J.

Acknowledgments

The Research Council of Norway is acknowledged for the support to the Norwegian Micro and Nano-fabrication facility, NorFab (197411/V30) and the Norwegian Ph.D. Network on Nanotechnology for Microsystems, Nano-Network (221860/F40). We would also like to thank technical staff at the University of South-Eastern Norway for the help and support, and Mrs. Gjertrud Maurstad at the Norwegian University of Science and Technology (NTNU) for the assistance in developing the immobilisation protocol and for taking the AFM images.

Conflicts of Interest

The authors declare no conflict of interest.

References

  1. Sumner, J.B.; Howell, S.F. The Non-Identity of Jack Bean Agglutinin with Crystalline Urease. J. Immunol. 1935, 29, 133–134. [Google Scholar]
  2. Peumans, W.J.; Vandamme, E.J.M. The Role of Lectins in Plant Defense. Histochem.J. 1995, 27, 253–271. [Google Scholar] [CrossRef] [PubMed]
  3. Liener, I.E.; Sharon, N.; Goldstein, I.J. The Lectins: Properties, Functions, and Applications in Biology and Medicine; Academic Press: Orlando, FL, USA, 1986; p. 600. [Google Scholar]
  4. Dainiak, M.B.; Galaev, I.Y.; Mattiasson, B. Affinity cryogel monoliths for screening for optimal separation conditions and chromatographic separation of cells. J. Chromatogr. A 2006, 1123, 145–150. [Google Scholar] [CrossRef] [PubMed]
  5. Gamella, M.; Campuzano, S.; Parrado, C.; Reviejo, A.J.; Pingarron, J.M. Microorganisms recognition and quantification by lectin adsorptive affinity impedance. Talanta 2009, 78, 1303–1309. [Google Scholar] [CrossRef] [PubMed]
  6. Yavuz, H.; Akgöl, S.; Arica, Y.; Denizli, A. Concanavalin A Immobilized Affinity Adsorbents for Reversible Use in Yeast Invertase Adsorption. Macromol. Biosci. 2004, 4, 674–679. [Google Scholar] [CrossRef] [PubMed]
  7. Castro, S.; Duff, M.; Snyder, N.L.; Morton, M.; Kumar, C.V.; Peczuh, M.W. Recognition of septanose carbohydrates by concanavalin A. Org. Biomol. Chem. 2005, 3, 3869–3872. [Google Scholar] [CrossRef] [PubMed]
  8. Müller, U.; Sengbusch, P.V. Interactions of species in an Anabaena flos-aquae association from the Plußsee (East-Holstein, Federal Republic of Germany). Oecologia 1983, 58, 215–219. [Google Scholar] [CrossRef] [PubMed]
  9. Zhou, X.; Liu, L.; Hu, M.; Wang, L.; Hu, J. Detection of hepatitis B virus by piezoelectric biosensor. J. Pharm. Biomed. Anal. 2002, 27, 341–345. [Google Scholar] [CrossRef]
  10. Mansouri, S.; Schultz, J.S. A miniature optical glucose sensor based on affinity binding. Bio-Technology 1984, 2, 885–890. [Google Scholar] [CrossRef]
  11. Ballerstadt, R.; Polak, A.; Beuhler, A.; Frye, J. In vitro long-term performance study of a near-infrared fluorescence affinity sensor for glucose monitoring. Biosens. Bioelectron. 2004, 19, 905–914. [Google Scholar] [CrossRef]
  12. Ballerstadt, R.; Evans, C.; Gowda, A.; McNichols, R. In vivo performance evaluation of a transdermal near-infrared fluorescence resonance energy transfer affinity sensor for continuous glucose monitoring. Diabetes Technol. Ther. 2006, 8, 296–311. [Google Scholar] [CrossRef]
  13. Johannessen, E.; Krushinitskaya, O.; Sokolov, A.; Häfliger, P.; Hoogerwerf, A.; Hinderling, C.; Kautio, K.; Lenkkeri, J.; Esko Strommer, E.; Kondratyev, V.; et al. Toward an injectable continuous osmotic glucose sensor. J. Diabetes Sci. Technol. 2010, 4, 882–892. [Google Scholar] [CrossRef] [PubMed]
  14. Clark, L.C., Jr.; Lyons, C. Electrode systems for continuous monitoring in cardiovascular surgery. Ann. N. Y. Acad. Sci. 1962, 102, 29–45. [Google Scholar] [CrossRef]
  15. Valdes, T.I.; Moussy, F. In vitro and in vivo degradation of glucose oxidase enzyme used for an implantable glucose biosensor. Diabetes Technol. Ther. 2000, 2, 367–376. [Google Scholar] [CrossRef] [PubMed]
  16. Heller, A.; Feldman, B. Electrochemical Glucose Sensors and Their Applications in Diabetes Management. Chem. Rev. 2008, 108, 2482–2505. [Google Scholar] [CrossRef] [Green Version]
  17. Forrow, N.J.; Bayliff, S.W. A commercial whole blood glucose biosensor with a low sensitivity to hematocrit based on an impregnated porous carbon electrode. Biosens. Bioelectron. 2005, 21, 581–587. [Google Scholar] [CrossRef] [PubMed]
  18. Tang, Z.; Louie, R.F.; Lee, J.H.; Lee, D.M.; Miller, E.E.; Kost, G.J. Oxygen effects on glucose meter measurements with glucose dehydrogenase- and oxidase-based test strips for point-of-care testing. Crit. Care Med. 2001, 29, 1062–1070. [Google Scholar] [CrossRef] [PubMed]
  19. Reach, G.; Wilson, G.S. Can continuous glucose monitoring be used for the treatment of diabetes. Anal. Chem. 1992, 64, A381–A386. [Google Scholar]
  20. Wang, J. Glucose Biosensors: 40 Years of Advances and Challenges. Electroanalysis 2001, 13, 983–988. [Google Scholar] [CrossRef]
  21. Gough, D.A.; Kumosa, L.S.; Routh, T.L.; Lin, J.T.; Lucisano, J.Y. Function of an Implanted Tissue Glucose Sensor for More than 1 Year in Animals. Sci. Transl. Med. 2010, 2, 8. [Google Scholar] [CrossRef]
  22. Li, Y.; Hodak, M.; Lu, W.; Bernholc, J. Selective sensing of ethylene and glucose using carbon-nanotube-based sensors: An ab initio investigation. Nanoscale 2017, 9, 1687–1698. [Google Scholar] [CrossRef] [PubMed]
  23. Wei, H.; Wang, E. Nanomaterials with enzyme-like characteristics (nanozymes): Next-generation artificial enzymes. Chem. Soc. Rev. 2013, 42, 6060–6093. [Google Scholar] [CrossRef] [PubMed]
  24. Wang, G.; He, X.; Wang, L.; Gu, A.; Huang, Y.; Fang, B.; Geng, B.; Zhang, X. Non-enzymatic electrochemical sensing of glucose. Microchim. Acta 2013, 180, 161–186. [Google Scholar] [CrossRef]
  25. Barone, P.W.; Yoon, H.; Ortiz-García, R.; Zhang, J.; Ahn, J.-H.; Kim, J.-H.; Strano, M. Modulation of Single-Walled Carbon Nanotube Photoluminescence by Hydrogel Swelling. ACS Nano 2009, 3, 3869–3877. [Google Scholar] [CrossRef] [PubMed]
  26. Li, L.; Gao, F.; Ye, J.; Chen, Z.; Li, Q.; Gao, W.; Ji, L.; Zhang, R.; Tang, B. FRET-based biofriendly apo-GO(x)-modified gold nanoprobe for specific and sensitive glucose sensing and cellular imaging. Anal. Chem. 2013, 85, 9721–9727. [Google Scholar] [CrossRef] [PubMed]
  27. Gabl, R.; Feucht, H.D.; Zeininger, H.; Eckstein, G.; Schreiter, M.; Primig, R.; Pitzer, D.; Wersing, W. First results on label-free detection of DNA and protein molecules using a novel integrated sensor technology based on gravimetric detection principles. Biosens. Bioelectron. 2004, 19, 615–620. [Google Scholar] [CrossRef]
  28. Tang, D.P.; Li, Q.F.; Tang, J.A.; Su, B.L.; Chen, G.N. An enzyme-free quartz crystal microbalance biosensor for sensitive glucose detection in biological fluids based on glucose/dextran displacement approach. Anal. Chim. Acta 2011, 686, 144–149. [Google Scholar] [CrossRef] [PubMed]
  29. Vellekoop, M.J. Acoustic wave sensors and their technology. Ultrasonics 1998, 36, 7–14. [Google Scholar] [CrossRef]
  30. Ballerstadt, R.; Evans, C.; McNichols, R.; Gowda, A. Concanavalin A for in vivo glucose sensing: A biotoxicity review. Biosens. Bioelectron. 2006, 22, 275–284. [Google Scholar] [CrossRef]
  31. Barnes, C.; Dsilva, C.; Jones, J.P.; Lewis, T.J. A Concanavalin A—Coated Piezoelectric Crystal Biosensor. Sens. Actuators B Chem. 1991, 3, 295–304. [Google Scholar] [CrossRef]
  32. Hong, S.A.; Kwon, J.; Kim, D.; Yang, S. A rapid, sensitive and selective electrochemical biosensor with concanavalin A for the preemptive detection of norovirus. Biosens. Bioelectron. 2015, 64, 338–344. [Google Scholar] [CrossRef] [PubMed]
  33. Olmsted, I.R.; Kussrow, A.; Bornhop, D.J. Comparison of Free-Solution and Surface-Immobilized Molecular Interactions Using a Single Platform. Anal. Chem. 2012, 84, 10817–10822. [Google Scholar]
  34. Cass, T.; Ligler, F.S. Immobilized Biomolecules in Analysis; Oxford University Press: Oxford, UK, 2000; p. 240. [Google Scholar]
  35. Venn, R.F. Principles and Practice of Bioanalysis, 2nd ed.; CRC Press: Boca Raton, FL, USA, 2008. [Google Scholar]
  36. Kremer, F.J.B.; Engbersen, J.F.J.; Kruise, J.; Bergveld, P.; Starmans, D.a.J.; Feijen, J.; Reinhoudt, D.N. Immobilization and activity of Concanavalin A on tantalum pentoxide and silicon dioxide surfaces. Sens. Actuators B Chem. 1993, 13, 176–179. [Google Scholar] [CrossRef] [Green Version]
  37. Tan, Y.H.; Fujikawa, K.; Pornsuriyasak, P.; Alla, A.J.; Vijaya Ganesh, N.; Demchenko, A.V.; Stine, K.J. Lectin-carbohydrate interactions on nanoporous gold monoliths. New J. Chem. 2013, 37, 2150–2165. [Google Scholar] [CrossRef] [PubMed]
  38. Valenga, F.; Petri, D.F.S.; Lucyszyn, N.; Jó, T.A.; Sierakowski, M.R. Galactomannan thin films as supports for the immobilization of Concanavalin A and/or dengue viruses. Int. J. Biol. Macromol. 2012, 50, 88–94. [Google Scholar] [CrossRef] [PubMed] [Green Version]
  39. Nečas, D.; Klapetek, P. Gwyddion: An open-source software for SPM data analysis. Cent. Eur. J. Phys. 2012, 10, 181–188. [Google Scholar] [CrossRef]
  40. Choi, J.J.; Wang, S.; Tung, Y.-S.; Morrison, B., III; Konofagou, E.E. Molecules of various pharmacologically-relevant sizes can cross the ultrasound-induced blood-brain barrier opening in vivo. Ultrasound Med. Biol. 2010, 36, 58–67. [Google Scholar] [CrossRef]
  41. Becker, J.; Reeke, G.N., Jr.; Wang, J.L.; Cunningham, B.A.; Edelman, G.M. The Covalent and Three-Dimensional Structure of Concanavalin A III. Structure of the monomer and its interactions with metals and saccharides. J. Biol. Chem. 1975, 260, 1513–1524. [Google Scholar]
  42. Bindhu, C.V.; Harilal, S.S.; Nampoori, V.P.N.; Vallabhan, C.P.G. Solvent effect on absolute fluorescence quantum yield of rhodamine 6G determined using transient thermal lens technique. Mod. Phys. Lett. B 1999, 13, 563–576. [Google Scholar] [CrossRef]
  43. Edelman, G.M.; Cunningham, B.A.; Reeke, G.N., Jr.; Becker, J.W.; Waxdal, M.J.; Wang, J.L. The Covalent and Three-Dimensional Structure of Concanavalin A. Proc. Natl. Acad. Sci. USA 1972, 69, 2580–2584. [Google Scholar] [CrossRef] [Green Version]
  44. Lebed, K.; Pyka-Fosciak, G.; Raczkowska, J.; Lekka, M.; Styczen, J. Binding activity of patterned concanavalin A studied by atomic force microscopy. J. Phys. Condens. Matter 2005, 17, S1447–S1458. [Google Scholar] [CrossRef]
  45. Chinnayelka, S.; McShane, M.J. Glucose-sensitive nanoassemblies comprising affinity-binding complexes trapped in fuzzy microshells. J. Fluoresc. 2004, 14, 585–595. [Google Scholar] [CrossRef] [PubMed]
  46. Shiraishia, Y.; Akiyamaa, M.; Satob, T.; Hattorib, M.; Komatsua, T. Size-dependent dextran loading in protein nanotube with an interior wall of concanavalin A. Polym. Adv. Technol. 2014, 24, 1247–1251. [Google Scholar] [CrossRef]
  47. Serra, B.; Gamella, M.; Reviejo, A.J.; Pingarron, J.M. Lectin-modified piezoelectric biosensors for bacteria recognition and quantification. Anal. Bioanal. Chem. 2008, 391, 1853–1860. [Google Scholar] [CrossRef] [PubMed]
  48. Krushinitskaya, O.; Tonnessen, T.I.; Jakobsen, H.; Johannessen, E. The assessment of potentially interfering metabolites and dietary components in blood using an osmotic glucose sensor based on the concanavalin A-dextran affinity assay. Biosens. Bioelectron. 2011, 28, 195–203. [Google Scholar] [CrossRef] [PubMed]
Figure 1. Schematic representation of various steps of the immobilisation protocol: (a) hydroxylation, (b) silanisation, (c) Con A immobilisation, and (d) chemical reaction between the functional groups of the silane and the Con A, (e) Dextran binds to immobilised Con A, (f) Glucose competitive binds to Con A and replaces dextran.
Applsci 09 00318 g001
Figure 2. Atomic force microscopy (AFM) images from the immobilisation process. (a) Native SiO2 sample, (ID1) (b) after silanisation, (ID2) and (c) after Con A immobilisation (ID3).
Applsci 09 00318 g002
Figure 3. 3D rendered atomic force microscopy (AFM) image after Con A immobilisation, sample ID3. All units in nm.
Applsci 09 00318 g003
Figure 4. Atomic force microscopy (AFM) image of the sample (ID5) incubated with (a) Fluorescein isothiocyanate (FITC) dextran, and (b) FITC dextran with 40 mM glucose.
Applsci 09 00318 g004
Figure 5. Atomic force microscopy (AFM) image of the sample (ID7) incubated with (a) Alexa 488 dextran, and (b) Alexa 488 dextran with 40 mM glucose.
Applsci 09 00318 g005
Figure 6. Single fluorescence intensity images of a sample (ID6, Table 1) following Con A immobilisation, and Alexa 488 dextran incubation. The image intensity changed by immersing the sample (ID7, Table 1) with a 3-(N-morpholino) propanesulfonic acid (MOPS) buffer containing different concentrations of glucose, depicted in image series (a) to (e). The reference sample without Con A immobilisation is shown in (f). Image size 1.3 × 1.7 mm2. The scale bar corresponds to 250 μm.
Applsci 09 00318 g006
Figure 7. Average fluorescent intensity for FITC and Alexa dextran 488 following Con A immobilisation and fluorophore incubation (sample ID 4, 5, 6 and 7, Table 1), following immersion with MOPS buffer containing glucose at increasing concentrations (cglu from 0 to 40 mM), n = 30.
Applsci 09 00318 g007
Figure 8. Calibration graph of the Alexa 488 dextran in the wet and dry state, with linear regression fitting. Error bars represent the standard error of the mean, n = 30.
Applsci 09 00318 g008
Figure 9. Calibration graph showing the average intensity of FITC dextran in the wet and dry state with linear regression fitting. Error bars represent the standard error of the mean, n = 30.
Applsci 09 00318 g009
Table 1. Sample ID notation, process preparation, and average roughness of the atomic force microscopy (AFM) image. FITC: fluorescein isothiocyanate.
Sample ID DescriptionDuration (min)Number of ScansRoughness, Ra (nm)
1Substrate samples (quartz) after dicing and cleaning (acetone, ethanol and DI water)2060.12 ± 0.04
2Hydroxylation and silanisation step6040.15 ± 0.05
3Con A immobilisation step120100.60 ± 0.16
4FITC-dextran incubation3081.14 ± 0.35
5FITC-dextran incubation (cglu = 40 mM)30101.12 ± 0.50
6Alexa-dextran incubation3080.77 ± 0.05
7Alexa-dextran incubation (cglu = 40 mM)30110.76 ± 0.22
Table 2. Density of Alexa 488 and fluorescein isothiocyanate (FITC) dextran molecules bound to the Con A immobilised surface. MOPS: 3-(N-morpholino) propanesulfonic acid.
Alexa (MW = 3 kDa)FITC (MW = 70 kDa)
I (a.u.) σ (cm−2)I (a.u.)σ (cm−2)
Incubation in MOPS buffer732.1 × 1012691.8 × 1011
Incubation, cglu = 40 mM356.1 × 1011334.8 × 1010
Difference (cglu = 0–40 mM)381.5 × 1012361.3 × 1011
Number of moles (mol cm−2) 2.5 × 10⁻¹² 2.2 × 10⁻¹³
Mass change (g cm−2) 7.5 × 10⁻⁹ 1.5 × 10⁻⁸

