Investigation of the Fatigue Behaviour of a Ballastless Slab Track–Bridge Structural System under Train Load


Abstract
:1. Introduction
2. Material Constitutive Model and Interface Cohesive Zone Model
2.1. Static and Fatigue Damage Constitutive Model of Concrete
2.2. Static and Fatigue Damage Constitutive Model of the CA Mortar
2.3. Interface Cohesive Zone Constitutive Model
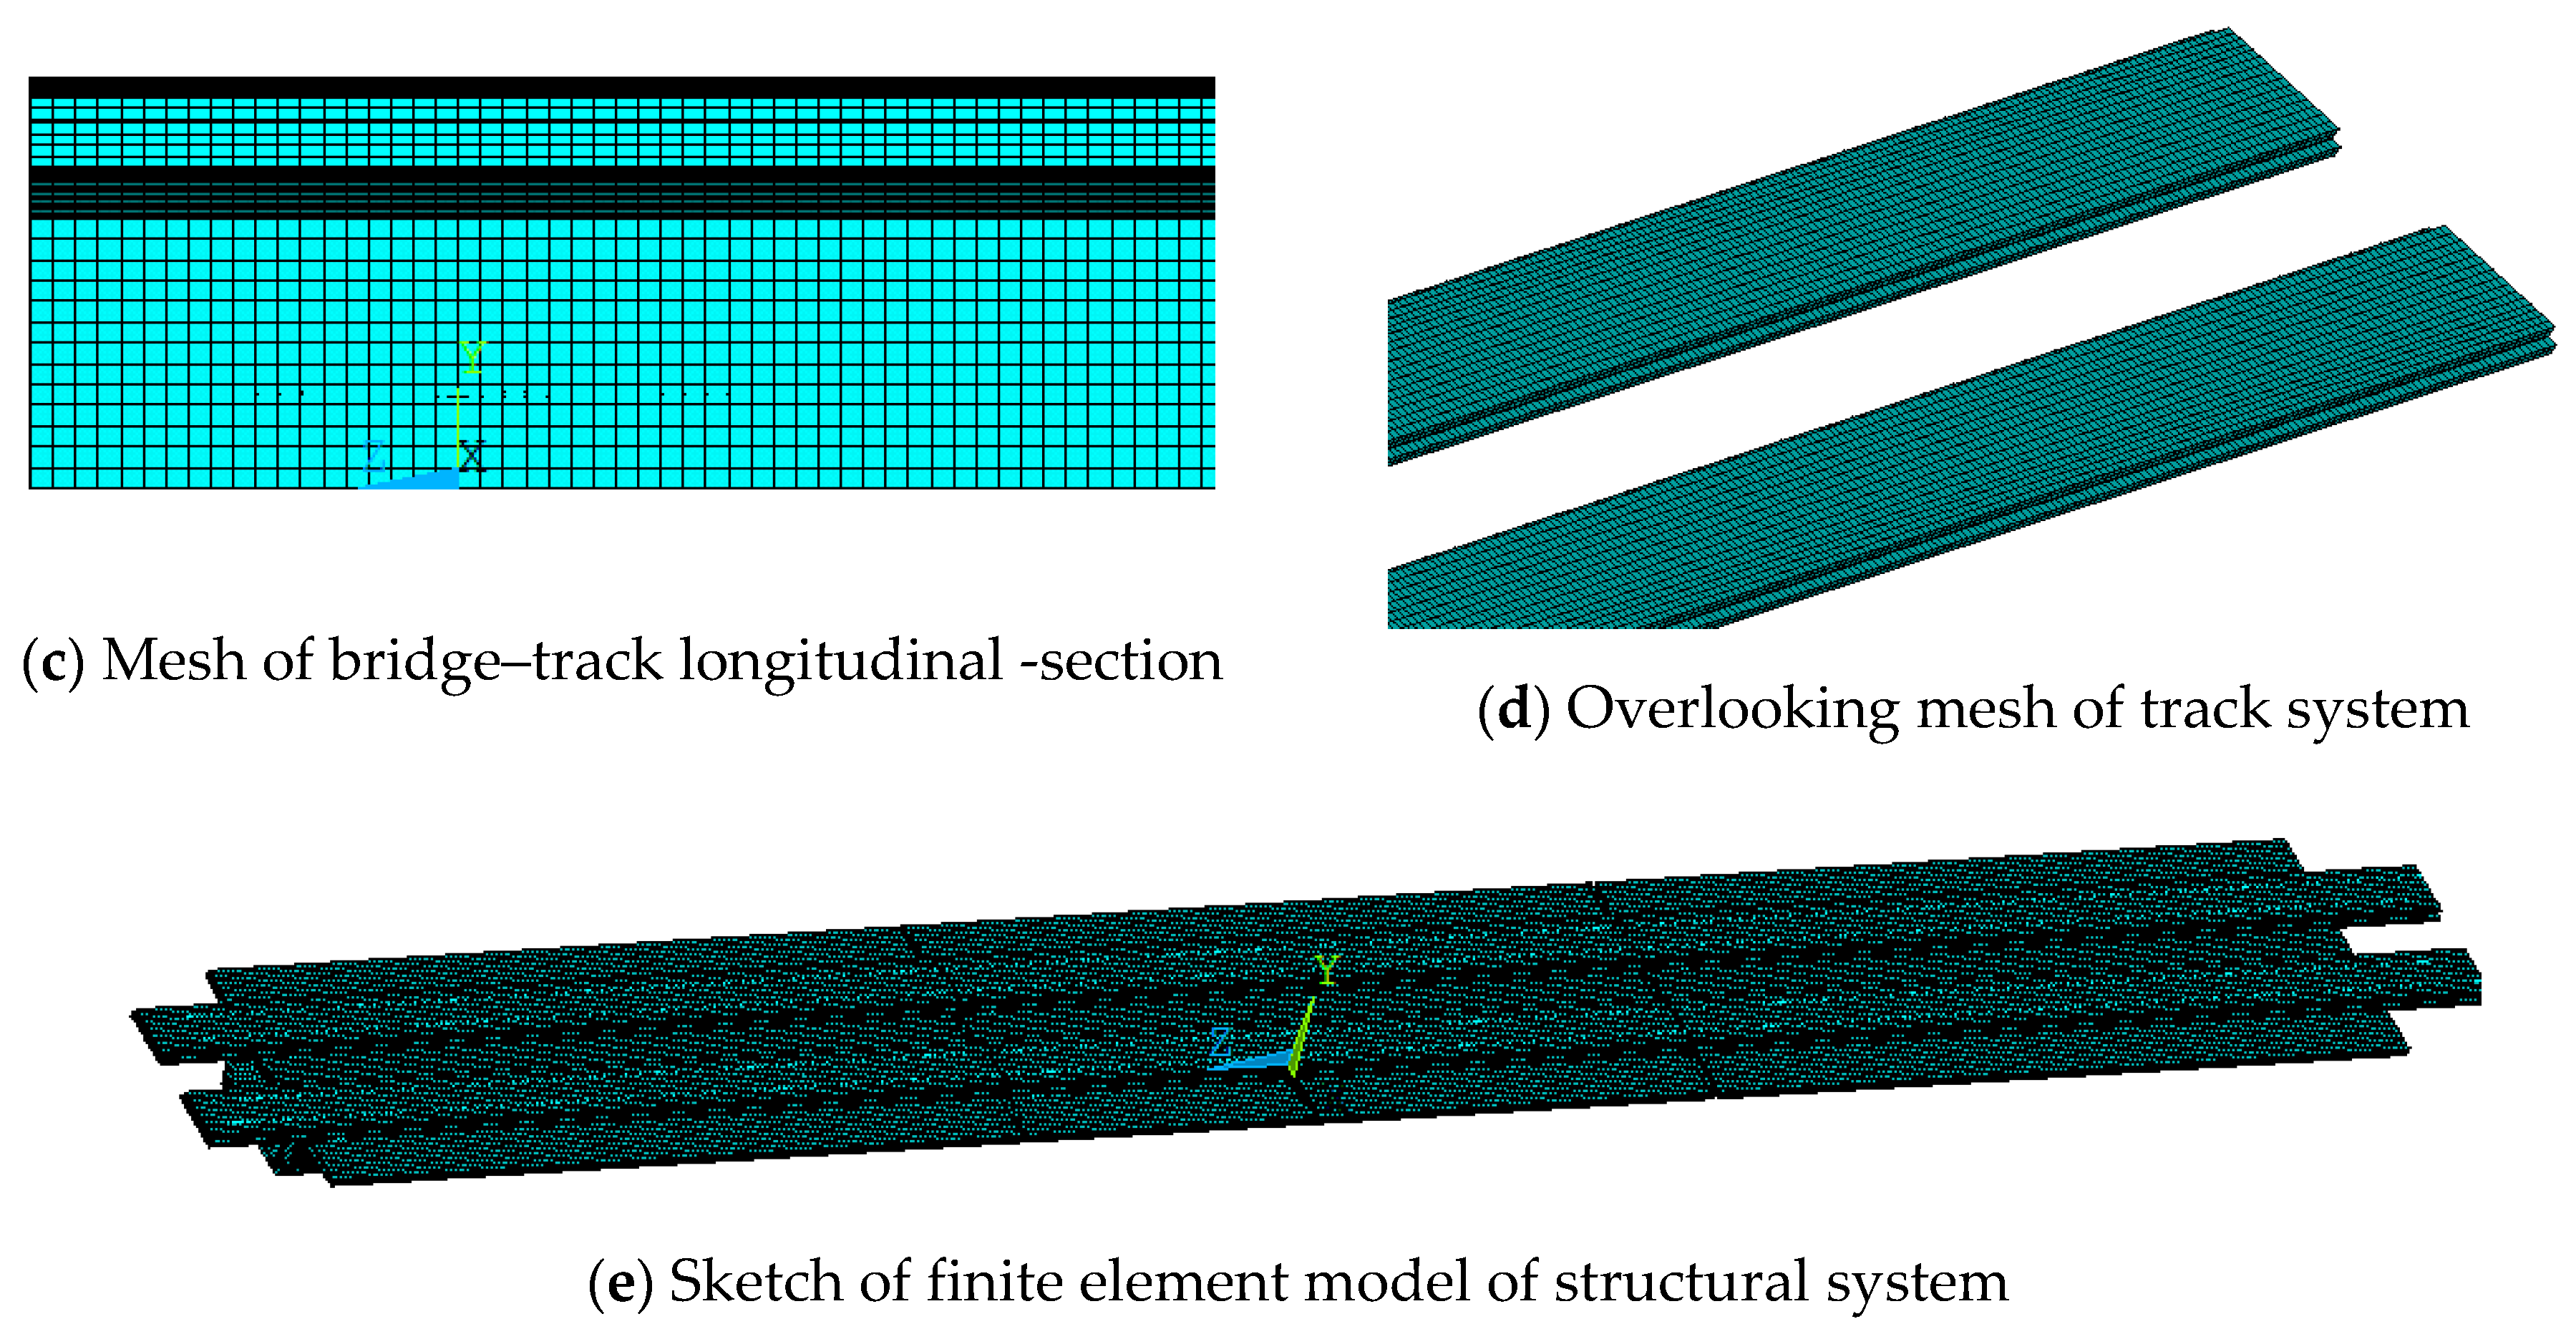
3. Finite Element Model of Ballastless Track–Bridge Structural System
3.1. Parameter Selection
3.2. Simplified Calculation Method
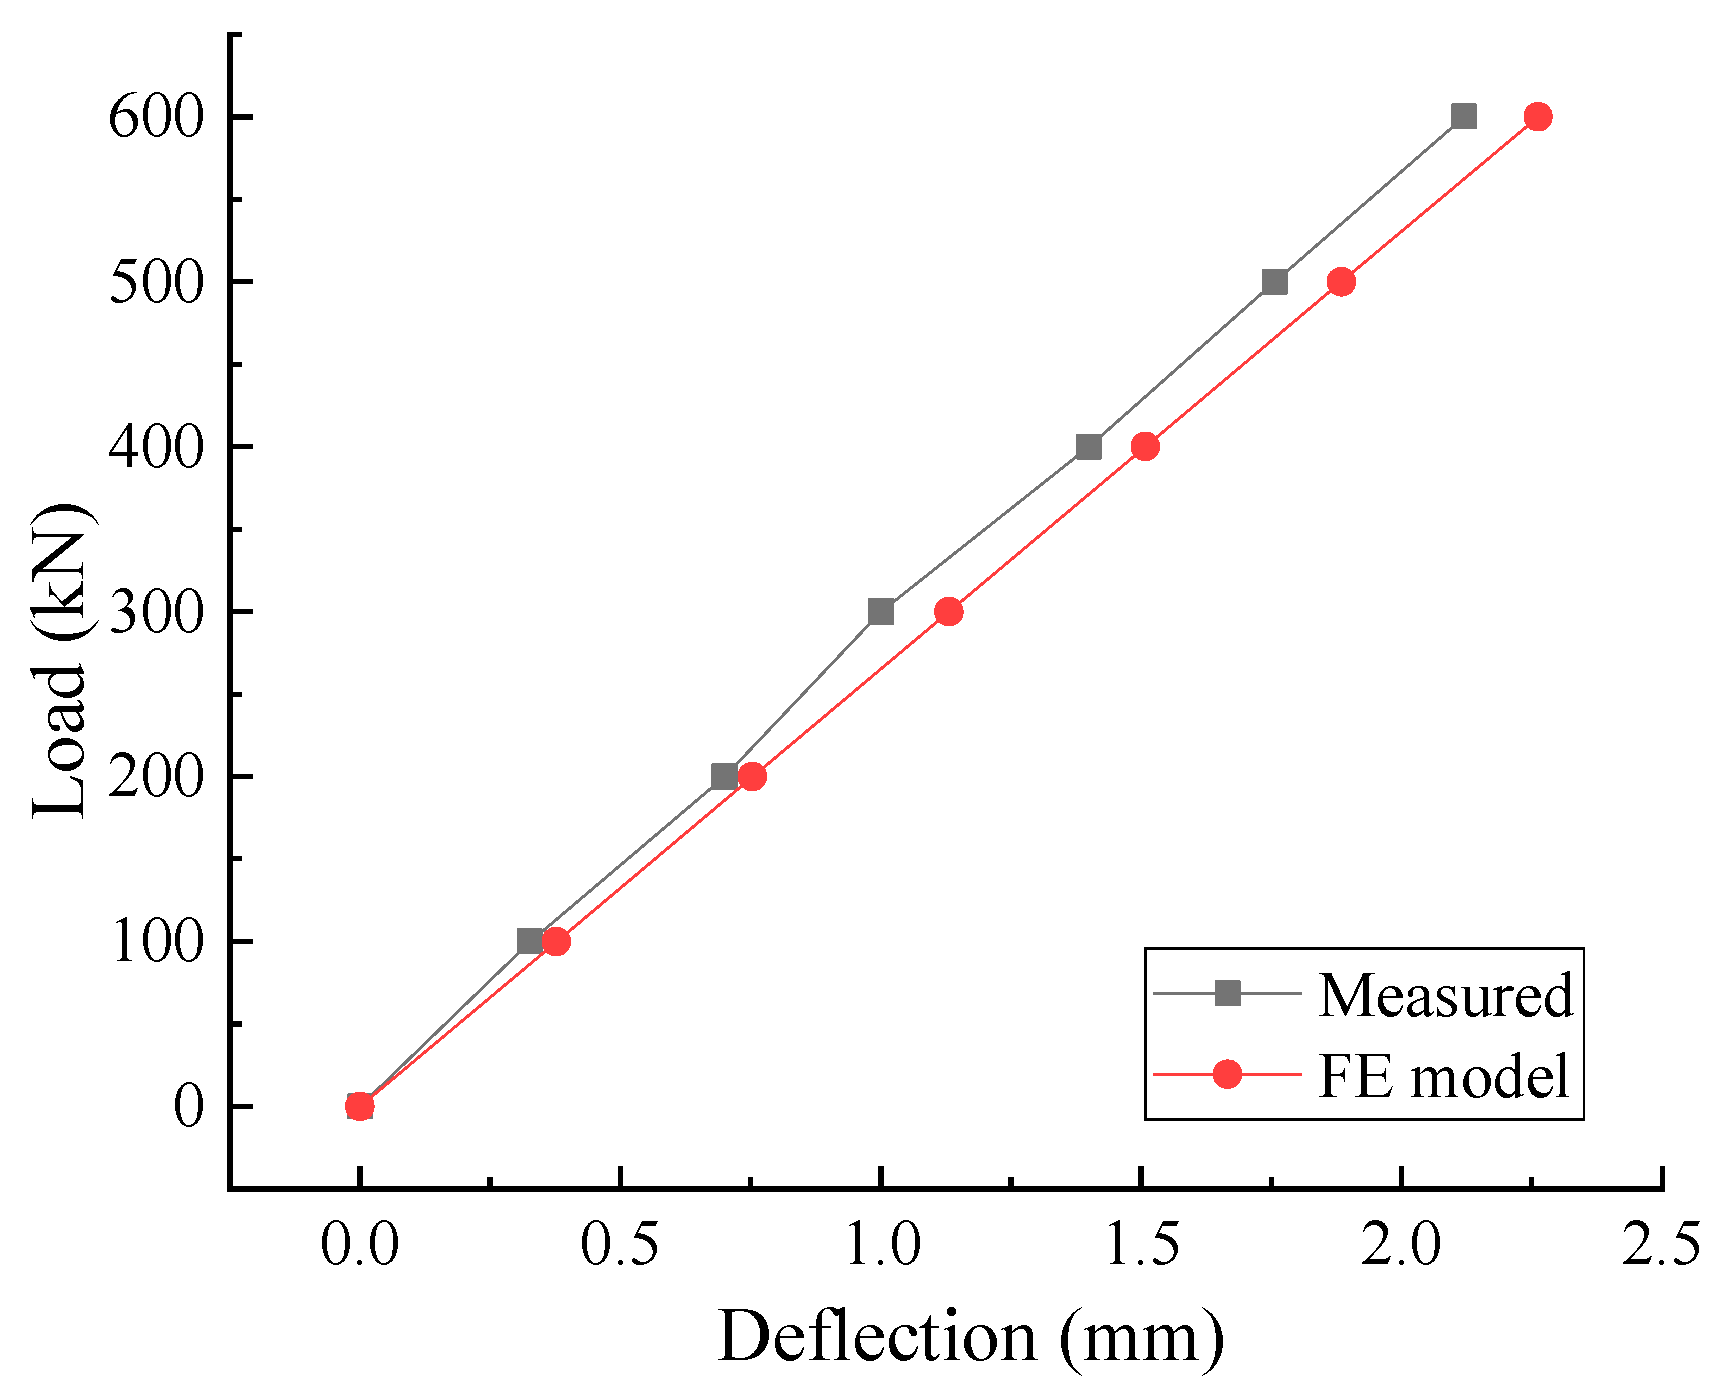
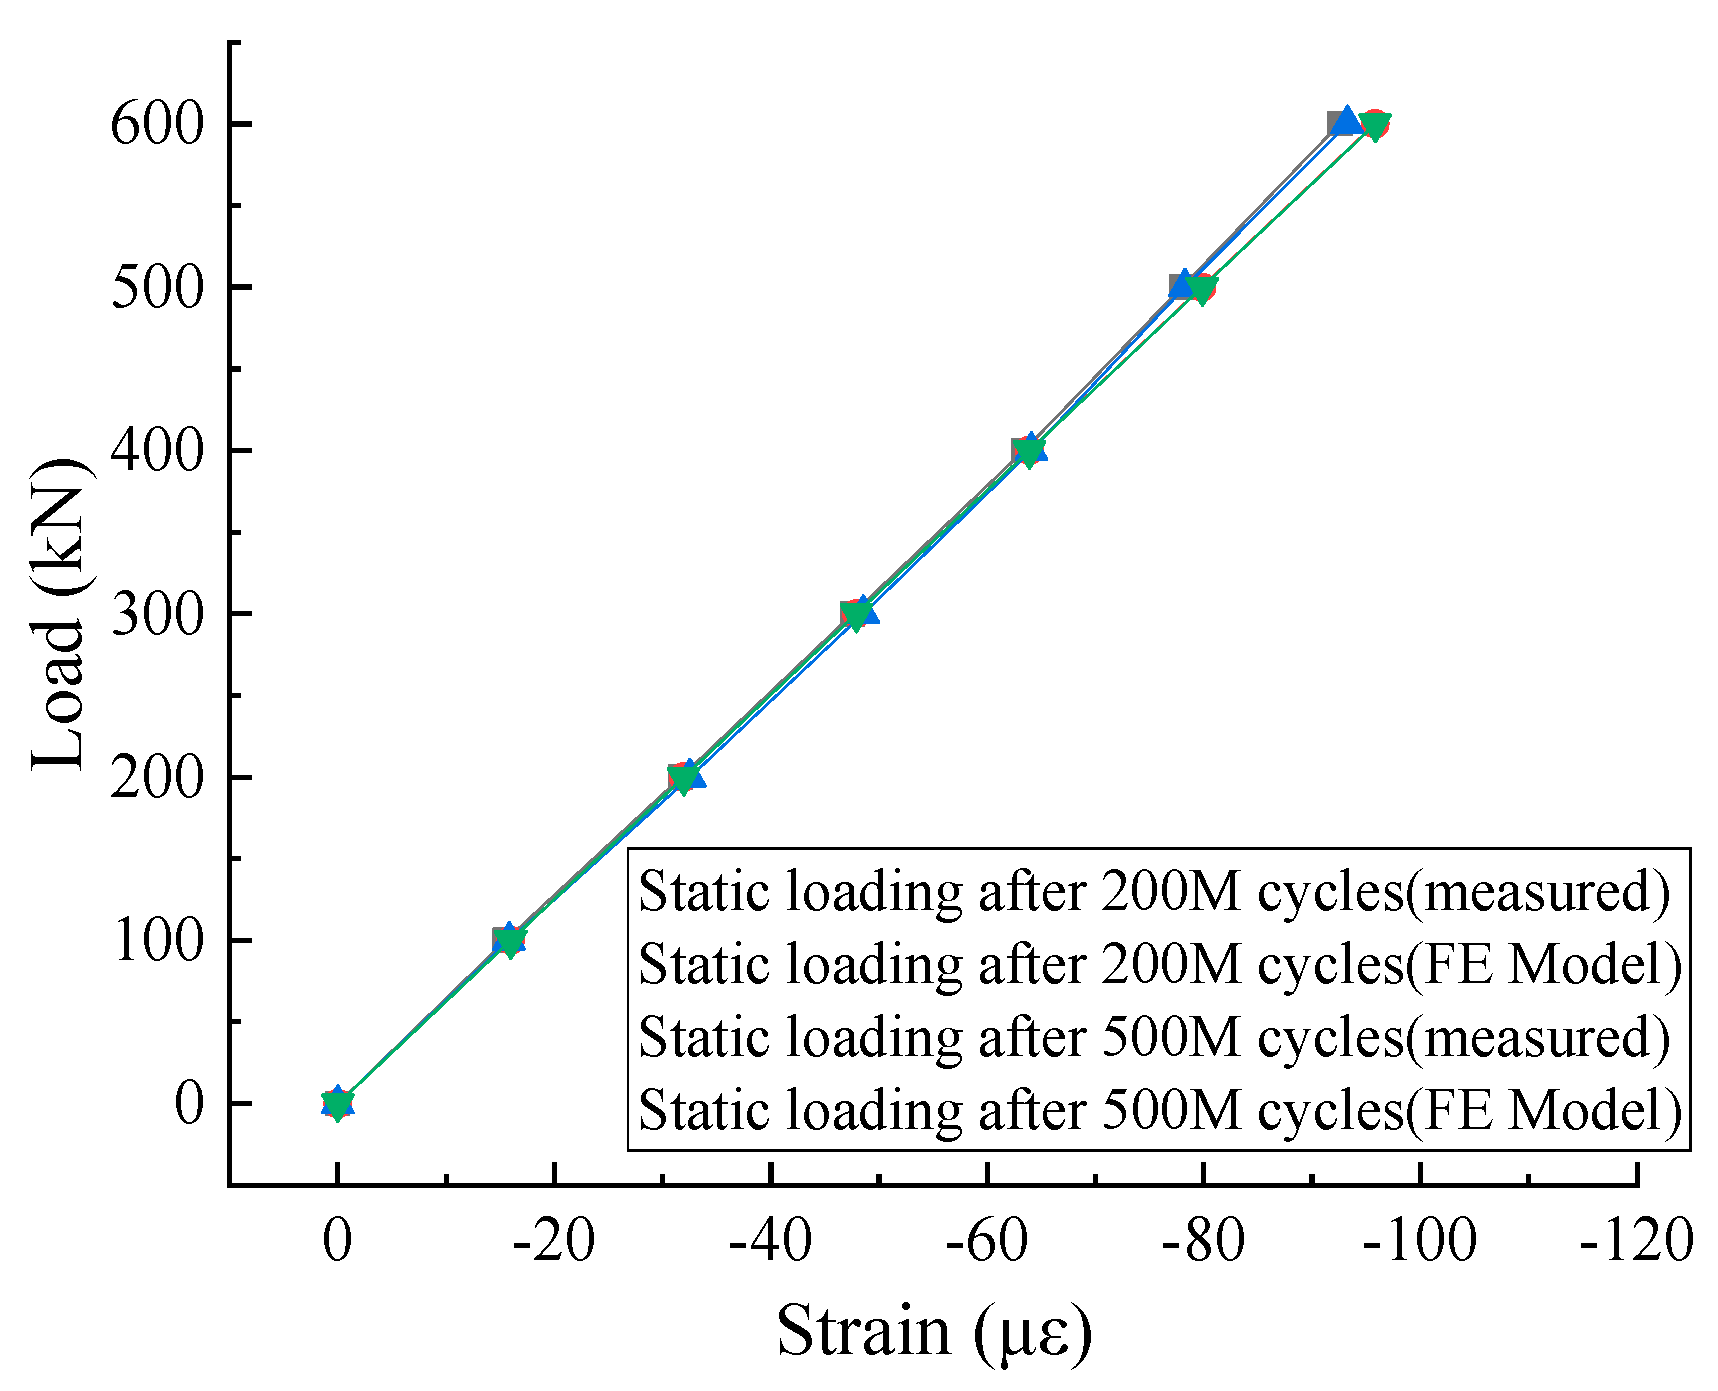
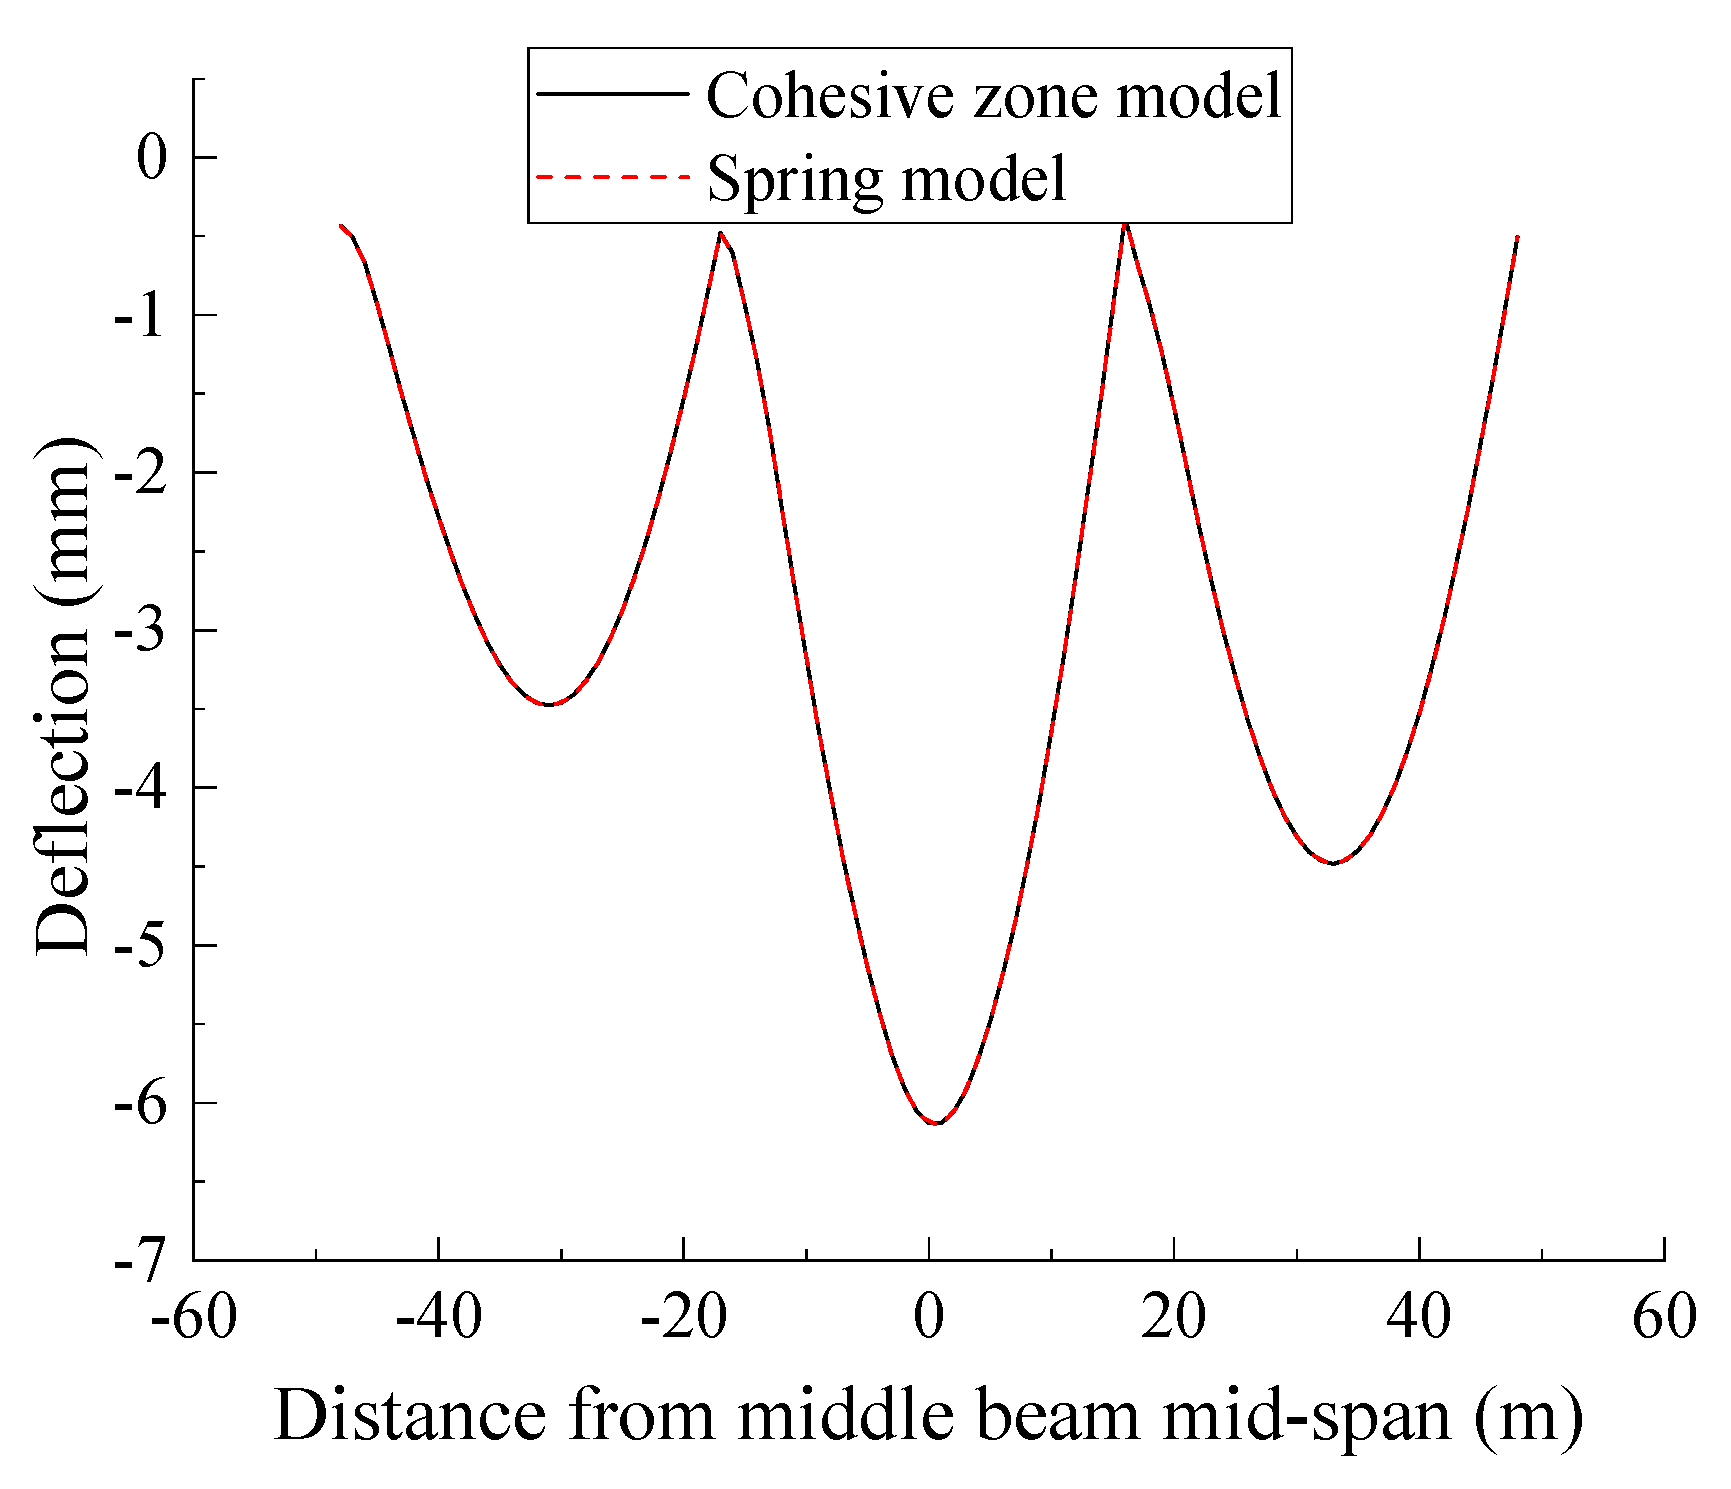
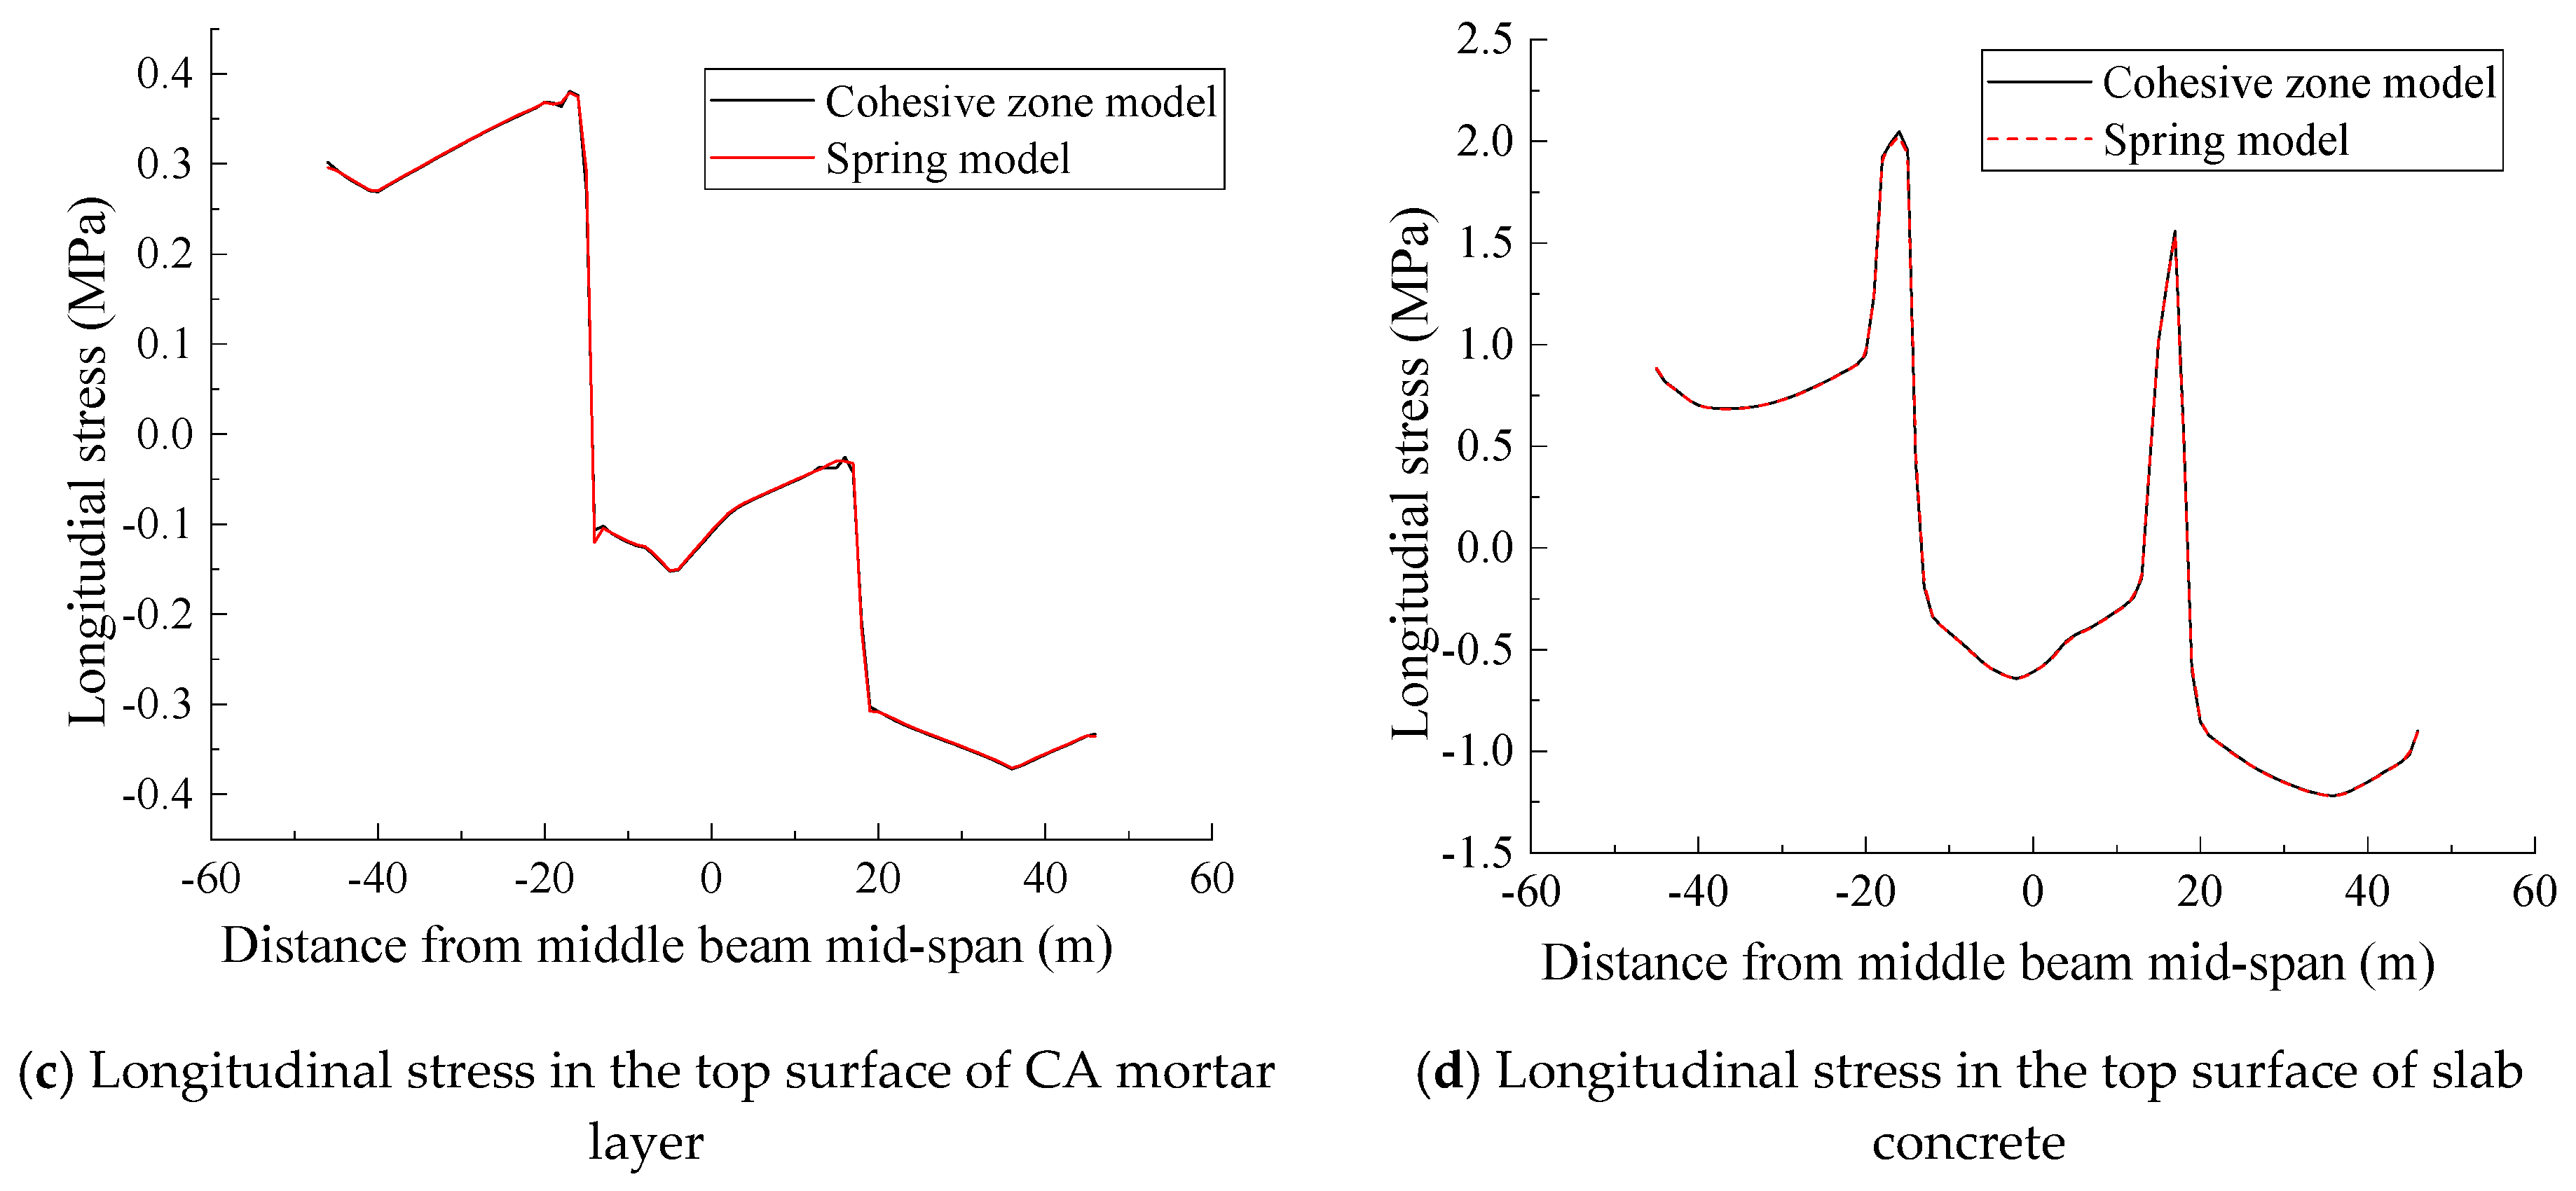
3.3. Verification of Calculation Method
4. Numerical Analysis of Mechanical Properties
4.1. Calculation Results Static Mechanical Performance
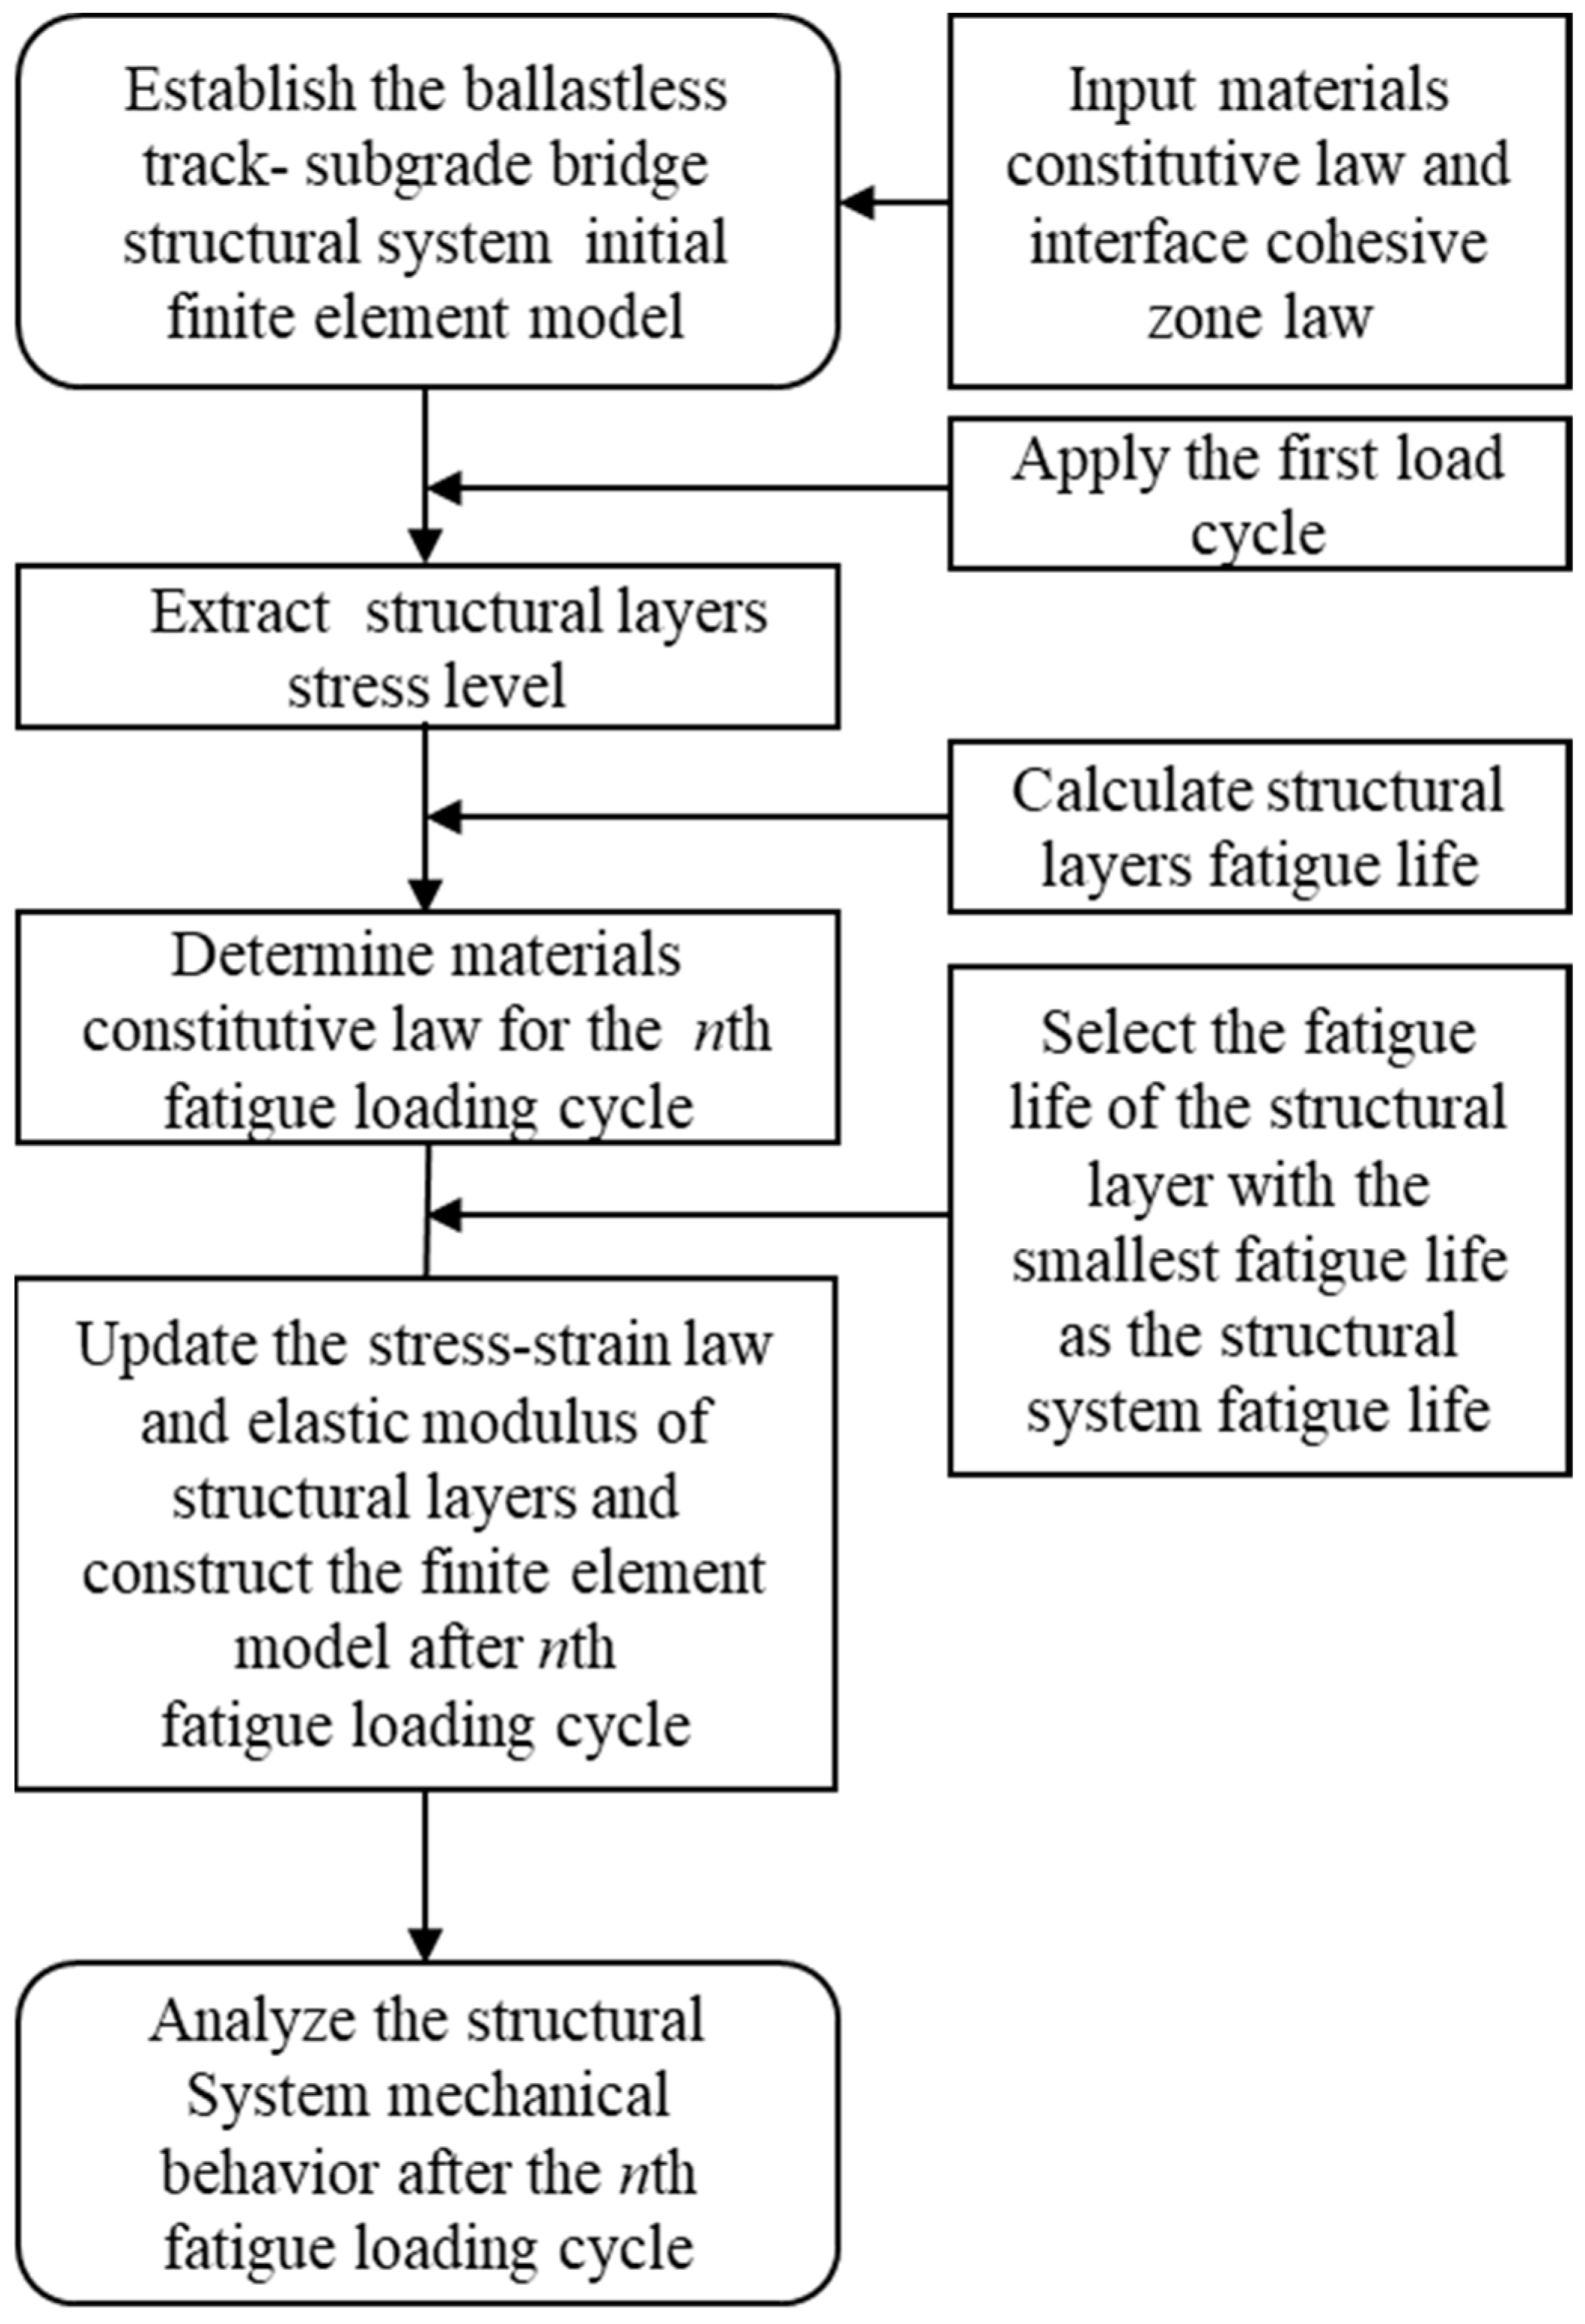
4.2. Fatigue Life Prediction
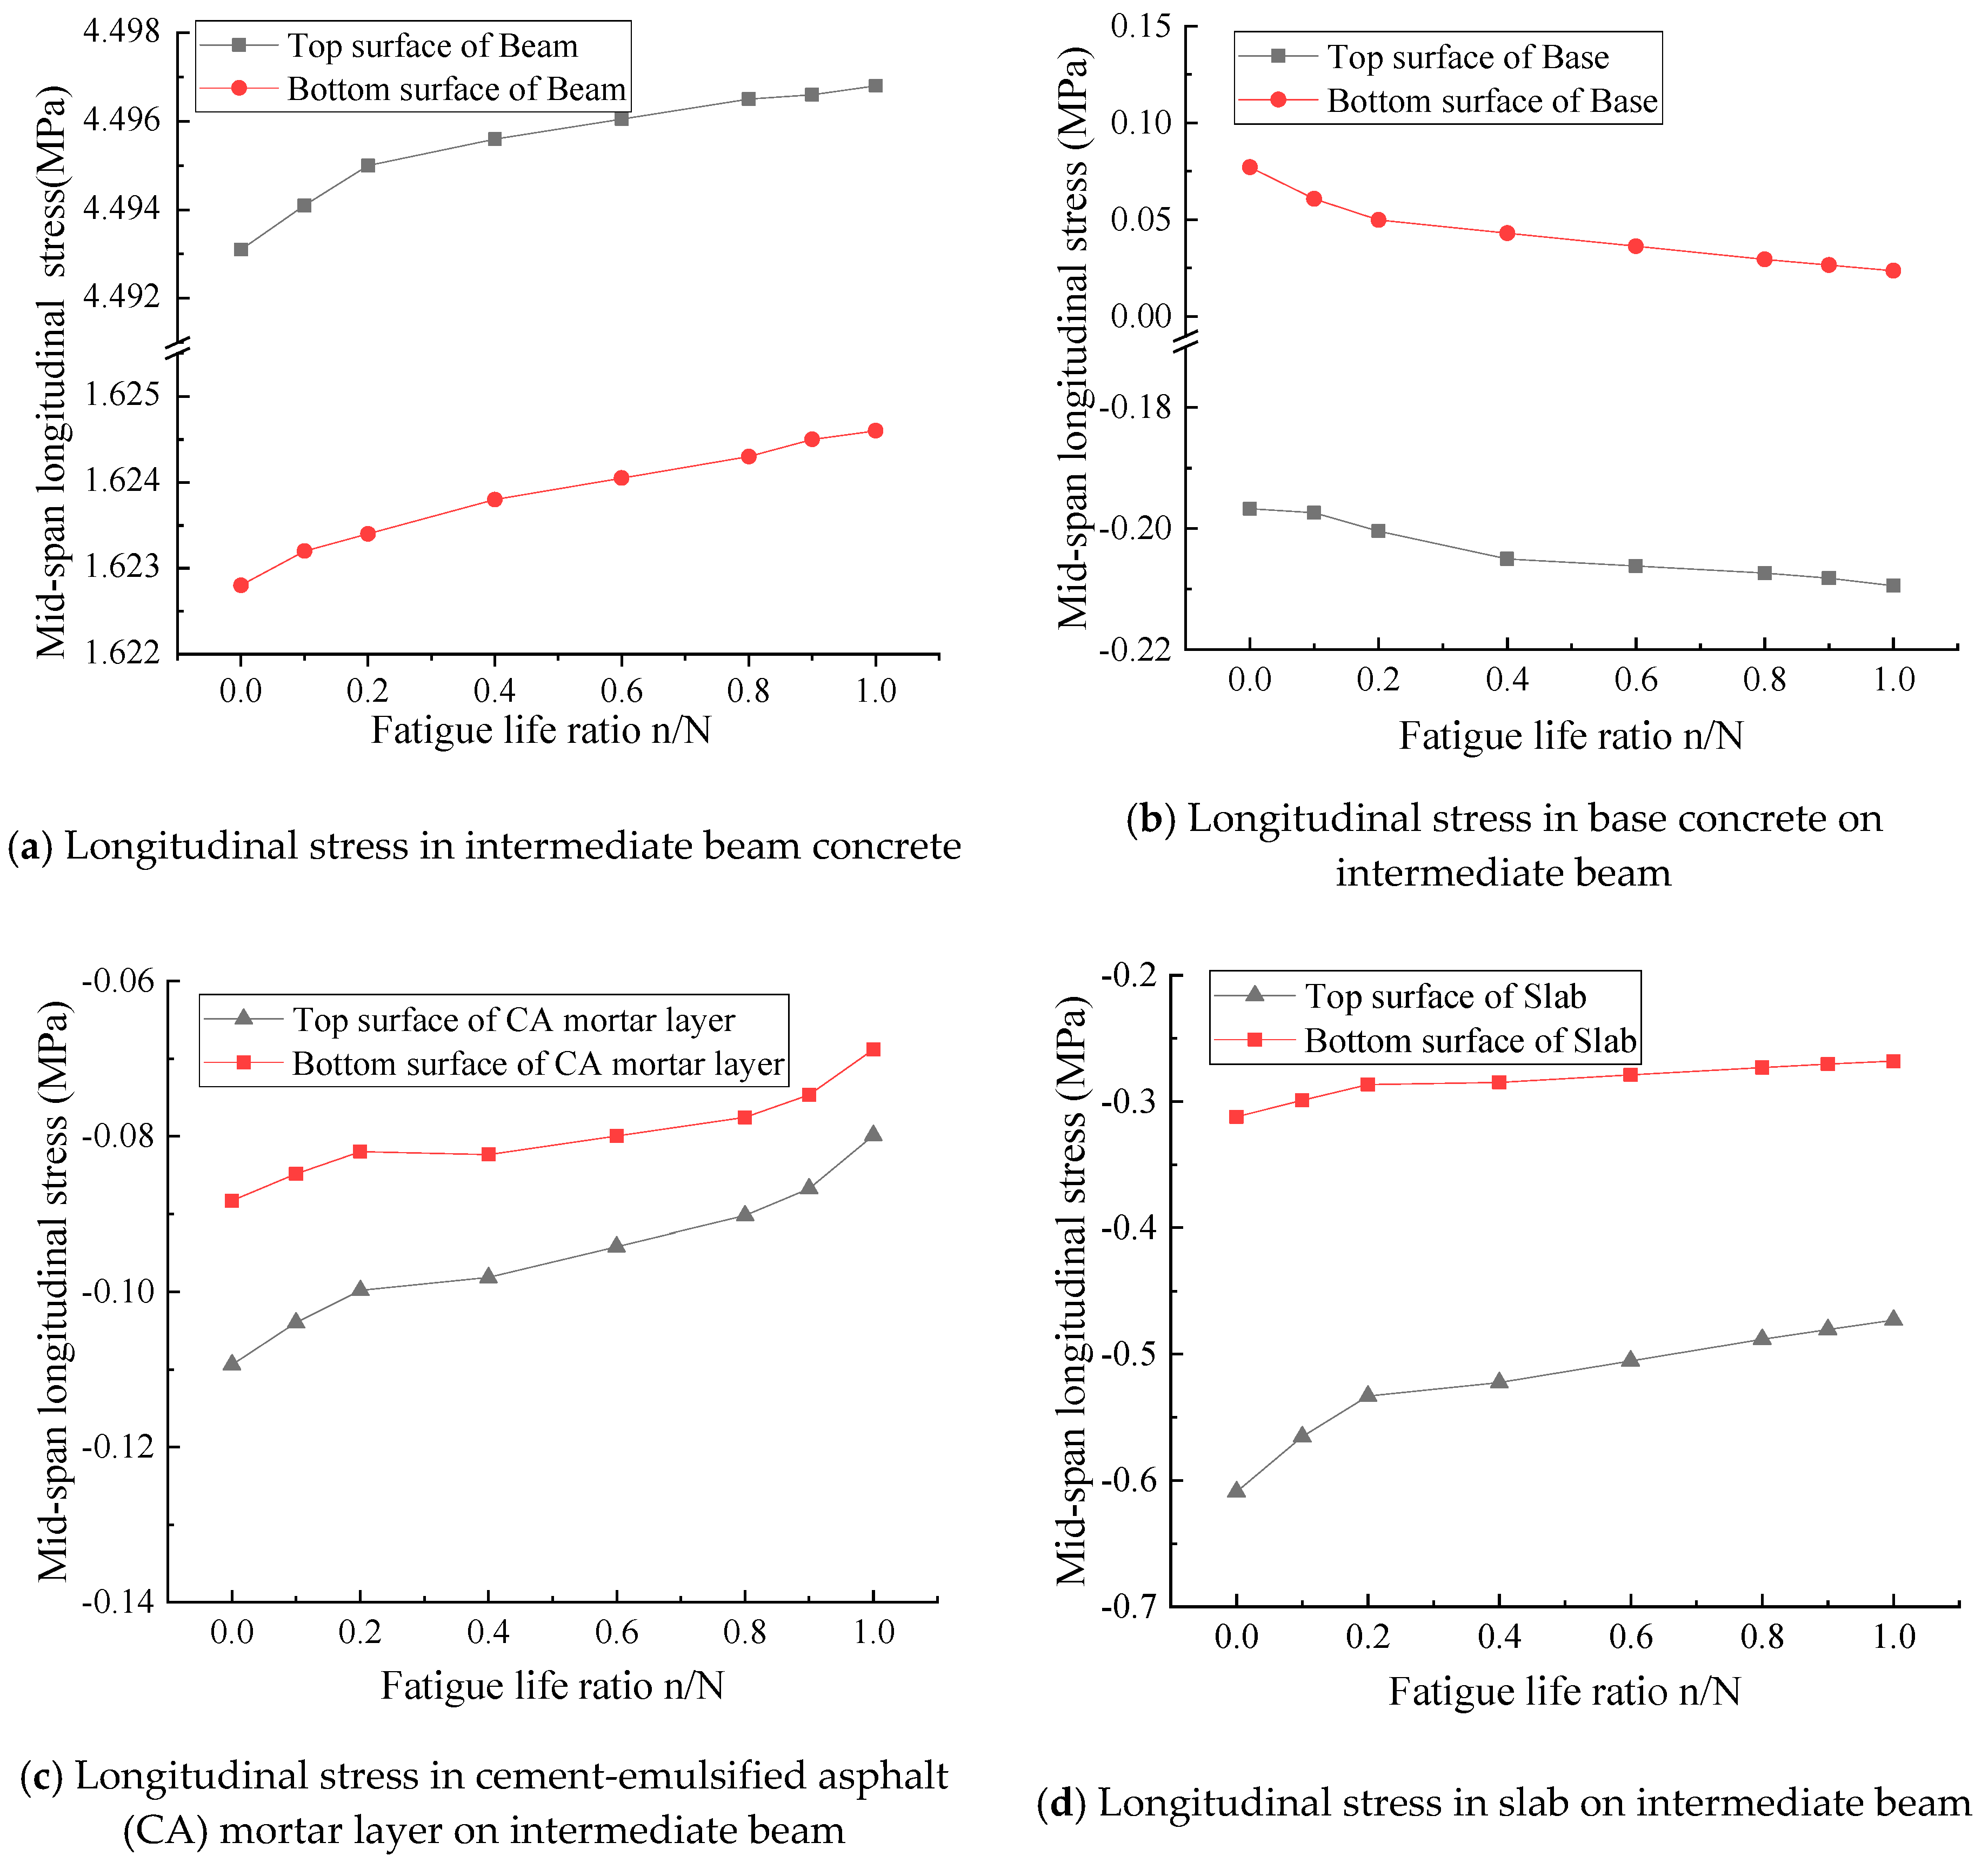
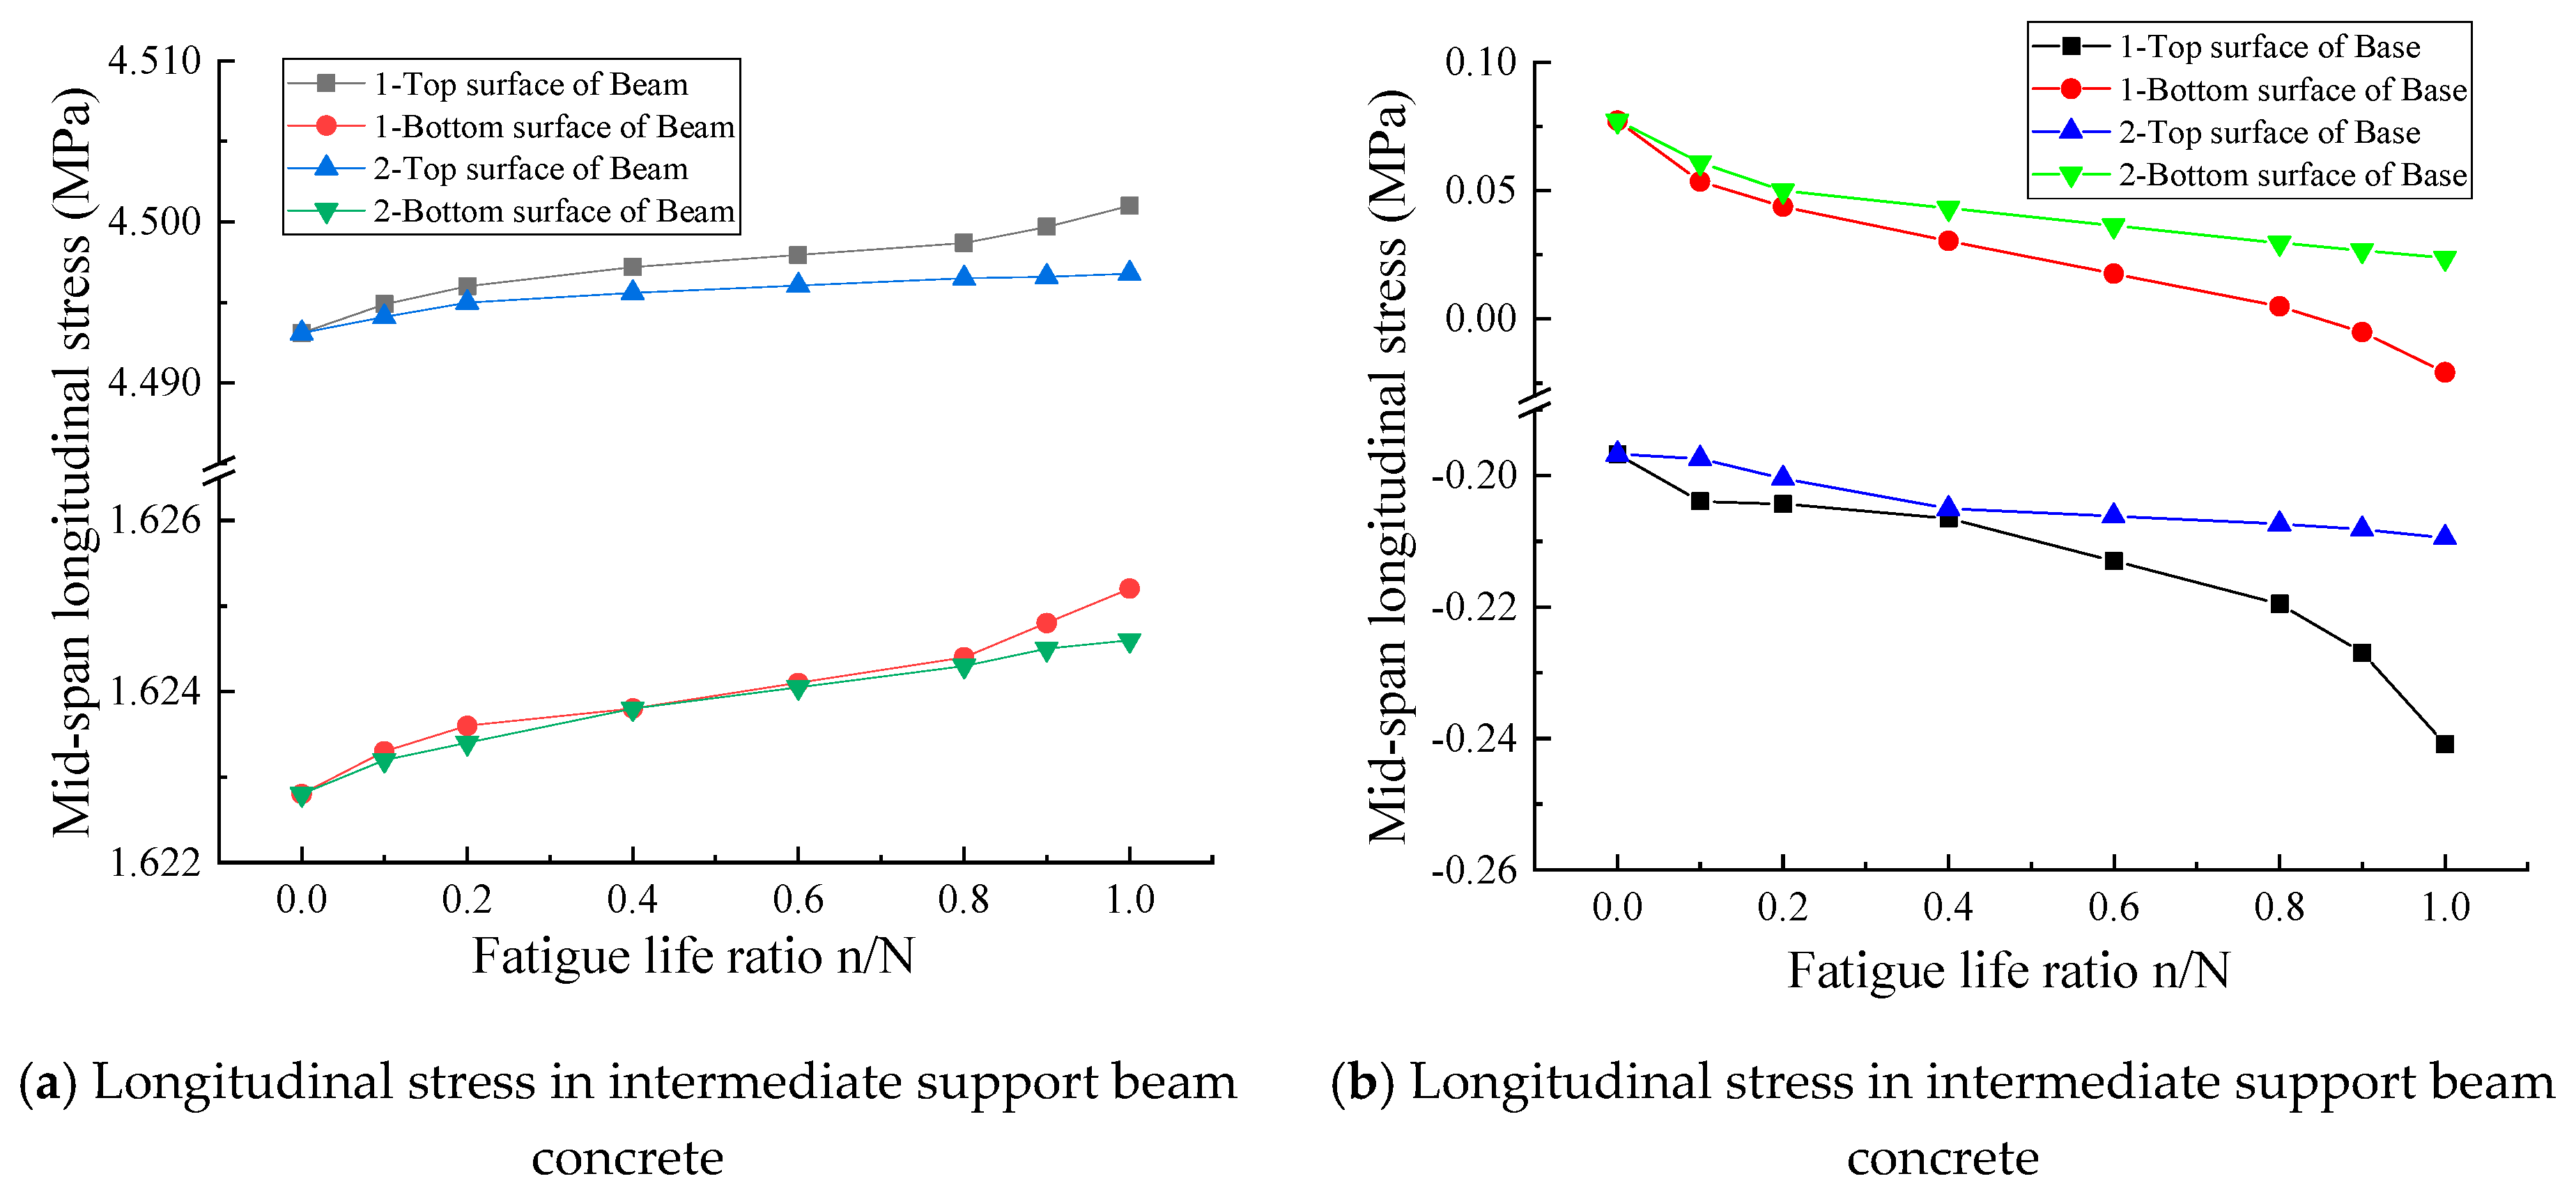
4.3. Analysed Results of Fatigue Performance
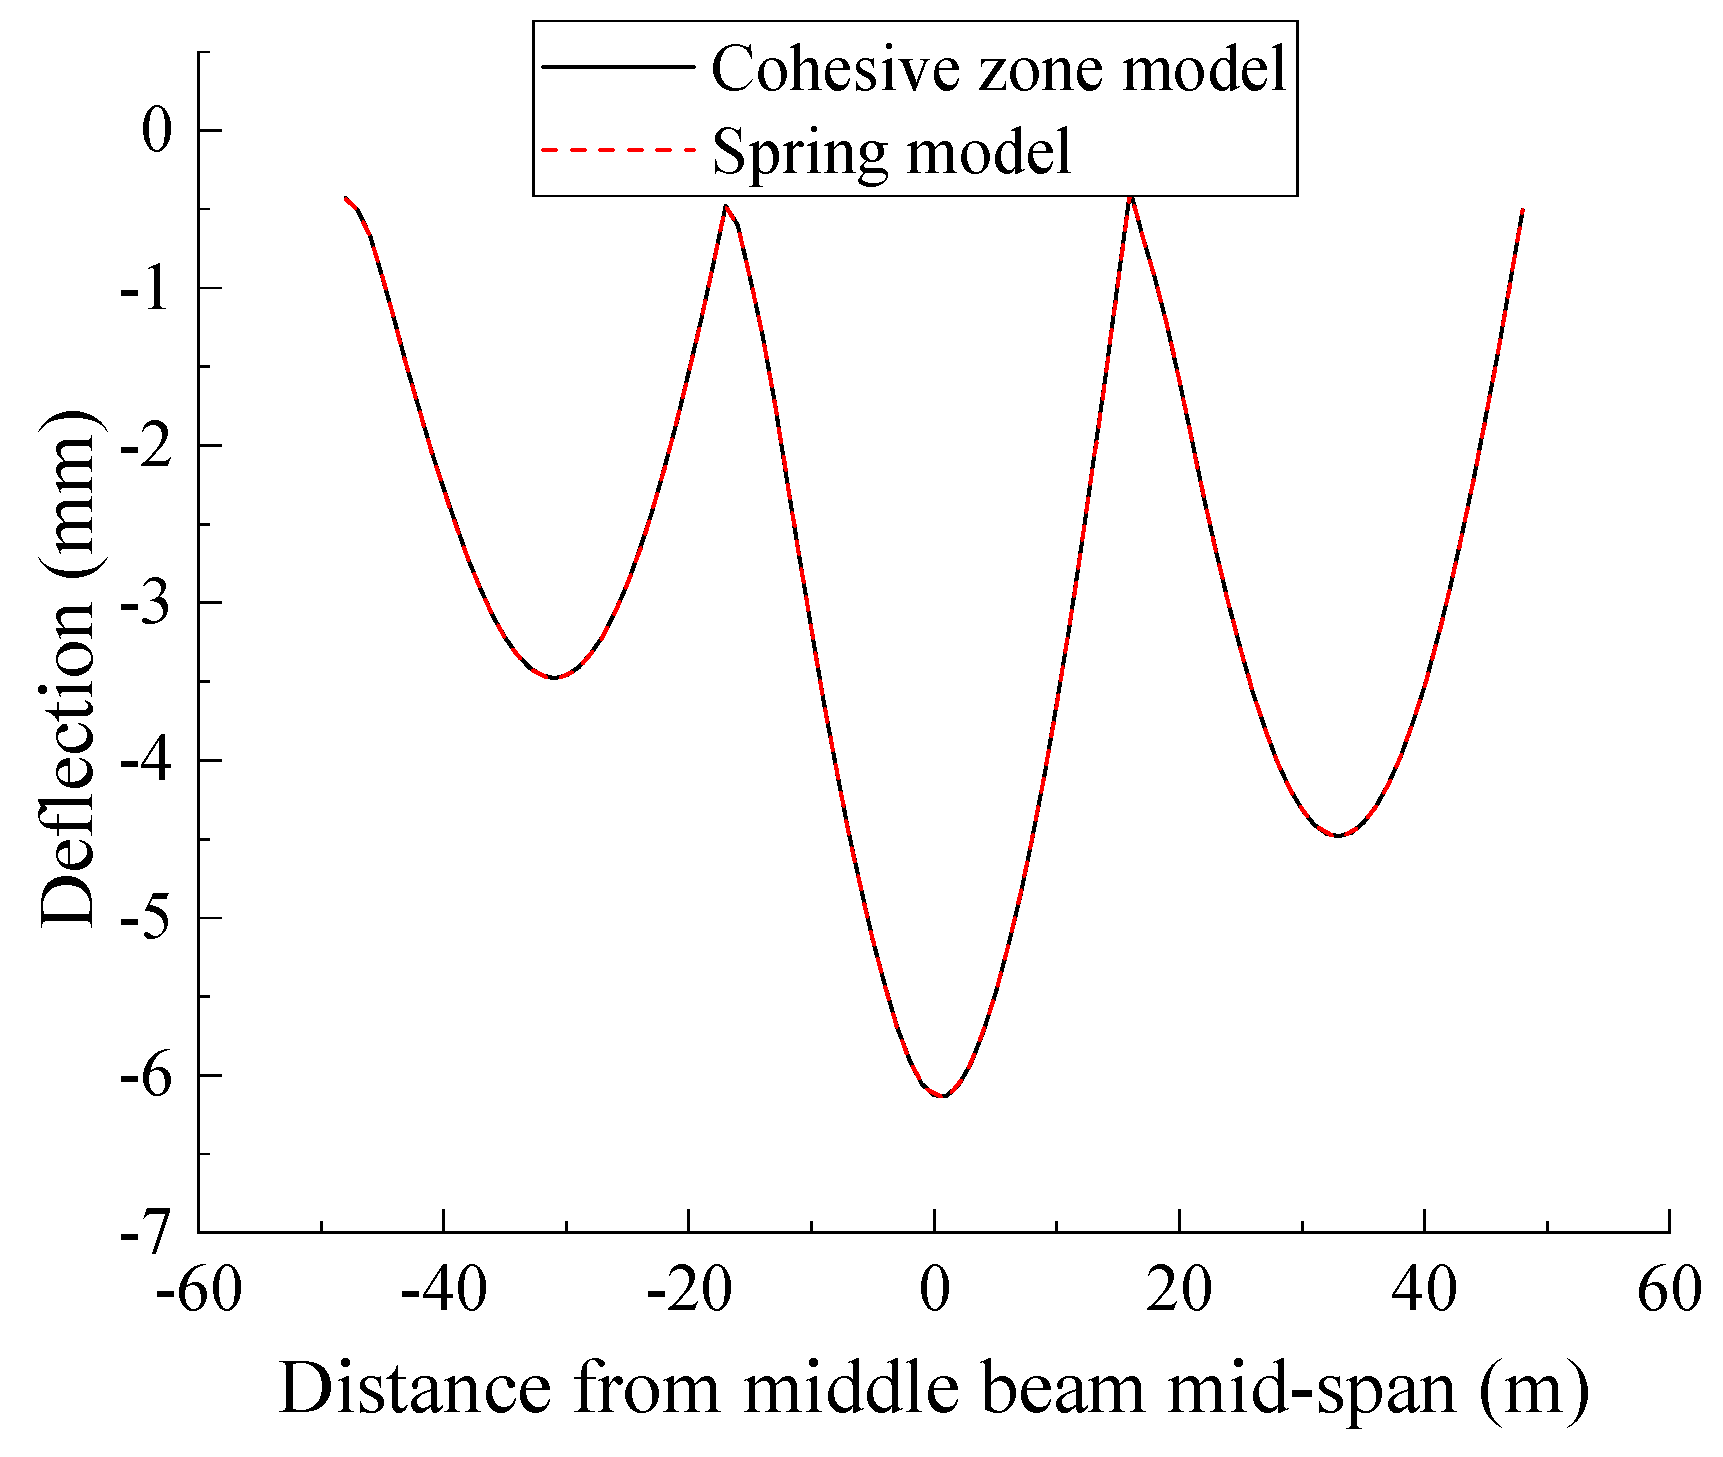
4.4. Effect of Different Interface Bond Simulation Methods on Structural Systems Mechanical Performance
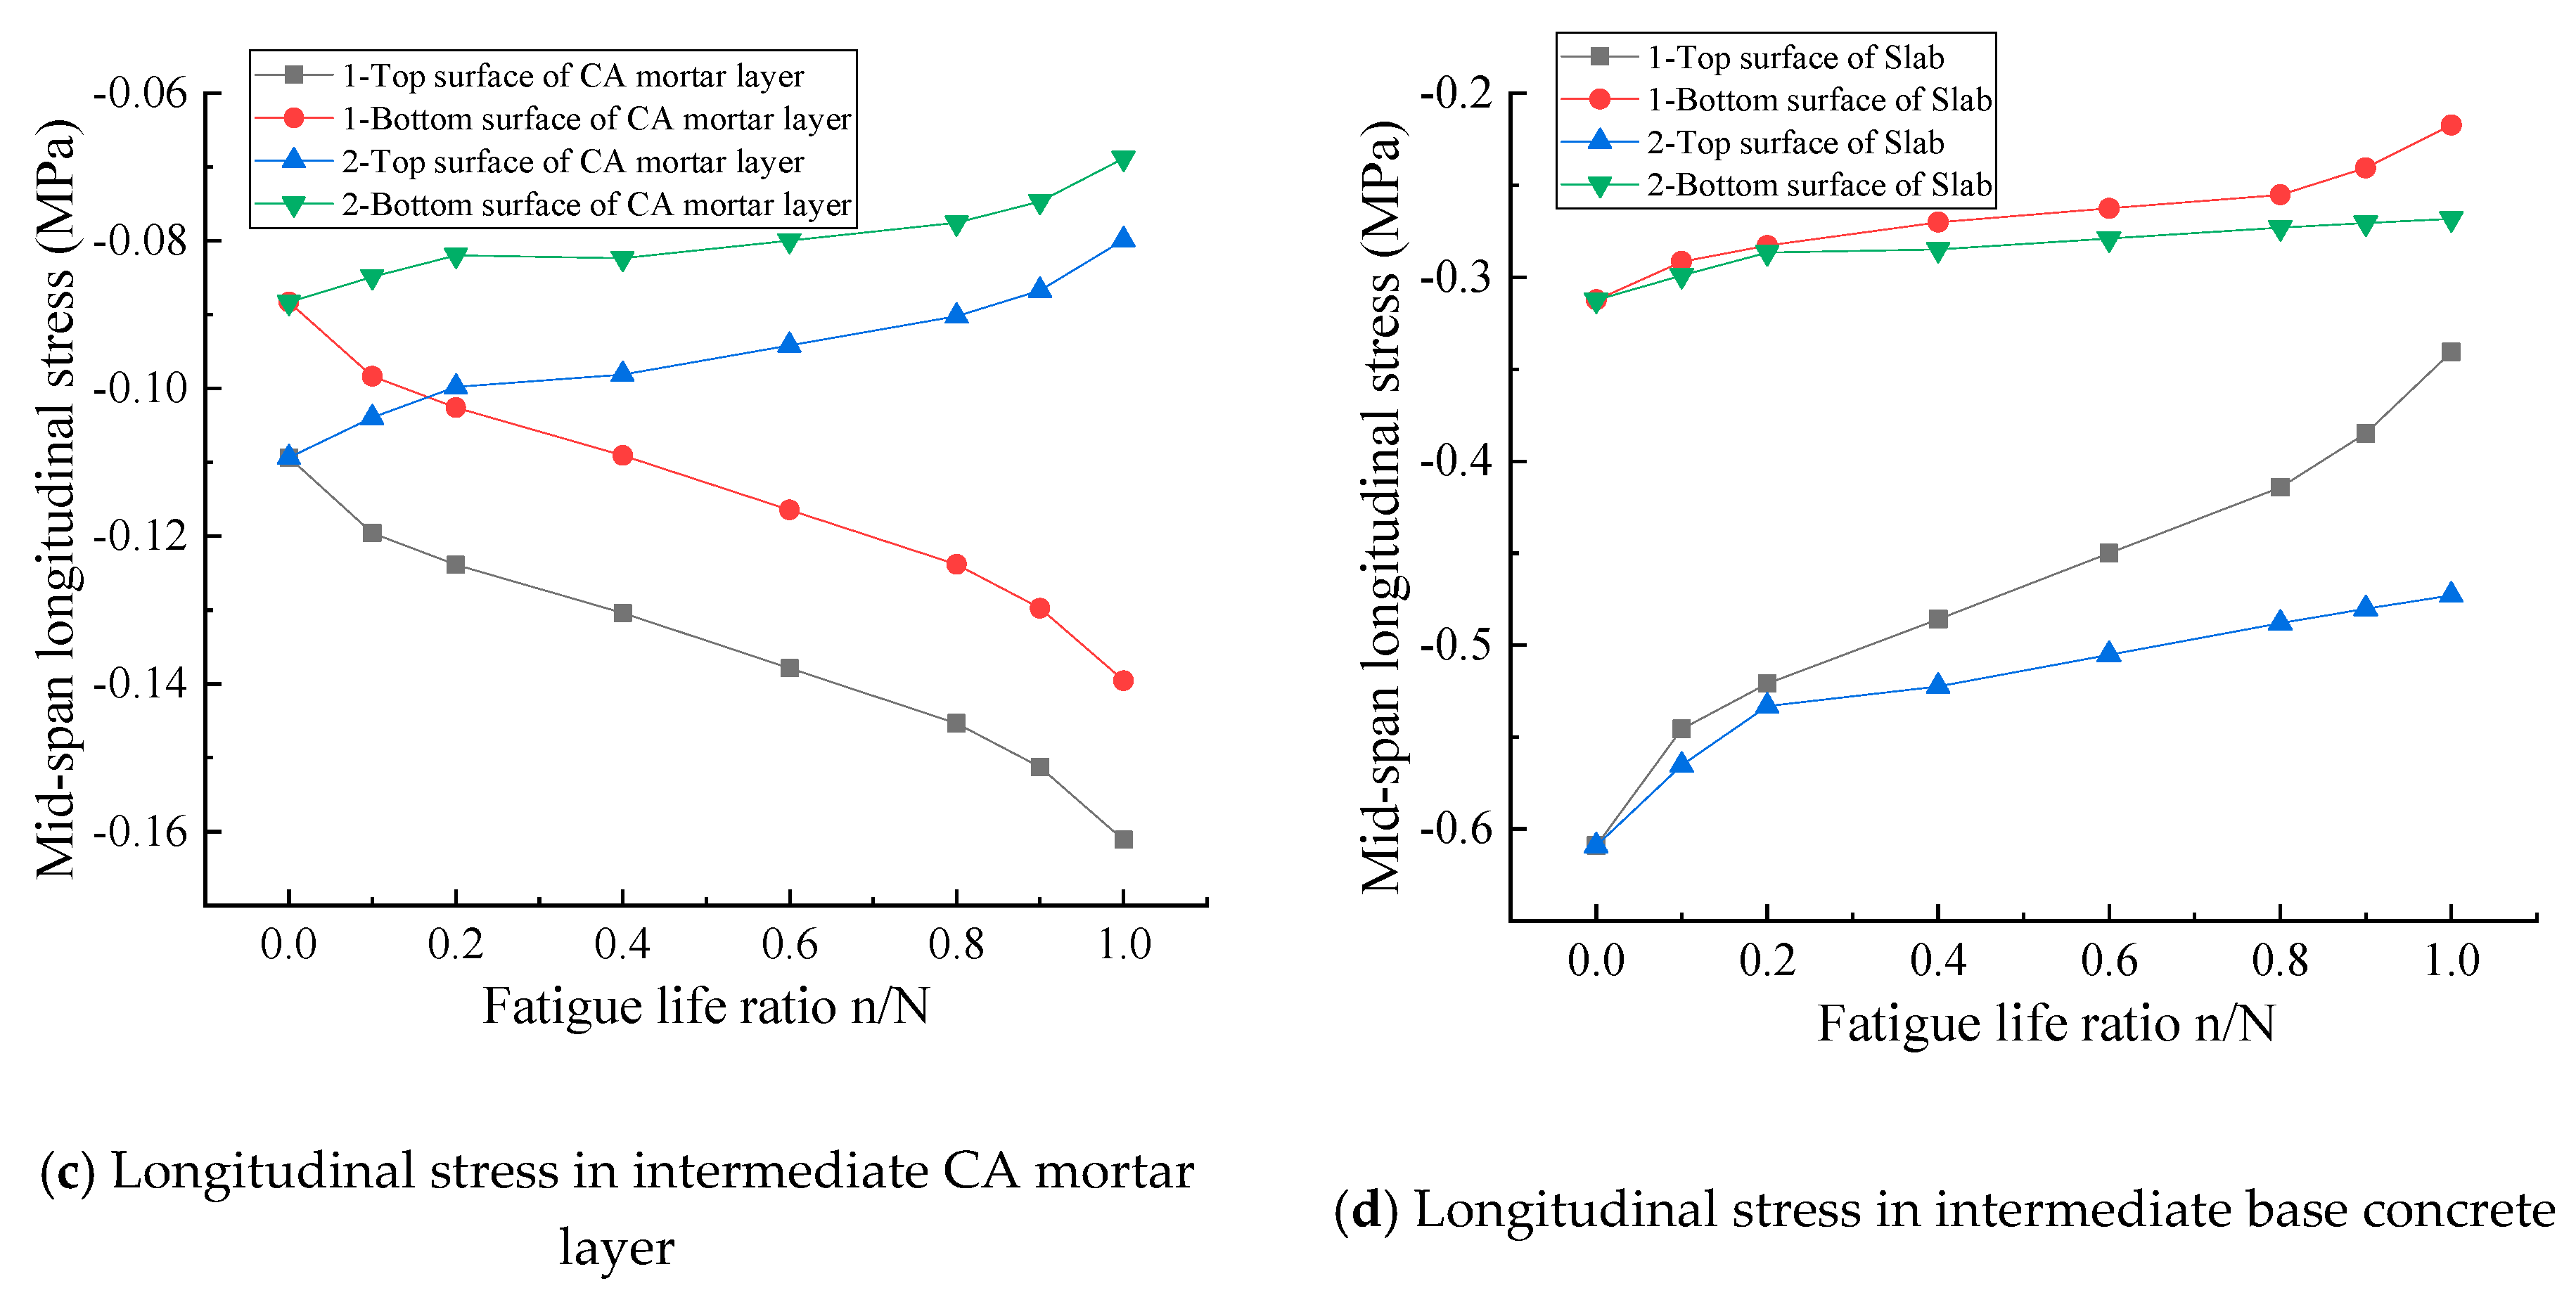
4.5. Effect of CA Mortar Layer Fatigue Degradation on Structural System Mechanical Performance
5. Conclusions
- (1)
- The static, fatigue damage models and the interface cohesive zone model of concrete and CA mortar are introduced. The fatigue lifetime of each structural part is calculated, and the fatigue failure order is CA mortar layer, slab, base and beam. The fatigue lifetime of the beam is much longer than the fatigue lifetime of the track structure layers.
- (2)
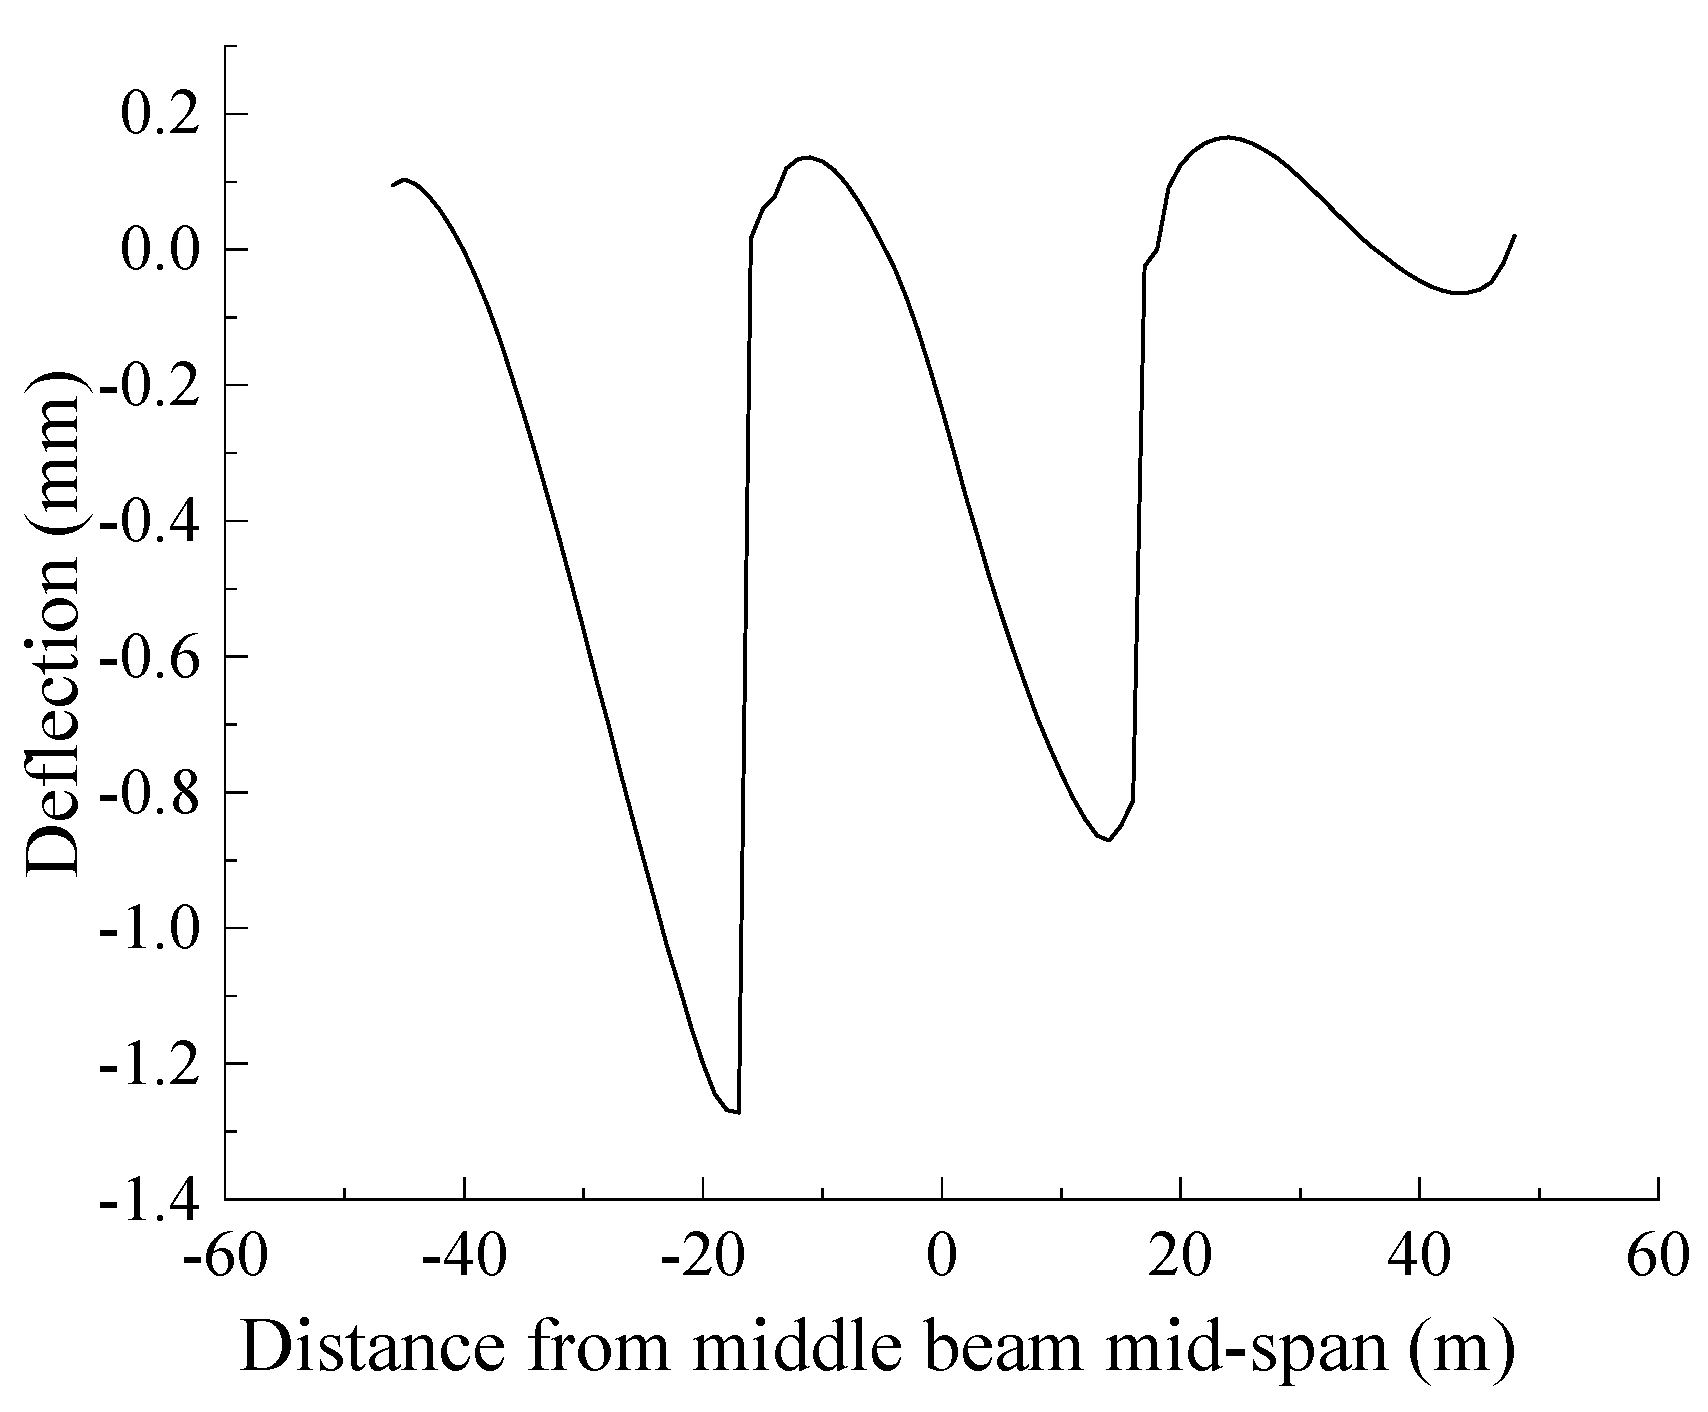
- Under the static train load, as the beam deformation is inconsistent with the deformation of the track system, all the track system layers have an abrupt deformation change at both ends, and their most unfavourable position also occurs at the beam end.
- (3)
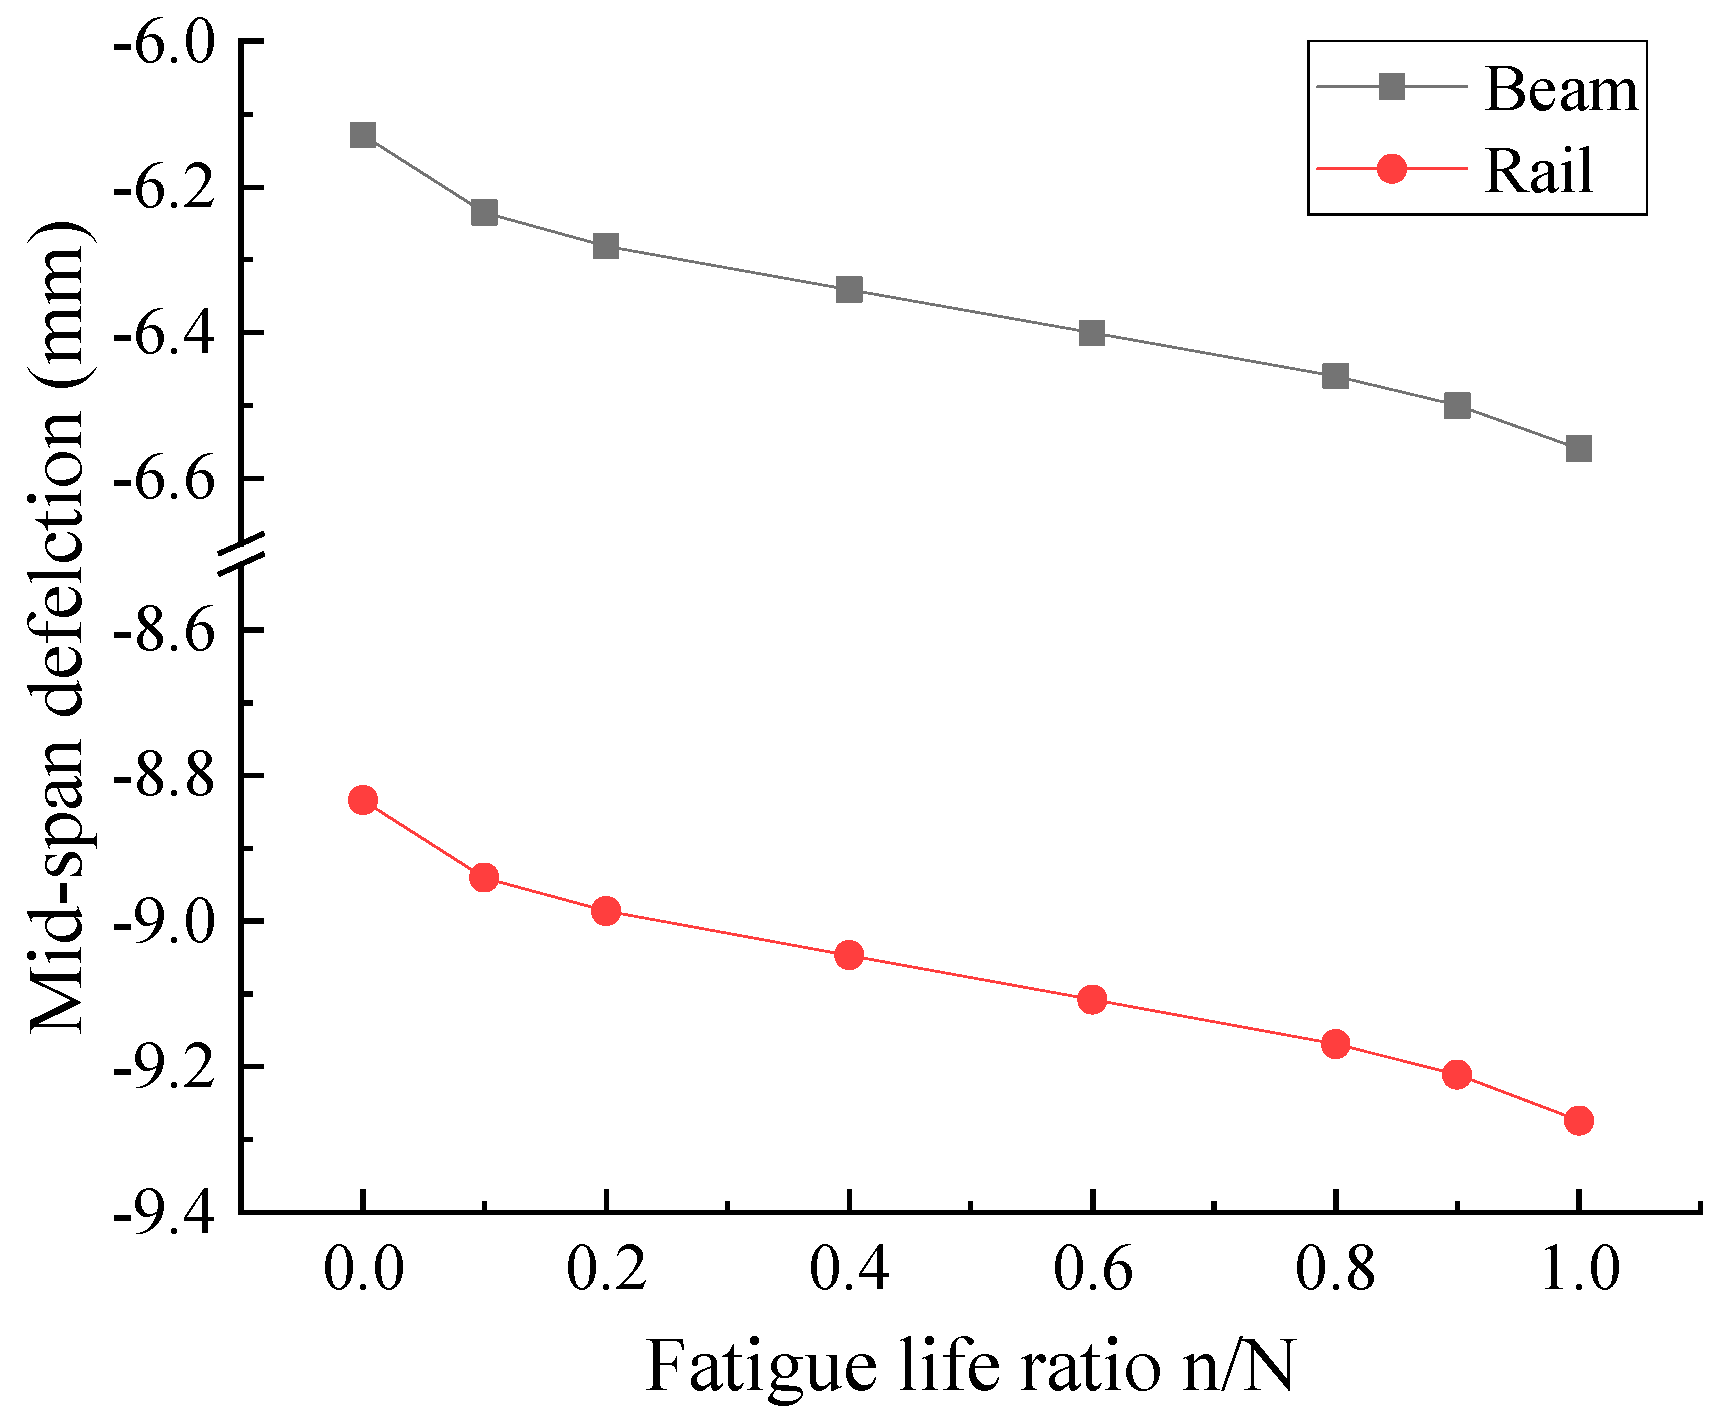
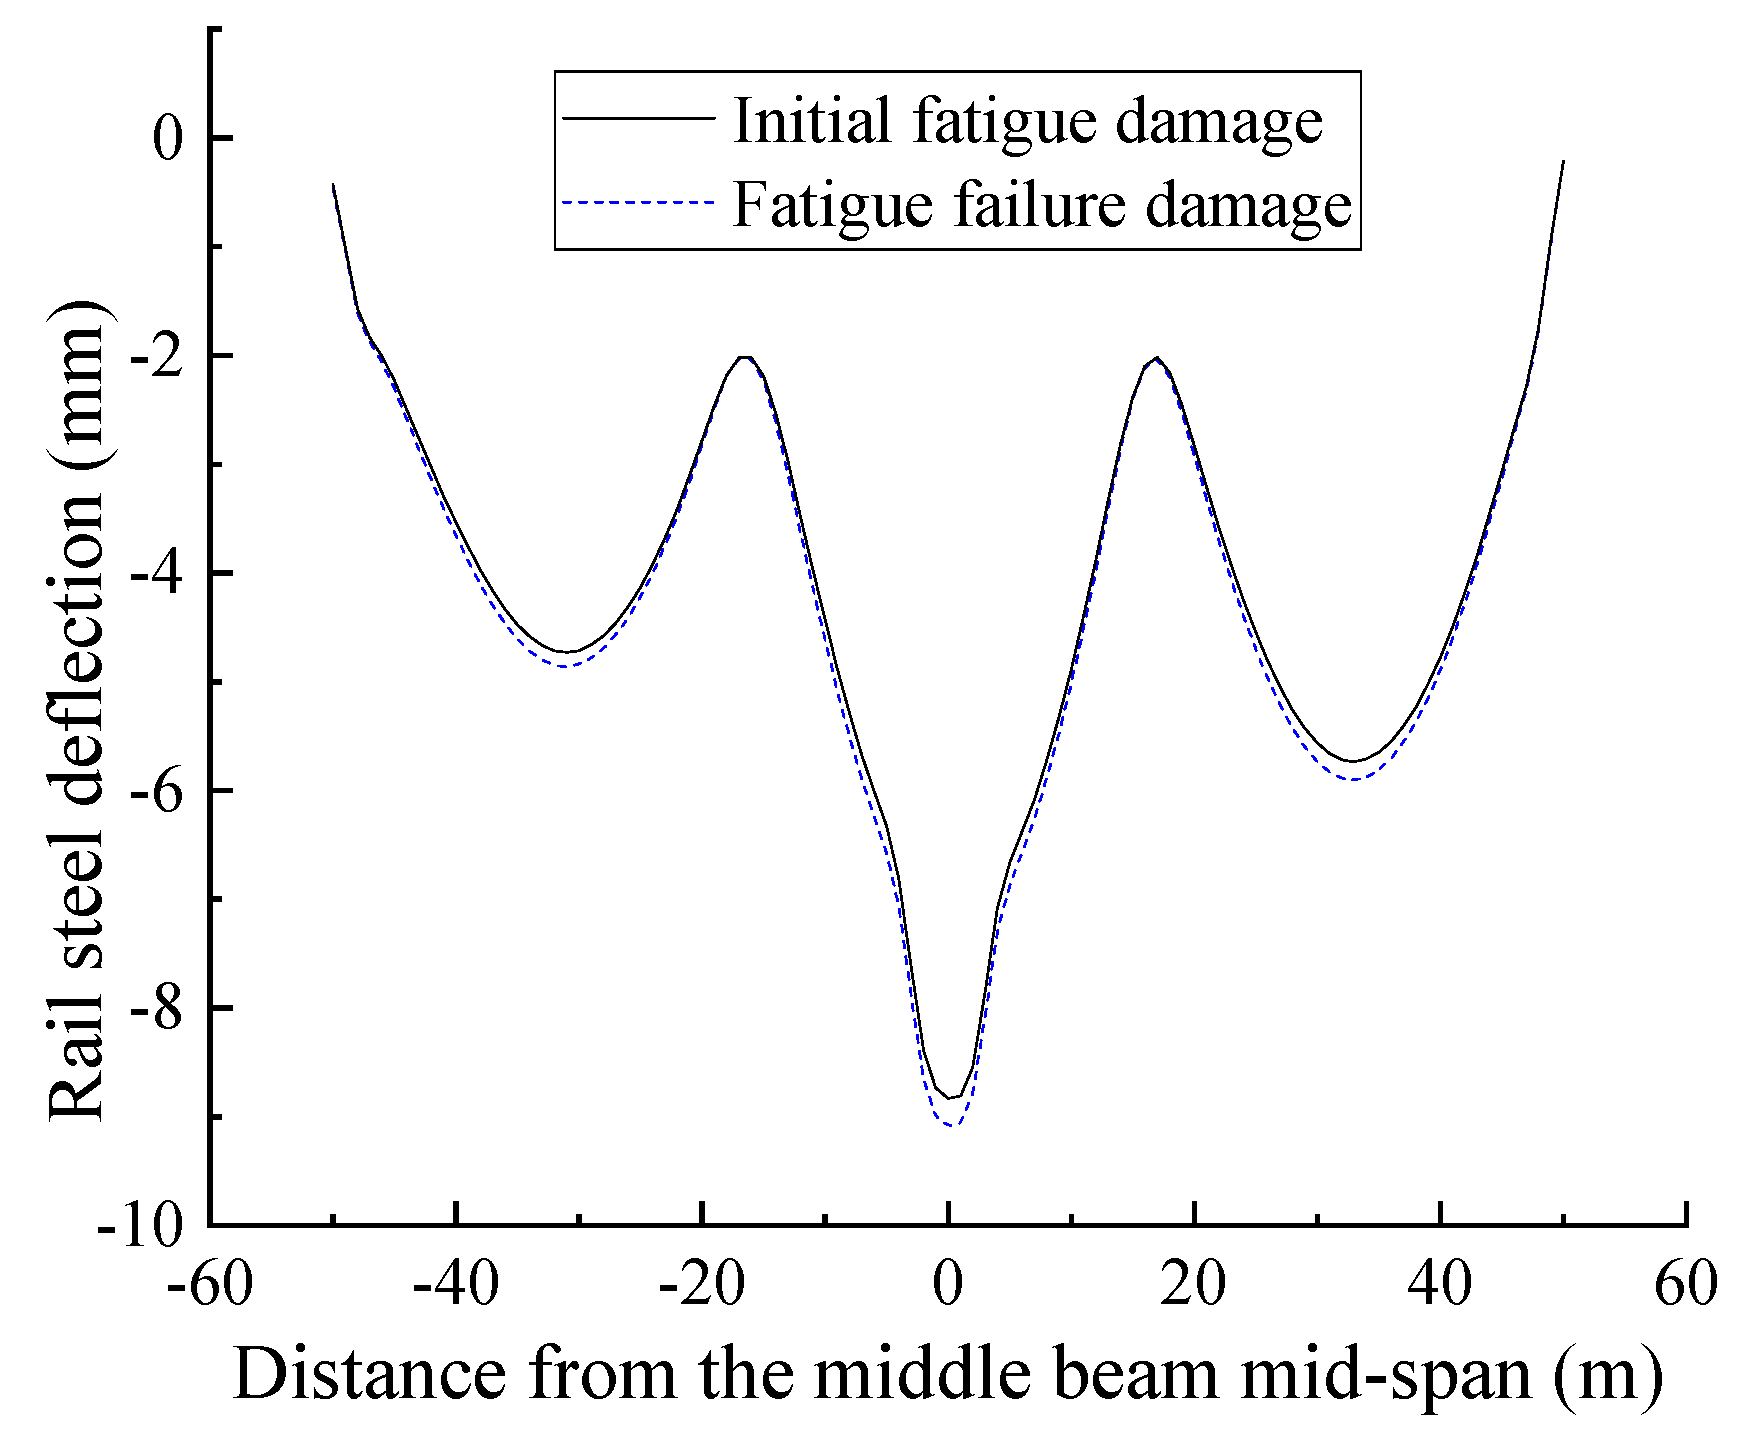
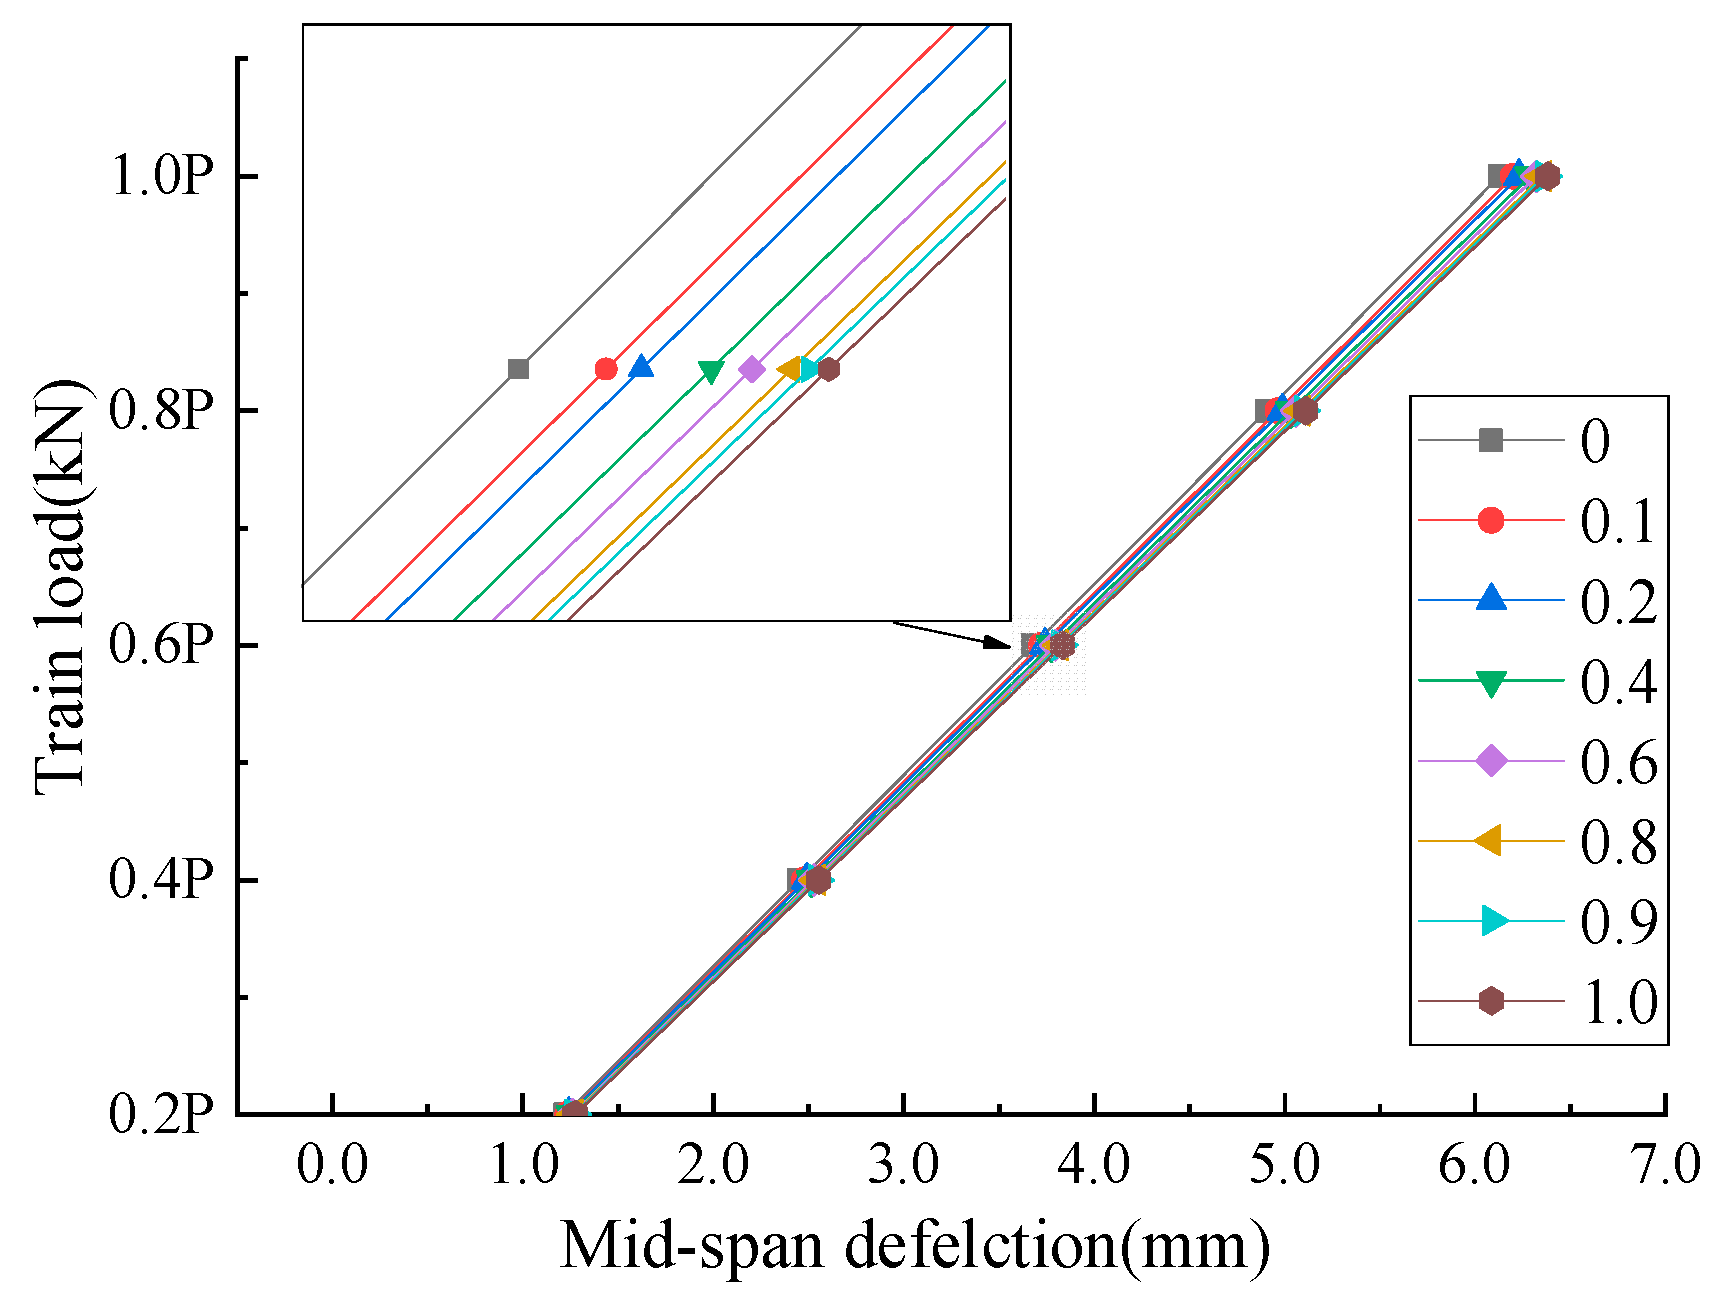
- Under the train fatigue load, the stiffness of the structural system experiences a gradual but insignificant degradation. The overall stiffness of the structural system is controlled mainly by the stiffness of the beam. When fatigue failure of the structural system occurs, there is a slight change in the rail deflection. However, the impact of this change on the track smoothness is insignificant.
- (4)
- The stress redistribution of the track–bridge structural system subjected to the train fatigue load has a more significant effect on the track structure layer stress than on the beam stress.
- (5)
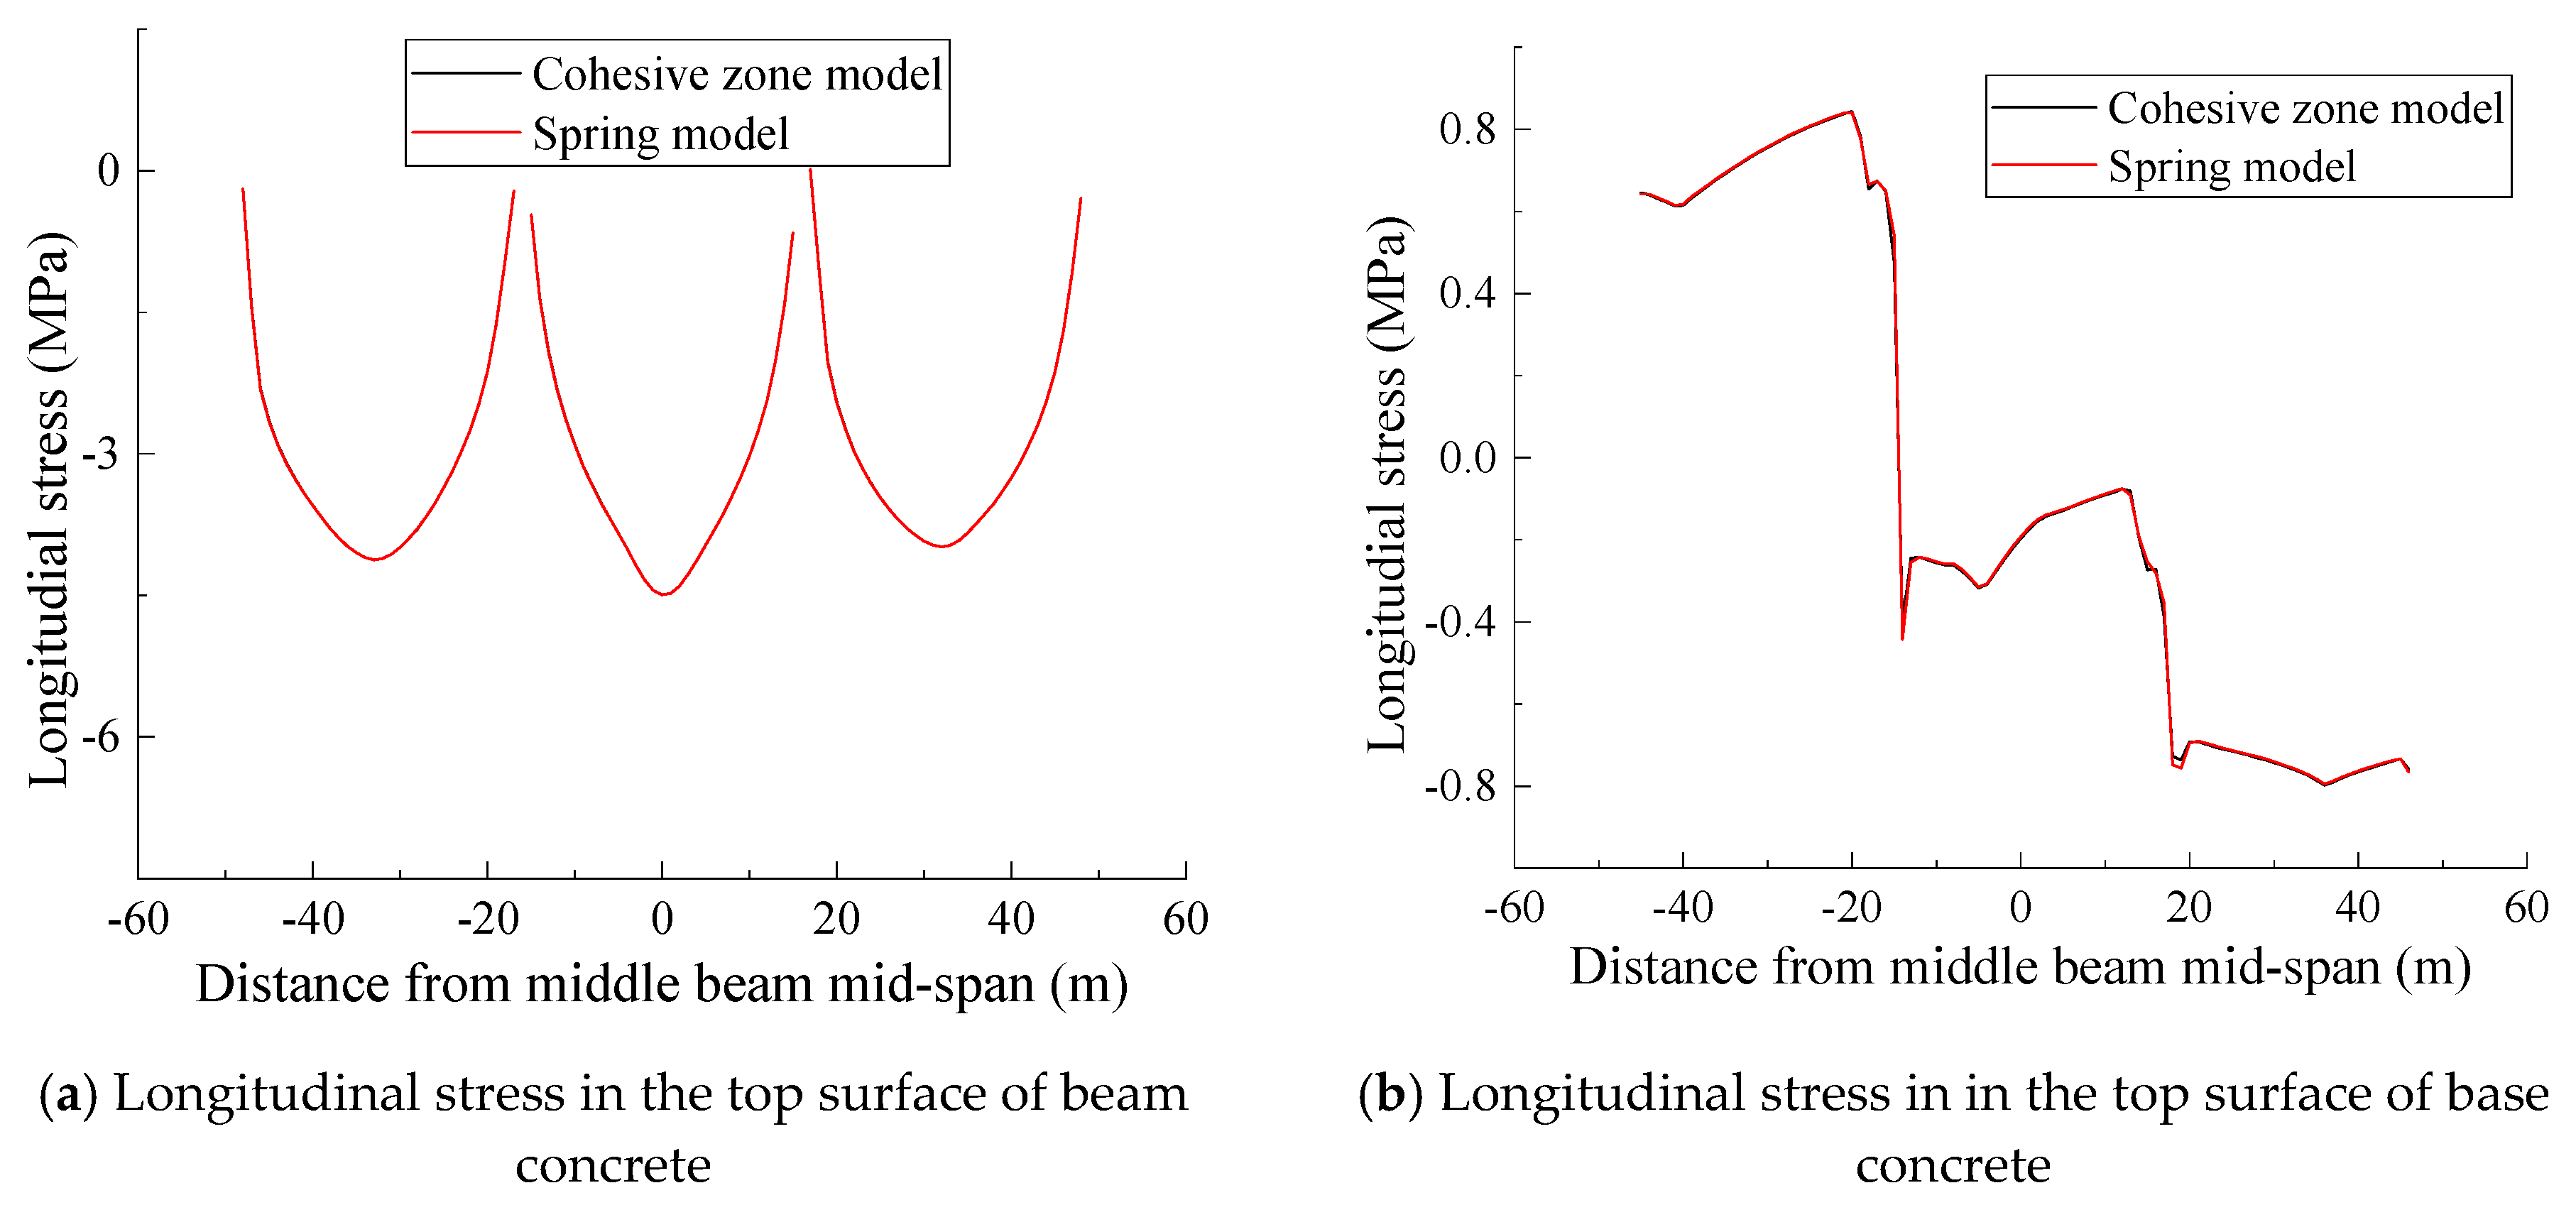
- As environmental factors such as temperature are not considered, and the structural system is only subjected to the train load action, the track system interlayer bond remains intact. Therefore, the calculated results of the interface cohesive zone model and spring model are basically consistent.
- (6)
- The fatigue degradation of the CA mortar layer has a significant impact on the structural system, which directly affects structural layer stress variation with the fatigue loading cycle. The damage evolution of structural system is closer to reality when considering the CA mortar layer fatigue degradation.
6. Further Research
Author Contributions
Funding
Acknowledgments
Conflicts of Interest
References
- Zhou, M.; Dai, G.L. Stability of longitudinally connected ballastless slab track on simply-supported beam bridges of high-speed railway. J. China Railw. Soc. 2015, 37, 60–65. (In Chinese) [Google Scholar]
- Sun, L.; Chen, L.; Zelelew, H.H. Stress and Deflection Parametric Study of High-Speed Railway CRTS II Ballastless Slab on Elevated Bridge Foundations. J. Transp. Eng. 2013, 139, 1224–1234. [Google Scholar] [CrossRef]
- Konings, P. A Study on the Lifetime Aspects of the Rheda 2000 Track System. Ph.D. Thesis, Delft University of Technology, Delft, The Netherlands, 2005. [Google Scholar]
- Wang, Q.; Wei, J.; Dong, R.Z. Fatigue behavior analysis of CRTS Ⅱ slab ballastless track structure. J. Railw. Eng. Soc. 2014, 31, 41–47. [Google Scholar]
- Poveda, E.; Rena, C.Y.; Lancha, J.C.; Ruiz, G. A numerical study on the fatigue Life design of concrete slabs for railway tracks. Eng. Struct. 2015, 100, 455–467. [Google Scholar] [CrossRef]
- Zhu, S.Y.; Cai, C.B. Fatigue damage model of concrete structure for ballastless track of high speed railway. Sci. Sin. (Technol.) 2014, 44, 714–721. [Google Scholar]
- Chen, R.P.; Wang, Z.Z.; Jiang, H.G.; Bian, X.C. Control standard of differential settlement in high-speed railway slab based on bending fatigue strength. J. Zhejiang Univ. (Eng. Sci.) 2013, 47, 796–802. [Google Scholar]
- Tarifa, M.; Zhang, X.; Ruiz, G.; Poveda, E. Full-scale fatigue tests of precast reinforced concrete slabs for railway tracks. Eng. Struct. 2015, 100, 610–621. [Google Scholar] [CrossRef]
- Liu, F.S.; Zeng, Z.P.; Wu, B.; Zhang, Z.C.; Peng, K. Study of the Effect of Cement Asphalt Mortar Disease on Mechanical Properties of CRTS II Slab Ballastless Track. Adv. Mater. Res. 2014, 906, 305–310. [Google Scholar] [CrossRef]
- Du, H.Y.; Liu, G.; Su, C.G. Fatigue Behavior of CA mortar layer in CRTS-I Ballastless Track under Train Load. Appl. Mech. Mater. 2013, 405–408, 40–44. [Google Scholar] [CrossRef]
- Li, Y.L.; Zhao, J.Y.; Ou, Y.J.; Tan, Y.Q. Fatigue behavior of CA mortar layer. China Sci. 2012, 7, 846–848. [Google Scholar]
- Wang, F.Z.; Liu, Z.C. Research on the Fatigue Behavior of CA Mortar Layer Used in Ballastless Slab Track of High Speed Railway. Journal of Wuhan University of Technology 2008, 11, 79–81. [Google Scholar]
- Zhu, S.Y.; Fu, Q.; Cai, C.B.; Spanos, P.D. Damage evolution and dynamic response of cement asphalt mortar layer of slab track under vehivle dynamic load. Sci. China Technol. Sci. 2014, 57, 1883–1894. [Google Scholar] [CrossRef]
- Zhu, S.Y.; Cai, C.B. Interface damage and its effect on vibrations of slab track under temperature and vehicle dynamic loads. Int. J. Non-Linearmech. 2014, 58, 222–232. [Google Scholar] [CrossRef]
- Zhong, Y.L.; Gao, L.; Wang, P.; Liang, S.J. Mechanism of interfacial shear failure between CRTS II slab and CA mortar layer under temperature loading. Eng. Mech. 2018, 35, 230–238. [Google Scholar]
- Dai, G.L.; Su, M. Mechanism of interfacial bond failure for slab ballastless track under shear loading. J. Huazhong Univ. Sci. Technol. (Nat. Sci. Ed.) 2016, 44, 16–31. [Google Scholar]
- Feng, Y.L.; Jiang, L.Z.; Zhou, W.B. Damage destruction evolution law of high-speed railway CRTS II slab ballastless track interface under train braking and temperature load. IOP Conf. Ser. Earth Environ. Sci. 2018, 189, 062060. [Google Scholar] [CrossRef]
- Ping, W.; Hao, X.; Rong, C. Effect of Cement Asphalt Mortar Debonding on Dynamic Properties of CRTS II Slab Ballastless Track. Adv. Mater. Sci. Eng. 2014, 2014, 193128. [Google Scholar]
- Qi, S.X.; Ren, J.J.; Liu, X.Y. Influence of debonding on the performance of CRTSII slab track turnouts on large bridges. Eng. Mech. 2015, 32, 124–132. [Google Scholar]
- Tian, D.M.; Deng, D.H.; Peng, J.W.; Wang, S.X.; Ai, Y.Q. Influence of temperature on interfacial bonding between Cement emulsified asphalt mortar later and concrete layer. J. China Railw. Soc. 2013, 35, 78–85. [Google Scholar]
- Xu, Q.Y.; Zhang, Z.; Chen, X.P.; Lou, P.; Wei, Q.; Duan, J. Experimental study on fatigue life prediction model of concrete of CRTSII slab track on bridge. J. Railw. Sci. Eng. 2017, 14, 1565–1570. [Google Scholar]
- Xu, Q.Y.; Lin, Q.T.; Feng, Z.Y.; Zhang, Z.; Lou, P.; Xiao, Z.; Duan, J. Fatigue properties of longitudinal connected slab track under Combined loads. China Railw. Sci. 2017, 38, 37–45. [Google Scholar]
- Xu, Q.Y.; Lin, Q.T.; Feng, Z.Y.; Lou, P.; Yang, R.; Chen, W.; Zhang, Z. Theoretical study on fatigue stress spectrum of longitudinal connected slab track on bridge. J. Southwest Jiaotong Univ. 2018, 53, 906–912. [Google Scholar]
- Yu, Z.W.; Shan, Z.; Ouyang, Z.Y.; Guo, F. A simple damage model for concrete considering irreverible mode-II microcracks. Fatigue Fract. Eng. Mater. Struct. 2016, 39, 1419–1432. [Google Scholar] [CrossRef]
- Shan, Z. Stochastic Damage Model for Concrete and Its Application. Ph.D. Thesis, Central South University, College of Civil Engineering, Changsha, China, 2017; pp. 125–131. [Google Scholar]
- Yu, Z.W.; Shan, Z.; Li, X. Research on Time-Dependent Behavior of High-Speed Railway Ballastless Track-Bridge Structural System: Stochastic Viscoelastic-Damage Constitutive Model of Crts Ii Ca Mortar Layer; Central South University: Changsha, China, 2018. (In Chinese) [Google Scholar]
- GB 50010-2010. Code for Design of Concrete Structures; China Architecture & Building Press: Beijing, China, 2015; pp. 19–21. [Google Scholar]
- The Concrete Fatigue Task Forces. Research on Failure Reliability Checking Calculation Method of Reinforced Concrete Flexural Components; China Construction Industry Publishing House: Beijing, China, 1994; pp. 26–27. [Google Scholar]
- Li, P.G. Analysis of the Interface Damage of CRTS II Slab Track and Its Influences. Ph.D. Thesis, Southwest Jiaotong University, College of Civil Engineering, Chengdu, China, 2015; pp. 13–14. [Google Scholar]
- Liu, X.Y.; Su, C.G.; Liu, D.; Xiang, F.; Gong, C.; Zhao, P.R. Research on the bond properties between slab and CA mortar layer and the parameters study of cohesive model. J. Railw. Eng. Soc. 2017, 3, 22–28. [Google Scholar]
- TB 10015-2012. Code for Design of Railway Continuous Welded Rail; China Railway Publishing House: Beijing, China, 2012; pp. 6–8. [Google Scholar]
- Gong, C. Study on Composite Specimens Mechanical Properties in CRTSII Slab Track. Master’s Thesis, Southwest Jiaotong University, College of Architecture and Civil Engineering, Chengdu, China, 2017; pp. 38–41. [Google Scholar]
- Zhu, J.S.; Zhu, X.C. Study on simplified method for the analysis of fatigue failure process of RC bridges. Eng. Mech. 2012, 29, 107–121. [Google Scholar]
- Xiao, J.Z.; Chen, D.Y.; Zha, Q.F. Test on bend fatigue behavior of HPC simply-supported beams. Struct. Eng. 2006, 22, 72–76. (In Chinese) [Google Scholar]
- Yu, Z.W.; Zhou, L.Y.; Zhao, L. Research on Time-Dependent Behavior of High-Speed Railway Ballastless Track-Bridge Structural System: Cooperative Performance Test of High-Speed Railway Ballastless Track-Bridge Structural System; Central South University: Changsha, China, 2018. (In Chinese) [Google Scholar]
- TB10621-2014. Design Code for High Speed Railway; China Railway Publishing House: Beijing, China, 2014; pp. 2–3. [Google Scholar]


| Structural Parts | Density (kN/m3) | Thickness (mm) | Poisson Ratio (μ) |
|---|---|---|---|
| Base (C30) | 26.00 | 190 | 0.2 |
| CA mortar layer | 18.00 | 30 | 0.2 |
| Slab (C55) | 26.00 | 200 | 0.2 |
| Structural Parts | Base (C30) | Beam (C50) | Slab (C55) |
|---|---|---|---|
| Et/GPa | 25.35 | 28.75 | 29.20 |
| A1+ | −0.0897 | −0.072 | −0.0702 |
| A2+ | 1 | 1 | 1 |
| x1 | 1.20102 | 1.2005 | 1.1996 |
| x2 | 1.9782 | 1.8633 | 1.84728 |
| p1 | 2.23984 | 2.4988 | 2.54128 |
| p2 | 0.56608 | 0.6325 | 0.6406 |
| c | 0.53486 | 0.5875 | 0.5938 |
| εk+/10−6 | 95.24 | 110.3 | 112.28 |
| Structural Parts | Base (C30) | Beam (C50) | Slab (C55) |
|---|---|---|---|
| Ec/GPa | 26.35 | 31.62 | 32.51 |
| A1- | 0.00344 | 0.004036 | 0.0027 |
| A2- | 1 | 1 | 1 |
| x0 | 1.06218 | 1.18968 | 1.2152 |
| p3 | 2.22346 | 2.88136 | 3.0432 |
| εk-/10−6 | 1471.8 | 1678.4 | 1727 |
| Components | t0 (MPa) | δ0 (mm) | δc (mm) |
|---|---|---|---|
| Normal direction | 1.792 | 0.0025 | 0.0282 |
| First tangential direction | 0.956 | 0.0152 | 0.0376 |
| Second tangential direction | 0.956 | 0.0152 | 0.0376 |
| Structural Parts | Beam | Base | CA Mortar Layer | Slab |
|---|---|---|---|---|
| Fatigue life (Cycles) | 1.35 1012 | 2.57 109 | 2.98 108 | 6.14 108 |
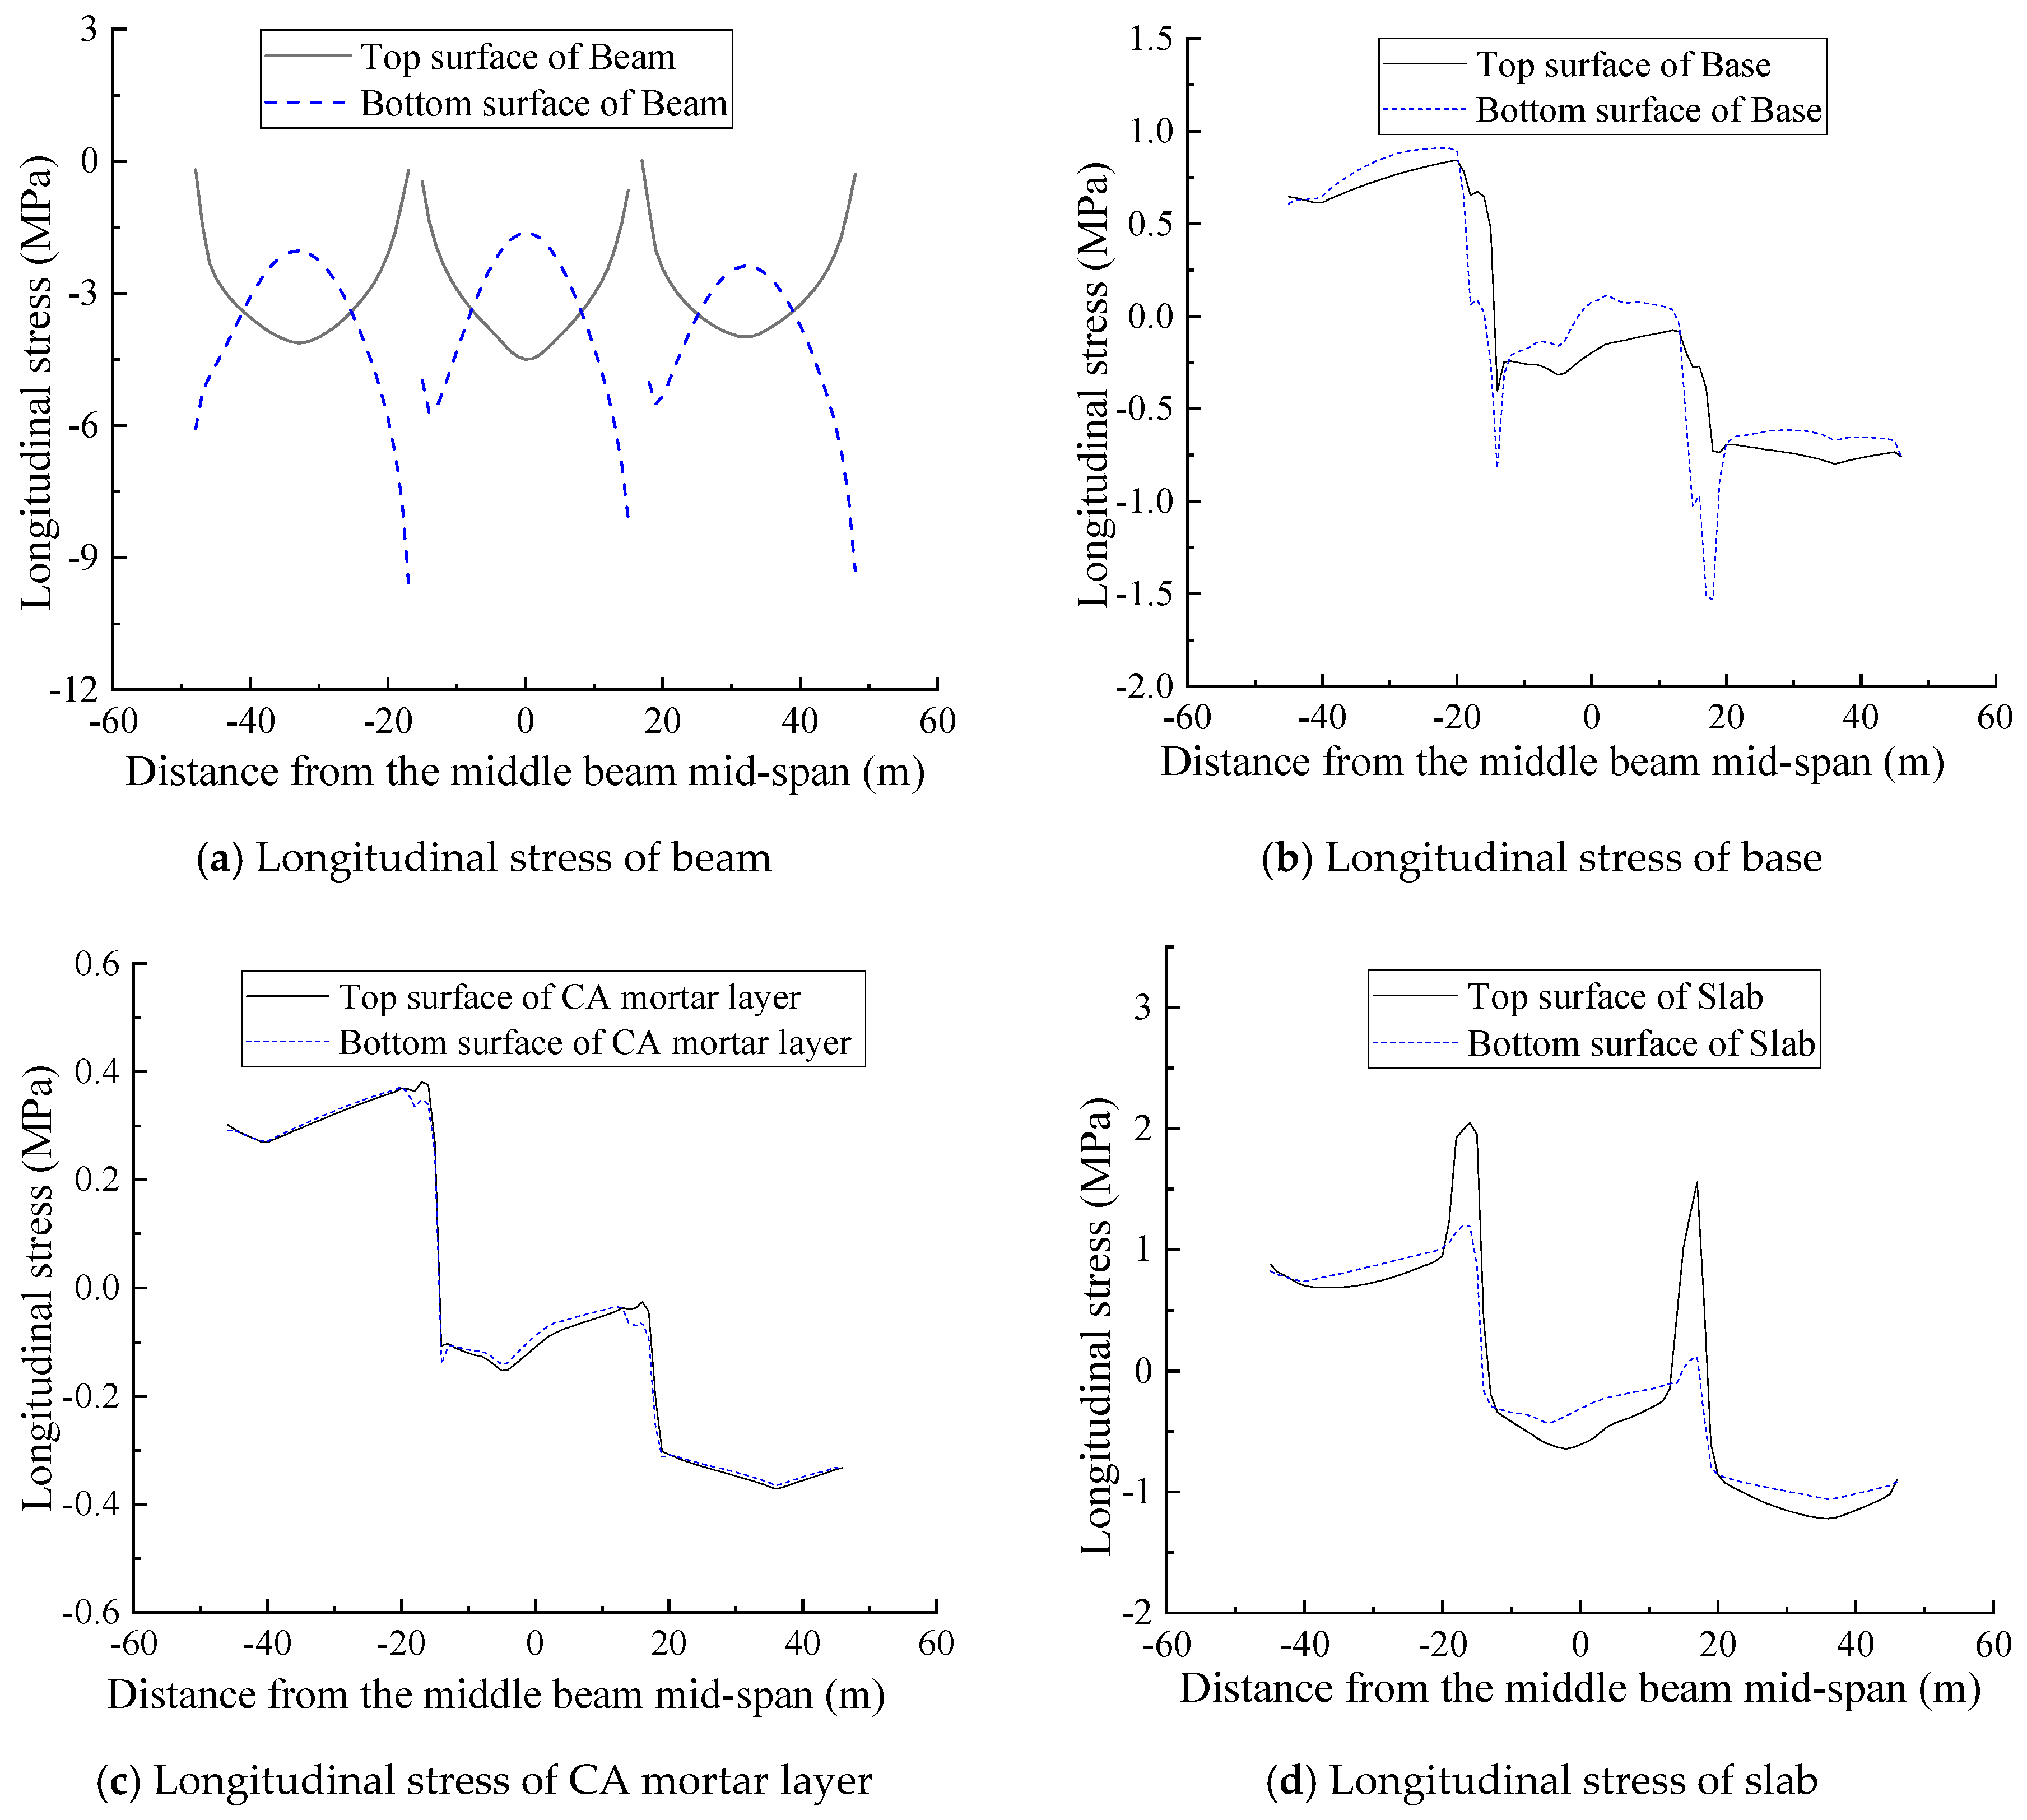
| Mid-Span Mid-Section Position | Initial Longitudinal Stress (MPa) | Longitudinal Stress at Failure (MPa) | Variation |
|---|---|---|---|
| Beam top surface | −4.493 | -4.497 | 0.089% |
| Beam bottom surface | −1.623 | −1.625 | 0.123% |
| Base top surface | −0.197 | −0.20945 | 6.320% |
| Base bottom surface | 0.07715 | 0.02364 | −69.358% |
| CA mortar layer top surface | −0.109 | −0.088 | −19.266% |
| CA mortar layer bottom surface | −0.080 | −0.069 | −13.750% |
| Slab top surface | −0.609 | −0.473 | −22.332% |
| Slab bottom surface | −0.312 | −0.268 | −14.103% |
| Interface Bond Models | Beam Maximum Displacement (mm) | Beam Top Surface Maximum Stress (MPa) | Base Top Surface Maximum Stress (MPa) | CA Mortar Layer Top Surface Maximum Stress (MPa) | Slab Top Surface Maximum Stress (MPa) |
|---|---|---|---|---|---|
| Cohesive zone model | 6.129 | −4.493 | 0.843/−0.797 | 0.381/−0.372 | 2.047/−1.218 |
| Spring model | 6.133 | −4.493 | 0.841/−0.795 | 0.379/−0.371 | 2.026/−1.220 |
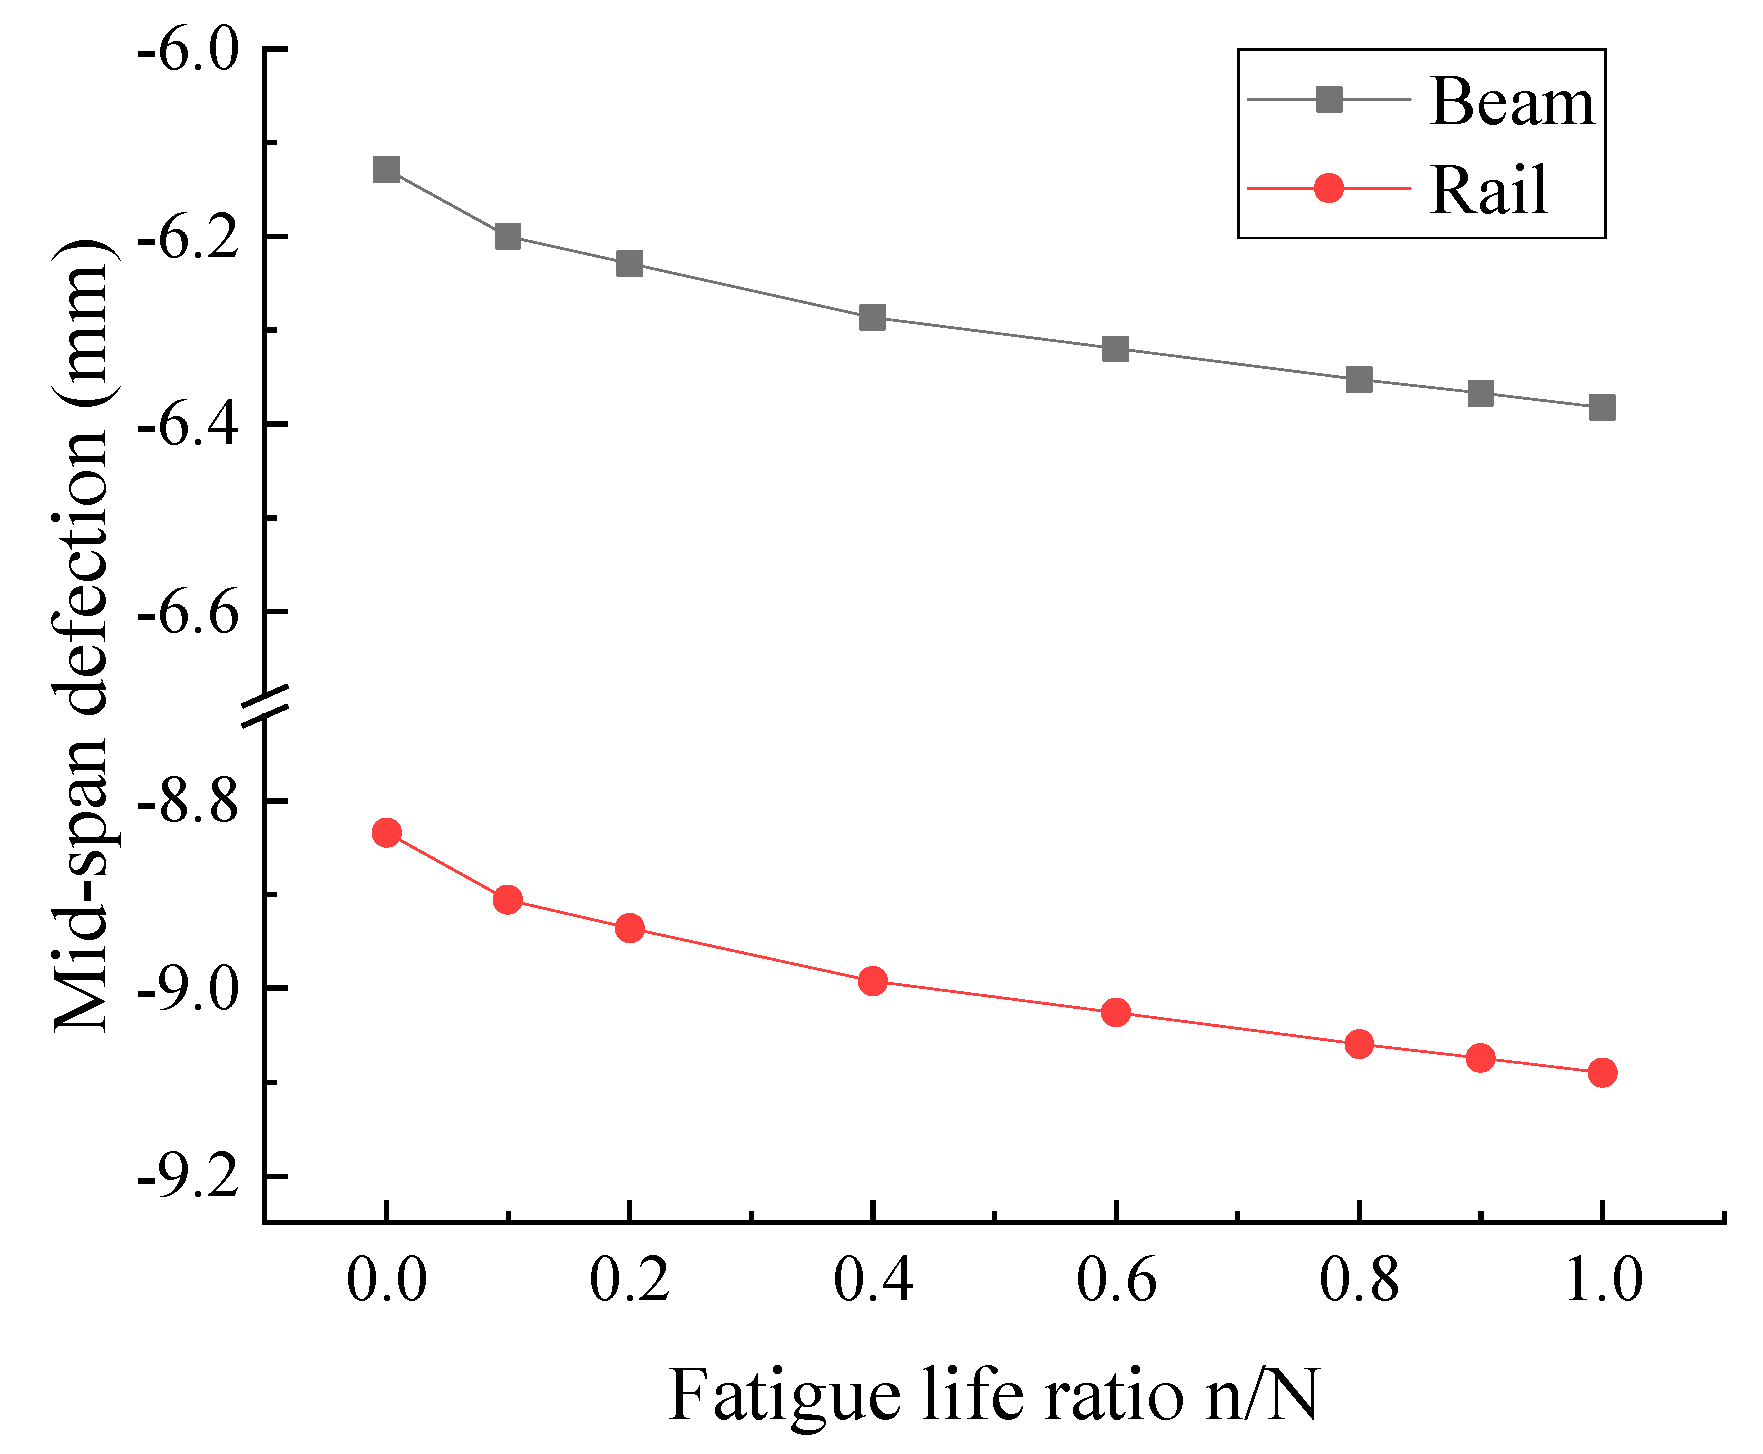
| Structural Parts | Initial Stage Displacement (mm) | Structural Failure Deflection, Regardless of CA Mortar Layer Damage (mm) | Variation | Structural Failure Deflection, Considering CA Mortar Layer Damage (mm) | Variation |
|---|---|---|---|---|---|
| Beam | 6.129 | 6.556 | 6.967% | 6.383 | 4.144% |
| Rail | 8.834 | 9.274 | 4.981% | 9.090 | 2.898% |
| Mid-Span Position of the Middle Beam | Initial Longitudinal Stress (MP)a | Failure Longitudinal Stress (MPa) | Variation |
|---|---|---|---|
| Beam top surface | −4.493 | −4.501 | 0.178% |
| Beam bottom surface | −1.623 | −1.625 | 0.136% |
| Base top surface | −0.197 | −0.241 | 22.249% |
| Base bottom surface | 0.07715 | −0.021 | −127.090% |
| CA mortar layer top surface | −0.109 | −0.161 | 47.817% |
| CA mortar layer bottom surface | −0.080 | −0.140 | 74.438% |
| Slab top surface | −0.609 | −0.341 | −44.085% |
| Slab bottom surface | −0.312 | −0.217 | −30.388% |
© 2019 by the authors. Licensee MDPI, Basel, Switzerland. This article is an open access article distributed under the terms and conditions of the Creative Commons Attribution (CC BY) license (http://creativecommons.org/licenses/by/4.0/).
Share and Cite
Zhou, L.; Yang, L.; Shan, Z.; Peng, X.; Mahunon, A.D. Investigation of the Fatigue Behaviour of a Ballastless Slab Track–Bridge Structural System under Train Load. Appl. Sci. 2019, 9, 3625. https://doi.org/10.3390/app9173625
Zhou L, Yang L, Shan Z, Peng X, Mahunon AD. Investigation of the Fatigue Behaviour of a Ballastless Slab Track–Bridge Structural System under Train Load. Applied Sciences. 2019; 9(17):3625. https://doi.org/10.3390/app9173625
Chicago/Turabian StyleZhou, Lingyu, Linqi Yang, Zhi Shan, Xiusheng Peng, and Akim D. Mahunon. 2019. "Investigation of the Fatigue Behaviour of a Ballastless Slab Track–Bridge Structural System under Train Load" Applied Sciences 9, no. 17: 3625. https://doi.org/10.3390/app9173625
APA StyleZhou, L., Yang, L., Shan, Z., Peng, X., & Mahunon, A. D. (2019). Investigation of the Fatigue Behaviour of a Ballastless Slab Track–Bridge Structural System under Train Load. Applied Sciences, 9(17), 3625. https://doi.org/10.3390/app9173625