Featured Application
Fatigue cracking resistance of engineered cementitious composites under working condition of orthotropic steel bridge decks pavement.
Abstract
In order to investigate the fatigue cracking resistance of engineered cementitious composites (ECC) used in in total life pavement, the semi-circular bending (SCB) test and improved three-point bending fatigue test (ITBF) were utilized in this study. The digital image correlation (DIC) method was also utilized to track the surface strain fields of specimens during the SCB test. X-ray computed tomography (CT) and digital image processing (DIP) technologies were applied to measure the internal-crack distribution of the ITBF specimen. The results of the SCB test showed that the fatigue cracking damage process of ECC can be divided into three stages and that the cracking stable propagating stages occupied the main part, which indicates that ECC has excellent ductility and toughness and could work very well with existing cracks. The ITBF results showed that the fatigue cracking resistance of ECC was better than epoxy asphalt concrete (EAC). In addition, the internal-crack distribution along the depth direction of the ITBF specimen could be presented well by the image pixel statistical (IPS) method based on CT scanning of image slices. It could be found that multiple cracks propagate simultaneously in ECC, instead of a single crack, under the OSBD pavement working condition.
1. Introduction
The overall and local deformations of long-span steel box girder bridges are much larger than those of cement concrete bridges because of the differences in bridge structure design and materials used []. Therefore, the stress state of orthotropic steel bridge deck (OSBD) pavement of long-span steel box girder bridges is more complex than that of cement concrete bridges or traditional asphalt pavement []. In addition, due to the high thermal conductivity of steel, the temperature of steel deck pavement in summer is much higher than other pavement structures. Therefore, the working condition of the steel deck pavement requires that the paving materials used show better performance in cracking resistance and high-temperature stability than conventional pavement materials. Among the existing pavement materials, Gussasphalt concrete can hardly been applied into the steel bridge deck pavement structure because of its poor high temperature stability, which can easily lead to serious rutting diseases []. At present, the application of epoxy asphalt concrete (EAC), which is the most successful material for steel deck pavement, has improved the high temperature stability of OSBD pavement significantly, but with insufficient fatigue cracking resistance at intermediate temperature. The fatigue cracking diseases usually appear after 2–3 years under the action of negative bending caused by longitudinal stiffening ribs in the lower part of the steel deck, which seriously affects the durability of the pavement [,].
ECC is the abbreviation of engineered cementitious composite, the basic design concept of this material was proposed by Prof. Li (University of Michigan) and Prof. Leung (Massachusetts Institute of Technology) based on basic principles of meso-mechanics and fracture mechanics [,,]. Nowadays, ECC is a generalized concept, representing high ductile cementitious composite materials with ultimate tensile strains over 3%.
Typical ECC material consists of cement, sand, fly ash, water, additives, and polymeric fibers (e.g., polyethylene, polyvinyl alcohol) [,]. After first cracking, the tensile load capability of ECC material continues to rise, resulting in a macroscopic strain-hardening phenomenon accompanied by multiple micro-cracks. These multiple-crack widths increase steadily up to about 60 µm, at about 1% strain. Between 1% and 5% strain, the crack width stabilizes and tends to remain constant at 60 µm while the number of cracks increases []. Unlike most concrete and fiber- reinforced concrete materials, crack width in ECC is an intrinsic material property, independent of structural size, steel reinforcement, or the load applied to a structure built with ECC. Besides, ECC material exhibits excellent fatigue resistance under the four point bending fatigue test []. Because ECC has wonderful self-healing capabilities, micro-cracks can be closed and healed after they have been initiated [,,,].
These special properties ensure that ECC can meet the stringent requirement of resiliency and durability in infrastructure. ECC has been successfully applied in bridge deck link slabs [], bridge deck overlays, dam repair and coupling beams in high rise buildings [,]. After ECC was introduced into China, researchers such as Dr. Ma made an effort to use local raw materials to prepare ECC, so as to decrease the cost and expand the application scenarios. The results indicate that the locally produced material can totally achieve the design targets of ECC []. But the feasibility of ECC materials applied in the orthotropic steel bridge deck (OSBD) pavement has not been proved sufficiently, especially in the fatigue cracking aspect, due to the severe working conditions of the OSBD pavement. Therefore, this study focuses on the cracking resistance of ECC under OSBD pavement working condition.
Based on the above considerations, the main objectives of this study were as follows:
- (1)
- Evaluate the fatigue cracking resistance of ECC using the semi-circular bending (SCB) test and improved three-point bending fatigue (ITBF) test.
- (2)
- Build the fatigue equations based on the relationship between cracking fatigue life and stress ratio.
- (3)
- Describe the cracking developing stages of the ECC materials during the SCB test.
- (4)
- Investigate the internal-crack distribution of ECC under OSBD pavement working conditions by combining computed tomography (CT) with digital image processing (DIP) technologies.
2. Materials and Mix Design
ECC used in this study was composed of cement, fly ash, ground slag, fine aggregate, polyvinyl alcohol (PVA) fiber, a water reducing agent, functional components and water in proportion. Among these components, P·II 42.5R cement produced by China cement plants, low calcium grade I fly ash produced by the Nanjing thermal power plant, S95 ground slag produced by Ma’anshan iron and steel Co., Ltd., Hunan, China, PVA fiber produced by Baohua Industrial Development Co., Ltd., Yongan, Fujian, China, polycarboxylate superplasticizer produced by Sika Corporation with 40% solid content and 40% water reduction rate were used. The maximum particle size of fine aggregates should be less than 1.18mm, the fineness modulus was 1.0, and the mass fraction of SiO2 should be over 99.5%. The mix component proportions of ECC are shown in Figure 1.
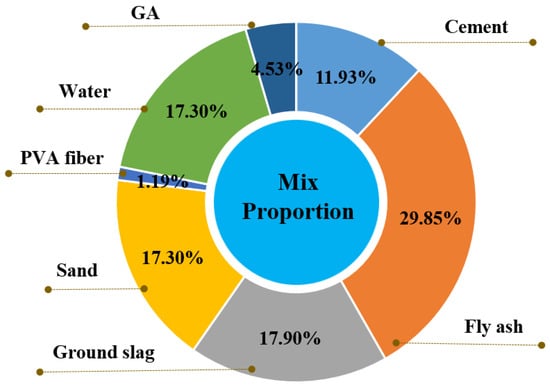
Figure 1.
Mix proportion of ECC.
3. Meteorology
3.1. Specimen Preparation
Moulds with 150 mm internal diameter and 180 mm height were designed and manufactured to prepare cylindrical specimen of the ECC materials. A cement mortar mixer was used to mix raw materials. It is worth noting that fibers were added in the last step to ensure the uniform dispersion within the ECC specimens. The mixing and molding processes of the cylindrical specimen are shown in Figure 2.
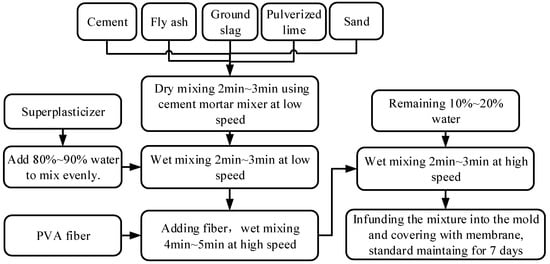
Figure 2.
Engineered cementitious composites (ECC) mixture mixing and molding process.
All the cylindrical specimens were demolded at the age of 24 h, and then cured at a relative humidity (RH) of 95 ± 5% and temperature of 20 °C until the age of 28 days. After curing, samples were cut into semi-circular geometry with 50 mm thickness for the SCB test, and spray painting was carried out for preparation of digital image correlation (DIC). All tests were carried out at the specimen age of 30 days. All the ECC SCB specimens were prepared according to the process shown in Figure 3.
Figure 3.
ECC semi-circular bending (SCB) specimen preparation process.
3.2. Load Mode and Stress Level
A universal test machine (UTM) load frame equipped with a temperature control chamber was utilized for SCB testing. Considering the stability and time factors of testing, the load control method was adopted. The testing temperature was set to be 15 °C. Firstly, four SCB specimens were conducted with monotonic load to obtain the bending strengths of the ECC materials. The mean peak load of the four replicates was 11.84 kN. Four stress ratios, 0.5, 0.6, 0.7 and 0.8, were selected to carry out during the fatigue test, and the corresponding loading forces were 5.92 kN, 7.1 kN, 8.3 kN and 9.5 kN, respectively. The loading frequency during the SCB fatigue test was set to be 10 Hz, and a non-intermittent half sinusoidal wave was utilized as the loading waveform. The sampling frequency of the fatigue test data was 1000 Hz, so 100 data points were collected in each loading cycle. The test was terminated when the samples went into fatigue failure or the cyclic loading cycles exceeded 100,000. When the stress ratios were set to be no more than 0.4, no obvious cracking could be observed on the surface of the samples, even if the loading cycles were higher than 100,000, so the stress ratios under 0.4 were not considered in this paper.
3.3. Digital Image Correlation in SCB Test
Digital image correlation (DIC) technology was adopted to record the surface displacement and strain distribution of SCB specimens []. The experimental setups are shown in Figure 4. An industrial digital camera (resolution 1626 × 1236, focal length 25 mm, pixel size 4.4 µm, 14 fps @max resolution) was employed to capture frames during the process of fatigue loading. The camera was positioned perpendicular to a specimen and at a constant distance away from it. A lighting system, composed of two white lights, provided adequate illumination of the specimen inside the chamber. The camera was set to acquire five frames per second at the beginning of the test.
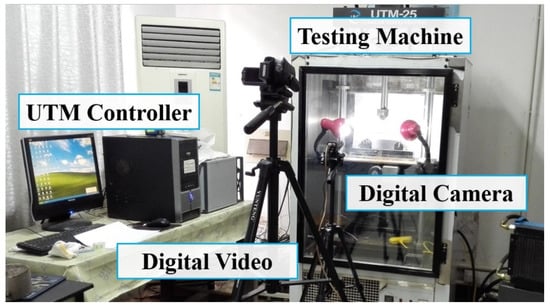
Figure 4.
Universal test machine (UTM) loading cooperated with digital image correlation (DIC).
4. Discussion of Test Results
4.1. SCB Test Results
4.1.1. Definition of the Three Stages within the Fatigue Curve
As Figure 5 shows, the fatigue cracking process of ECC can be divided into three stages: the crack initiation stage, the crack stable propagation stage and the accelerated destruction stage.
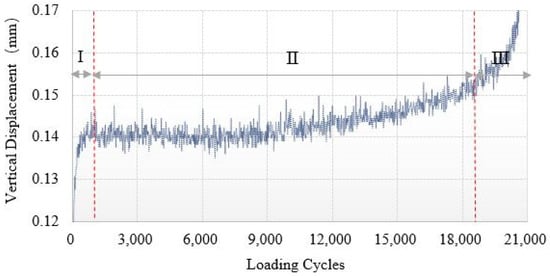
Figure 5.
Three stages of ECC fatigue cracking process during the SCB test under stress ratio 0.5.
The slope variation of the curve shown in Figure 5 was used to distinguish the cracking stages. However, due to the dynamic load of 10 Hz during the test, the curve presented a fluctuating state. Thus, a three regression model was used to fit the original data, as Figure 6 shows, and then the slope of the fatigue curve could be calculated easily. As Figure 6 demonstrates, the first segment with a loading cycle between 0–6000, with an decreasing slope of the displacement-cycle curve, was fitted by four-parameter logistic rodboard model, as Equation 1 shows; the second segment with loading cycle interval 6000–14,000, with a steady slope of the displacement-cycle curve was fitted by linear model, as Equation 2 shows; and the third segment with a loading cycle between 14,000–21,000, with an increasing slope of the displacement-cycle curve was fitted by a three-parameter exponential model, as Equation (3) shows. The slope of each model at different cycles could be calculated by Equations (4)–(6), respectively. The fitting results of the three regression models are shown in Table 1. Because the second segment was fitted by a linear model, the scope was constant and equal to b. By solving equation , the critical loading cycles between stage I and stage II could be determined. Similarly, by solving , the critical loading cycles between stage II and stage III could be calculated. The loading cycles of each fatigue cracking stage could be obtained as shown in Table 2.
where, x is loading cycles, y is vertical displacement. a1, b1, c1, d1, a2, b2, a3, b3, c3 are model regression fitting parameters, K1, K2 and K3 are the slope of the three regression models respectively.
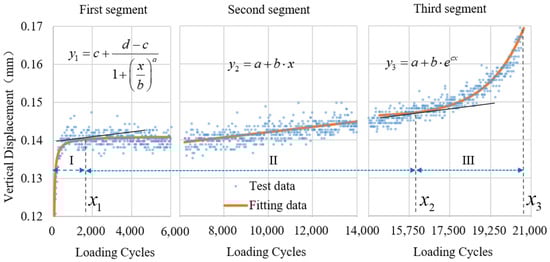
Figure 6.
Three-stage fitting method for distinguishing fatigue cracking stages of ECC.

Table 1.
Regression fitting parameters of three-stage equations.
Table 2.
Statistics of load cycles in SCB fatigue tests.
4.1.2. Characteristics of the Three Stages at Different Stress Ratios
In order to more clearly observe the process of crack initiation and propagation and describe the strain distribution field of the specimen, digital image correlation (DIC) technology was adopted to analyze the strain distribution of the front face of the semi-circular specimen during fatigue process. The stages of crack initiation, propagation and accelerated destruction during the entire duration of the fatigue process can also be visualized using the DIC method. The transverse strain distribution fields at different stages of the fatigue process under stress ration 0.5 are shown in Figure 7. The strain distribution under other stress ratios are similar, and not discussed further in this paper.
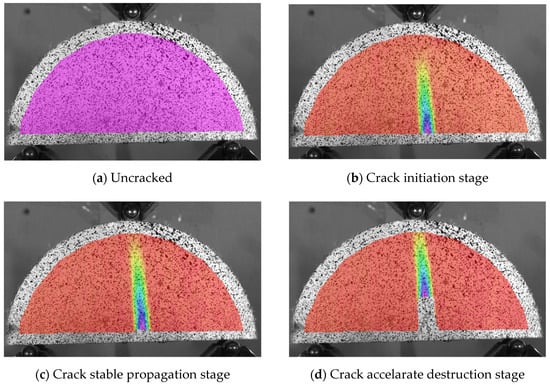
Figure 7.
Surface transverse strain field under stress ratio 0.5.
The results in Table 2 show that, with the increase of stress ratio, the loading cycles in each stage decreased gradually. Under the same stress ratio, the load cycles in stage II, that is, the crack stable propagation stage, were obviously greater than that of other stages. In order to better study the proportion of each stage over the whole fatigue life, the ratio of the load cycles in each stage to the total amount of loads cycles during the entire fatigue process was calculated as shown in Figure 8.
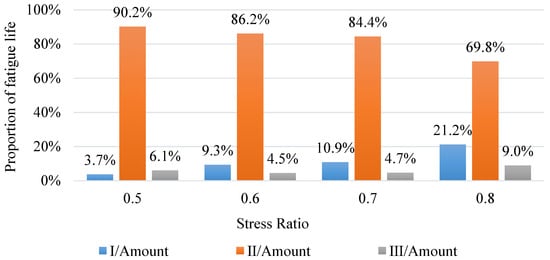
Figure 8.
Percentages of fatigue cycles in stages to the total fatigue life under different stress ratios.
The proportion of the total life of ECC represented by the crack initiation stage (stage I) increased while the stress ratio increased. When the stress ratio was 0.5, the crack initiation stage was only 3.7% of the total life; when the stress ratio increased to 0.8, stage I became 21.21% of the total life. This phenomenon shows that ECC had better performance with cracks in it under lower stress ratio, the existence of PVA fibers enabled ECC to maintain its load-carrying capability even after cracks initiated and propagated. The crack propagation stage (stage II) of ECC accounted for a higher percentage of total life than the other stages, which indicates that ECC exhibits excellent working performance with cracks in it. With the increase in the stress ratio, the proportion of life in stage II also decreased, which indicated that the working performance of ECC with cracks decreased continuously under a high stress ratio. Especially when the stress ratio rose from 0.7 to 0.8, the proportion of life in stage II decreased from 84.4% to 69.8%. There was no significant relationship between the percentage of total life in the crack acceleration destruction stage (stage III) and the stress ratio, since the material lost its stability and bearing capability rapidly and was completely destroyed in a short time.
4.1.3. Fatigue Life Regression Equation Establishment
The fatigue life of ECC was determined to be the number of loading cycles at the end of stage II. During fatigue tests, four parallel tests were prepared and tested to obtain the fatigue lives of ECC under different stress ratios, as shown in Figure 9.
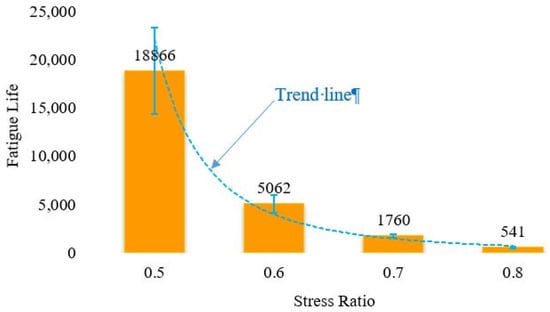
Figure 9.
ECC fatigue lives under different stress ratios.
The fatigue life of ECC decreased significantly with the increase of stress ratio. Therefore, if ECC is applied to OSBD pavement, overloading will dramatically reduce the fatigue life of ECC pavement. According to the results shown in Figure 9, it can be found that there is a power function correlation between fatigue life and stress ratio. Thus, the fatigue life of ECC is transferred logarithmically to be . On this basis, the relationship between and stress ratio can be established and plotted, as shown in Figure 10.
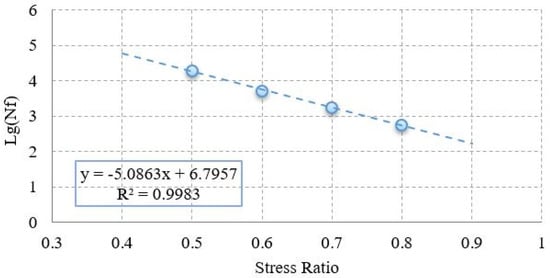
Figure 10.
Logarithmic relationship between stress ratio and fatigue life.
According to the results shown in Figure 10, there is a good linear relationship between and . The fatigue equation of ECC material based on stress ratio can be obtained as follows.
where,
4.2. ITBF Test Results
4.2.1. ECC-Steel Composite Specimen Fatigue Cracking Test
The SCB fatigue tests could evaluate the fatigue cracking resistance of ECC under different assumed stress ratios. However, when ECC is applied as OSBD pavement material, it works together with steel decks. Therefore, in order to measure the fatigue cracking resistance of ECC under actual OSBD pavement working conditions, a fatigue cracking test for ECC-steel composite specimens needed to be carried out.
In order to overcome the disadvantages of existing OSBD pavement material composite beam fatigue tests, an improved three-point composite beam fatigue (ITBF) test was developed according to the actual working conditions of OSBD pavement []. Before testing, stress or strain fields in the specimen were calculated using the finite element method (FEM) and set to be consistent with the mechanical response of actual OSBD pavement by adjusting the test loading. UTM-25 was usually applied as loading equipment in this test, and the plane size of the specimens was 440 mm × 150 mm. During the loading process, two loading plates were used to simulate the wheel loads and the center support was adopted to simulate the OSBD stiffener. The mechanical analysis results show that this test could simulate the negative bending moment on the top surface of decks pavement under actual wheel load. The load transmission path and the stress distribution in this test are shown in Figure 11, which were highly consistent with the actual stress conditions of OSBD pavement. The specimen in the ITBF test was composed of a 25 mm thickness ECC layer and a 6mm thickness steel plate. Epoxy resin binder was used as the tack coat between ECC and steel.
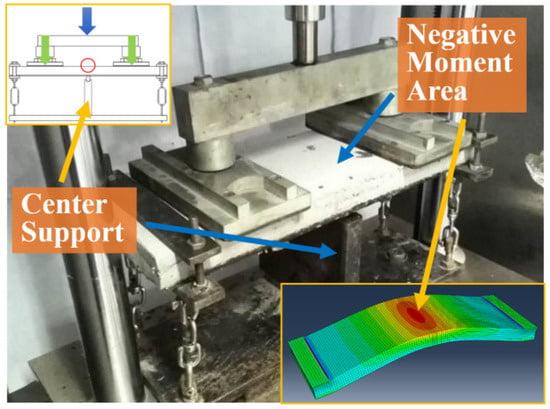
Figure 11.
ECC-steel composite specimen fatigue test according to orthotropic steel bridge deck (OSBD) pavement actual working conditions.
4.2.2. Analysis of the ITBF Test Results
In order to speed up the test process and avoid UTM equipment damaged by long-time working conditions, a stress ratio 0.5 of ECC was chosen during this test based on SCB fatigue test results. Under this status, the highest internal stress level of ECC in composite beam specimens was 5.48 MPa. According to the mechanical calculation results, the loading force should be 6.2 kN and the stress amplification factor was 2.96. Under this loading condition, the test load on ECC was equivalent to about 40 tons of axle load on actual OSBD pavement. The displacement curve obtained in the UTM controlling software interface during this test is shown as Figure 12.
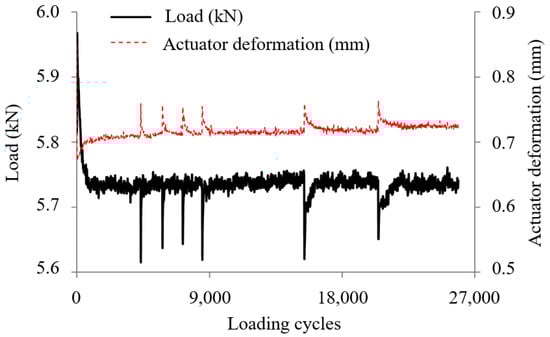
Figure 12.
Displacement curve of loading point of composite beam under stress ratio 0.5.
By observing the test results shown in Figure 12, it can be seen that many mutation points occurred on the displacement curve due to the crack propagation on the surface or inside of the ECC specimen. However, the displacement of the loading point quickly returned to the original level after mutation point. This phenomenon reflects that the only inorganic cement mastic may crack in ECC during this stage and the existence of PVA fibers enabled the ECC to bear loading after the cement mastic was damaged. Due to this characteristic, cracks propagated in the ECC, but the load-carrying capability was not significantly weakened. With the increase of loading cycles, cracking damage became more and more serious, but no sudden brittle fracture occurred. However, the bending and tensile capacities of ECC were further decreased and the loading point displacement increased slowly while cracks were propagating. The fatigue crack morphologies on the ECC specimen surfaces in a composite beam are shown in Figure 13.
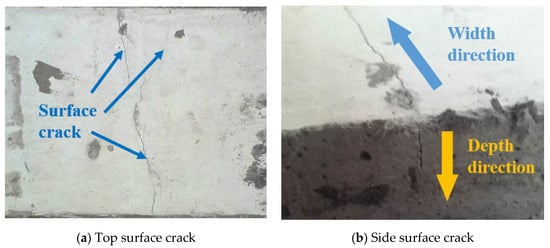
Figure 13.
ECC fatigue cracks in composite beams under the improved three-point bending fatigue test (ITBF) test.
Finally, two ECC-steel composite beams were tested, the fatigue lives were obtained and converted into the reference fatigue life under normal loading, as shown in Table 3.
Table 3.
Loading parameters and fatigue life results in ITBF test.
As shown in Table 3, the average fatigue life of these two composite beam specimens was about 240,000 loading cycles. According to the fatigue equation, the tested fatigue life was converted into reference fatigue life, which represents the fatigue life under normal vehicle loading without the load amplification factor. In this research, the reference fatigue life of ECC materials was 5.530 million cycles. In order to better reflect the fatigue cracking resistance of ECC, the reference fatigue lives of epoxy asphalt concrete (EAC) and high strength asphalt concrete (HSAC) were tested using the same test conditions, as shown in Figure 14.
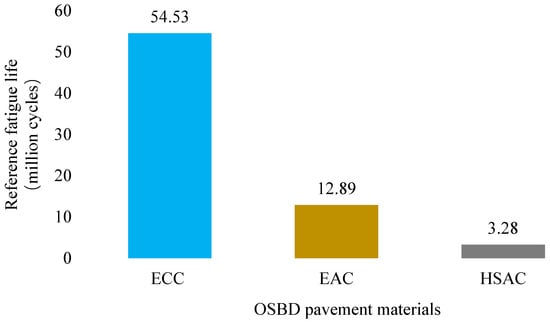
Figure 14.
Reference fatigue lives of different OSBD pavement materials.
As Figure 14 shows, the reference fatigue life of ECC is 4.23 times and 16.63 times better than EAC and HSAC respectively, reflecting excellent fatigue cracking resistance. Besides, the fatigue cracking process of ECC is slow, tough, and has a strong working capability with existing cracks, which is beneficial in maintenance and repair work after cracking occurs.
4.3. Image Acquisition and Cracking Recognition
4.3.1. X-ray CT Scanning for Negative Moment Cracking Area
The crack morphologies on specimen surfaces during the ITBF test can be visually observed, but the internal cracks cannot be explored in conventional ways. In this paper, the cracked ECC specimens tested by ITBF test were scanned using X-ray CT scanning technology, and a series of image slices were captured. Then, the distribution of internal cracks was investigated.
Two ECC specimens were cut after testing. The cracking areas bearing maximum negative bending moments of the specimens were intercepted, and then scanned by X-ray CT system, as shown in Figure 15.
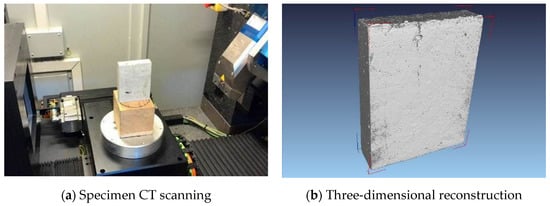
Figure 15.
Three-dimensional CT scanning and reconstruction of ECC cracked specimen.
4.3.2. Crack Recognition in CT Images
The digital image processing (DIP) technology was used to process the slice images of ECC obtained by CT scanning [], so as to identify the internal cracks and analyze the distribution of cracks. This study utilized image processing toolkit in MATLAB to process the obtained CT images. Crack recognition in CT images was realized by image enhancement, filtering, denoising, threshold segmentation and other technical means [,]. Specimens were scanned every 1 mm along the depth direction, and 26 images were obtained from top surface of the specimen to the bottom.
Figure 16 shows the original CT image slice and crack recognition result on the top surface of the specimen. It can be observed that the fatigue cracking behavior of ECC was multi-crack propagation, and there was no single failure section. Multiple cracks were initiated and propagated into visible cracks in the bending-tension region. The length, width and extent region of cracks on top surface were obviously greater than those on the deeper depth sections.
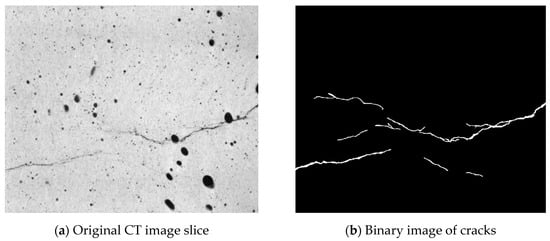
Figure 16.
Crack recognition by processing computed tomography (CT) image slices.
4.3.3. Analysis of the Cracking Distribution in Depth Direction
In order to study the cracking distribution along depth direction, binary images were processed by a user-defined code []. As for the logic of the code, white pixels which represents crack regions were all numbered with value “1”, other regions were marked with value “0”. Therefore, by calculating the summation of each image slice matrix, the size of the crack region in each depth section can be determined. The results are shown in Figure 17.
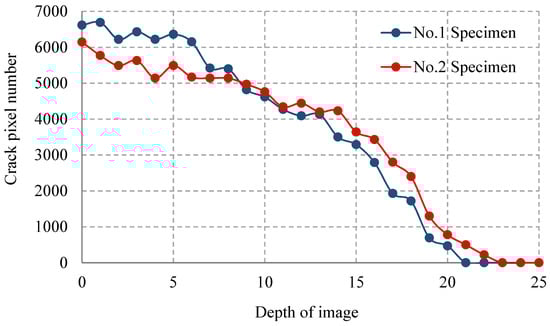
Figure 17.
Crack pixel number variation along specimen depth direction.
As shown in Figure 17, the number of cracking pixels decreased with the increase of depth. In the No.1 specimen, the fatigue crack disappeared completely below 20 mm depth. In the No.2 specimen, the depth at which the crack completely disappeared was 22 mm. Although cracks decreased as depth increased, there were still local fluctuations. For example, there were 6616 pixels at the surface of the No.1 specimen, but the pixel number on the adjacent section was 6690. This phenomenon indicates that the cracks in ECC specimens were not all propagated top-to-bottom. Some cracks might have been caused by the internal damage during the fatigue cracking process.
By comparing these two specimens, it could be seen that there were more cracks close to the top part of No. 1 specimen, while there were more cracks below a depth of 9 mm in the No. 2 specimen. By summing all the crack pixels in all of the image slices, the crack pixel amount in the No. 1 specimen was 91,821, while the amount in the No. 2 specimen was 91,125, as shown in Figure 18. These two values are very close, and the variation coefficient was only 0.538%. This phenomenon indicates that the fatigue test of the ECC pavement based on actual working conditions is reliable and effective. It is a scientific and reasonable technical means to identify cracks and analyze crack regions using DIP technology, and the crack image pixel statistical method was also a valuable way to evaluate the fatigue crack distribution in ECC.
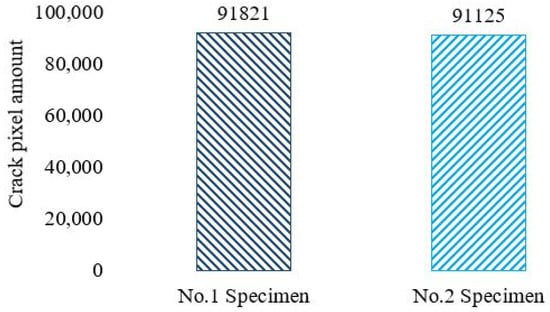
Figure 18.
Crack pixel amount in specimens.
Furthermore, more replicates needed to be scanned and analyzed to verify the reliability of the results on the cracking distribution. Also, based on the limited samples, this could hardly explain the mechanism of the cracking propagation of this fiber concrete within the OSBD pavement structure, so more samples with a different mix of design parameters, including fiber contents, mix methods and so on, need to be investigated.
5. Conclusions
In this study, fatigue cracking resistance of ECC under different stress ratios was first studied using the SCB test and DIC technology. Then fatigue cracking resistance of ECC under OSBD pavement working conditions was studied using the ITBF test, and CT and DIP technologies were applied to investigate the internal-crack distribution in ECC specimen. Some conclusions were obtained as follows:
- The ECC fatigue cracking propagation process can be divided into three stages, and the crack stable propagating stage (stage II) occupies the main proportion during the total fatigue fracture process. The fatigue fracture process tends to be ductile, indicating that the ECC has a strong working capability with existing cracks.
- Similar to asphalt mixtures, a logarithmic linear correlation between ECC fatigue cracking lives and stress ratios could be found and fatigue life prediction equation can be established based on this relationship.
- Under OSBD pavement working conditions, the fatigue cracking life of ECC is longer than EAC, presenting better fatigue cracking resistance. Besides, the fatigue cracking process of ECC is slow and tough, so it could keep the load-bearing capability of pavement even after cracks occurring, which is very beneficial in maintenance and repair work.
- Under OSBD pavement working conditions, multiple cracks propagate simultaneously in ECC instead of a single crack, while some cracks initiate and propagate from pavement inside, instead of top-to-bottom propagation.
Due to the excellent fatigue cracking resistance of ECC, the ITBF test takes too long. In this paper, only two specimens were tested in parallel. Similar research will be continued in the following study to expand the sample size.
Furthermore, because of the limited resolution of CT scanned images, it was difficult to observe the micro-cracks and fiber pull-out phenomenon in specimens. The subsequent plan is to carry out Scanning Electron Microscope (SEM) to scanning the fatigue cracked specimens. Combining the respective advantages of CT and SEM, the failure characteristics of specimens can be further analyzed.
Author Contributions
Conceptualization, Y.Z. and F.N.; Formal analysis, L.Z.; Funding acquisition, Y.Z.; Investigation, J.J.; Methodology, J.J.; Resources, F.N.; Supervision, L.Z.; Writing—original draft, J.J.; Writing—review & editing, Y.Z.
Funding
The authors gratefully acknowledge the support of the National Natural Science Foundation of China (NO. 51808115), Cyan and Blue Talent Training Project of the Colleges and Universities in Jiangsu Province, 333 High-Level Talent Training Project of Jiangsu Province, Nanjing Vocational Institute of Transport Technology Science Research Funding (JZ1802), Jiangsu Overseas Visiting Scholar Program for University Prominent Young & Middle-Aged Teachers and Presidents.
Conflicts of Interest
The authors declared no conflicts of interest.
References
- Kim, T.W.; Baek, J.; Lee, H.J.; Lee, S.Y. Effect of pavement design parameters on the behaviour of orthotropic steel bridge deck pavements under traffic loading. Int. J. Pavement Eng. 2014, 15, 471–482. [Google Scholar] [CrossRef]
- Chen, L.; Qian, Z.; Wang, J. Multiscale numerical modeling of steel bridge deck pavements considering vehicle-pavement interaction. Int. J. Geomech. 2016, 16, B4015002. [Google Scholar] [CrossRef]
- Wang, H.; Li, G. Study of factors influencing gussasphalt mixture performance. Constr. Build. Mater. 2015, 101, 193–200. [Google Scholar] [CrossRef]
- Yin, C.; Zhang, H.; Pan, Y. Cracking Mechanism and Repair Techniques of Epoxy Asphalt on Steel Bridge Deck Pavement. Transp. Res. Rec. J. Transp. Res. Board 2016, 2550, 123–130. [Google Scholar] [CrossRef]
- Jia, X.; Huang, B.; Chen, S.; Shi, D. Comparative investigation into field performance of steel bridge deck asphalt overlay systems. KSCE J. Civ. Eng. 2016, 20, 2755–2764. [Google Scholar] [CrossRef]
- Li, V.C. From micromechanics to structural engineering—The design of cementitious composites for civil engineering application. Journal of Structure. Mech. Earthq. Eng. 1993, 10, 37–48. [Google Scholar]
- Li, V.C.; Stang, H.; Krenchel, H. Micromechanics of crack bridging in fibre-reinforced concrete. Mater. Struct. 1993, 26, 486–494. [Google Scholar] [CrossRef]
- Li, V.C.; Leung, C.K.Y. Steady-state and multiple cracking of short random fiber composites. J. Eng. Mech. 1992, 118, 2246–2264. [Google Scholar] [CrossRef]
- Wang, S.; Li, V.C. Polyvinyl alcohol fiber reinforced engineered cementitious composites: Material design and performances. In Proceedings of the International Workshop on HPFRCC Structural Applications, Honolulu, HI, USA, 23–26 May 2005. [Google Scholar]
- Farhat, F.A.; Nicolaides, D.; Kanellopoulos, A.; Karihaloo, B.L. High performance fibre-reinforced cementitious composite (CARDIFRC)–Performance and application to retrofitting. Eng. Fract. Mech. 2007, 74, 151–167. [Google Scholar] [CrossRef]
- Şahmaran, M.; Lachemi, M.; Hossain, K.M.; Li, V.C. Internal curing of engineered cementitious composites for prevention of early age autogenous shrinkage cracking. Cem. Concr. Res. 2009, 39, 893–901. [Google Scholar] [CrossRef]
- Suthiwarapirak, P.; Matsumoto, T.; Kanda, T. Flexural fatigue failure characteristics of an engineered cementitious composite and polymer cement mortars. Doboku Gakkai Ronbunshu 2002, 2002, 121–134. [Google Scholar] [CrossRef]
- Qian, S.Z.; Zhou, J.; Schlangen, E. Influence of curing condition and precracking time on the self-healing behavior of engineered cementitious composites. Cem. Concr. Compos. 2010, 32, 686–693. [Google Scholar] [CrossRef]
- Siad, H.; Alyousif, A.; Keskin, O.K.; Keskin, S.B.; Lachemi, M.; Sahmaran, M.; Hossain, K.M.A. Influence of limestone powder on mechanical, physical and self-healing behavior of engineered cementitious composites. Constr. Build. Mater. 2015, 99, 1–10. [Google Scholar] [CrossRef]
- Zhang, Z.; Qian, S.; Ma, H. Investigating mechanical properties and self-healing behavior of micro-cracked ECC with different volume of fly ash. Constr. Build. Mater. 2014, 52, 17–23. [Google Scholar] [CrossRef]
- Yu, J.; Lin, J.; Zhang, Z.; Li, V.C. Mechanical performance of ECC with high-volume fly ash after sub-elevated temperatures. Constr. Build. Mater. 2015, 99, 82–89. [Google Scholar] [CrossRef]
- Qian, S.; Lepech, M.D.; Kim, Y.Y.; Li, V.C. Introduction of Transition Zone Design for Bridge Deck Link Slabs Using Ductile Concrete. ACI Struct. J. 2009, 106, 96–105. [Google Scholar]
- Li, V.C. Strategies for high performance fiber reinforced cementitious composites development. Fiber reinforced concrete: From theory to practice. In Proceedings of the North American/European Workshop on Advances in Fiber Reinforced Concrete, Bergemo, Italy, 24–25 September 2004; pp. 93–98. [Google Scholar]
- Kunieda, M.; Rokugo, K. Recent progress on HPFRCC in Japan. J. Adv. Concr. Technol. 2006, 4, 19–33. [Google Scholar] [CrossRef]
- Ma, H.; Qian, S.; Zhang, Z.; Lin, Z.; Li, V.C. Tailoring engineered cementitious composites with local ingredients. Constr. Build. Mater. 2015, 101, 584–595. [Google Scholar] [CrossRef]
- Jiang, J.; Ni, F.; Dong, Q.; Zhao, Y.; Xu, K. Fatigue damage model of stone matrix asphalt with polymer modified binder based on tensile strain evolution and residual strength degradation using digital image correlation methods. Measurement 2018, 123, 30–38. [Google Scholar] [CrossRef]
- Zhao, Y.; Jiang, L.; Zhou, L. Improvement of bending fatigue test for asphalt surfacing on orthotropic steel bridge deck. Adv. Civ. Eng. Mater. 2016, 5, 325–336. [Google Scholar] [CrossRef]
- Zelelew, H.M.; Almuntashri, A.; Agaian, S.; Papagiannakis, A.T. An improved image processing technique for asphalt concrete X-ray CT images. Road Mater. Pavement Des. 2013, 14, 341–359. [Google Scholar] [CrossRef]
- Gao, L.; Ni, F.; Luo, H.; Charmot, S. Characterization of air voids in cold in-place recycling mixtures using X-ray computed tomography. Constr. Build. Mater. 2015, 84, 429–436. [Google Scholar] [CrossRef]
- Jiang, J.; Zhang, Z.; Dong, Q.; Ni, F. Characterization and identification of asphalt mixtures based on Convolutional Neural Network methods using X-ray scanning images. Constr. Build. Mater. 2018, 174, 72–80. [Google Scholar] [CrossRef]
- Jiang, J.; Ni, F.; Dong, Q.; Yao, L.; Ma, X. Investigation of the internal structure change of two-layer asphalt mixtures during the wheel tracking test based on 2D image analysis. Constr. Build. Mater. 2019, 209, 66–76. [Google Scholar] [CrossRef]
© 2019 by the authors. Licensee MDPI, Basel, Switzerland. This article is an open access article distributed under the terms and conditions of the Creative Commons Attribution (CC BY) license (http://creativecommons.org/licenses/by/4.0/).