Article

Experimental Research on the Properties of Rock-Filled Concrete

1
Faculty of Electric Power Engineering, Kunming University of Science and Technology, No. 727 South Jingming Road, Chenggong District, Kunming 650500, China
2
College of Water Conservancy and Hydropower Engineering, Hohai University, Nanjing 210098, China
*
Author to whom correspondence should be addressed.
Appl. Sci. 2019, 9(18), 3767; https://doi.org/10.3390/app9183767
Submission received: 30 June 2019 / Revised: 18 August 2019 / Accepted: 26 August 2019 / Published: 9 September 2019

Abstract

:
In order to comprehensively evaluate the properties of rock-filled concrete (RFC) with the strength of C15, lab experimental test and in-situ test are applied to explore the mechanical, hydraulic, ultrasonic characteristics of RFC in Hantang reservoir dam. Four types of defects within RFC are shown from the appearance of borehole cores specimens: (1) large sized voids existing in interfacial transition zone (ITZ) between self-compacting concrete (SCC) and rock block (RB); (2) bad cohesion in ITZ; (3) joints within rock block; (4) voids within SCC. For hydraulic aspects, the average porosity of RFC is 14.10%; the permeability rate of RFC ranges from 2.41 Lu to 10.41 Lu, with the average of 11.32 Lu, occasionally more than 25.52 Lu due to interconnected defects. For ultrasonic aspects, the ultrasonic velocity of RFC conforms to lognormal distribution, with the average of 2993.3 m/s and standard deviation of 650.5 m/s. For mechanical aspects, the average cubic compressive strength of RFC is 22.55 Mpa, with the standard deviation of 4.09 Mp. Thus the data shows a relatively great dispersion due to uneven distribution of some defects in RFC, which deteriorate the quality of RFC. Through the experimental investigation, it is shown that the quality of massive RFC in the Hantang dam is obviously non-homogeneous, mainly influenced by construction technology.

1. Introduction

Rock-filled concrete (RFC) is a new form of massive concrete with enough integrity, density, lower heat of hydration. It is formed by self-compacted concrete (SCC), with properties of good fluidity and anti-separation, filling into voids of filled rock through its self-weighty, without any need for vibrating compaction [1,2,3]. By comparison with common massive concrete, cement consumption of RFC is quite low, but its content of rock block (RB) is very high, which can dramatically reduce construction cost, remarkably shorten construction period, and improve construction efficiency as well [4]. Thus, RFC not only takes full advantage of low heat of hydration of SCC, but also makes the best of high strength of rock block [2,4,5]. In spite of a lower cement consumption, RFC has relatively high compressive strength, and was widely applied in hydraulic engineering in China for more than 60 newly constructed RFC dams [3], such as the Baoquan pumped storage power station (height of dam 36.90 m, completion date 2006/4), the Qingyu reservoir dam (height of dam 42.30 m, completion date 2012/11), the Hutiaoxia reservoir (height of dam 55.00 m, completion date 2013/5), the Sangwan reservoir (height of dam 16.96 m, completion date 2011/9), the Koushang reservoir (height of dam 58.40 m, completion date 2013/9), as well as dam reinforcement projects, for example, the Hengshan reservoir dam risk removal and reinforcing project in Shanxi Province in 2010 [6].
The quality of RFC is mainly influenced by SCC, rock block, interfacial transition zone (ITZ) between SCC and rock block, so it is quite difficult to control the quality of RFC. How to control quality of RFC has become a key subject in RFC projects, and has attracted the attention of many researchers. At present, research on the properties of RFC mainly focus on the mix proportions of SCC [6,7,8,9,10,11], and properties of ITZ [12,13,14,15,16,17]. Reasonable mix proportions of SCC, a key factor to guarantee SCC with high fluidity and good segregation resistance, and the performance of ITZ in RFC, have been widely researched by many scholars and engineers for decades. For example, the distribution law of porosity in ITZ [18,19], the thickness of ITZ [12], the effects of ITZ on permeability and compressive strength [20], as well as elastic modulus of concrete [13], have been intensively studied, which has greatly boosted the development of RFC technology; but there remain some questions to be solved in this field. Because these studies are based on lab experiments, where the size, shape of rock block and the thickness of casting layer are quite different to actual projects, the decrease of rock block size will certainly influence the properties of RFC. The diameter of the rock block chosen was 150~200 mm by Shi [5], and 53~75 mm by Wang [15], while it may be up to 1 m in actual projects. It is well known that some concaves indentations on the surface of rock blocks and fractures within rock blocks decrease gradually as the size of rock blocks decreases; as a result RFC specimens in the lab cannot entirely represent the performance of RFC in actual projects. Especially, large sized rock blocks used in projects whose shape and joints are very difficult to control in construction will result in the formation of sealed spaces in the process of rock block piling, which can cause non-uniform RFC properties, with obvious and centralized defects, compared to lab RFC. Aside from the difference of rock block grade between the lab and actual projects, there exist many discrepancies, such as construction conditions, situation conditions, and worker experience, which can inevitably result in distinct deviations of RFC performance in actual projects. Unfortunately, research on this subject is scarce, and we do not know the performance differences of RFC produced in the lab and actual projects. In this study, in order to compensate for the disadvantages in lab experiment, in-situ tests, in combination with lab experiments, were applied to explore the mechanical, hydraulic, ultrasonic characteristics of RFC with the strength of C15, and provide a basis for comprehensive evaluation of RFC. In-situ tests employed in this study include drilling on a dam body, water pressure tests and ultrasonic tests in boreholes, which were strictly conducted based on the “Test code for hydraulic concrete (SL352-2006)” issued by the Ministry of Water Resources of the P.R.C.

2. Design for Mix Proportion of RFC and Construction Technology

The Hantang reservoir project is a comprehensive hydraulic project for irrigation, water supply for villages and flood control, with storage capacity of 1.27 × 10⁶ m3, a maximum height of 43.8 m, a dam axis length of 93.5 m, and a dam crest width of 6.0 m. The elevation of the dam crest is 480.80 m, its nominal storage level is 475.65 m, and its designed flood level is 479.24 m. The dam is divided into sections, from the right bank to the left bank, which are section No. 1 with 18.0 m length, section No. 2 with 19.0 m length, section No. 3 with 17.0 m length, section No. 4 with 18.0 m length, and section No. 5 with 21.5 m length. Section No. 3 which is also used to overflow, is usually called the overflow section.

2.1. Mix Proportion of SCC and Materials

Except for the impermeable facing slab on the upstream of dam and the overflow surface, other parts of dam are cast by RFC with C15. Before the casting process, the quality of self-compacting concrete (SCC) must be strictly tested. According to the design requirements, the mix proportion of special self-compacting concrete should satisfy the requirements of C15W6. The grade of coarse aggregate in SCC is continuously distributed from 5 mm to 20 mm. The theoretical mix proportion of SCC is cement 209 kg, fly ash 345 kg, water 214 kg, sand 857 kg, stone 605 kg, admixture I (R218A4) 8.94 kg, admixture II (N) 0.42 kg, admixture III (HSI) 0.85 kg, the air 2.9% in per cubic meter. According to the working performance requirements of SCC, the slump of SCC is set around 250~280 mm, slump flow (SF) is set around 630–750 mm, V funnel (VF) time is around 7~25 s The rock block must be fresh and hard, which size should only range from 30 cm to 100 cm, silt content less than 0.5%, compressive strength should be more than 40 Mpa, density should range from 2.5 g/cm3 to 2.76 g/cm3. The content of rock block should be 55%. General type RFC construction technology is employed, and the thickness of each lift of RFC is 1.8~2.0 m.

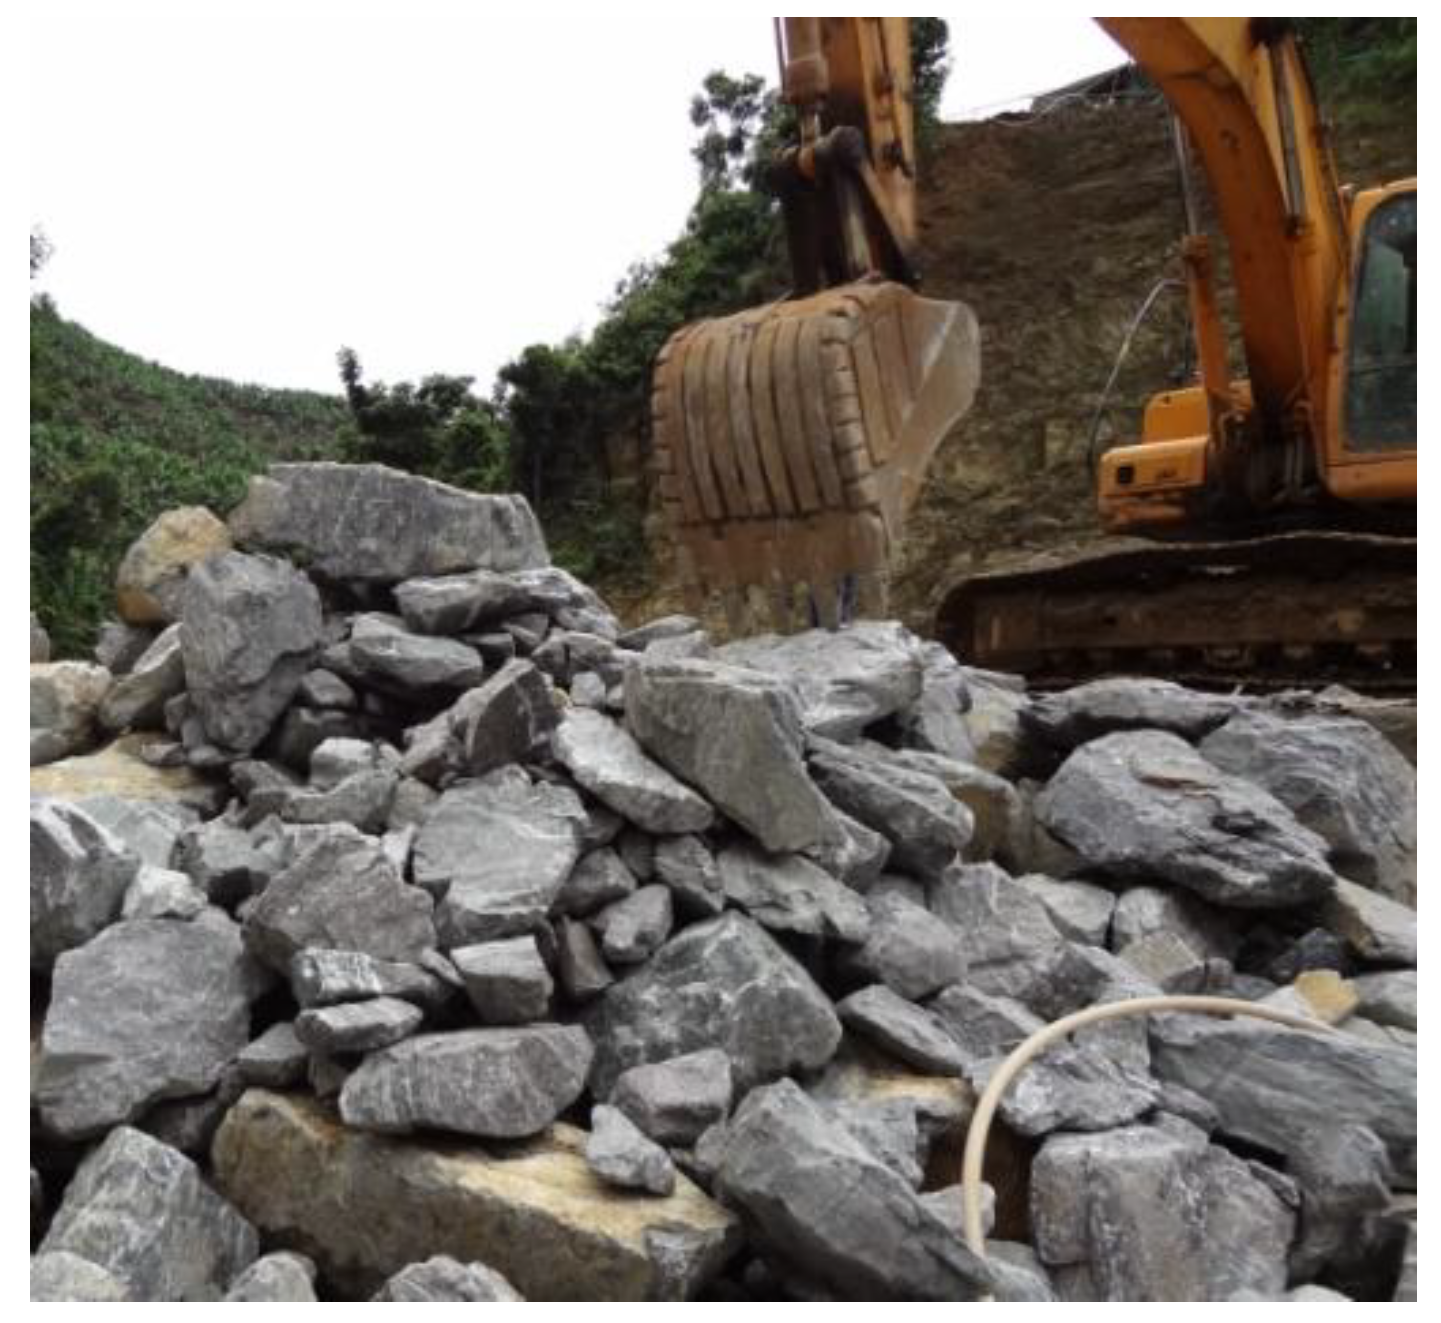
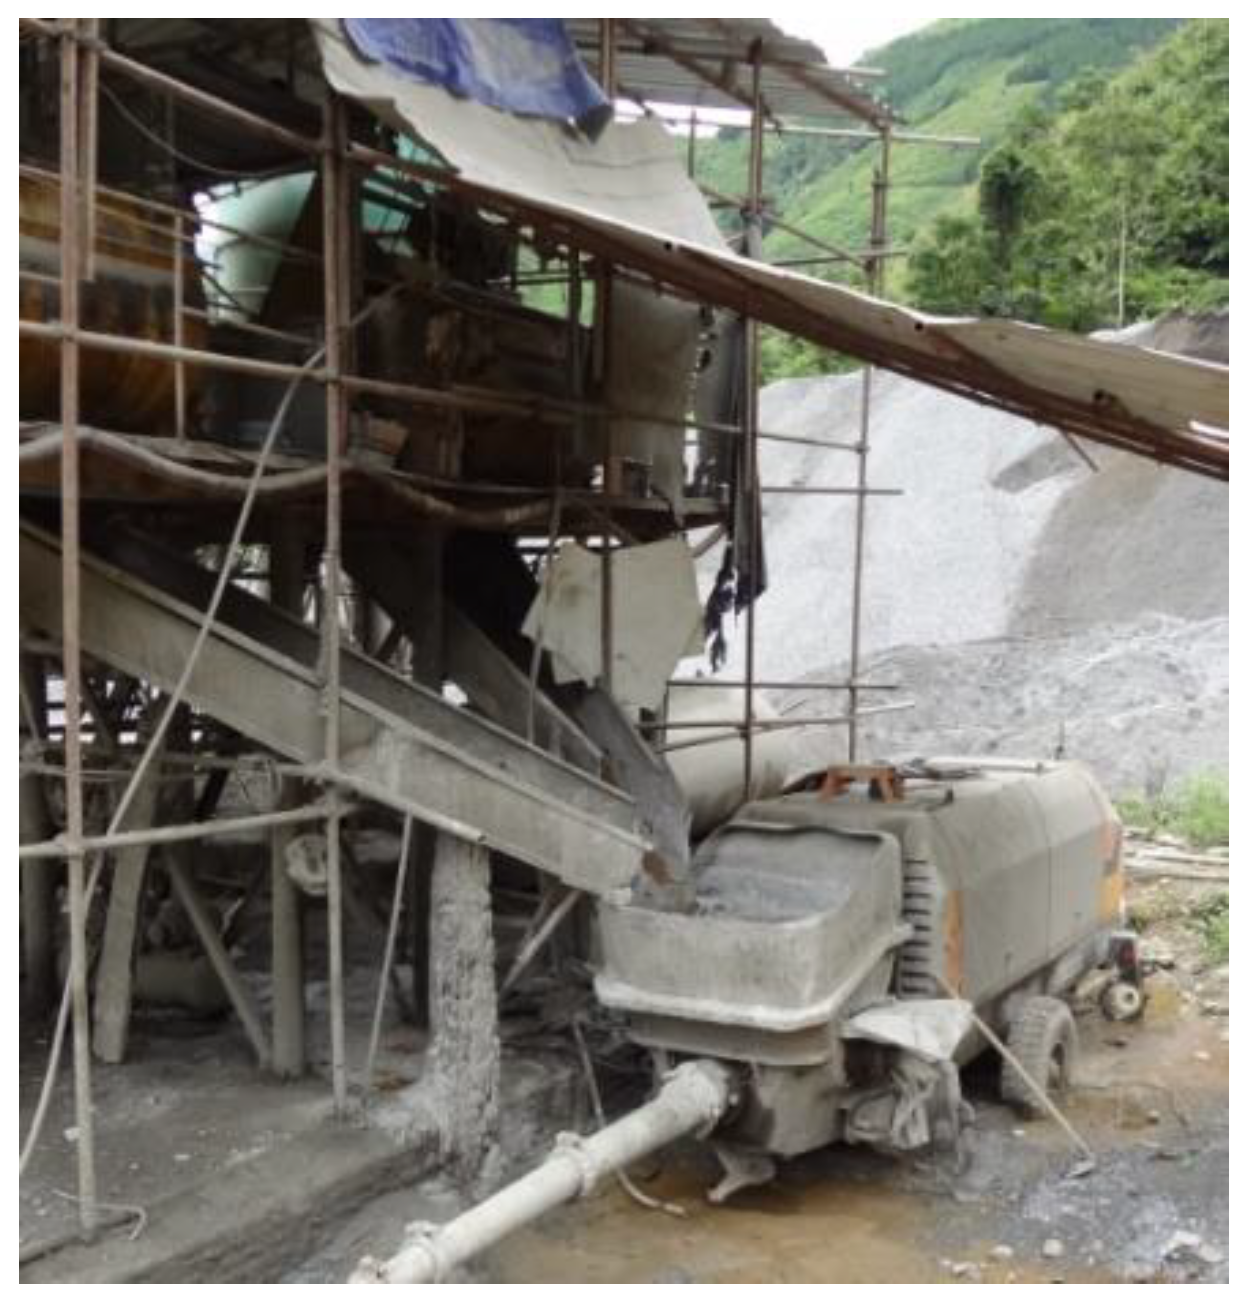
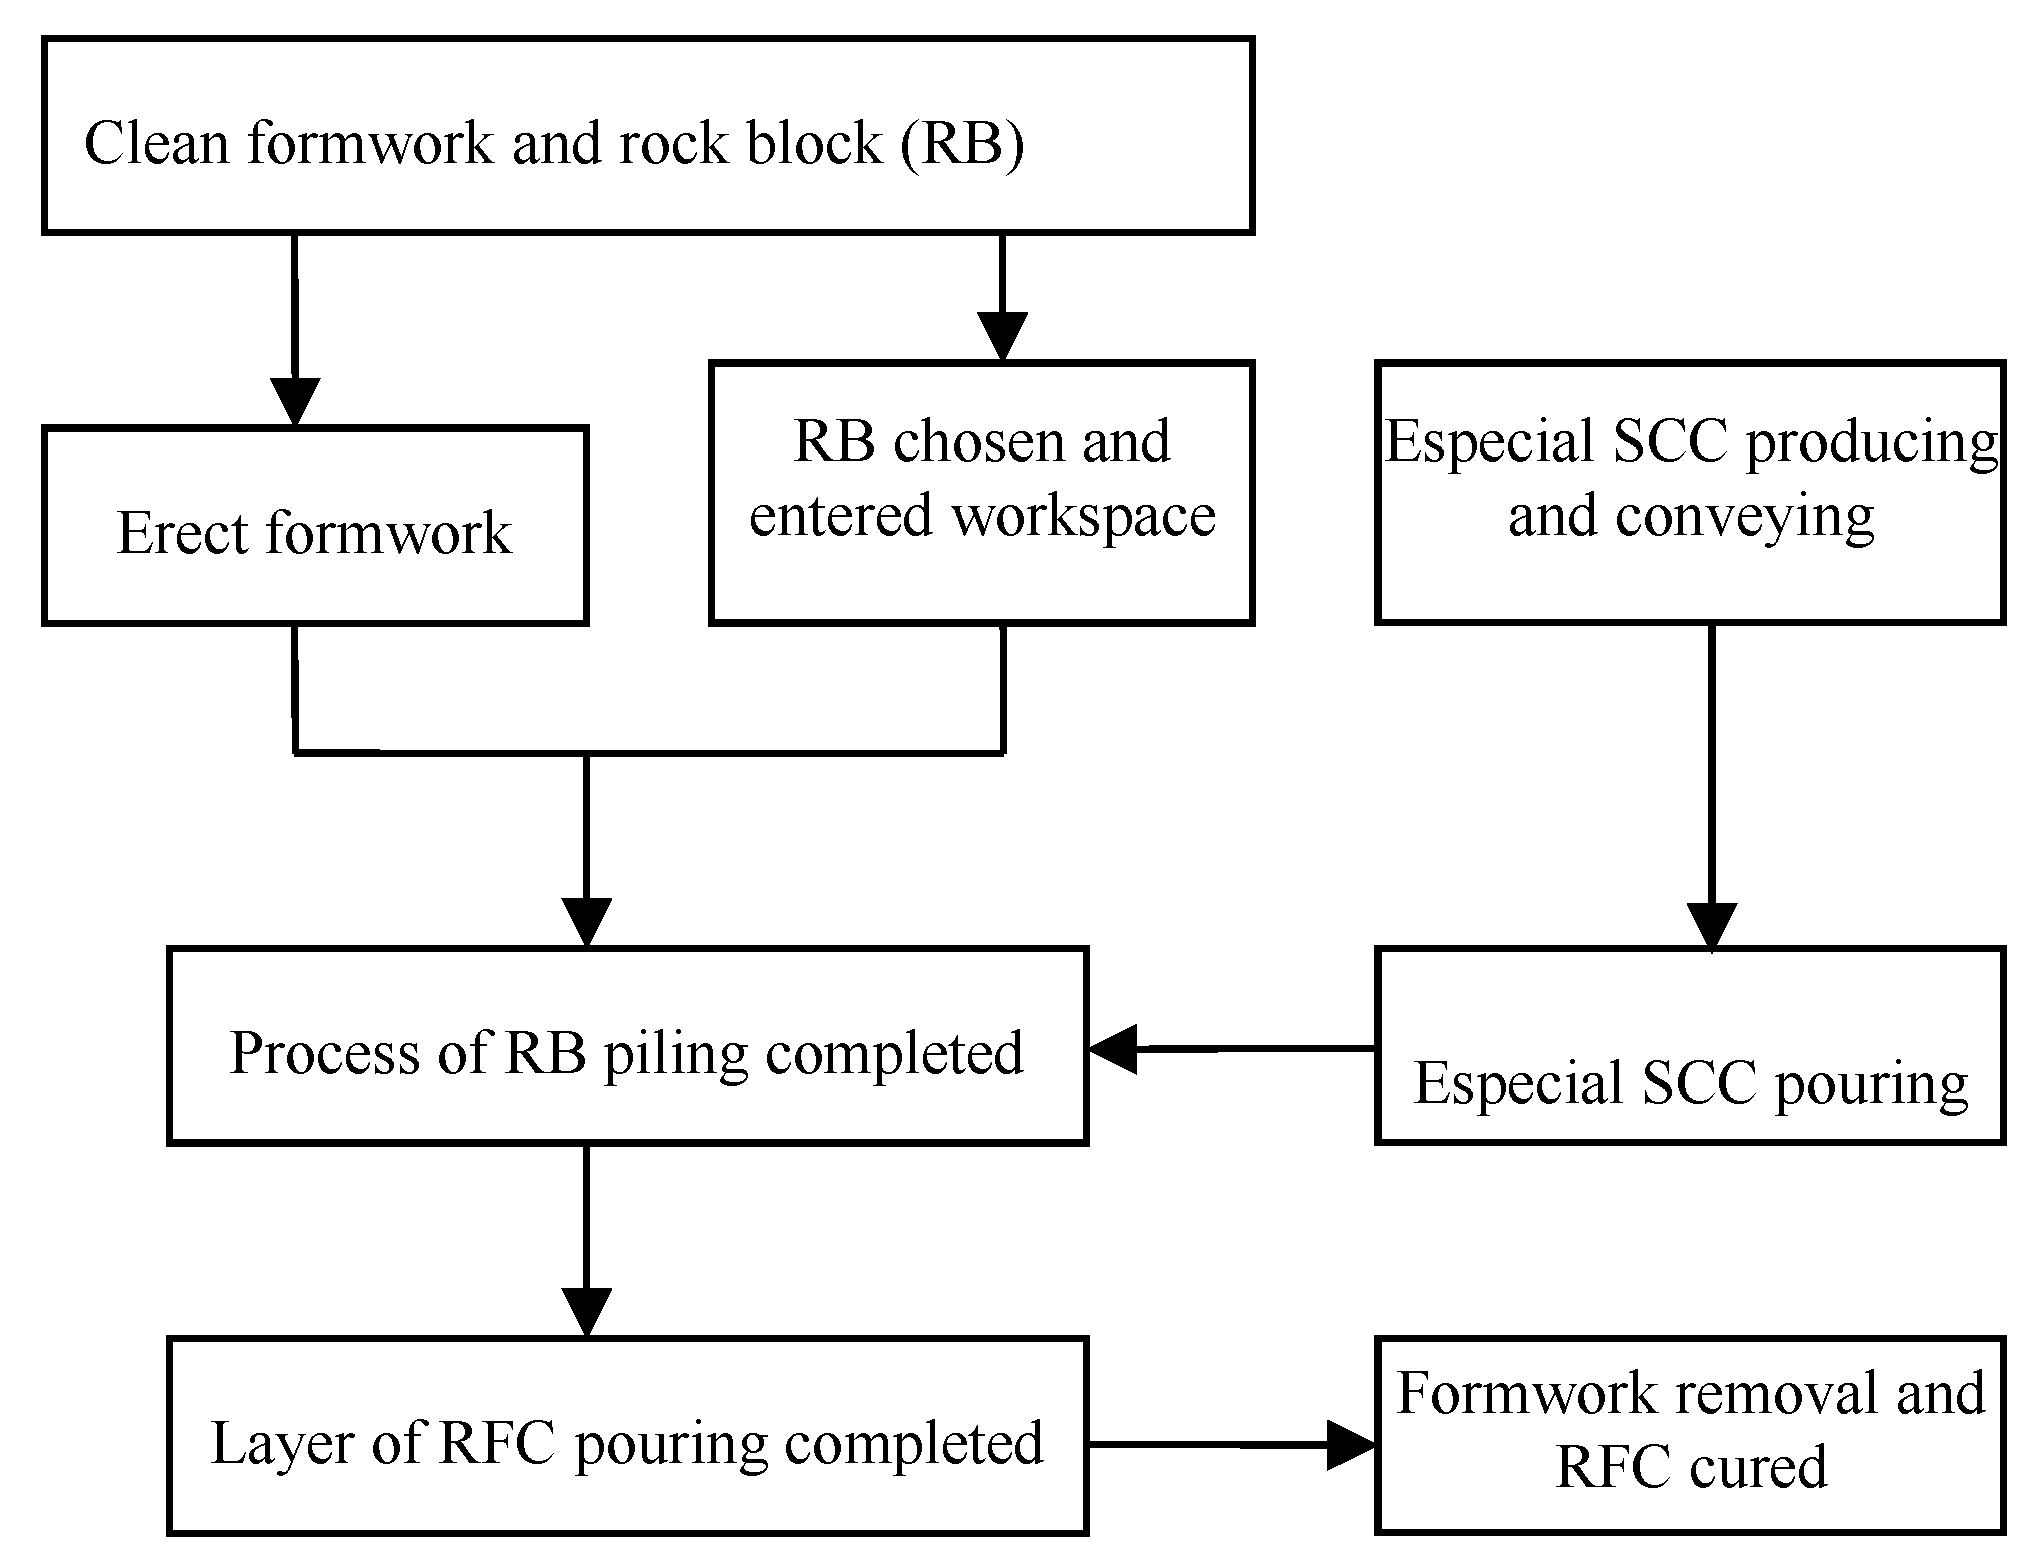
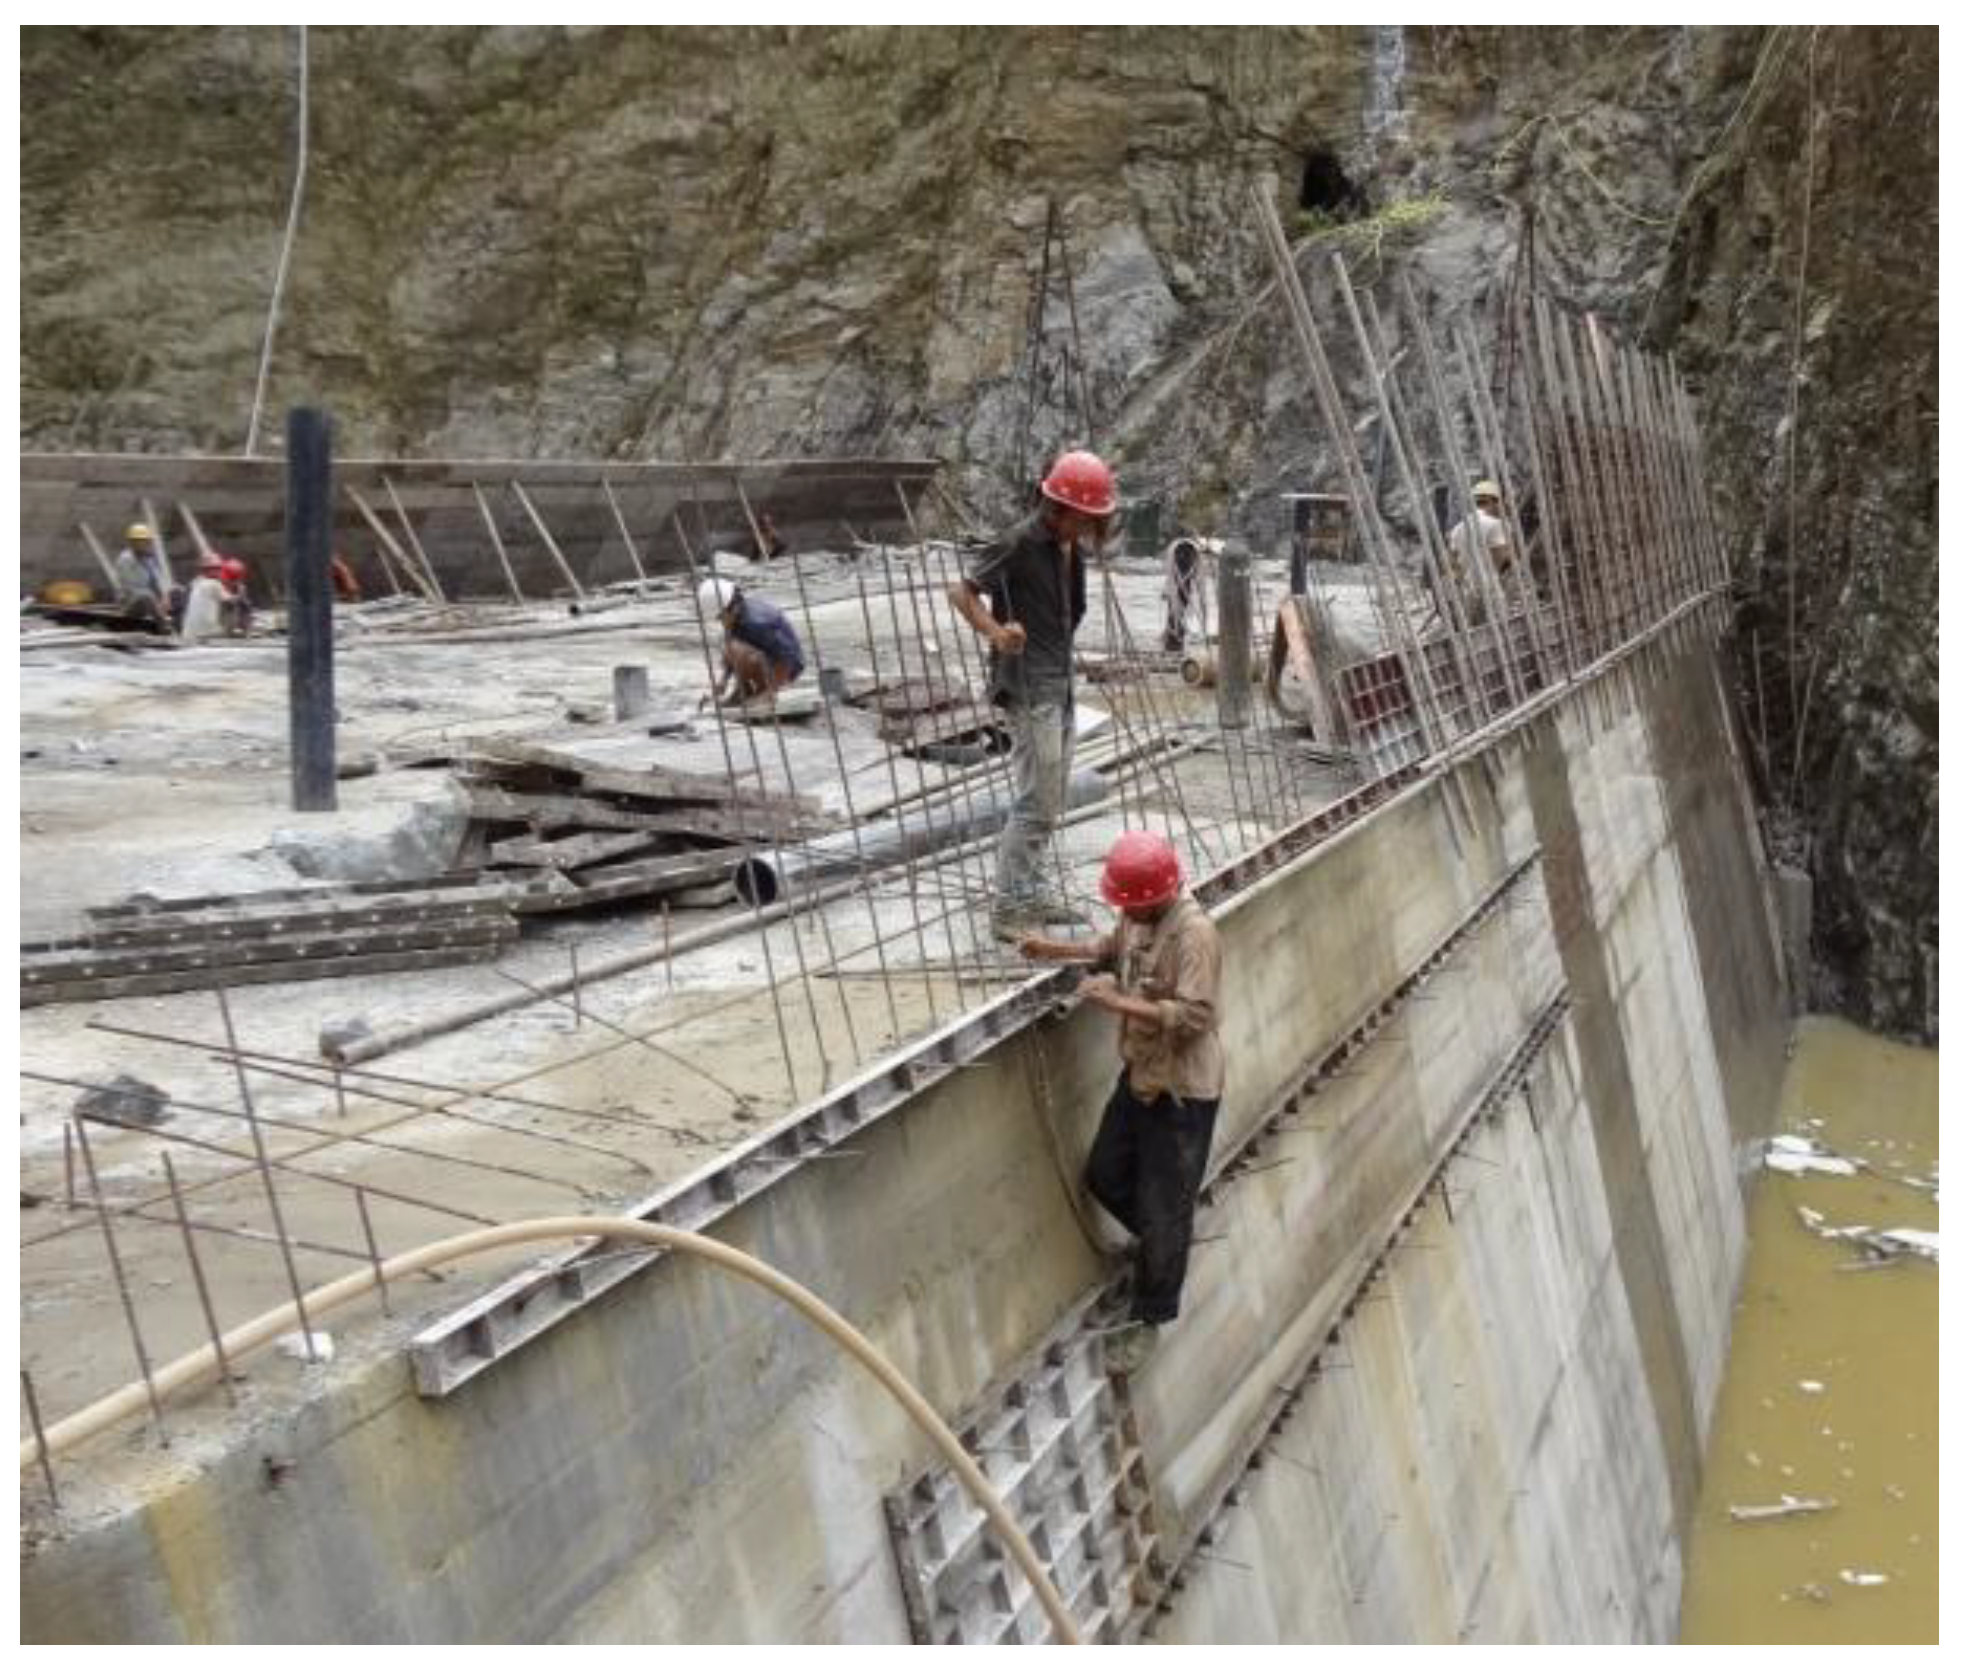
2.2. Construction Technology of RFC

First, clean RFC has no mud and no broken stone slag; then formworks with good closeness are erected, whose surface should be clean and plain, and whose rigidity and stability should be enough. Rock blocks are transported by dump track. Before rock blocks are placed into the formworks, they should be cleaned to guarantee that the silt content on the surface is not more than the standard; then they are pushed into workspace by a bulldozer, and be rearranged by excavators or persons for more compactness, as shown in Figure 1. SCC is produced in the mixing plant at the construction site, and pumped into workspace by a concrete bump, as shown in Figure 2. The thickness of each casting layer of RFC is 1.8~2.0 m, and it should be cured for 14 d. The flow chart of RFC construction is shown in Figure 3. Part of the cast dam body using RFC is shown in Figure 4. All safety measures throughout dam construction are strictly followed based on “Code for design of occupational safety and health of water resources and hydropower projects (GB 50706-2011)” [21], so as to ensure workers’ safety.

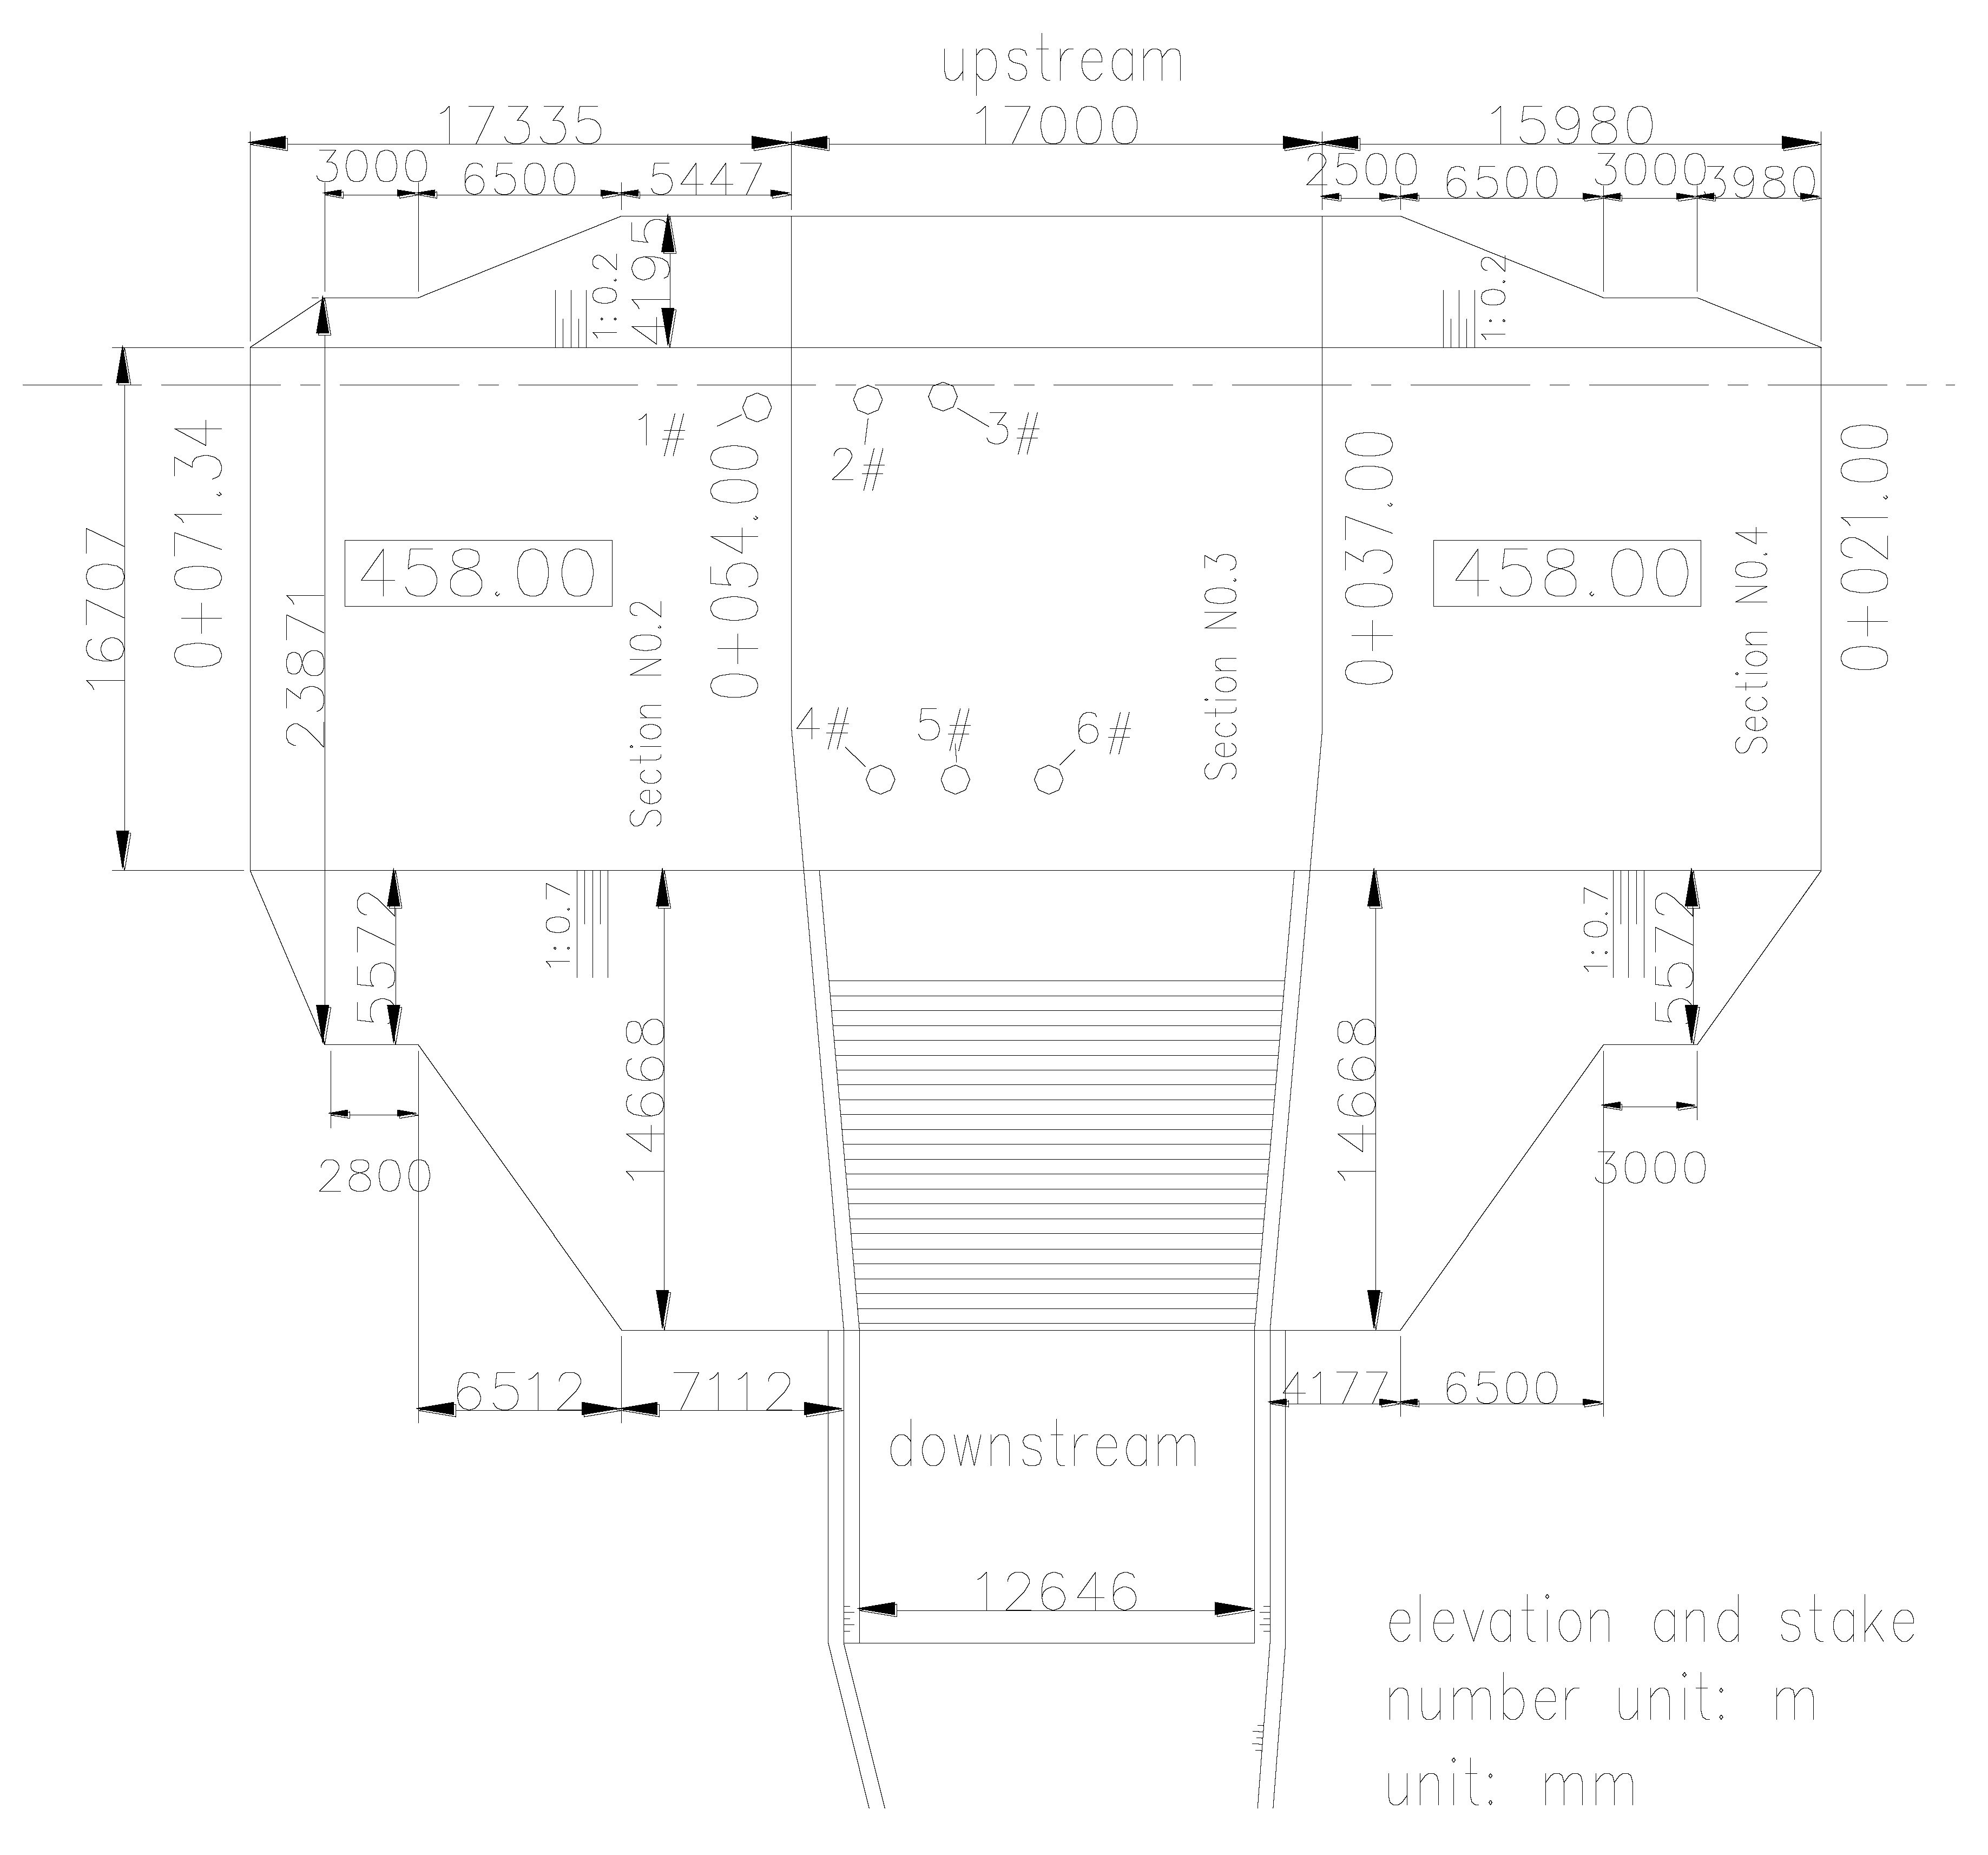
3. Experimental Tests for the Properties of Rock-Filled Concrete

In order to adequately investigate the qualities of cast RFC, we drilled six holes (i.e., Nos. 1, 2, 3, 4, 5, 6) in section No. 2 and section No. 3, when casting to a dam height of 21.0 m at an elevation of 458.00 m, and each borehole had a diameter of 110 mm for the requirements of the compressive tests. The depth of each borehole is 15.0 m, slightly less than distance between the grouting gallery roof and the poured dam top, and exactly equal to the total length of three test sections in the water pressure test (5 m per test section required by “Specification for rock tests in water conservancy and hydroelectric engineering (SL264-2001)”. The layout of the boreholes is shown in Figure 5.
With six boreholes and extracted specimens, five types of experimental tests are conducted to investigate the properties of RFC, so results gained in different tests can be complementary to each other and serve as mutual verification. The appearance of RFC core specimens is used to check macroscopic defects in RFC by eye. Tests of porosity of RFC, water pressure and ultrasonic are applied to indirectly examine the uniformity and density of RFC. Compressive tests are used to explore the mechanical behavior of RFC directly.

3.1. Appearance of RFC Core Specimens

The determination of the appearance of RFC core specimens is conducted following the specification for construction of hydraulic RCC (DL/T 5112-2009) (The National Energy Administration of the P.R.C., 2009) [22]. According to the appearance of the core specimens, it is found that the surface of most core specimens is smooth, the structure is dense, aggregate distribution uniform, and fine cohesion of self-compacting concrete with rock block is seen, but there also exist many local defects, such as large sized voids, fractures, mud, etc. in ITZ. According to the distribution of defects, the defects in RFC can be mainly divided into four types, as shown in Table 1. Some large defects can be detected by drilling holes in the dam, which cannot be found in RFC poured in lab [1,2,4], due to the different construction technology used in the lab and actual projects. It goes without saying that those large defects can have a great effect on quality of RFC. According to our analysis, those defects in cores mainly form during the process of pouring SCC, but also be influenced by drill rod vibrations during drilling, but it is very difficult to distinguish between them.

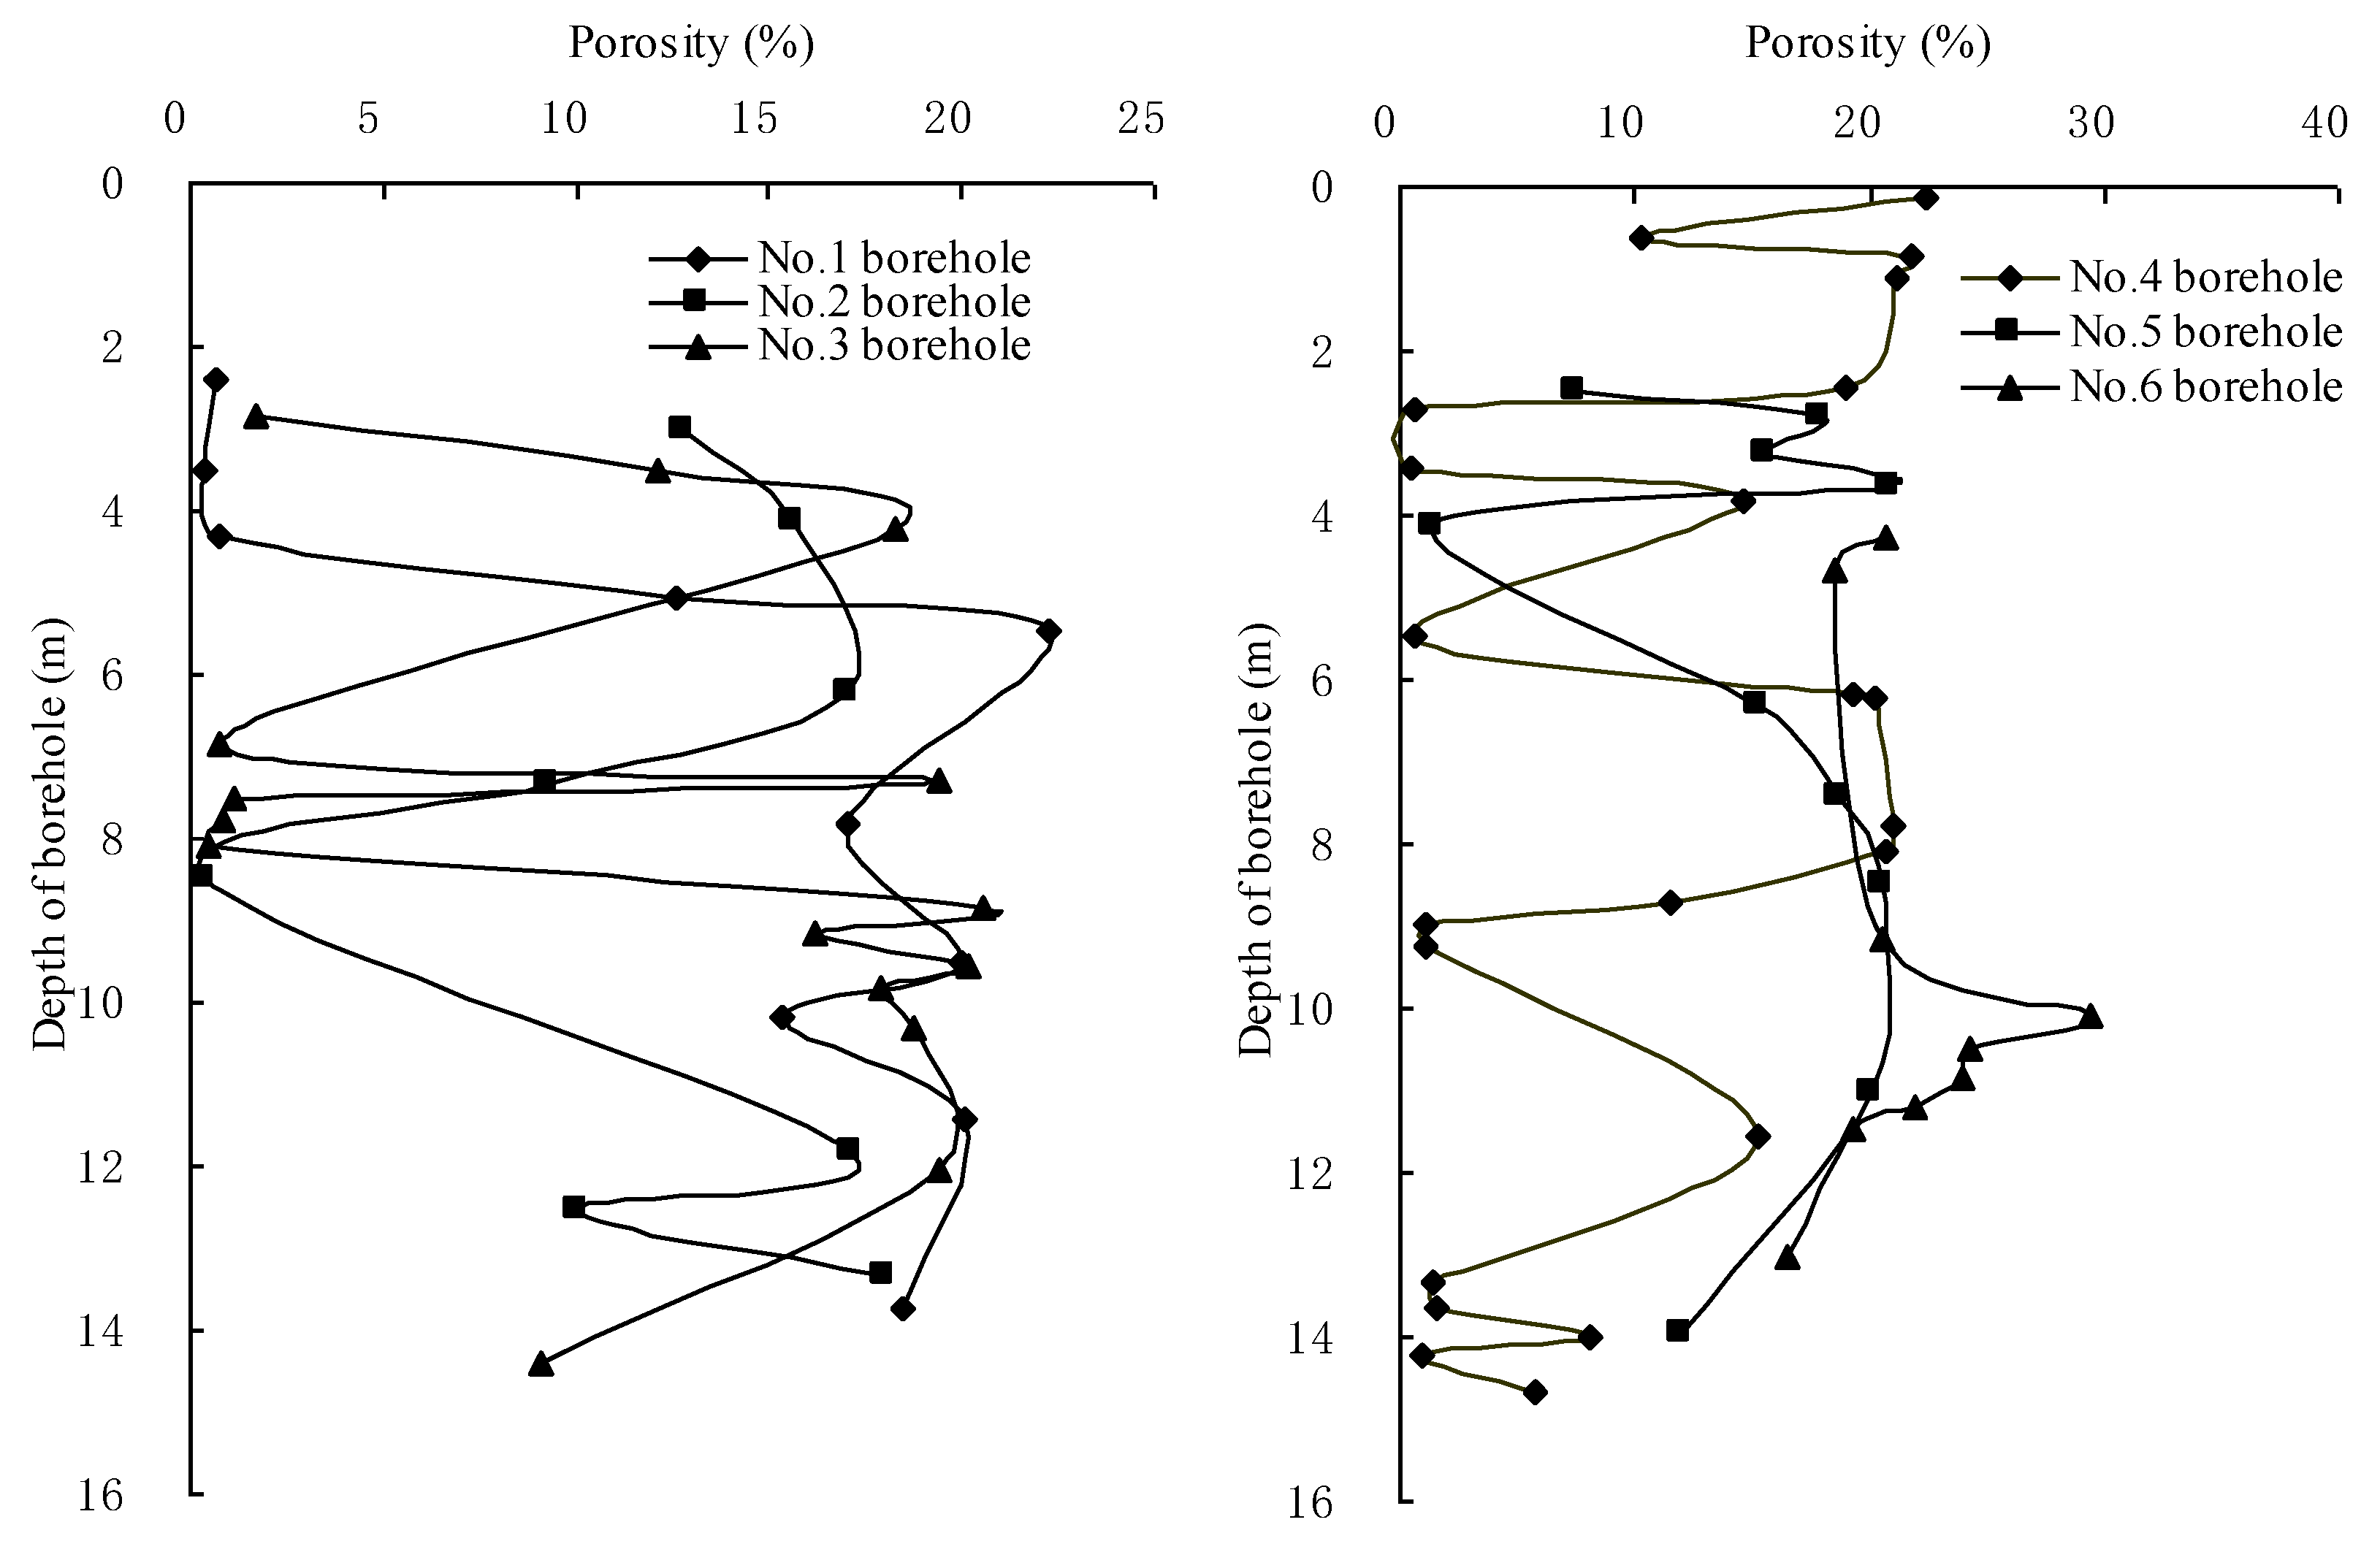
3.2. Porosity of Rock-Filled Concrete

According to the appearance of core specimens, there exist some obvious defects within RFC, so it is necessary to measure the porosity of RFC. For reasonable results, test specimens should be representative, with neither too many nor too few voids or defects on the core surface. Meanwhile, in order to fully know the distribution of voids of RFC in different part, we collect the specimens every few meters along the depth. The measurement of porosity of RFC is made by a drying method. The main instruments include an electronic balance with accuracy of 0.01 g, water container, drying box, etc. The main steps are as follows: first, specimens are dehydrated by placing them into an oven under a temperature of 105~110 °C for 24 h, and the specimens are weighed after cooling to room temperature; then immersed in methanol for 12 h to saturation, and the saturation specimen weight and specimen buoyant weight when submerged in methanol are measured, finally the porosity of specimens is calculated [23,24,25]. The relationship between the porosity of RFC core specimens and depth is shown in Figure 6.
As seen in Figure 6, the porosity of core specimens ranges from 0.34% to 22.37%, with great variation, which shows that the distribution of porosity is uneven, and some large voids exist in RFC. The average porosity of RFC in boreholes No. 1~6 was 12.74%, 12.53%, 11.78%, 12.53%, 14.97%, 21.71% respectively, with a total average porosity of 14.10%. A large porosity can indicate that the density of RFC is poor with a relatively loose structure and some defects in the area. The porosity of RFC obtained in our tests is larger than that stated by Jin et al. [3], the core specimens in our tests were extracted along the dam height with some from the inner dam, hence the quality is difficult to control, compared with RFC samples gathered from the surface layer of poured RFC by trenching in Jin’s test [3]. The porosity of RFC fluctuates with depth, which reveals the density of RFC changed, as the quality of RFC at the surface layer of the workspace is good, whereas at the bottom layer it is relatively bad. Likewise, the porosity data show a great dispersion, indicating obvious non-homogeneity of the RFC with some uneven defects.

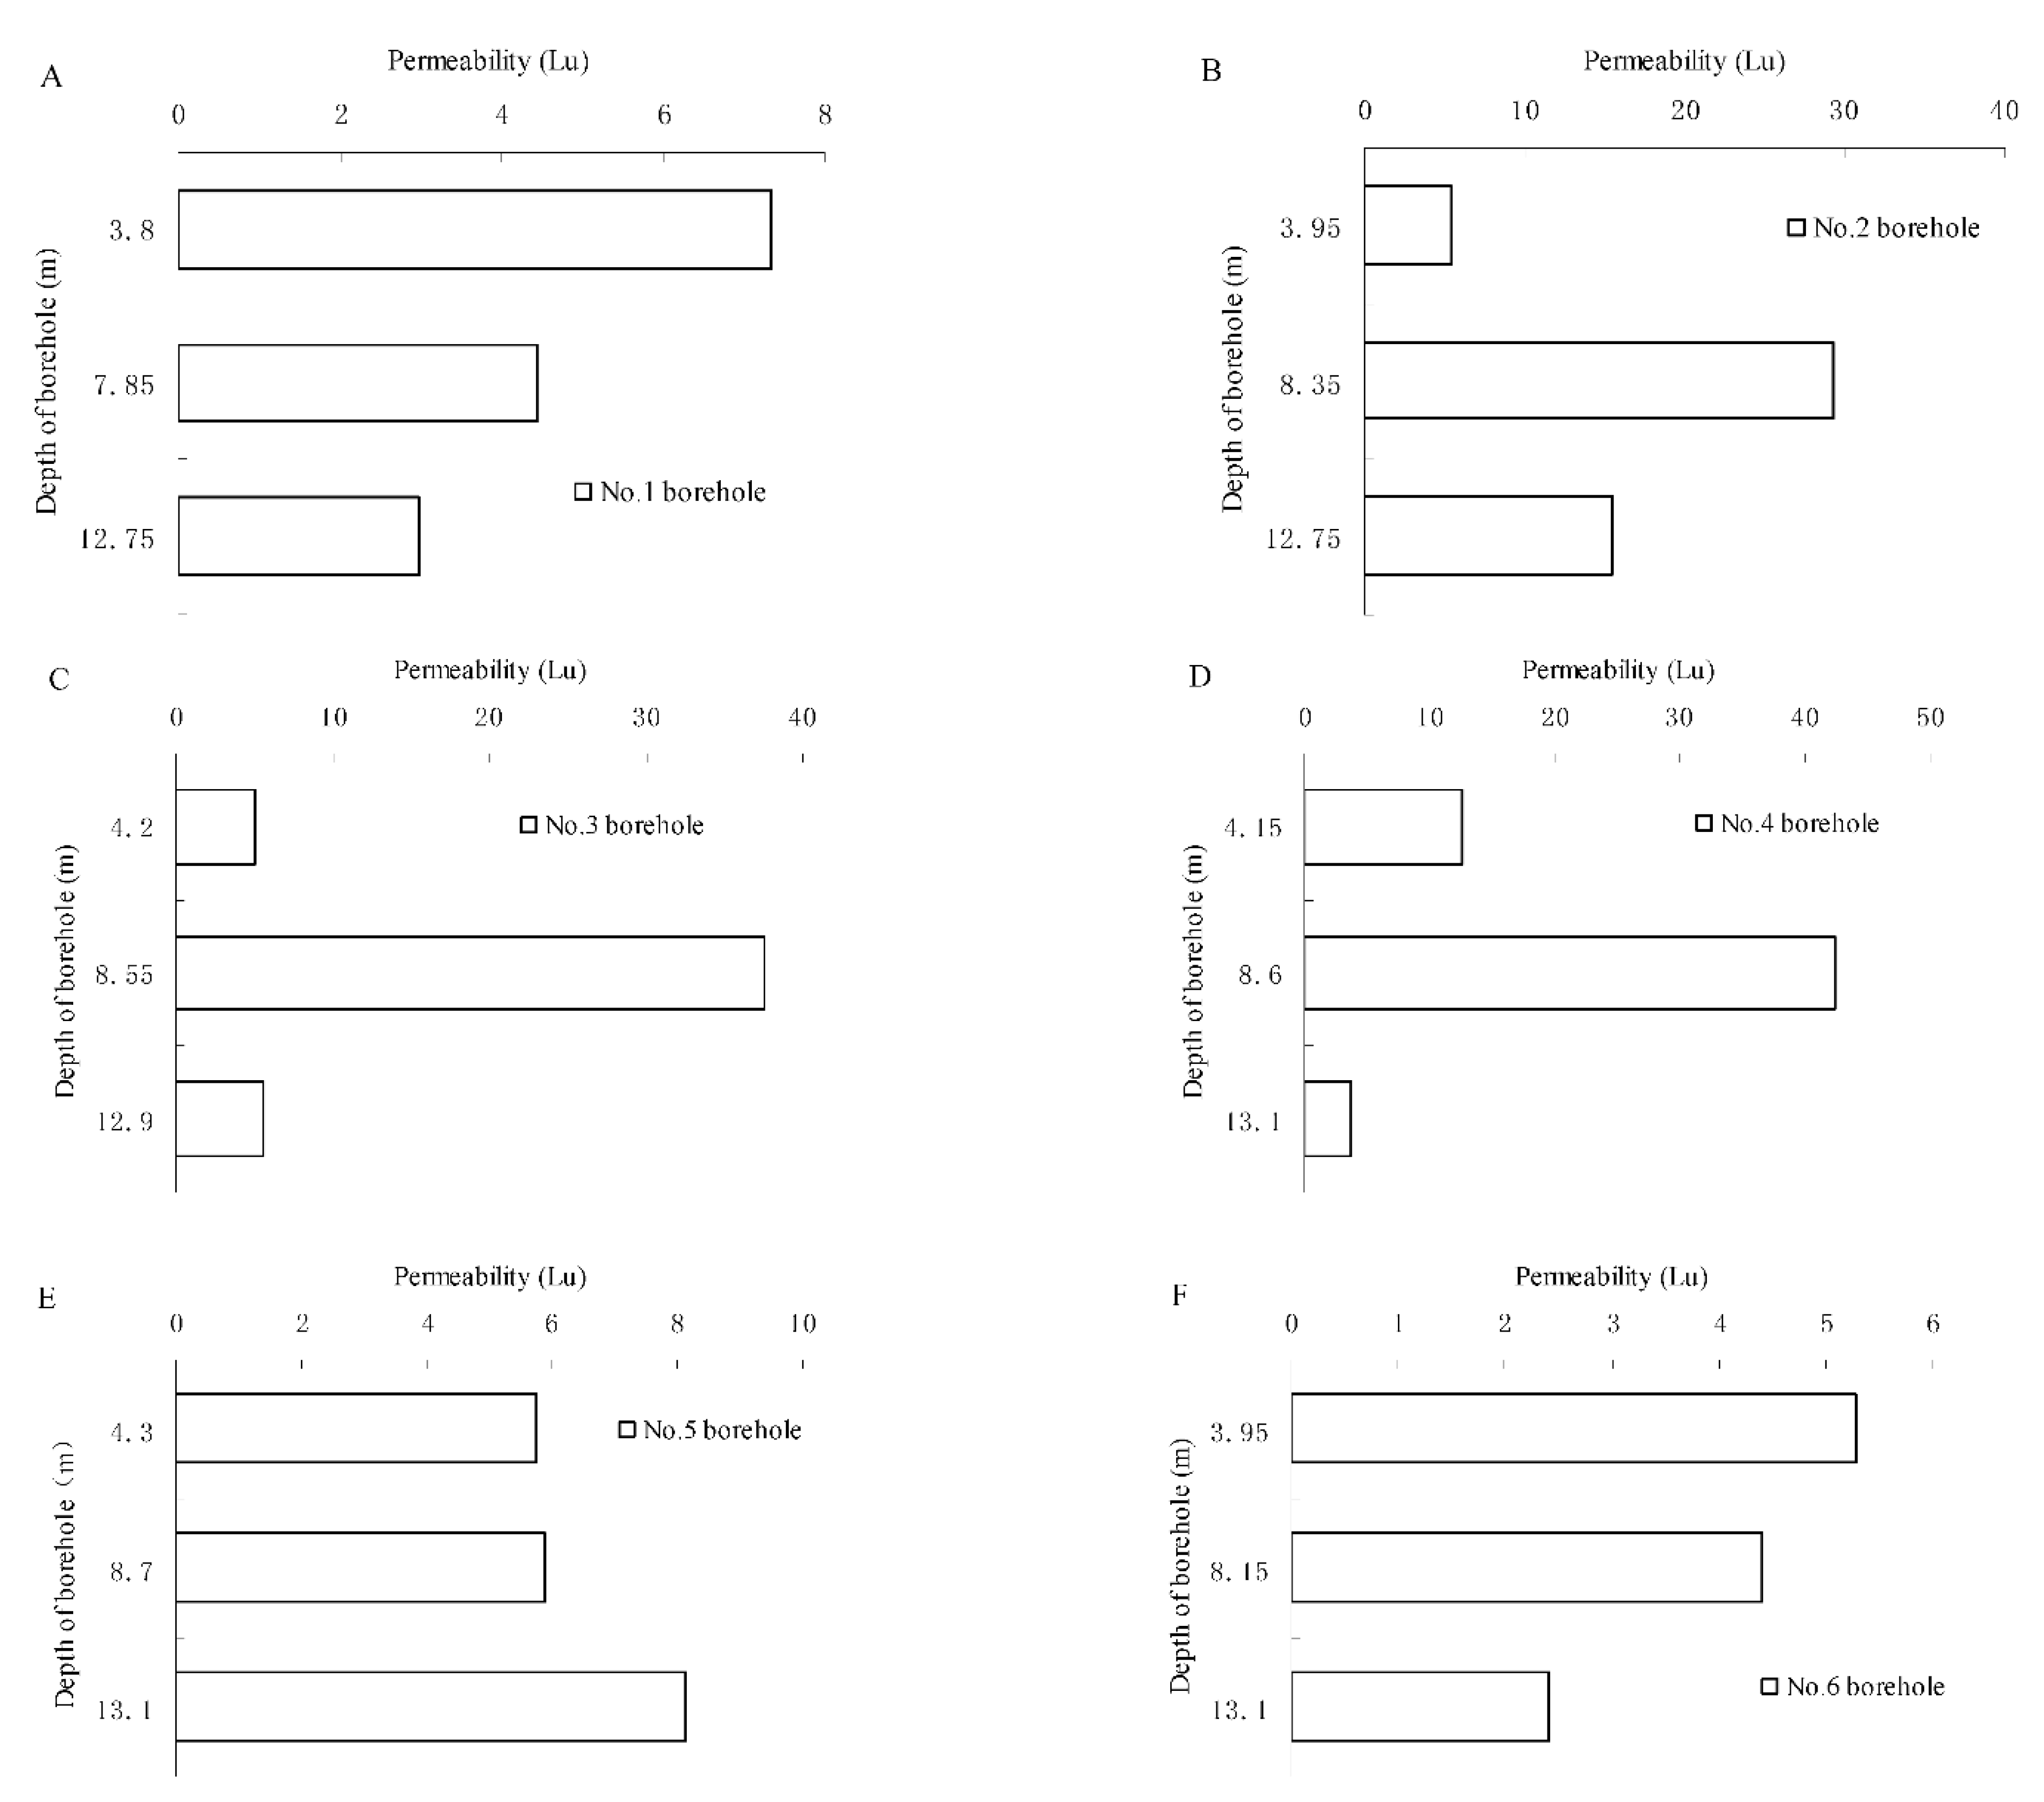
3.3. Water Pressure Test

According to the “Design specification for concrete gravity dams (SL319-2005)” issued by the Ministry of Water Resources, the permeability of RFC should be tested by permeability tests, but representative specimens are very difficult to choose, due to the large defects contained in RFC, consequently a water pressure test is applied to measure the permeability of RFC. Meanwhile, the uniformity and density of RFC can be also explored indirectly. The water pressure test was conducted in the borehole, in accordance with “Code of water pressure test in borehole for water resources and hydropower engineering (SL31-2003)” (Ministry of Water Resources of the P.R.C. 2003) [26]. The permeability rate of boreholes changed with the depth, which is shown in Figure 7 by a histogram.
From the pressure water tests in six boreholes shown in Figure 7, the permeability rate of RFC is 2.41~42.39 Lu, with a wide fluctuation, especially the permeability rate change in boreholes Nos. 2, 3, 4 is particularly significant, but in boreholes Nos.1, 5, 6 the change is not obvious. Through statistical analysis, the average permeable rate of RFC is 11.32 Lu, with a standard deviation of 12.20 Lu. The permeability rate of the dam is mainly distributed between 2.41~10.41 Lu, but at the depth of 6.3 m~10.9 m in boreholes Nos. 2, 3, 4, the permeability rate of the dam is more than 25.52 Lu, which indicates that there exists some penetrating fractures in some places within the dam body, such as good interconnected interfaces or no dense construction pouring joint, causing dam to display relatively high permeability. The permeability data also shows a high dispersion, indicating obvious non-homogeneity of the RFC.

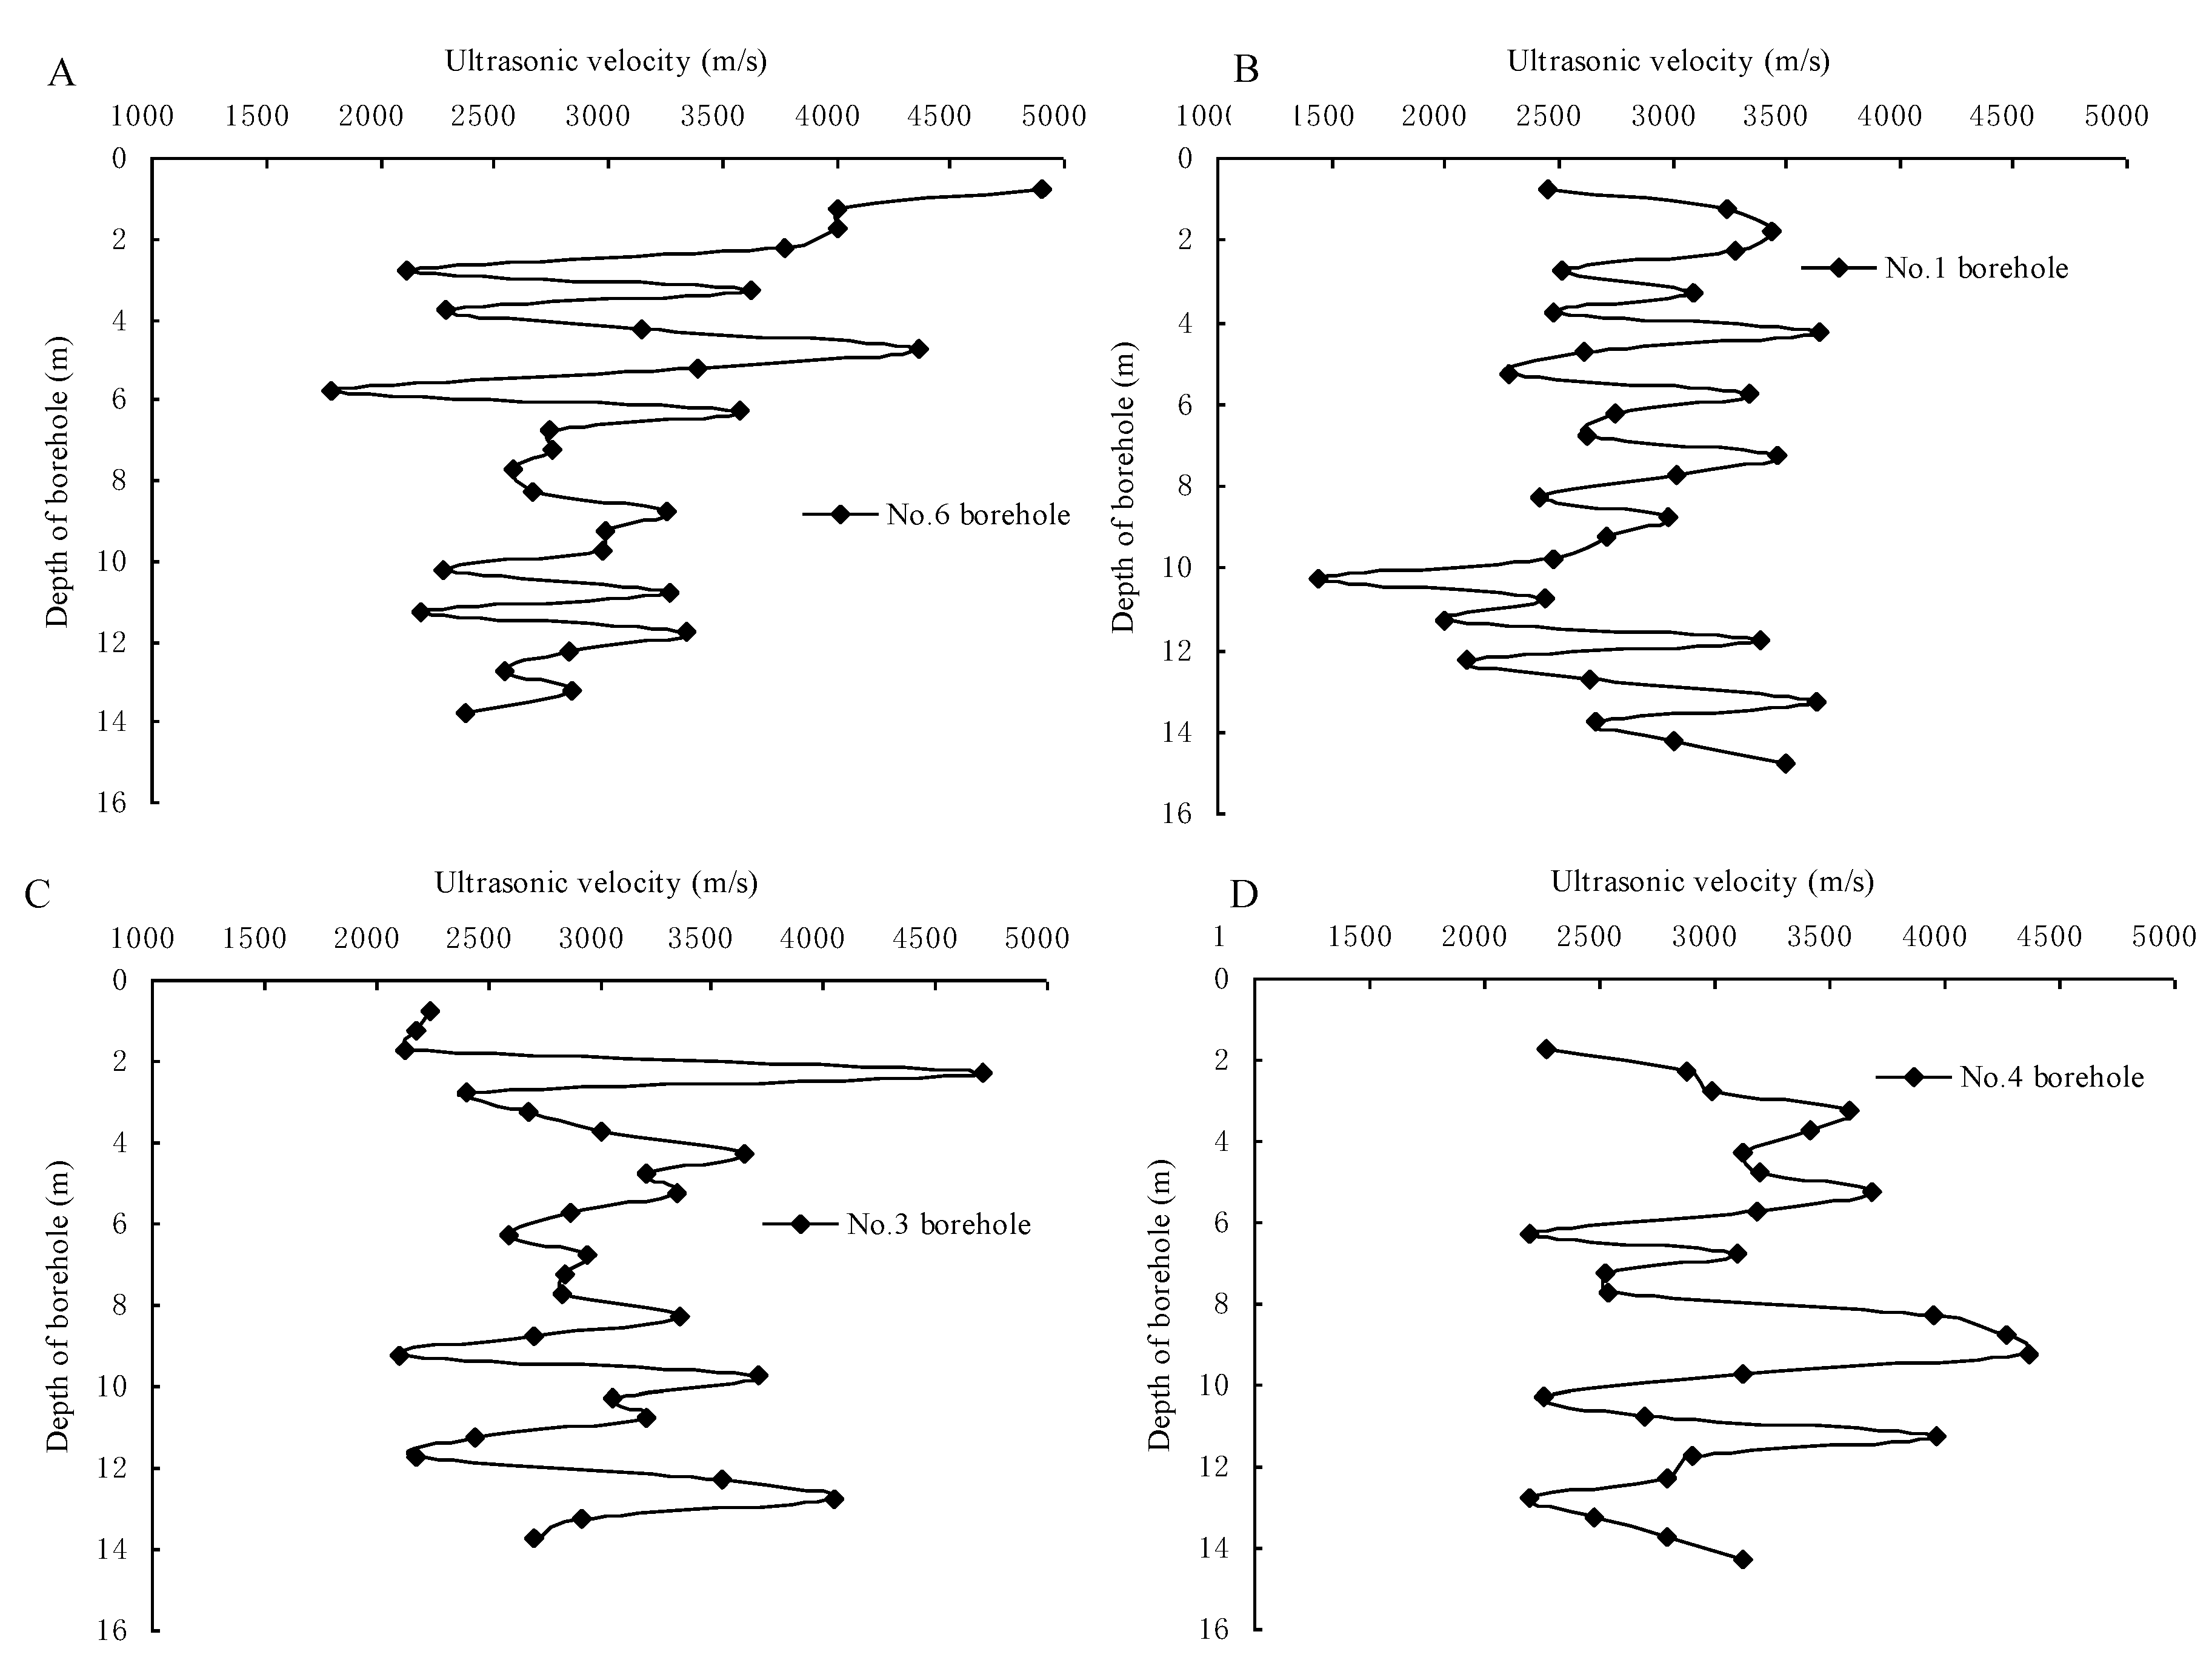
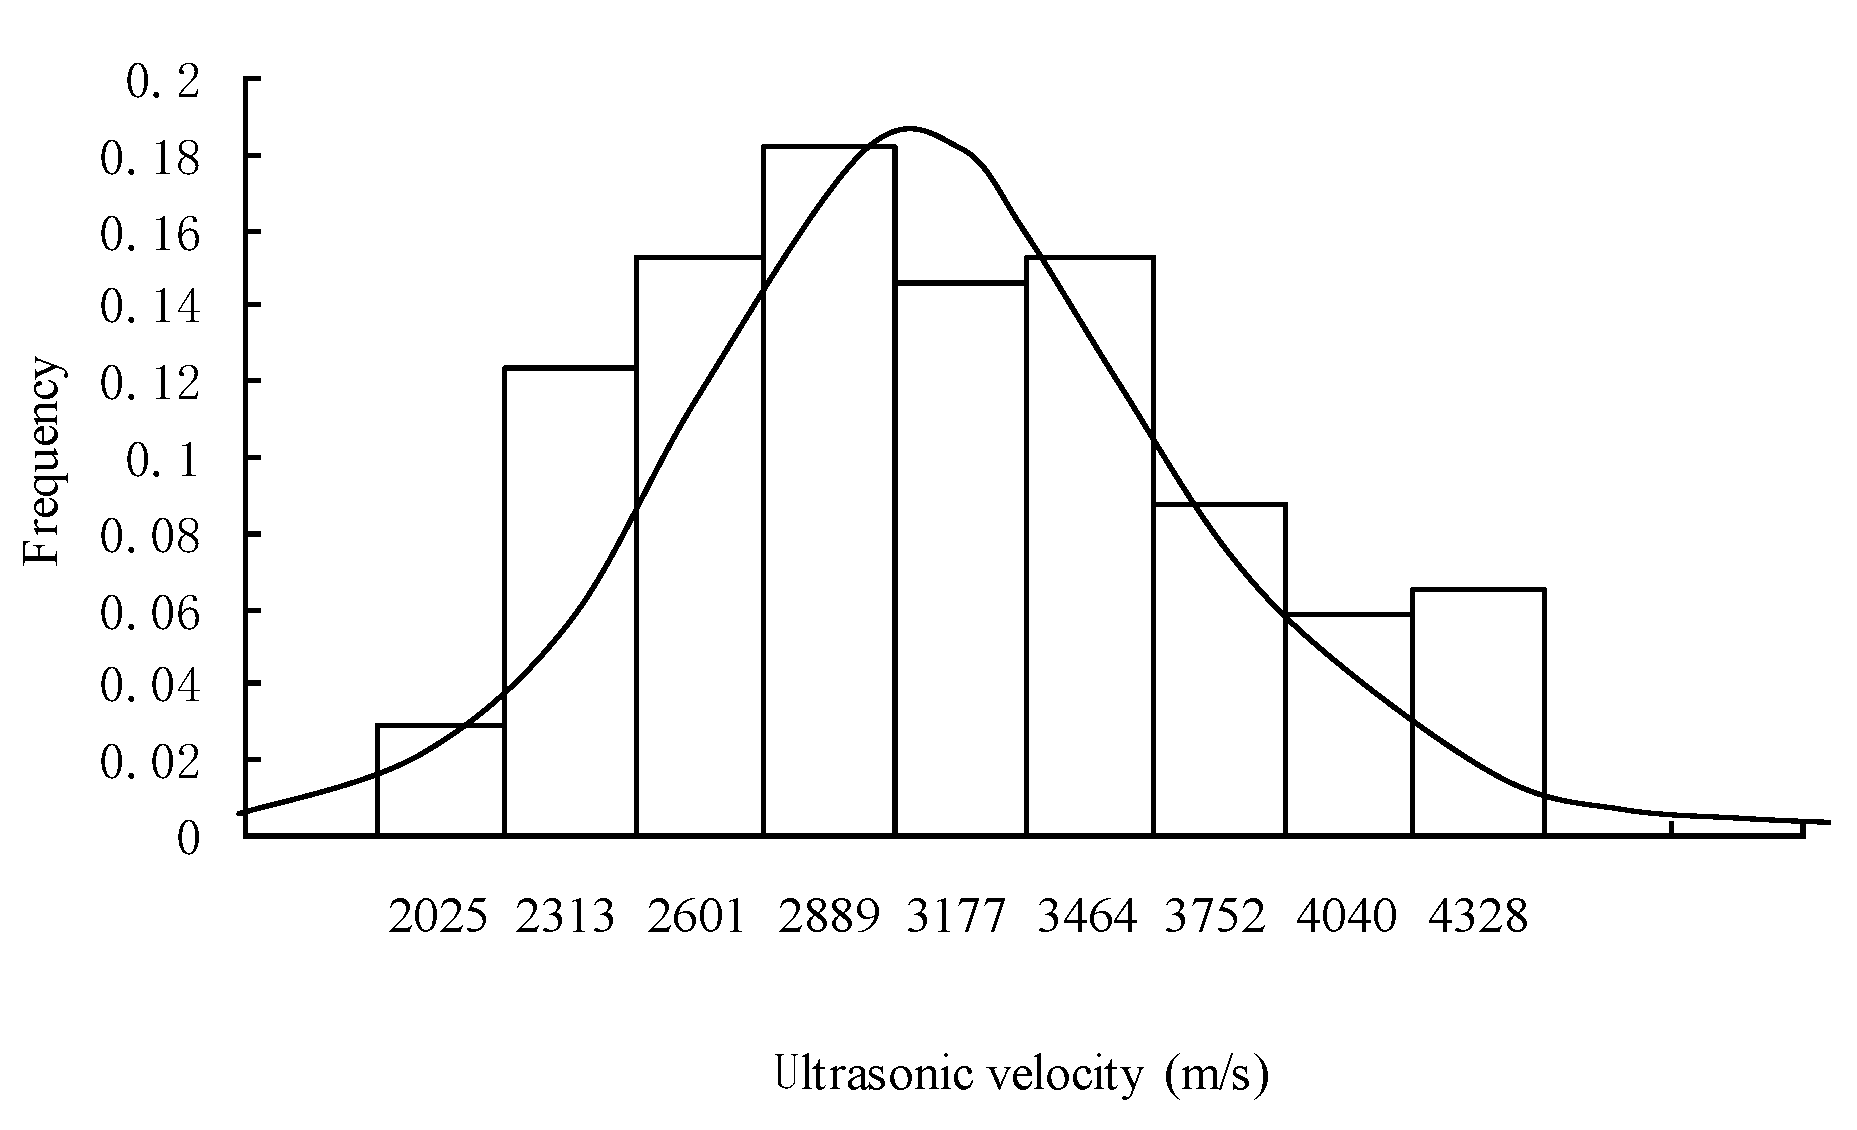
3.4. Ultrasonic Test

In ultrasonic tests, a nonmetal ultrasonic instrument (model: RS-ST02), made by the Wuhan Yanhai Company (Wuhan, China), was used. Ultrasonic tests, which can indirectly indicate the quality of RFC by the velocity of ultrasonic transmission in RFC, is processed by a single emission and double receiving sonic logging method. The flow the of sonic logging method is as follows [27]: (1) Fill the borehole with water; (2) check whether the instrument and transducer work properly; (3) put a single transducer down at the bottom of the borehole using a cable; (4) properly connect the transducer with one emission head and two receiving heads to the emission port and receiving port of the instrument; (5) take data at intervals of 0.50 m from bottom to top, and record the time interval between receiving heads; (6) get the velocity of the longitudinal waves. The whole ultrasonic test process should be in accordance with the “Technical specification for inspection of concrete defects by ultrasonic method (CECS21:2000)” (China Association of Engineering Construction Standardization, 2001) [28]. The change trend of ultrasonic wave velocity with depth in each borehole is shown in Figure 8.
As seen in Figure 8, the average ultrasonic velocity in borehole No. 1, is about 2814 m/s, mostly distributed in the 2250 m/s~3500 m/s range. At the depth of 10.0~10.5 m., the ultrasonic wave velocity was greatly reduced, which shows that there exist large defects, voids or relatively loose concrete; in other places, the ultrasonic wave velocity changed little, showing that RFC is relatively homogeneous, and the quality of RFC at the base is slightly better than at the top, which is in accord with the pressure water test results in this borehole. The pressure water test shows that the permeability in this borehole area gradually reduces as depth increases, which suggests that the fractures at the top of the dam are more than at the bottom, but it does not agree with the results of the core porosity test, which shows that the porosity at the top is less than at the bottom. A possible reason is that the interconnection of voids and fractures at the top area of dam is relatively better than in the bottom area, which can result in relatively high permeability at the top of dam although with low porosity of RFC in this area. Nevertheless, the core porosity test only based on specimens cannot entirely indicate the distribution of voids and fractures within RFC.
The ultrasonic velocity in the No. 3 borehole is generally above 2000 m/s, with an average of 2948 m/s. At the depth of 0~2.0 m, the ultrasonic velocity is relatively low, about 2000 m/s, but at the depth of 2.0~2.5 m, the ultrasonic velocity is significantly higher than elsewhere, which could be due to embedded dense rock blocks, leading to a high ultrasonic velocity at this area. At a depth below 9 m, the fluctuation of ultrasonic velocity is significant. The pressure water test in borehole No. 3 shows that at the depth of 6.4~10.7 m, the dam permeability is far higher than in other parts, but on the contrary, there is no obvious reflection on the ultrasonic velocity, which may be due to vertical fractures in this part, whose orientation may be coincident with the transmission direction of ultrasonic waves, not resulting in obvious changes on ultrasonic velocity yet having great impact on permeability.
The ultrasonic velocity in borehole No. 4 is generally above 2200 m/s, with an average of 3061 m/s. At the depth of 8.5~9.5 m, the ultrasonic velocity is higher, which means that there might be dense rock blocks, causing high ultrasonic velocity through the rock blocks. The water pressure test in borehole No. 4 showed that at the depth of 6.3~10.9 m, the water permeability of the dam is far higher than in other parts, which means that there exist vertical interconnected fractures in the area, but with no obvious reflection on ultrasonic velocity.
The ultrasonic velocity in borehole No. 6 is generally above 2000 m/s, with an average of 3096 m/s. At the depth of 5.5~6.0 m, the ultrasonic velocity is lower, whereas the permeability of the dam is bad in this place, which indicates that it might exist large defects, voids or relatively loose concrete with low interconnection.
As illustrated in Figure 8, the ultrasonic velocity in each borehole shows roughly cyclical fluctuations along the depth direction of the boreholes, which is due to the properties of RFC, which is mainly composed of mutually interlaced rock blocks and SCC, and the ultrasonic velocity in the two kinds of medium shows obvious differences. If defects in the RFC are distributed widely, the ultrasonic velocity is significantly low; on the contrary if RFC is very dense, the ultrasonic velocity can increase significantly.
According to a statistical analysis on the dataset with 137 ultrasonic velocity specimens, the average ultrasonic velocity is 2993.3 m/s, and the standard deviation is 650.5 m/s. From the histogram of ultrasonic velocity shown in Figure 9, we can find it approximately conformed to a lognormal distribution and normal distribution. A χ 2 test is applied to determine the optimal distribution type [29]. Since the number of ultrasonic velocity specimens of less than 2024.83 m/s and more than 4328.17 m/s are very few, the specimens in these intervals should be merged. Finally, the specimens are divided into nine intervals. Assuming the specimens conform to a normal distribution, statistic χ 2 = 12.6; and if specimens conform to a lognormal distribution, statistic χ 2 = 3.0. Now, we should calculate the critical statistic χ 2 under the two distribution types. Because the number of specimens is more than 50, and two unknown parameters are contained in the distribution function, the degree of freedom is equal to 6 (i.e., f = 6). Assuming a level of significance α = 0.05, under the condition of f = 6, critical statistic χ 0.05 2 ( 6 ) = 12.6 . Comparing the χ 2 = 12.6 under normal distribution and χ 2 = 3.0 under lognormal distribution with the critical statistic, the two statistics are not more than it, so the two distribution types can be both accepted. However χ 2 = 3.0 under the lognormal distribution is far less than χ 2 = 12.6 under a normal distribution, therefore the optimal distribution type the specimens fit is a lognormal distribution, with distribution parameters of 7.98, 0.216.

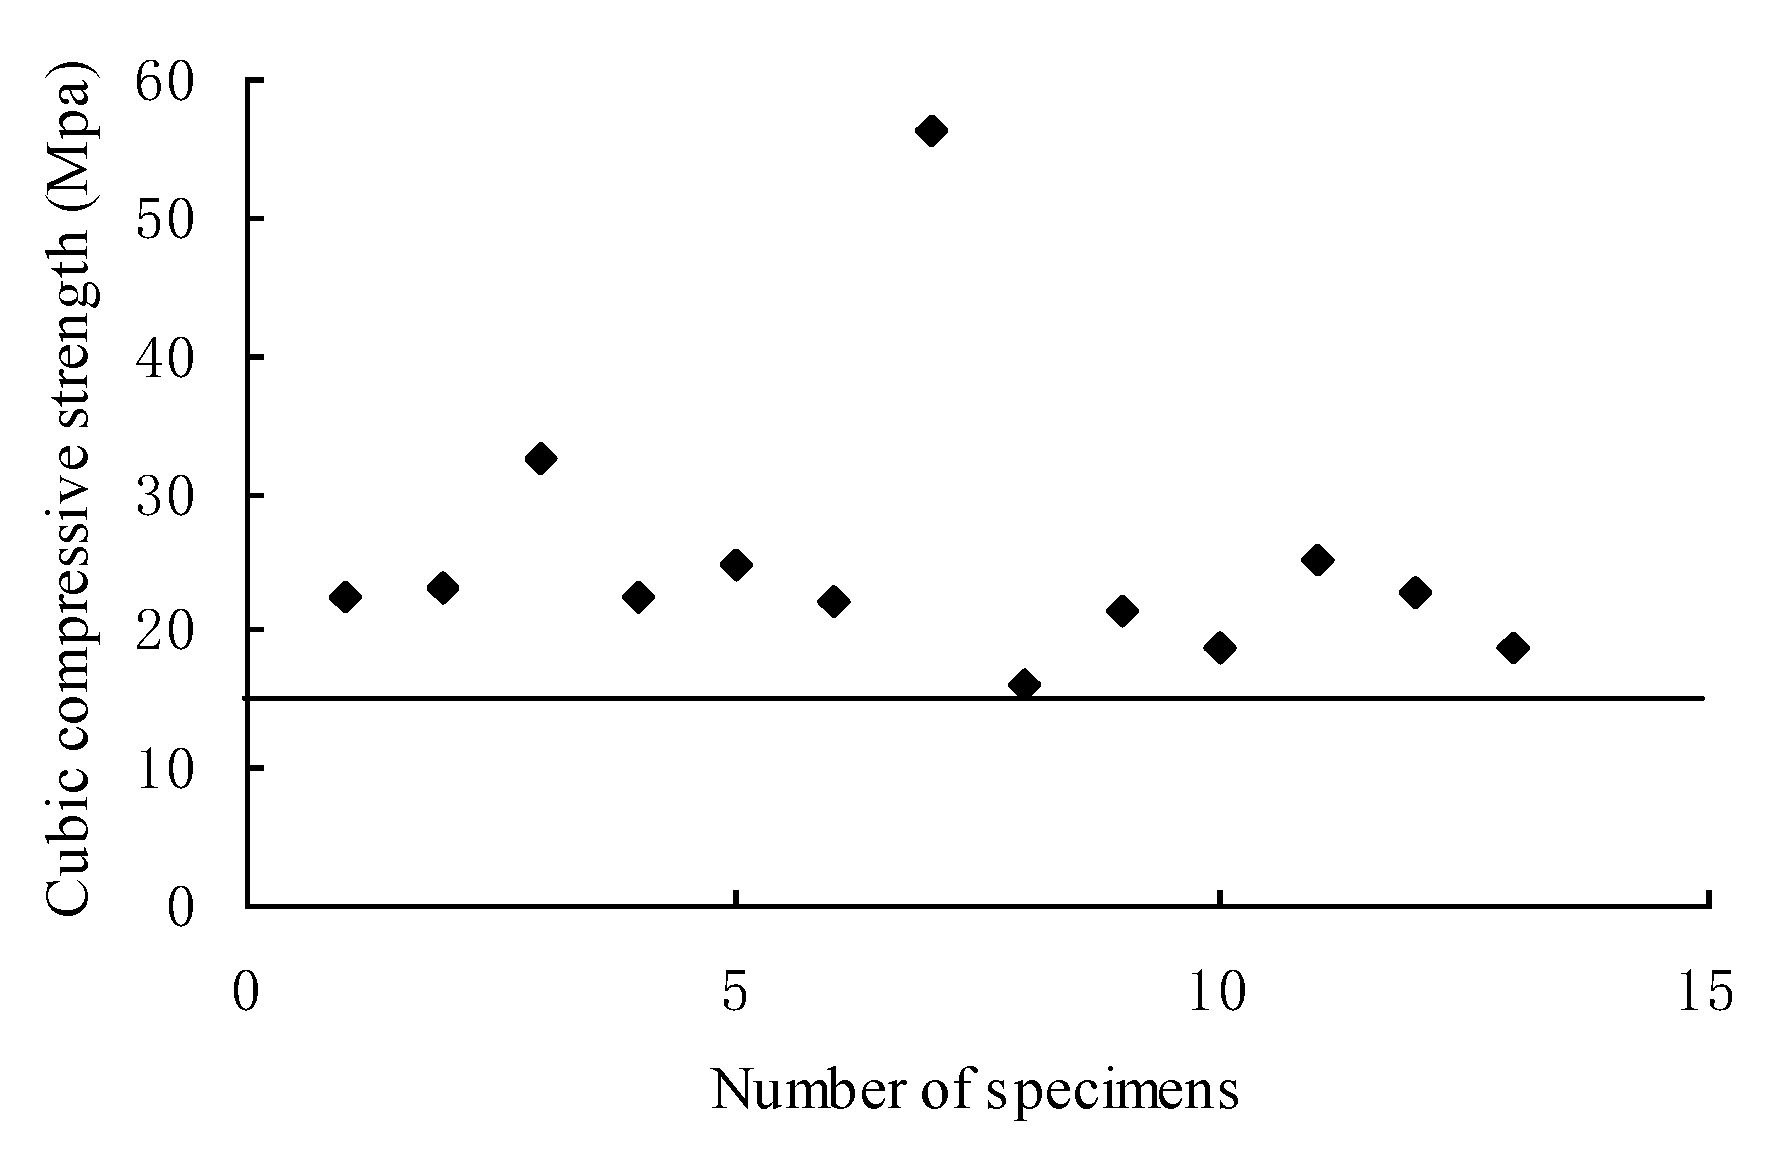
3.5. Compressive Test

Fined cores are needed to obtain good results in compressive tests and considering that some contained large defects cannot be chosen, core specimens should be carefully chosen. Based on “Test code for hydraulic concrete (SL352-2006)”, core specimens for compressive test should be cut to a height-diameter ratio of 1:1 with dimensions of ϕ88 mm × H88 mm. After specimen preparation, there were only 13 specimens that met the test requirements. In accordance with “test code for hydraulic concrete (SL352-2006)” (Ministry of Water Resources of the P.R.C. 2006) [30], first, the specimen should be aligned with plate center of a universal testing machine, then the test should be started. When the upper plate of the universal testing machine is close to the top surface of the specimen, we adjust the spherical hinge to make the plate contact specimen in a balanced way, then we load the specimen at a uniform rate of 0.5 MPa/s until broken. Experiments show that the average compressive strength of RFC is 22.76 Mpa, with a standard deviation of 4.32 Mpa. Converting this to cube compressive strength (fcu) (cube dimension 150 mm × 150 mm × 150 mm), the average is 22.55 Mpa, with a standard deviation of 4.09 Mpa, which is shown in Figure 10. The cube compressive strengths of specimens are well distributed, and all are more than 15 Mpa. Converting them to standard cube compressive strength (fcuk), f c u k = μ f c u 1.645 σ f c u = 15.82   Mpa , fcuk for all specimens are more than 15 Mpa, which meet the design requirements. According to the compressive tests, the compressive strength of SCC is 15.92 Mpa, which also meets the design requirements. Compared with rock block which has an average compressive strength of 51.77 Mpa, the compressive strength of RFC drops dramatically, with a decrease of about 43.5%; and a slight increase compared with SCC, whose average compressive strength is 17.6 Mpa. Therefore, the quality of massive RFC is mainly controlled by the construction technology used and only slightly influenced by SCC and rock block.
As shown in Figure 10, the compressive strength of some specimens reached 56.36 Mpa, far higher than other specimens. These specimens were taken from borehole No. 3 at the depth of 14.30 m~14.50 m, which porosity, permeability, ultrasonic velocity are 7%, 5.59 Lu, 2707 m/s, respectively. Compared with high compressive strength, those values are relatively low, probably because of the good compaction of this specimen as it is, mainly composed of hard rock block with little rock joints and ITZ. However, the quality of RFC in this part is common. It can thus be seen that the homogeneity of RFC is inferior.

4. Discussion

From the analysis above, we can make some suggestions about quality control of RFC, as follows:
(1)
There exist some obvious defects in RFC with randomness and uncontrollability, which can form interconnected fractures, leading to dam permeability increases, and causing hidden problems that affect dam safety, so normal concrete should be adopted for use in the key parts of dam, such as the upstream face of dam; water draining surface of the outlet dam section, etc.
(2)
Some kinds of defects in RFC can be eliminated or reduced by improving the construction technology, but it is extremely hard to avoid all defects. The large sized voids existing in interfacial transition zone, should be eliminated to the greatest extent possible. This kind of defects, formed mainly because the air contained in the big and deep concaves depressions on the surface of rock blocks or sealed spaces formed in the process of rock block piling, cannot be ruled out when SCC fills the voids of rock blocks. By reducing the size of rock blocks and improving the liquidity of SCC, this kind of defects can be reduced, but other defects, such as some joints existing in many big rock blocks that are very difficult to fill with SCC, or small bubbles in SCC mixed during SCC filling, are rather difficult to eliminate. How to eliminate or reduce these defects have been the key subjects in RFC research fields in order to improve the performance of RFC.
(3)
Owing to the effects of big sized rock block and construction technology of RFC in the actual project, there exist sealed spaces formed in the process of rock block piling, which caused the quality of RFC to be non-uniform, with obvious and centralized defects, when compared with lab RFC. Consequently, the quality of RFC poured in an actual project is quite different from that seen in the lab. Therefore, test methods based on small specimen cannot entirely indicate the quality of RFC dams, and how to inspect the quality of massive RFC should become key subjects in RFC research fields.

5. Conclusions

By combining lab tests of core specimens with in-situ tests in boreholes, the quality of RFC in the Hantang reservoir dam is evaluated and its features are listed as follows:
(1)
Through the appearance of RFC core specimens, four kinds of defects exist within RFC, which are large sized voids existing in ITZ between SCC and rock block; bad cohesion in ITZ; joints within rock block; voids within SCC. The existence of those defects are essential factors that result in an obvious non-homogeneity of RFC and reduce its quality.
(2)
The quality of RFC dams shows an obvious non-homogeneity, whose porosity changes from 0.34% to 22.37% with great variation. The permeability mainly ranges from 2.41 Lu to 10.41 Lu, with local values exceeding 25.52 Lu. The ultrasonic velocity mainly fluctuates from 2200 m/s to 3800 m/s with a standard deviation of 650.5 m/s. The compressive strength mainly varies from 15.8 Mpa to 32 Mpa, and locally can be more than 50 Mpa. Thus the data shows a relatively great dispersion due to uneven distribution of some defects in RFC. Although obvious non-homogeneity existed, the quality of RFC can basically meet the requirements of dam design, exceeding the design strength C15. By careful analysis, the non-homogeneity of RFC is mainly influenced by uneven distribution of some defects, which are produced during pouring. Therefore, the quality of massive RFC is mainly controlled by the construction technology and only slightly influenced by the SCC and rock blocks.
Although the quality of massive RFC can basically meet the design requirements in the Hantang dam project, for high concrete dams, RFC poured using traditional construction technology may not meet the requirements. Consequently, how to improve the homogeneity of RFC with construction technology and how to reduce defects within RFC dams will become a key subject in this field. In our next research, some valid measures will be proposed based on a large number of experiments.

Author Contributions

Conceptualization, G.Z. and H.W.; Methodology, H.W.; Validation, M.W., J.X. and H.W.; Formal Analysis, W.L.; Investigation, G.Z.; Resources, G.Z.; Data Curation, M.W.; Writing-Original Draft Preparation, H.W.; Writing-Review & Editing, F.S.; Visualization, W.L.; Funding Acquisition, M.W.

Funding

This research and the APC were funded by Yunnan provincial natural science foundation of China, grant number KKSY20140426.

Acknowledgments

The authors gratefully thank Yunnan provincial natural science foundation of China (No. KKSY20140426) for its financial support. All the reviewers’ efforts are greatly appreciated.

Conflicts of Interest

The authors declare no conflict of interest.

References

  1. An, X.H.; Huang, M.S.; Ouchi, M.; Jin, F. Technical Manual for Self-Compacting Concrete; China Water Power Press: Beijing, China, 2008. (In Chinese) [Google Scholar]
  2. Jin, F.; An, X.H.; Shi, J.J.; Zhang, C.H. Study on rock-fill concrete dam. J. Hydraul. Eng. 2005, 36, 1347–1352. (In Chinese) [Google Scholar]
  3. Jin, F.; Zhou, H.; An, X. Research on rock-filled concrete dam. Int. J. Civ. Eng. 2019, 17, 495–500. [Google Scholar] [CrossRef]
  4. Huang, M.S.; Zhou, H.; An, X.H.; Jin, F. A pilot study on integrated properties of Rock-Filled Concrete. J. Build. Mater. 2008, 11, 206–211. [Google Scholar]
  5. Shi, J.J.; Zhang, Z.H.; Jin, F.; Zhang, C. Experimental research on mechanical behavior of self-compacting rock-fill concrete. Chin. J. Rock Mech. Eng. 2007, 26, 3231–3236. (In Chinese) [Google Scholar]
  6. An, X.; Wu, Q.; Jin, F.; Huang, M.; Zhou, H.; Chen, C.; Liu, C. Rock-filled concrete, the new norm of SCC in hydraulic engineering in China. Cem. Concr. Compos. 2014, 54, 89–99. [Google Scholar] [CrossRef]
  7. Alyama, K.E.; Ince, R. A preliminary concrete mix design for SCC with marble powders. Constr. Build. Mater. 2009, 23, 1201–1210. [Google Scholar] [CrossRef]
  8. Dinakar, P.; Manu, S.N. Concrete mix design for high strength self-compacting concrete using metakaolin. Mater. Des. 2014, 60, 661–668. [Google Scholar] [CrossRef]
  9. Khaleel, O.R.; Razak, H.A. Mix design method for self compacting metakaolin concrete with different properties of coarse aggregate. Mater. Des. 2014, 53, 691–700. [Google Scholar] [CrossRef] [Green Version]
  10. Ozbay, E.; Oztas, A.; Baykasoglu, A.; Ozbebek, H. Investigating mix proportions of high strength self compacting concrete by using Taguchi method. Constr. Build. Mater. 2009, 23, 694–702. [Google Scholar] [CrossRef]
  11. Nepomuceno, M.C.S.; Pereira-de-Oliveira, L.A.; Lopes, S.M.R. Methodology for the mix design of self-compacting concrete using different mineral additions in binary blends of powders. Constr. Build. Mater. 2014, 64, 82–94. [Google Scholar] [CrossRef]
  12. Chen, H.; Zhu, Z.; Liu, L.; Sun, W.; Miao, C. Aggregate shape effect on the overestimation of ITZ thickness: Quantitative analysis of Platonic particles. Powder Technol. 2016, 289, 1–17. [Google Scholar] [CrossRef]
  13. Lee, K.M.; Park, J.H. A numerical model for elastic modulus of concrete considering interfacial transition zone. Cem. Concr. Res. 2008, 38, 396–402. [Google Scholar] [CrossRef]
  14. Leemann, A.; Münch, B.; Gasser, P.; Holzer, L. Influence of compaction on the interfacial transition zone and the permeability of concrete. Cem. Concr. Res. 2006, 36, 1425–1433. [Google Scholar] [CrossRef]
  15. Wang, Y.Y.; Jin, F.; Xie, Y.T. Experimental study on effects of casting procedures on compressive strength, water permeability, and interfacial transition zone porosity of rock-filled concrete. J. Mater. Civ. Eng. 2016, 28, 04016055. [Google Scholar] [CrossRef]
  16. Rangaraju, P.R.; Olek, J.; Diamond, S. An investigation into the influence of inter-aggregate spacing and the extent of the ITZ on properties of Portland cement concretes. Cem. Concr. Res. 2010, 40, 1601–1608. [Google Scholar] [CrossRef]
  17. Xie, Y.; Corr, D.J.; Chaouche, M.; Jin, F.; Shah, S.P. Experimental study of filling capacity of self-compacting concrete and its influence on the properties of rock-filled concrete. Cem. Concr. Res. 2014, 56, 121–128. [Google Scholar] [CrossRef]
  18. Elsharief, A.; Cohen, M.D.; Olek, J. Influence of aggregate size, water cement ratio and age on the microstructure of the interfacial transition zone. Cem. Concr. Res. 2003, 33, 1837–1849. [Google Scholar] [CrossRef]
  19. Silva, P.R.D.; Brito, J.D. Experimental study of the porosity and microstructure of self-compacting concrete (SCC) with binary and ternary mixes of fly ash and limestone filler. Constr. Build. Mater. 2015, 86, 101–112. [Google Scholar] [CrossRef]
  20. Gao, Y.; De Schutter, G.; Ye, G.; Tan, Z.; Wu, K. The ITZ microstructure, thickness and porosity in blended cementitious composite: Effects of curing age, water to binder ratio and aggregate content. Compos. Part B 2014, 60, 1–13. [Google Scholar] [CrossRef]
  21. The Ministry of Water Resources of the P.R.C. Code for Design of Occupational Safety and Health of Water Resources and Hydropower Projects; (GB 50706-2011); China Planning Press: Beijing, China, 2012. (In Chinese)
  22. The National Energy Administration of the P.R.C. Construction Specification for Hydraulic Roller Compacted Concrete; (DL/T 5112-2009); China Power Press: Beijing, China, 2009. (In Chinese)
  23. Ye, M.X. Measurement method of porosity in concrete. Hydro Sci. Eng. Res. 1997, 4, 379–385. (In Chinese) [Google Scholar]
  24. Qiu, J.; Khalloufi, S.; Martynenko, A.; Van Dalen, G.; Schutyser, M.; Almeida-Rivera, C. Porosity, bulk density, and volume reduction during drying: review of measurement methods and coefficient determinations. Dry. Technol. 2015, 33, 1681–1699. [Google Scholar] [CrossRef]
  25. Raut, P.; Liang, W.; Chen, Y.M.; Zhu, Y.; Jana, S.C. Syndiotactic polystyrene-based ionogel membranes for high temperature electrochemical applications. ACS Appl. Mater. Interfaces 2017, 9, 30933–30942. [Google Scholar] [CrossRef] [PubMed]
  26. The Ministry of Water Resources of the P.R.C. Code of Water Pressure Test in Borehole for Water Resources and Hydropower Engineering; (SL31-2003); China Water & Power Press: Beijing, China, 2003. (In Chinese)
  27. Peng, X.S. Application of a transceiver Sonic Logging in Water Conservancy Project. Heilongjiang Sci. Technol. Water Conserv. 2014, 42, 53–55. (In Chinese) [Google Scholar]
  28. China Association of Engineering Construction Standardization. Technical Specification for Inspection of Concrete Defects by Ultrasonic Method; (CECS 21:2001); China City Press: Beijing, China, 2001. (In Chinese) [Google Scholar]
  29. Huang, K.Z.; Mao, S.P. Stochastic Method and Application of Fuzzy Mathematics; Tongji University Press: Shanghai, China, 1987. (In Chinese) [Google Scholar]
  30. The Ministry of Water Resources of the P.R.C. Test Code for Hydraulic Concrete; (SL352-2006); China Water & Power Press: Beijing, China, 2006. (In Chinese)
Figure 1. Rock block placement.
Applsci 09 03767 g001
Figure 2. Pumping SCC into the working space.
Applsci 09 03767 g002
Figure 3. Flow chart of RFC construction.
Applsci 09 03767 g003
Figure 4. Poured dam body by RFC.
Applsci 09 03767 g004
Figure 5. Layout of boreholes at the Hantang dam.
Applsci 09 03767 g005
Figure 6. Relationship between porosity of RFC and depth.
Applsci 09 03767 g006
Figure 7. Relationship between permeability of RFC and depth by histogram.
Applsci 09 03767 g007
Figure 8. Relationship between ultrasonic velocity of RFC and depth.
Applsci 09 03767 g008
Figure 9. Histogram on ultrasonic velocity of RFC.
Applsci 09 03767 g009
Figure 10. Cubic compressive strength of RFC.
Applsci 09 03767 g010
Table 1. Defect types in RFC.
Types of DefectsDefect CharacteristicsDefect PictureReason for Defects
Large sized void in ITZ between SCC and rock blockThis type of defect is usually located in the ITZ, with small number and large size, which can form irregular shape, such as strip, triangle, some of which is as large as 10 cm length, 3.5 cm width, 4.0 cm depth. Honeycomb shaped void on the SCC surface is shown. Applsci 09 03767 i001There are some great concaves or wide fractures, existing on the surface of rock block, which make air contain into concaves or fractures, not to release totally, thus to form bubbles, while SCC casting process. Such bubbles contained within RFC can result in this defect.
Bad cohesion in ITZThis type of defect, with small scale, is located in the ITZ, making strip shaped distribution. In some place of defect zone, cohesion of SCC with RB is well, but in other place is bad, with a few fractures or mud. Applsci 09 03767 i002This defect is caused by air film or mud on the surface of rock block, formed in SCC casting process. This defect can result in bad cohesion of SCC with rock block.
Joints within rock blockThis type of defect is due to joints within rock block, influenced by attitude of joints, some of which, with erect or steep, can have great effect on quality of RFC. Applsci 09 03767 i003The reason of this defect is joints containing in natural RB. If RB is very large, the number and scale of joints is also great, which can lead to great defects.
Void within SCCThis type of defect exists in SCC, presenting sphere shape, with large number and small scale, some of which are relatively large, with 10 cm diameter, 5~10 mm depth. Applsci 09 03767 i004This defect results from bubble in SCC, entrainment into air when casting SCC.

