Automatic Defect Detection for Web Offset Printing Based on Machine Vision


Abstract
1. Introduction
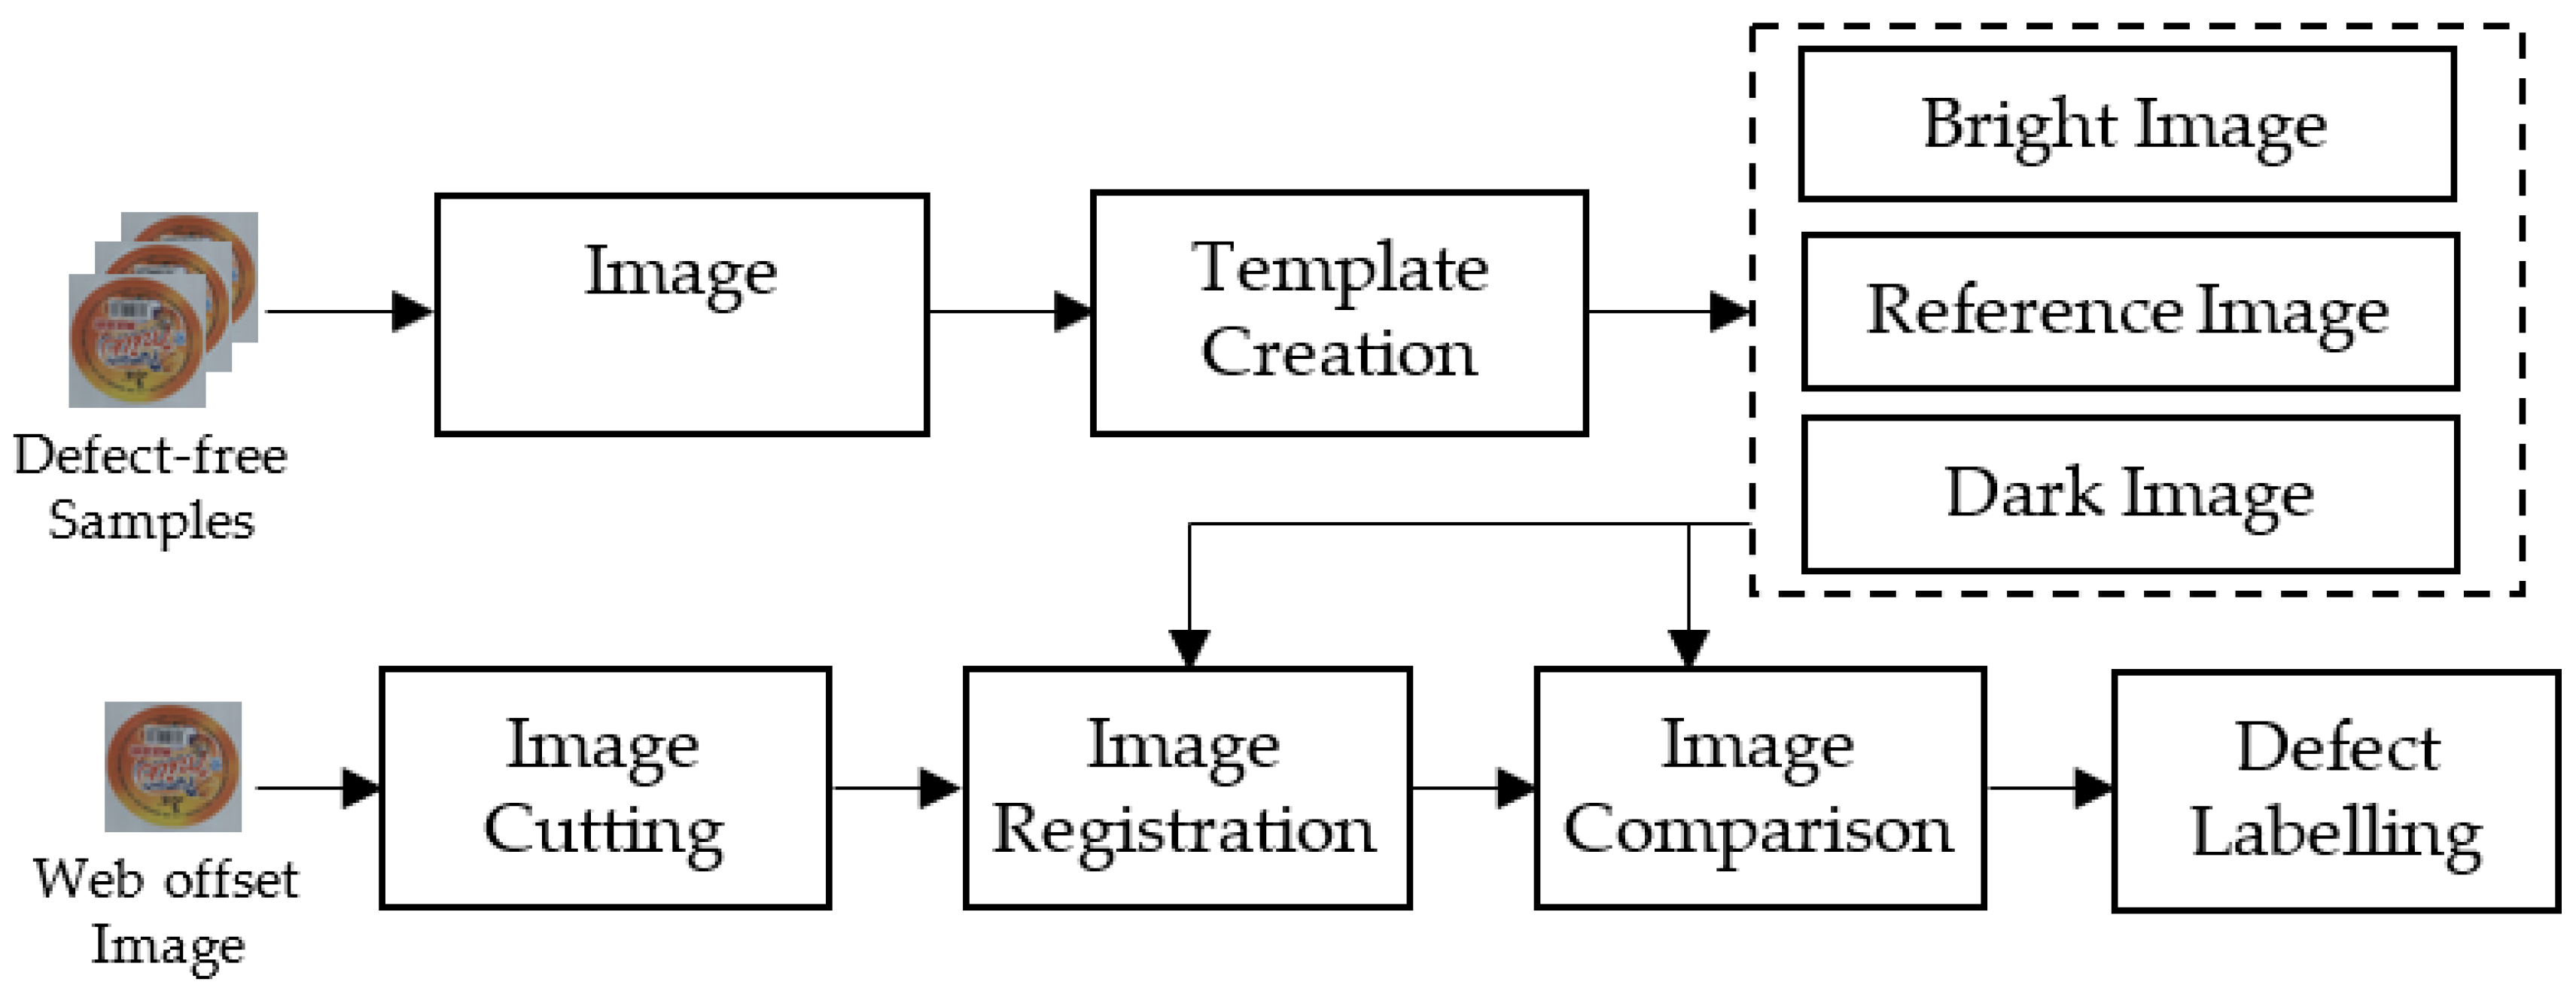
2. Methodology
2.1. Determining First Row in Web Offset Images
2.1.1. Description of the Problem
2.1.2. Search Method Based on Image Projection
- (1)
- Smooth the initial projection average gray value by three-point average and set it as the first layer of the pyramid.
- (2)
- Construct next layer by down-sampling the current layer with a sampling rate of . In our experiment, is set as 2.
- (3)
- Repeat Step 2 until the number of the current layer is no less than 32, where 32 is an empirical value.
- (4)
- Search from the top layer to first layer using Equation (3). Suppose the best position index in the current layer is , then the searching range in the next layer is .
- (5)
- The best position index in the first layer is the first row.
2.2. Image Registration Based on Shape Context with Concave-Convex Feature
2.2.1. Introduction of Shape Context
2.2.2. Shape Context Based on Concave-Convex Feature
2.3. Defect Detection Based on Image Subtraction
3. Experiment
3.1. Performance of Determining the First Row in Web Offset Images
3.2. Performance of the Proposed Defect Detection Method
4. Conclusions
Author Contributions
Funding
Conflicts of Interest
References
- Annaby, M.H.; Fouda, Y.M.; Rushdi, M.A. Improved normalized cross-correlation for defect detection in printed-circuit boards. IEEE Trans. Semicond. Manuf. 2019, 32, 199–211. [Google Scholar] [CrossRef]
- Vilas, H.G.; Yogesh, V.H.; Vijander, S. An efficient similarity measure approach for PCB surface defect detection. Pattern Anal. Appl. 2018, 21, 277–289. [Google Scholar]
- Haddad, B.M.; Lina, S.Y.; Karam, L.J.; Ye, J.; Patel, N.S.; Braun, M.W. Multifeature, sparse-based approach for defects detection and classification in semiconductor units. IEEE Trans. Autom. Sci. Eng. 2018, 15, 145–159. [Google Scholar] [CrossRef]
- Jian, C.; Gao, J.; Ao, Y. Automatic surface defect detection for mobile phone screen glass based on machine vision. Appl. Soft Comput. 2017, 52, 348–358. [Google Scholar] [CrossRef]
- Kang, X.; Zhang, E. A universal defect detection approach for various types of fabrics based on the Elo-rating algorithm of the integral image. Text. Res. J. 2019, 1–28. [Google Scholar] [CrossRef]
- Shankar, N.G.; Ravi, N.; Zhong, Z.W. On-line defect detection in web offset printing. In Proceedings of the Fourth International Conference on Control and Automation (ICCA’03), Montreal, QC, Canada, 10–12 June 2003; pp. 794–798. [Google Scholar]
- Shankar, N.G.; Ravi, N.; Zhong, Z.W. A real-time print-defect detection system for web offset printing. Measurement 2009, 42, 645–652. [Google Scholar] [CrossRef]
- Jesper, B.P.; Kamal, N.; Thomas, B.M. Quality Inspection of Printed Texts. In Proceedings of the 23rd International Conference on Systems, Signals and Image Processing, Bratislava, Slovakia, 23–26 June 2016; pp. 1–4. [Google Scholar]
- Vans, M.; Schein, S.; Staelin, C.; Kisilev, P.; Simske, S.; Dagan, R.; Harush, S. Automatic visual inspection and defect detection on variable data prints. J. Electron. Imaging 2011, 20, 1–13. [Google Scholar] [CrossRef]
- Katsuyuki, T.; Shin’ichi, M.; Akira, I. High-speed defect detection method for color printed matter. In Proceedings of the 16th Annual Conference of IEEE Industrial Electronics Society, Pacific Grove, CA, USA, 27–30 November 1990; pp. 653–658. [Google Scholar]
- Yang, O.; Hu, T.; Guo, X.; Guo, B. An automation system for high-speed detection of printed matter and defect recognition. In Proceedings of the 2007 IEEE International Conference on Integration Technology, Shenzhen, China, 20–24 March 2007; pp. 213–217. [Google Scholar]
- Zhu, Z.; Guo, Y. On image registration and defect detection techniques in the print quality detection of cigarette wrapper. In Proceedings of the 27th Chinese Control Conference, Kunming, Yunnan, China, 16–18 July 2008; pp. 34–38. [Google Scholar]
- Luo, B.; Guo, G. Fast printing defects inspection based on multi-template matching. In Proceedings of the 2016 12th International Conference on Natural Computation, Fuzzy Systems and Knowledge Discovery, Changsha, China, 13–15 August 2016; pp. 1492–1496. [Google Scholar]
- Wang, Y.; Xu, S.; Zhu, Z.; Sun, Y.; Zhang, Z. Real-time defect detection method for printed images based on grayscale and gradient differences. J. Eng. Sci. Technol. Rev. 2018, 11, 180–188. [Google Scholar]
- Yang, X.; Wu, S. A rapid defect detecting algorithm for printed matter on the assembly line. In Proceedings of the 2012 International Conference on Systems and Informatics, Yantai, China, 19–20 May 2012; pp. 1842–1845. [Google Scholar]
- Sun, X.; Zhang, L.; Chen, B. On-line print-defect detecting in an incremental subspace learning framework. Sens. Rev. 2011, 31, 138–143. [Google Scholar] [CrossRef]
- Zhang, Y.; Zhang, E.H.; Chen, W.J. Deep neural network for halftone image classification based on sparse auto-encoder. Eng. Appl. Artif. Intell. 2016, 50, 245–255. [Google Scholar] [CrossRef]
- Zhang, E.; Zhang, Y.; Duan, J. Color Inverse Halftoning Method with the Correlation of Multi-Color Components Based on Extreme Learning Machine. Appl. Sci. 2019, 9, 841. [Google Scholar] [CrossRef]
- Wang, T.; Chen, Y.; Qiao, M.; Snoussi, H. A fast and robust convolutional neural network-based defect detection model in product quality control. Int. J. Adv. Manuf. Technol. 2018, 94, 3465–3471. [Google Scholar] [CrossRef]
- Haselmann, M.; Gruber, D.P. Pixel-wise defect detection by CNNs without manually labeled training data. Appl. Artif. Intell. 2019, 33, 548–566. [Google Scholar] [CrossRef]
- Belongie, S.; Malik, J.; Jan, P. Shape matching and object recognition using shape contexts. IEEE Trans. Pattern Recognit. Mach. Intell. 2002, 24, 509–522. [Google Scholar] [CrossRef]


| Number of Pyramid Layers | 1 | 2 | 3 | 4 | 5 | 6 | 7 | 8 | 9 | 10 |
|---|---|---|---|---|---|---|---|---|---|---|
| Precision | ±0 | ±0 | ±0 | ±0 | ±1 | ±2 | ±3 | ±6 | ±7 | ±10 |
| Times/ms | 3062.43 | 1293.86 | 591.27 | 318.24 | 185.46 | 126.46 | 106.71 | 85.18 | 80.30 | 80.98 |
| Number of correct images | 20 | 20 | 20 | 20 | 20 | 20 | 20 | 18 | 14 | 12 |
| Size of ROI | 20 | 100 | 1000 | |
|---|---|---|---|---|
| Image Height | ||||
| 1164 | 1.60 | 2.05 | 7.08 | |
| 8192 | 9.85 | 11.85 | 38.01 | |
| Image Size | Number of Training Samples | Number of Defects | Number of Correctly Detected Defects | Number of Falsely Detected Defects | Sensitivity (%) | FPR (%) | Time (ms/Image) |
|---|---|---|---|---|---|---|---|
| 4096 × 942 | 10 | 601 | 500 | 29 | 83.19 | 4.83 | 140.13 |
| 4096 × 942 | 20 | 601 | 549 | 18 | 91.35 | 2.30 | 140.13 |
| 4096 × 942 | 30 | 601 | 585 | 11 | 97.33 | 1.83 | 140.13 |
| 4096 × 942 | 35 | 601 | 585 | 11 | 97.33 | 1.83 | 140.13 |
| 4096 × 1164 | 10 | 682 | 568 | 37 | 83.28 | 5.4 | 151.28 |
| 4096 × 1164 | 20 | 682 | 623 | 21 | 91.34 | 3.07 | 151.28 |
| 4096 × 1164 | 30 | 682 | 654 | 9 | 95.89 | 1.31 | 151.28 |
| 4096 × 1248 | 10 | 739 | 627 | 41 | 84.84 | 5.54 | 157.06 |
| 4096 × 1248 | 20 | 739 | 699 | 19 | 94.59 | 2.57 | 157.06 |
| 4096 × 1248 | 30 | 739 | 701 | 11 | 94.86 | 1.49 | 157.06 |
© 2019 by the authors. Licensee MDPI, Basel, Switzerland. This article is an open access article distributed under the terms and conditions of the Creative Commons Attribution (CC BY) license (http://creativecommons.org/licenses/by/4.0/).
Share and Cite
Zhang, E.; Chen, Y.; Gao, M.; Duan, J.; Jing, C. Automatic Defect Detection for Web Offset Printing Based on Machine Vision. Appl. Sci. 2019, 9, 3598. https://doi.org/10.3390/app9173598
Zhang E, Chen Y, Gao M, Duan J, Jing C. Automatic Defect Detection for Web Offset Printing Based on Machine Vision. Applied Sciences. 2019; 9(17):3598. https://doi.org/10.3390/app9173598
Chicago/Turabian StyleZhang, Erhu, Yajun Chen, Min Gao, Jinghong Duan, and Cuining Jing. 2019. "Automatic Defect Detection for Web Offset Printing Based on Machine Vision" Applied Sciences 9, no. 17: 3598. https://doi.org/10.3390/app9173598
APA StyleZhang, E., Chen, Y., Gao, M., Duan, J., & Jing, C. (2019). Automatic Defect Detection for Web Offset Printing Based on Machine Vision. Applied Sciences, 9(17), 3598. https://doi.org/10.3390/app9173598