Article

Citywide Metro-to-Bus Transfer Behavior Identification Based on Combined Data from Smart Cards and GPS

School of Civil Engineering and Transportation, South China University of Technology, No.381, Wushan Road, Guangzhou 510641, China
*
Author to whom correspondence should be addressed.
Appl. Sci. 2019, 9(17), 3597; https://doi.org/10.3390/app9173597
Submission received: 1 August 2019 / Revised: 23 August 2019 / Accepted: 23 August 2019 / Published: 2 September 2019
(This article belongs to the Section Civil Engineering)

Abstract

:
The aim of this study is to develop a fast data fusion method for recognizing metro-to-bus transfer trips based on combined data from smart cards and a GPS system. The method is intended to establish station- and time-specific elapsed time thresholds for overcoming the limitations of one-size-fits-all criterion which is not sufficiently convincing for different transfer pairs and personal characteristics. Firstly, a data fusion method with bus smart card data and GPS data is proposed to supplement absent bus boarding information in the smart card data. Then, a model for identifying metro-to-bus interchange trips is derived based on two rules about maximal allowable transfer distance and elapsed transfer time threshold. Finally, in tests that used half-monthly field smart card data and GPS data from Shenzhen, China, the results recognized by the proposed method were more consistent with the actual surveyed group transfer time with a P value of 0.17 determined by Mann–Whitney U test. The comparison analysis showed that the proposed method can be widely applied to successfully identify and interpret metro-to-bus interchange behavior beyond a static transfer time threshold of 30 min.

1. Introduction

Transfers have always been a hot topic in the field of public transport planning [1,2], because these activities are considered to be inevitable in today’s public transportation systems around the world. Urban metro or subway systems, one of highest capacity traffic modes in mass rapid transit (MRT), can provide a reliable, fast, and affordable service for medium–long distance travelers. In contrast, ground-level bus systems are much more flexible to cater passengers who are not served by a metro system, with relatively inexpensive fares and high-level accessibility [3]. Hence, it is cost-effective for commuters to change between the metro and ground-level bus system and it can reduce car usage and traffic congestion in urban areas. However, inefficient transfer design can reduce the attractiveness of public transportation [4]. Nowadays, it is very significant to find and improve poorly connected transfer stations by using the huge transaction data collected by automatic fare collection systems (AFCSs) and automatic vehicle location systems (AVLSs), which can increase the commuters’ willingness and mitigate prevalent traffic congestion.
Before AFCSs and AVLSs, methods for transfer station identification depended on questionnaire data, which is extremely expensive and time-consuming. With the rapid development of information technology and electronic payments, smart cards and global positioning systems (GPS) have been widely applied in public transportation. The former can record passengers’ boarding/alighting information when taking metro or ground-level bus vehicles, and the latter can collect bus trajectories with a high-frequency sampling rate [5]. Therefore, this study contributes to demonstrating a dynamic station-specific method to automatically recognize transfer trips for each metro station by integrating SC and GPS data. In detail, a novel spatial-temporal rule is implemented to estimate the dynamic elapsed transfer time threshold for each interchange bus station and time period, and to evaluate the level of service for citywide metro-to-bus transfer stations. The objectives of this study are to:
  • Estimate the missing boarding stations for each ground-level bus passenger by integrating bus SC and GPS data, where the system only records the boarding time;
  • Develop a new method with station-specific elapsed time threshold estimation to extract actual metro-to-bus interchange trips; and
  • Use the dynamic threshold to measure the level of service for metro-to-bus transfer stations, and discover the transfer points with poor connectivity in an urban public transportation network.
The paper is organized as follows: the next section reviews the relevant literature on metro–bus transfers; the third section provides a detailed description of SC data and GPS data in the city of Shenzhen, China; the fourth section develops a new method of extracting the station-specific elapsed time thresholds based on spatial-temporal rules, and identifies the metro-to-bus interchange trips. In Section 5, we discuss the results of transfer recognition as well as the reliability of the proposed method using a half-monthly dataset; and finally, conclusions and suggestions for future work are presented.

2. Literature Review

During the past decades, transfer facilities have been getting more and more focus due to their significance in public transport systems. In the early stage, some researchers investigated the transfer behavior between metro and other transit modes using survey data. For example, Cherry et al. analyzed the metro-to-bus transfer in Bangkok based on ordinal regression models, and found that the two greatest factors passengers were concerned about were safety from crime and the transfer distance between metro exits and bus stops [6]. Navarrete et al. investigated the difference of multiple transfer pairs (metro-to-metro, metro-to-bus, bus-to-metro, and bus-to-bus) via self-reported evaluation of transfer experience and associated factors (walking distance and waiting times) [7]. Depending on the research focus, Wang et al. collected over four thousand transfer trips to metro stations in Beijing and estimated the 75th-percentile walking distance to metro stations as 494 m in downtown areas and 712 m in suburban areas, respectively [8]. However, these studies suffer from incorrect data recording or false responses. More importantly, it is not feasible to identify and evaluate citywide metro-to-bus transfer behavior in megacities with hundreds of metro stations and thousands of bus stations via surveys.
In the late 1990s, smart card payment systems were incorporated into cities, such as Washington D.C. (Smartrip) and Tokyo (Suica). This new technology has rapidly spread to other cities and has become an important component of the modern public transport toll system [9]. Park et al. revealed that SC data has the potential to profile the characteristics of transit users, such as the number of transfers, boarding time, and hourly trip distribution of different transit modes [10]. A great number of studies has been dedicated to mining SC data for various purposes, such as origin–destination matrices estimation [11], transit user’s loyalty measurement [12], travel behavior analysis [13,14], and transit performance evaluation [15,16].
Okamura et al. analyzed transfer waiting time at major transit hubs [17], where they defined a transfer as a trip that involves two different operators and has a waiting time within 60 min at the same location. Bagchi et al. also extracted bus-to-bus transfer trips when the two successive boarding times for the same passenger are no greater than 30 min apart by using smart card transaction data [18,19]. In 2008, Seaborn et al. investigated multimodal transfer behavior based on SC data from London metro and ground-level bus systems, and recommended transfer elapsed time thresholds for three transfer modes: 20 min for metro-to-bus, 35 min for bus-to-metro, and 45 min for bus-to-bus, respectively [20]. Subsequently, the elapsed time threshold of a 30-min criterion for identifying transfer trips has been widely applied to estimate the daily complete journeys of transit passengers [21,22,23]. In particular, Zhao et al. developed a method with a transfer time threshold of 30 min to extract high-priority transfer pairs within an SC dataset for Nanjing, China [24]. The developed method failed under the scenarios of long bus time headway or a small number of transfers.
Recently, some researchers have also realized that the identification results are not convincing enough when they employed the city-level or route-level uniform static elapsed time threshold to identify the intermodal transfer trips without considering the impact of different stations and time periods. Notably, Gordon et al. proposed the concept of maximum interchange time and distance to infer transfer trips [25]. Later, Nassir et al. further improved the accuracy of transfer detection by adding off-optimality and total travel time to the criterion [26]. However, their method depends on both passengers’ boarding and alighting information, which is not available for many cities’ SC systems because the passengers do not need to swipe their cards before alighting, such as in London (UK), Santiago (Chile), Beijing (China), Shenzhen (China). Different from the identification criterion, Zhao et al. have recently presented an improved method with associated rules and cluster analysis instead of a one-size-fits-all criterion to identify the busiest transfer stations and obtain the average transfer time [27]. However, the transfer recognition results have not been validated using field data.
To the best of the authors’ knowledge, despite the effectiveness of the previous research method, its potential application to a large-scale transit network that may have wide-range bus frequency and interchange walking distance for each station during different time periods needs some enhancements. To tackle this issue, a spatial-temporal maximum method will be illustrated to determine the dynamic transfer time threshold for each interchange station and time period. Finally, the feasibility of the method is verified with field survey data.

3. Data Collection and Analysis

This research mainly integrates GPS data and SC transaction data from metro or bus systems to identify time-varying station-specific transfer behavior.

3.1. Data Source

At the end of 2017, the total permanent population of Shenzhen was about 12.53 million and about 65.3% are nonregistered migrants, according to the Shenzhen Statistics Bureau [28]. Due to the restriction of car ownership in Shenzhen, the total number of buses and cars was about 2.83 million at the end of 2017, and thus most people only use public transit vehicles for travel [28]. By the end of 2018, there were 985 bus lines with a total length of 20,000 km and a 285 km long metro network with nine lines. The coverage rate of the ground-level bus station within the scope of 500 m is up to 95.3%, and the proportion of public transportation passengers during peak hours amounts to about 60.5% of total travelers [29]. The AFCS by using a smart card for bus travel was deployed by Shenzhen transit agencies in 2004, and the AFCS for the metro system opened in 2005 [30]. Shenzhen’s smart card has been widely used for multifunctional fare payments for bus, metro, taxi, and grocery purchasing. Besides the smart card system, ticket fees can also be paid by one-way tickets, cash, and Quick Response (QR) Code payment for the metro and bus. Particularly, the Shenzhen Traffic Operation Command Center (TOCC) is responsible for the operation and maintenance of the metro and bus SC system.
To analyze the interchange between the metro and bus systems, this study derived the half-monthly SC transaction data of metro and bus system from TOCC on March, 2019. The collected metro data in this study relates to five metro lines (numbers of 1, 2, 3, 4, and 5) which have more than 2.78 million daily data points on average. Moreover, the bus data covers 985 lines and 6319 stations in Shenzhen, with the average daily records totaling more than 3.43 million data points. The collected dataset refers to the identification card number, card type, metro station, bus line number, transaction timestamp, etc. Each bus traveler’s timestamp approximates the time after boarding, while the metro passenger’s timestamp is equal to the leaving time when the passenger passes through the ticket gate. The unique card number for each passenger can help track her/his transfer trip from the metro to the bus system. Notably, different from other cites’ SC systems, such as Singapore and Seoul where both boarding and alighting time and station are recorded, the bus SC system in Shenzhen only records the card number and swiping time. Thus, the missing boarding station and time can be estimated by comparing SC data with GPS data.
In addition, this study also collected bus GPS data, which includes bus line, vehicle ID, the arrival and departure time at each bus station. The related Geographic Information System (GIS) data about metro lines and bus lines comes from open source Baidu Maps (API) in China.

3.2. Data Analysis

Firstly, this paper developed a rule-based data processing method to filter error data as follows: (1) the tag date for entry and exit time is not on the same day; (2) the recorded transaction time exceeds the operation time of the metro or bus system; (3) invalid data is marked “NULL”; (4) passenger holding time in the metro system is longer than 4 h; (5) metro passenger boarding and alighting stations are the same; (6) the interchange time gap from metro to bus is less than 30 s; and (7) the station code cannot be found.
Most researchers usually identify the transfer behavior from metro to bus according to the maximum elapsed time between leaving the metro station and arriving at the bus station. The authors assume that the elapsed time threshold of 30 min for some cities recommended by the literatures might be compatible with Shenzhen transit transfer behavior [21,22,23]. The distribution of transfer trips can be reached by using the previously collected SC data in the city of Shenzhen as shown in Figure 1 and Figure 2. To evaluate the traditional one-size-fits-all criterion, three kinds of scenarios are analyzed as follows:
  • Scenario 1: different time period on the same day of the weekdays (6:00–23:00 on 11–15 March) on March 2019.
  • Scenario 2: weekdays (11–15 March, Monday to Friday) vs. weekends (16–17 March, Saturday to Sunday);
  • Scenario 3: festivals (February 19 was China Lantern Festival, and March 8 was Women’s Day) vs. weekends (17 March was Sunday).
Figure 1 and Figure 2 show the average transfer time and the number of transfer trips identified by the previous method with the constant elapsed time threshold of 30 min under three scenarios. Some interesting findings can be reached as follows:
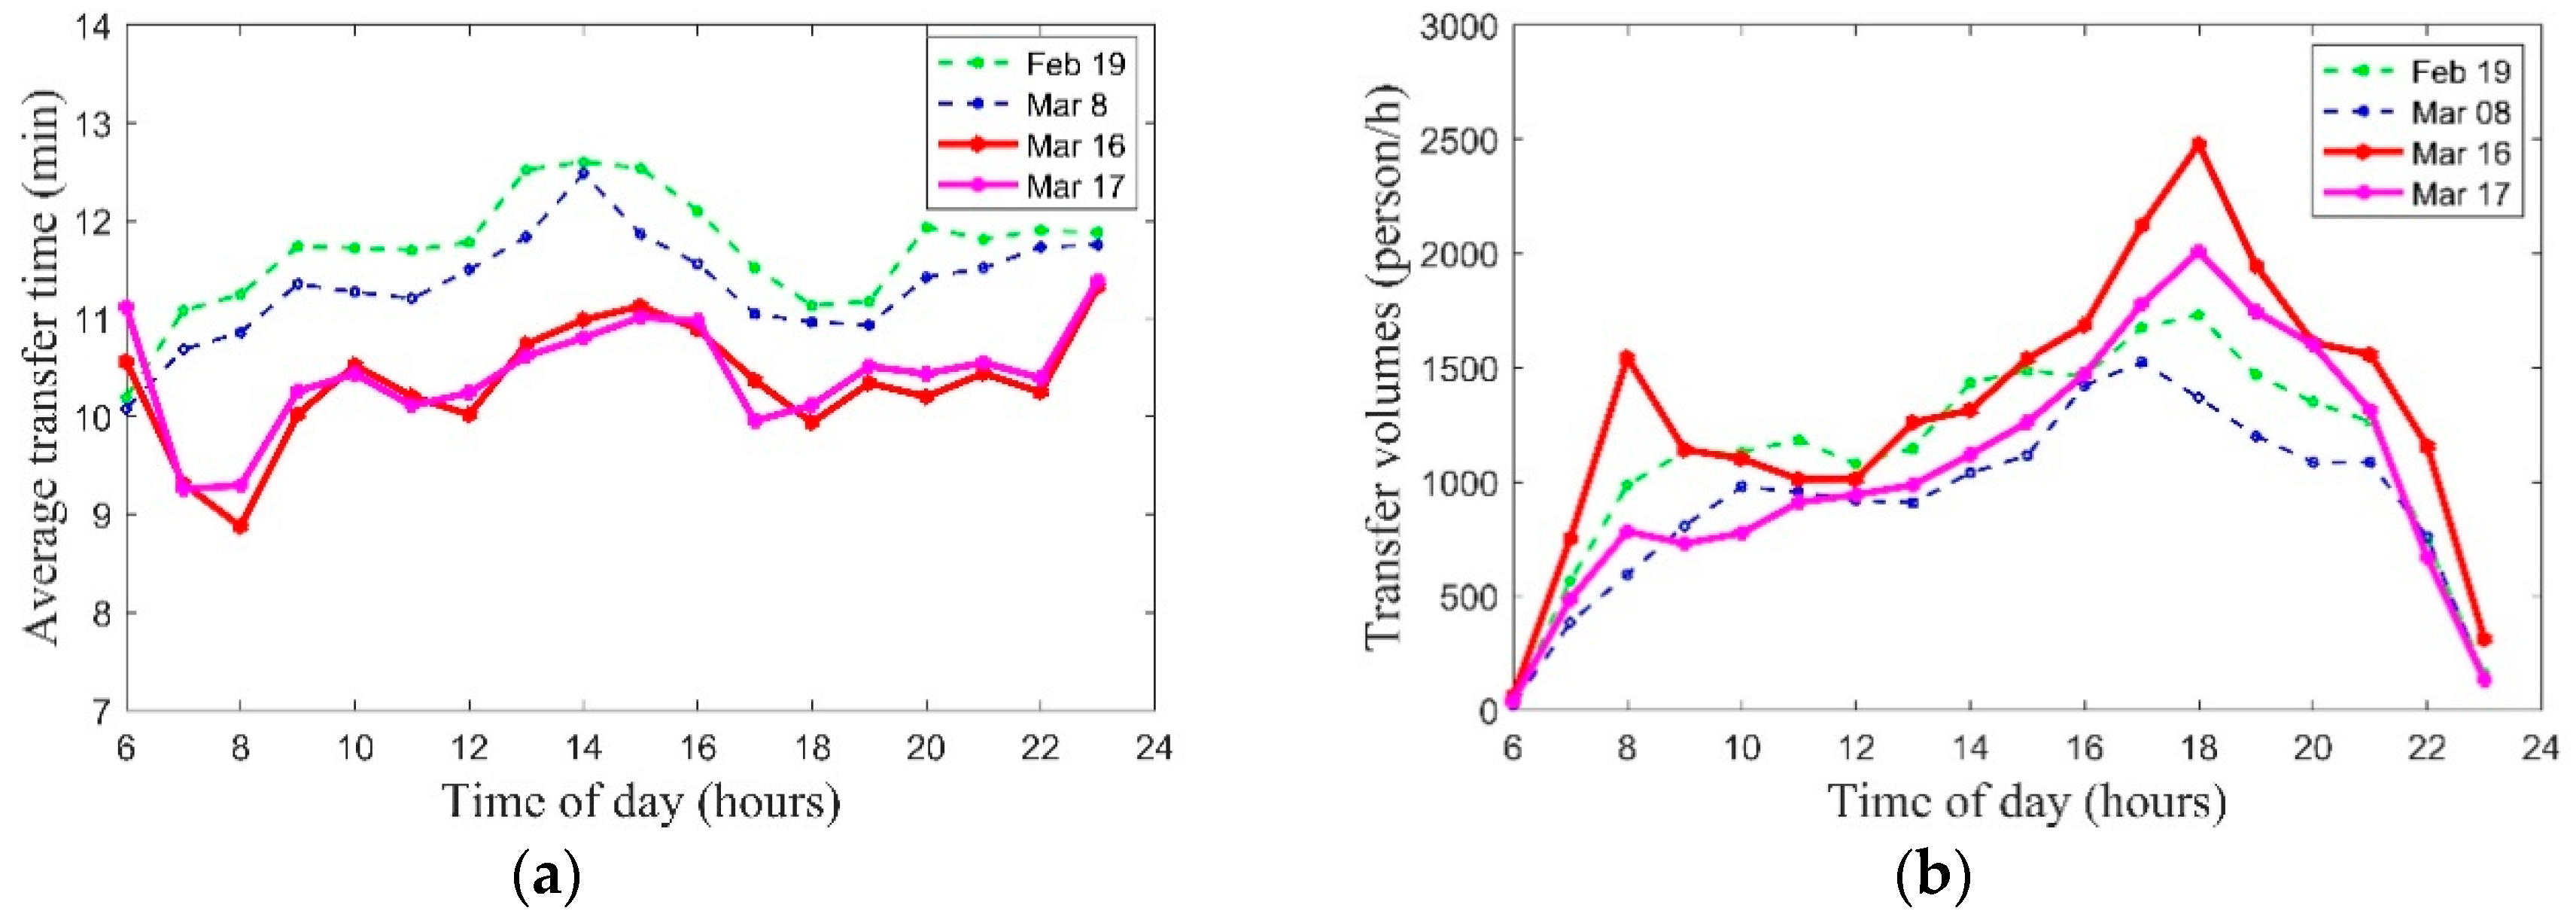
  • The average transfer time and volume per hour are very similar from 7:00 to 21:00 on weekdays. It is consistent with that of Zhao et al. [27], who found that the metro-to-bus transfer is relatively stable throughout the week. However, we also find they significantly fluctuate over different time periods on the same day in Figure 1. Particularly, the difference of average transfer time between 6:00 and 17:00 on 14–15 March is up to 4 min.
  • As shown in Figure 1b, a.m. peak hours are from 7:00–9:00 and p.m. peak hours are from 17:00–19:00, based on estimated transfer volume on weekdays. There is a big difference of transfer behavior between weekdays and weekends in Figure 1b. Especially, the transfer volumes during a.m. and p.m. peak hours on weekdays are much larger than on weekends.
  • Different from weekends, the transfer passengers waste much more travel time from metro to bus at 14:00 on festival days with a maximal time gap about 2 min greater than on weekends in Figure 2a. Moreover, the transfer volumes between 7:00–16:00 at festivals is much higher than on weekends, and the situation is reversed after 16:00 in Figure 2a.
Therefore, it is obvious that the one-size-fits-all criterion is not suitable for each station or all time periods in practice. Meanwhile, it is quite difficult to capture the trend of elapsed time thresholds by using a well-defined mathematic formula due to the large fluctuation of transfer time. Alternatively, this paper proposed a time-varying station-based elapsed time threshold to estimate transfer behavior while considering the following assumptions:
  • The transaction date and time recorded by the smart card system is correct.
  • The elapsed time threshold of each station should be different because they have different configurations, i.e., the layout of metro station, traffic facilities, pedestrian walkways, and transfer distance, etc.
  • The elapsed time thresholds should vary with the time of day and day of week (e.g., peak hours versus off-peak hours) because the passenger transfer time with different travel purposes is diverse, as shown in Figure 1.
  • The elapsed time thresholds should be constant at the same time period at a specific station because the previous average transfer time and volumes are similar, such as peak hours on weekdays in Figure 1.
In conclusion, the proposed transfer identification model should develop temporal-spatial elapsed time thresholds by considering station configurations, traffic patterns, and time periods, etc.

4. Model Development

This study establishes a metro-to-bus interchange behavior identification model with the usage of SC and GPS via data processing, bus boarding estimation, and elapsed time threshold determination.

4.1. Identification Framework

In the context of this research, an interchange (or transfer) is defined as a transition between two consecutive journey stages that does not contain a trip-generating activity [25]. In other words, the metro-based journey and the next bus-based one belong to two stages of the same trip, which are strongly correlated at two dimensions of space and time. Thus, it is possible to estimate this transfer behavior based on the combined dataset from smart cards and GPS.
To distinguish interchange activities from metro to bus, the threshold of time difference between metro alighting and adjacent bus boarding is normally adopted, such as 30 min [21,22,23]. However, the traditional one-size-fits-all criterion is not suitable for each station and all time periods. To do this, the maximum interchange time rule proposed by Gordon et al. is applied [25]. This study developed a new method of having a station-specific elapsed time threshold to extract the accurate interchange information. The structure of the identification method is developed in Figure 3.
Step 1 Join metro SC data and bus SC data into one table.
In Shenzhen, the SC system does not directly record bus boarding station information, so it is necessary to firstly join bus SC data and bus GPS data into a united bus dataset by the descending order of timestamp according to the unique Point of Sale (POS) number recorded by the installed POS terminal.
Step 2 Estimate bus passenger boarding station and time.
In the united bus dataset, one can search for the target location of latitude and longitude from the GPS system when the time difference between bus SC and GPS timestamp reaches the minimum and the bus GPS timestamp is ahead of the SC because the passenger swipes his/her card after the bus vehicle completely stops at the station. Then, it is easy to obtain the boarding station when comparing the geographic coordination of each bus station with the latitude and longitude of the estimated target point.
Step 3 Calculate the time difference between the metro alighting time and bus boarding time.
Metro SC data and bus boarding information are fused together according to the passenger card number, and one can identify possible transfer trips when the distance between the metro alighting station and bus boarding station for each record is less than the user-defined maximal allowable transfer threshold.
Step 4 Identify the elapsed time threshold for each station and time period based on the spatial-temporal constraints.
In the real world, a passenger’s transfer time is influenced by many factors, such as transfer distance, bus frequency, arrival time, and bus overload. To address this problem, this study divides nine combinations of time period including three kinds of time of day (a.m.-peak, p.m.-peak, and off-peak) from three kinds of day of week (weekdays, weekends, and festivals). The metro-to-bus elapsed time thresholds for each station and time period will be obtained according to two rules:
Rule 1: Service area limitation. The service areas of each metro station can be generated according to the maximal allowable nonmotorized distance, such as walking and bike-sharing. Those bus stations within the range of metro station service areas are regarded as candidate interchange targets.
Rule 2: Transfer time limitation. Firstly, we record all passengers’ travel times from the metro station to a candidate bus station which is less than the upper bound of 40 min. Then, the 95th percentile of filtered passengers’ travel time will be regarded as the metro-to-bus elapsed time threshold for the specific time period.
Step 5 Recognize the validated transfer trips based on the developed station-specific threshold with the usage of the smart card dataset (about 2.78 million metro records of 5 lines and 3.43 million bus records of 985 routes are collected every day by TOCC in Shenzhen).
In detail, for the specific metro station and time period, one can estimate all candidate passengers’ transfer times from metro to bus according to Step 1 to Step 3. Then, the metro-to-bus travel will be recognized as a feasible transfer if the passenger travel time is no greater than the elapsed time threshold resulting from Step 4, which can be expressed as follows:
t i j k T i j k
where, tij denotes estimated one passenger’s travel time from metro alighting station i to bus boarding station j during the time period k; and Tijk represents the elapsed time threshold from metro station i to bus station j during the time period k.
The thresholds of all metro stations in a city will be updated once a week to enhance the computational efficiency of passenger transfer time.

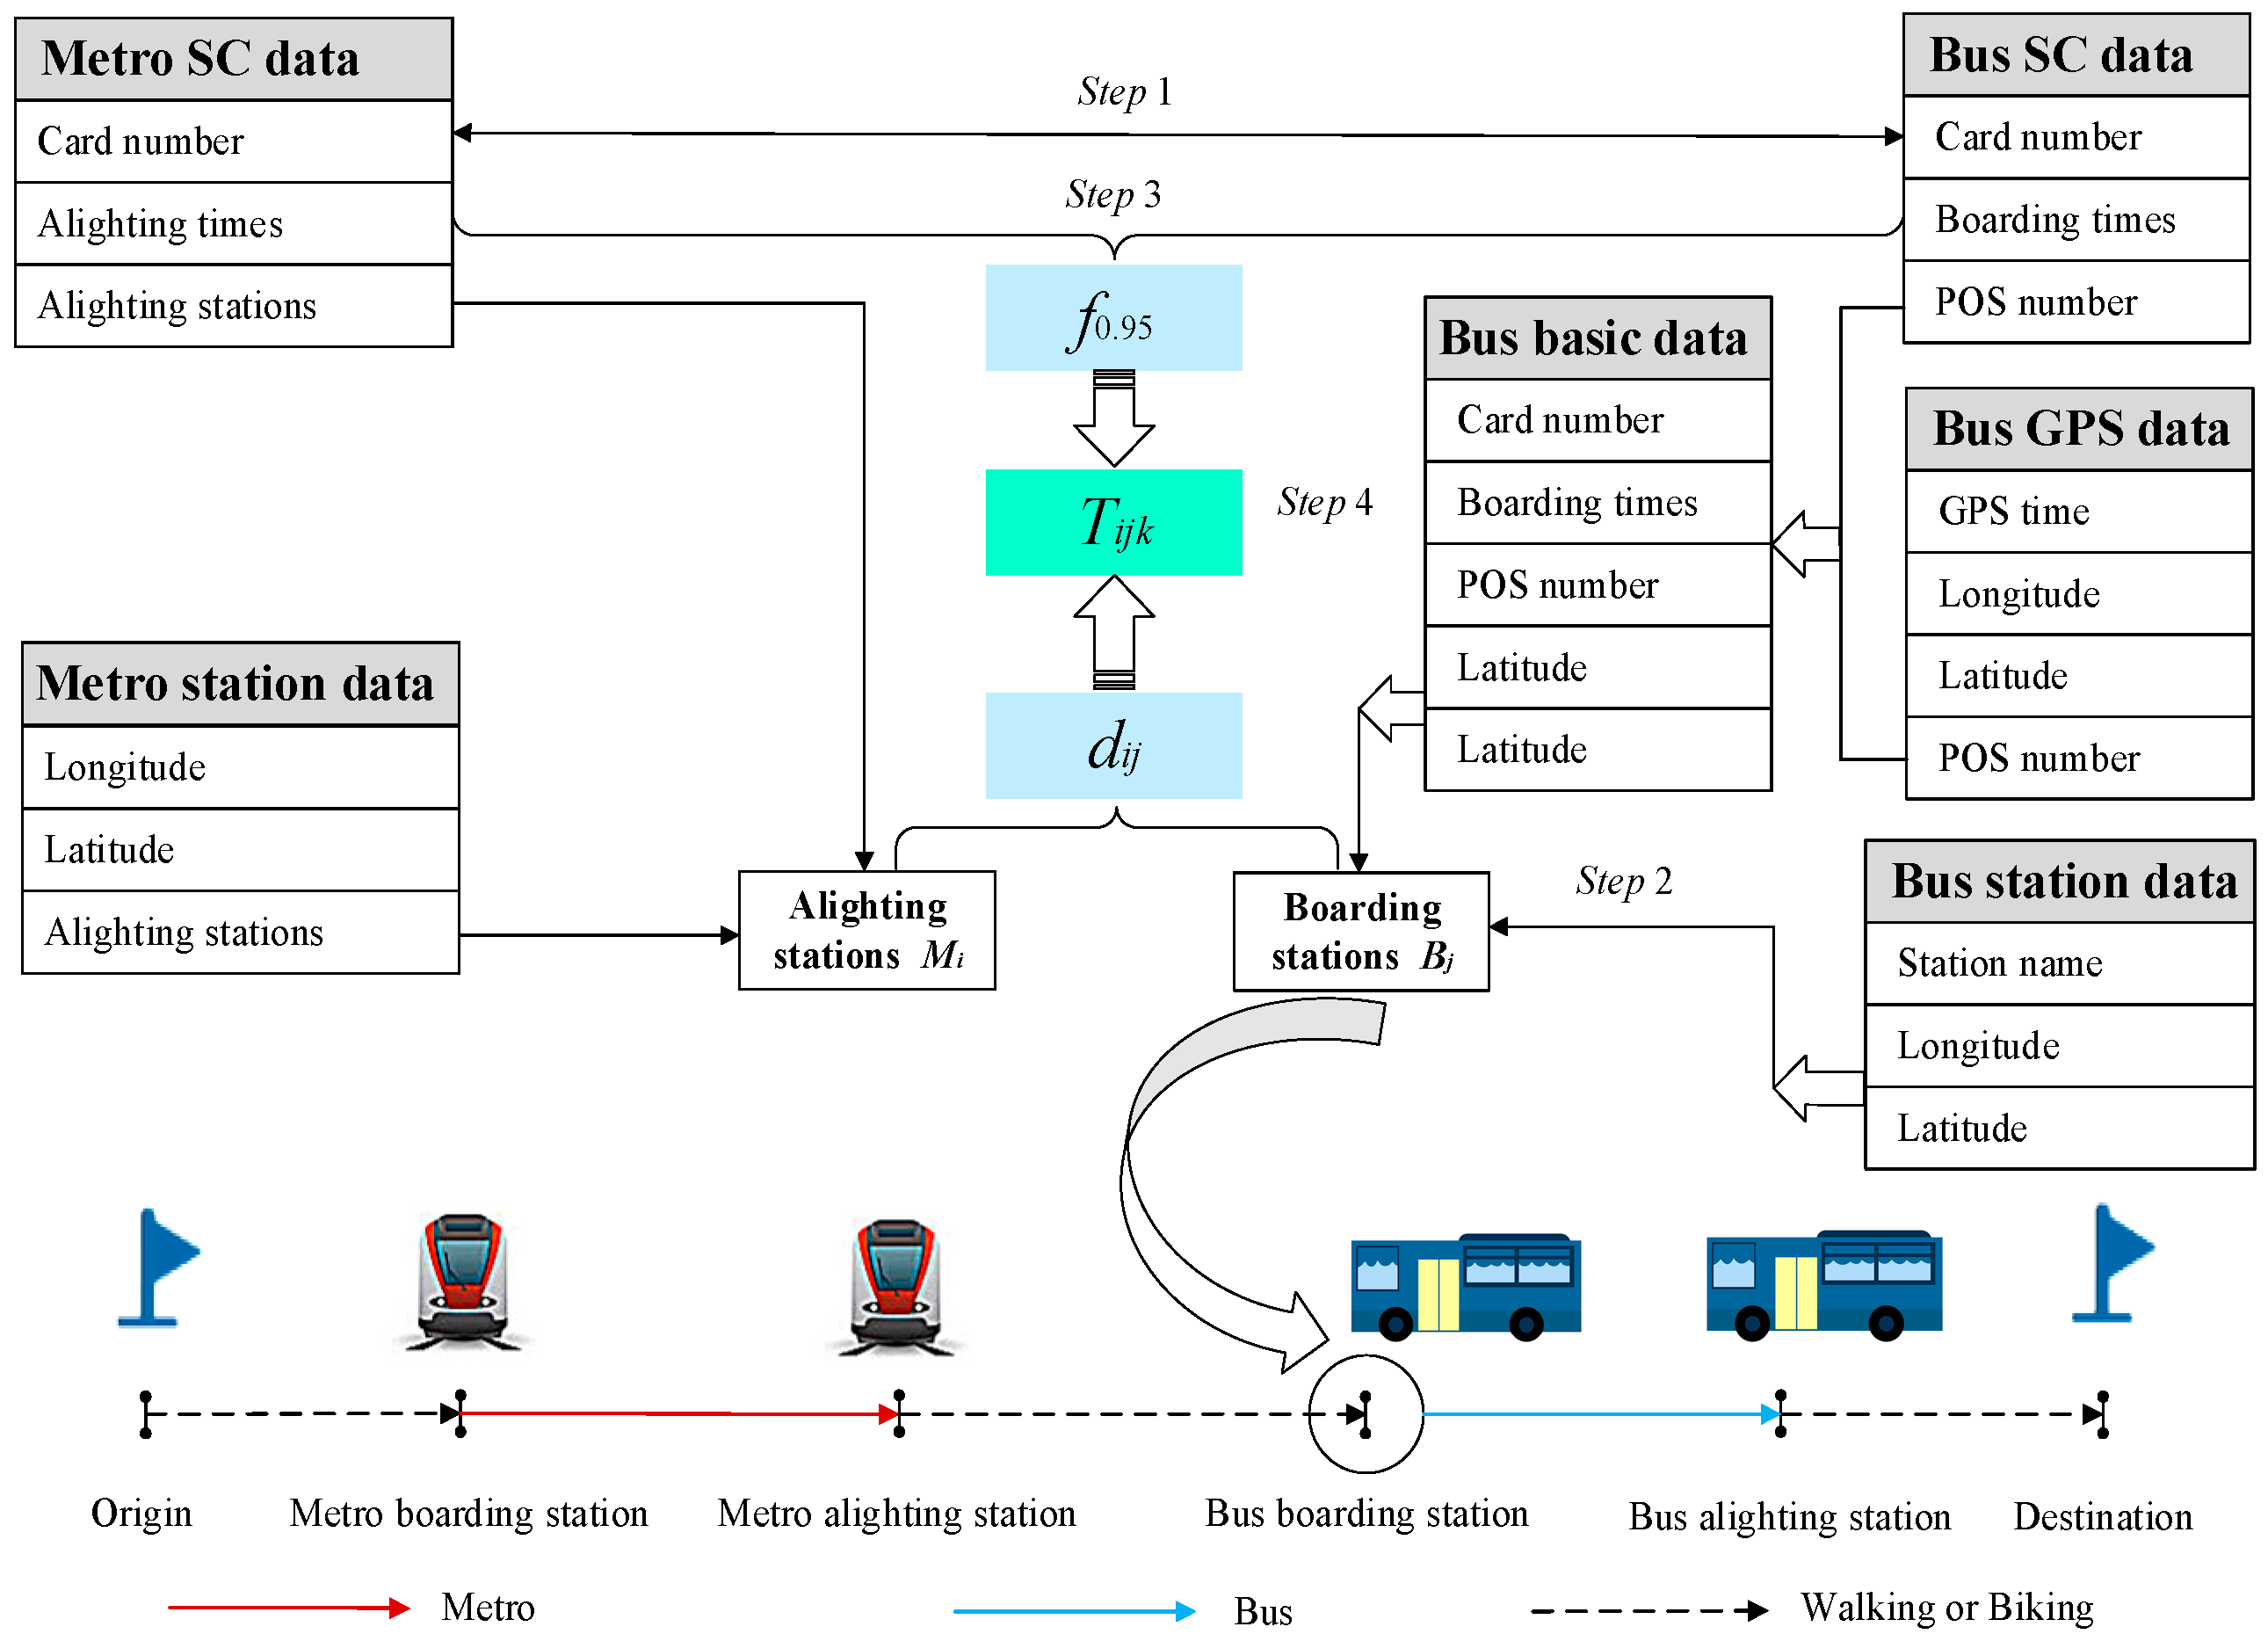
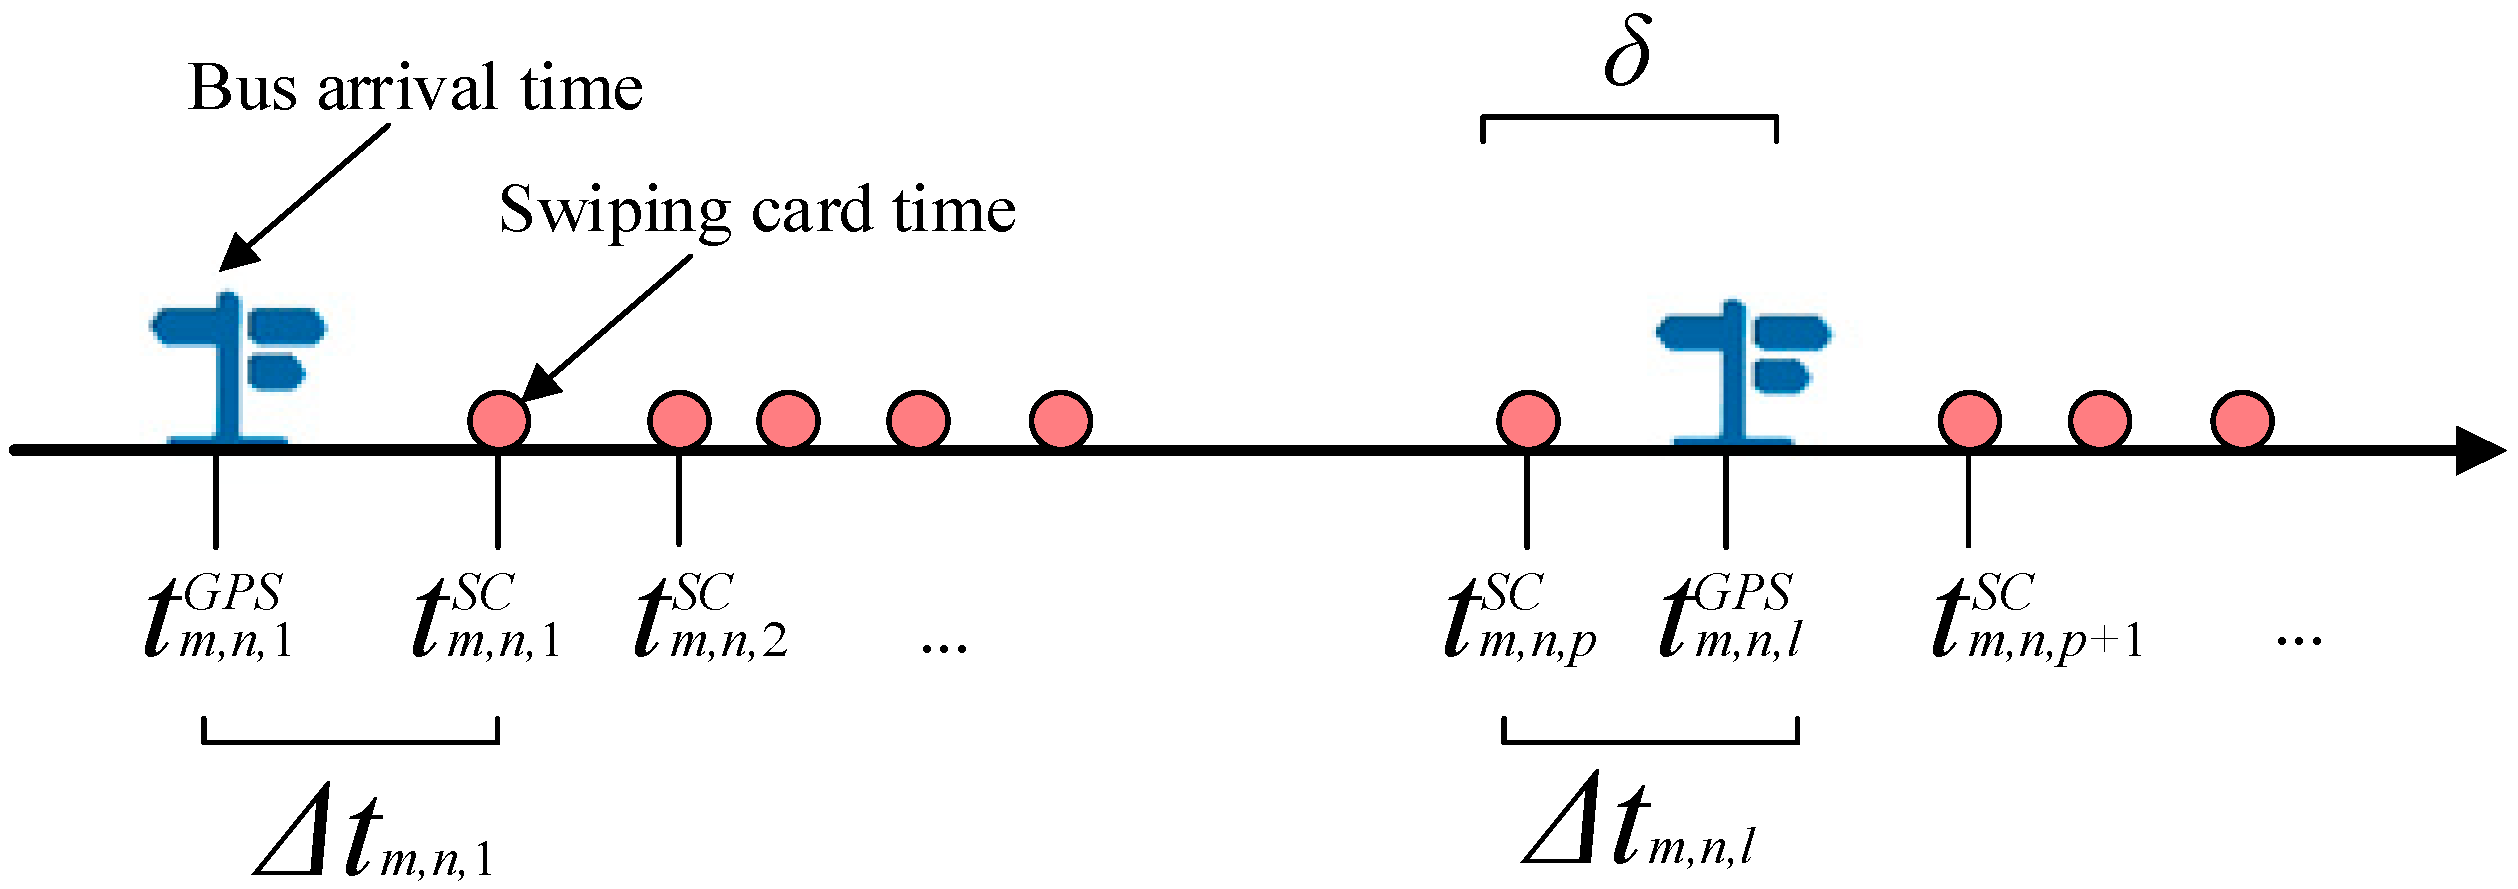
4.2. Bus Passenger Boarding Station Inference

Nowadays, most studies focus on estimating the missing bus alighting station and time by integrating SC data, GPS data, scheduling plans, and others [31]. Different from these previous studies, this study only estimates the boarding stations at which the passengers swipe their smart cards. In practice, this is not difficult to obtain by associating the SC transaction timestamp, the bus vehicle GPS coordination and timestamp, and the static station coordinates.
Normally, the GPS system sends the current timestamp and location in longitude and latitude to the operation center after the bus enters the station. Then, the passengers get on this bus and swipe their smart cards to pay. Finally, the bus vehicle departs from the station and the GPS system records and uploads the bus location and timestamp to the center. Therefore, the passengers’ SC swiping time should be between the bus arrival time and departure time recorded by GPS system. However, some passengers swipe their cards when the bus leaves from the station because they forget it or there is no time to swipe during the morning and evening peak hours due to bus overloading. Figure 4 shows the relationship between the SC timestamp and bus arrival time.
The Shenzhen ground-level bus GPS system dataset records two checkpoints at each station. The first point is the arrival time. Subsequently, it is necessary to estimate the passengers’ boarding station and time because the SC system does not record this information. On one hand, if the passenger’s SC touch time is between the bus n arrival time at station l and that at the adjacent station l + 1, one can assume the current station l is the boarding event. On the other hand, if the passenger’s SC touch time is a little earlier than the bus n arrival time at station l but the time difference is less than the user-defined elastic time δ, it is also considered that the passenger takes this bus vehicle n at station l. The passenger’s boarding station in the two previous scenarios can be expressed as below:
l m , n , p B = l ,   if   t m , n , l G P S t m , n , p S C < t m , n , l + 1 G P S   or   ( t m , n , l G P S > t m , n , p S C   and   t m , n , l G P S t m , n , p S C δ )
where, l m , n , p B denotes the passenger’s p boarding station while taking bus vehicle n belonging to route m; t m , n , p S C means the SC swiping time of the passenger p; t m , n , l G P S is the bus n arrival time at station l recorded by the GPS system; and δ is the user-defined elastic time.

4.3. Elapsed Time Threshold Determination

As in Figure 1 and Figure 2, the elapsed time threshold should vary with the time of day and day of the week. To distinguish interchange trips from metro to bus, a two-stage method is proposed to determine a dynamic elapsed time threshold between metro alighting and bus boarding with consideration of station layout, spatial restrictions, and time periods.

4.3.1. First Estimation Based on Rule 1

From a spatial point of view, the metro-to-bus interchange behavior involves metro alighting station/time, and bus boarding station/time. The distance between the metro alighting station and the bus boarding station can be expressed as follows [32]:
d i , j = R × arccos ( sin ( l a t 1 ) sin ( l a t 2 ) + cos ( l a t 1 ) cos ( l a t 2 ) cos ( l o n 1 l o n 2 ) ) * π / 180
where, lat1 and lon1 denote the latitude and longitude of the metro station, respectively; lat2 and lon2 represent the latitude and longitude of the bus station, respectively; and R is the radius of the earth. In the study, R was set to 6378.137 km.
Generally, the passenger interchange behavior between metro stations and other feeding traffic modes occurs in the service area of metro stations [23]. In other words, the transfer distance between the metro alighting station and bus boarding station should not exceed the user-defined distance threshold as follows:
d i j D i
where, dij denotes the transfer distance between the metro alighting station i and the bus boarding station j; Di is the maximal allowable travel distance of transfer trips at metro station i, depending on the public transportation network and travelers’ personal characteristics.

4.3.2. Second Estimation Based on Rule 2

Existing literature has reported that the metro-to-bus transfer time follows a lognormal distribution [20]. The probability density function (PDF) can be expressed as follows [33].
f ( x ; μ , σ ) = 1 x σ 2 π e ( ln x μ ) 2 / 2 σ 2
where, μ is the mean of transfer time; σ denotes the variance; and x is the transfer time for each passenger.
Statistically, it is feasible to take the 95th percentile of the cumulative distribution function (CDF) for transfer time distribution in Equation (5) as the metro-to-bus elapsed time threshold for the specific time period. Alternatively, one can replace the distribution function in Equation (5) with the huge data records of passenger transfer times estimated by the previous methods in Figure 3. Therefore, it is appropriate to take the 95th percentile of the estimated transfer time dataset in an ascending order as the metro-to-bus elapsed time threshold, as shown in Equation (6).
T i j k = f 0.95
where, f0.95 is the 95th of the estimated transfer time dataset in an ascending order with the usage of huge SC and GPS dataset. In addition, Jang found that almost all transfer trips have a transfer time of less than 40 min [34]. Therefore, estimated transfer times greater than 40 min are deleted in this paper. Finally, the 95th percentile of filtered passengers’ travel time is regarded as the metro-to-bus elapsed time threshold for the specific time period.

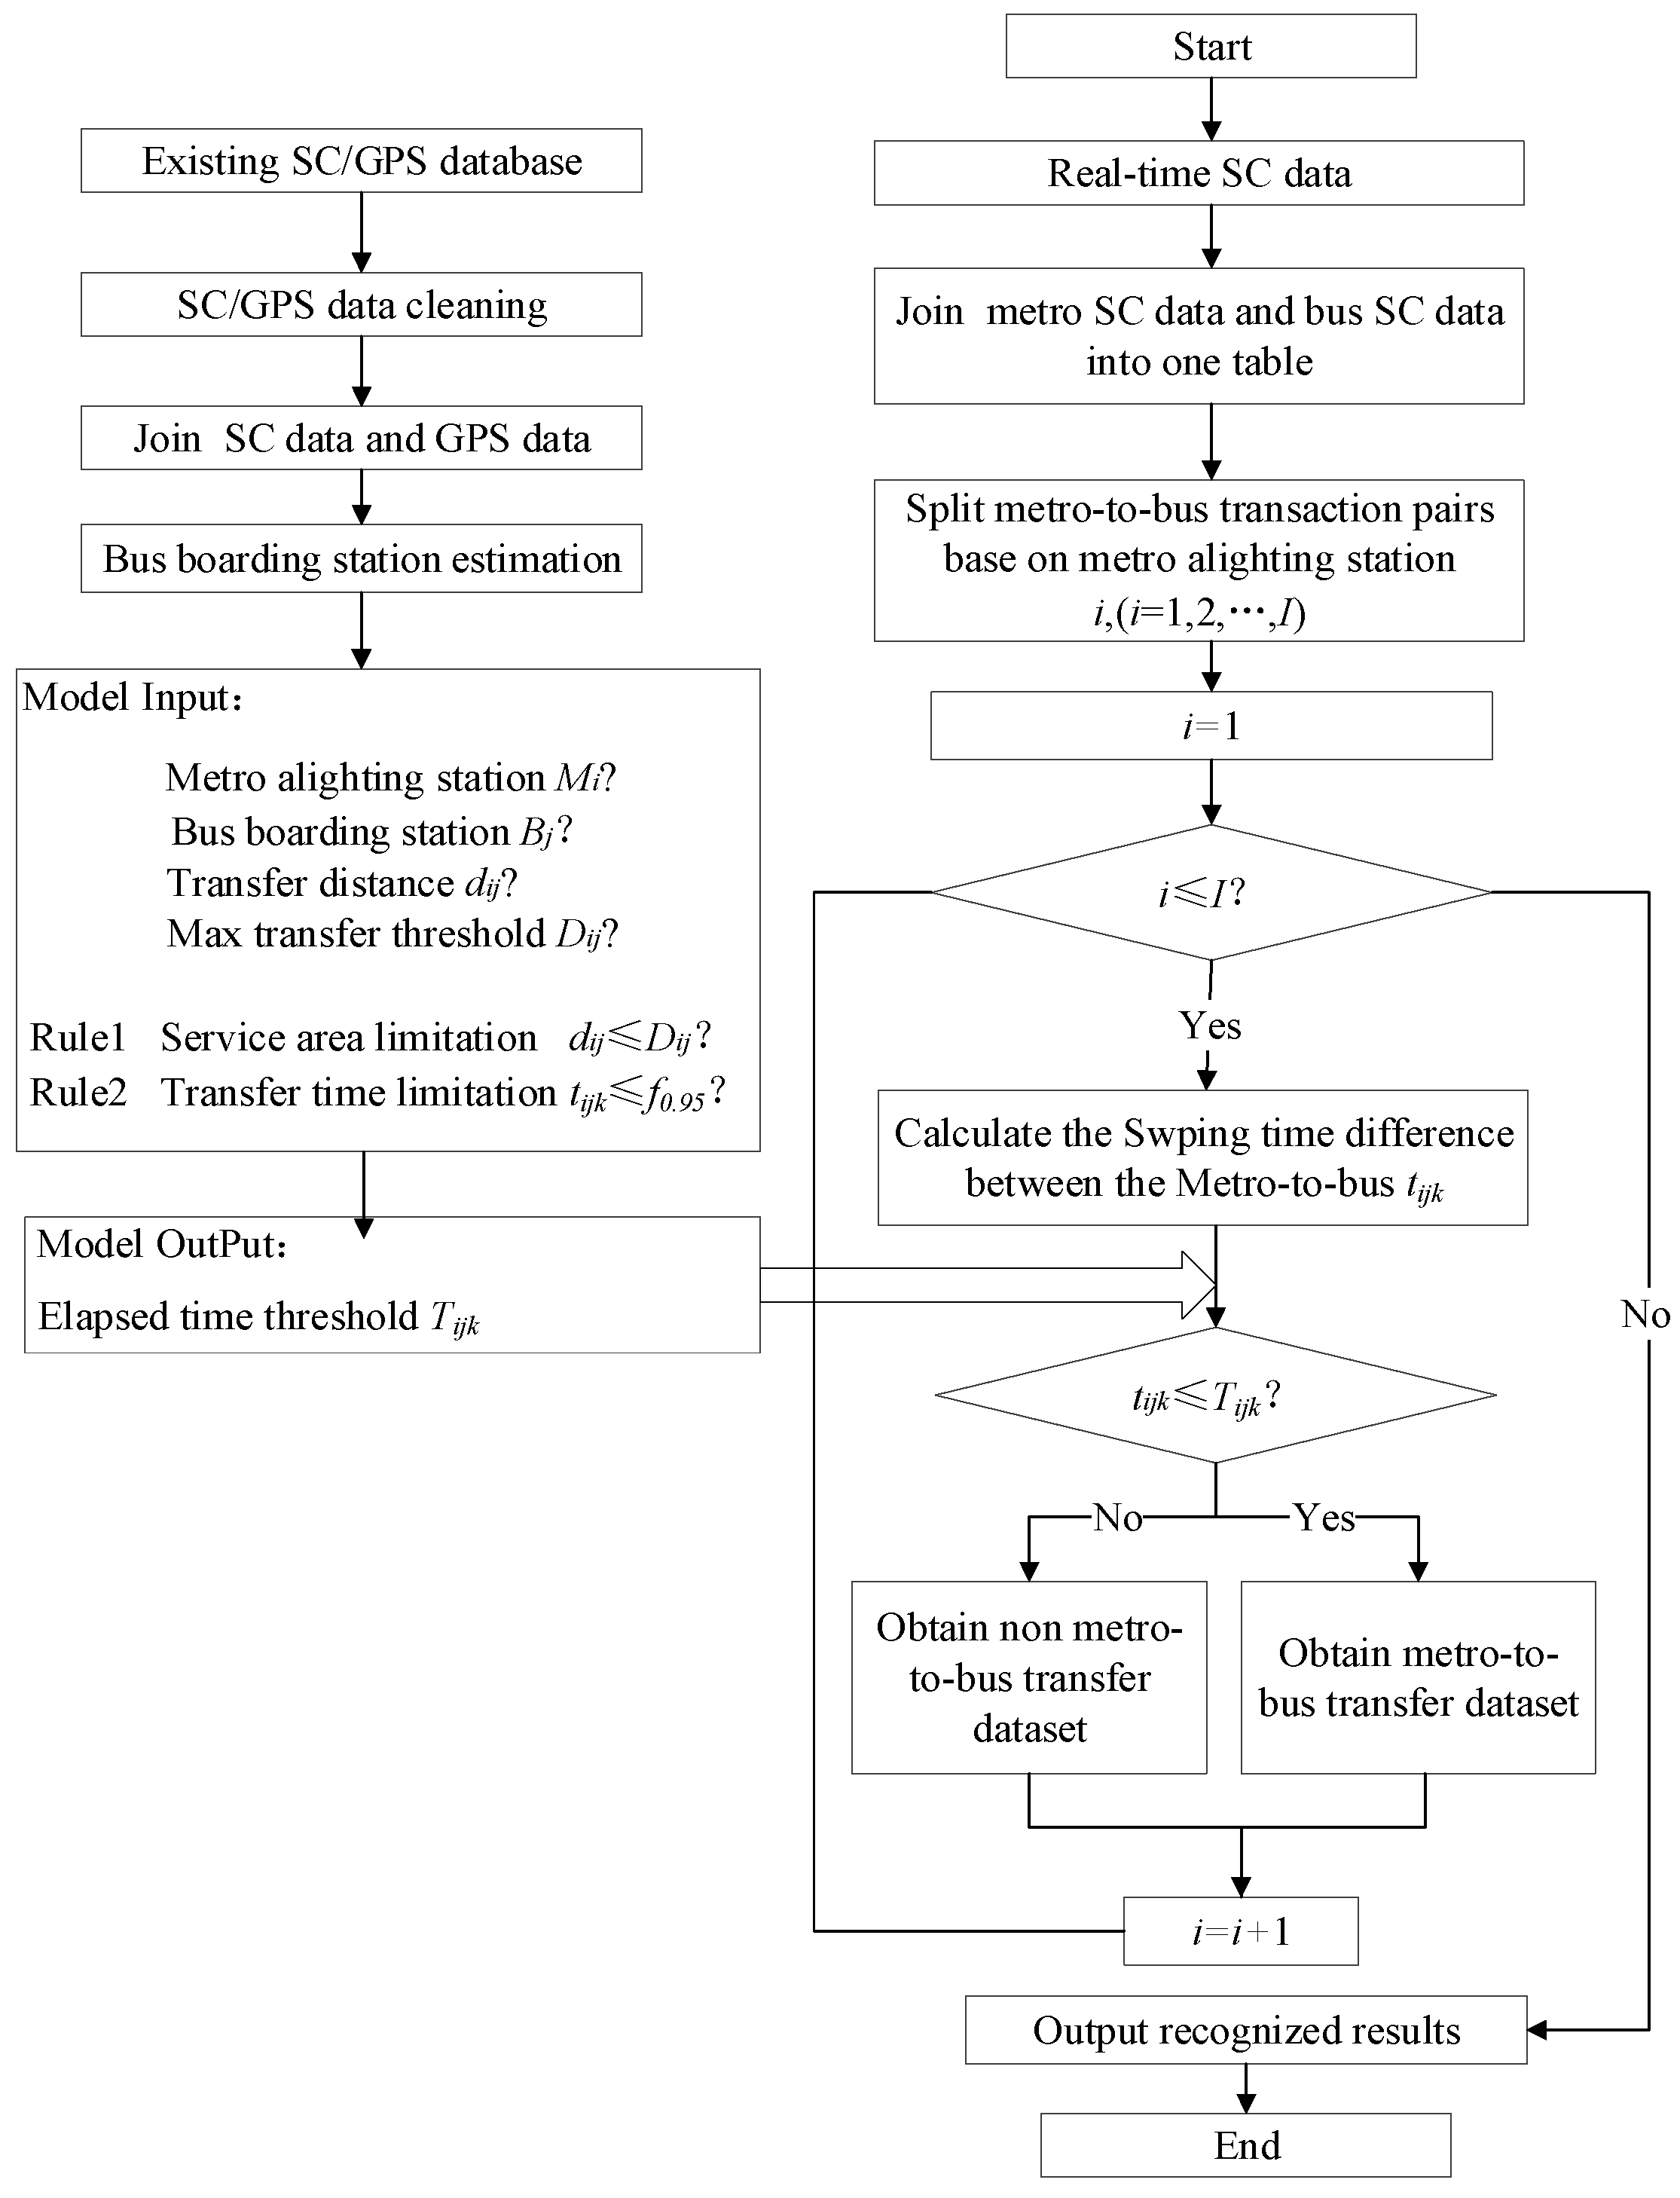
4.4. Solution Algorithm

Figure 5 shows the flow chart of the entire data processing and transfer trip extraction by the proposed identification method. The left-hand side of the flow chart illustrates how the elapsed threshold time is derived from SC data and GPS data. Firstly, the SC data and GPS data are filtered to eliminate error records. Then, bus SC data and GPS data are joined together according to POS number, and one can estimate the passenger’s bus boarding stations. Finally, the elapsed time threshold for each station and time period is determined based on the two rules.
Moreover, the right-hand side of the flow chart shows how to identify metro-to-bus transfer behavior by using collected SC data and GPS data. It is very time-consuming to estimate the elapsed time threshold for all city-level stations and time periods with the usage of citywide metro and bus datasets. For example, on a PC with a 2.2 GHz, Intel i5-8500 CPU with 8 GB RAM, and Windows 10, 64-bit operating system, it took 2.9 h to generate a metro-to-bus elapsed time threshold for all metro stations within a one-week dataset of Shenzhen, including 42.69 million SC records.

5. Case Studies

To illustrate the efficiency and applicability of the proposed identification method, this study developed a C++ program with the opensource MYSQL database to conduct a complete case study with the usage of metro and bus datasets in Shenzhen. The collected dataset covered four metro-to-bus stations belonging to Metro Line 1 (Guomao Station, Shenzhen University Station, Daxin Station, and Airport East Station) with respect to both weekdays (morning peak hours, evening peak hours, off-peak hours) and weekends from 11 March to 24 March 2019. The detailed descriptions of the six scenarios are summarized in Table 1.

5.1. Validation with Person Trip Survey Data

In the case study, in order to validate the developed recognition method, the key parameters Dij and δ in this study are set to be 1000 m and 30 s, respectively [25].

5.1.1. Survey Data Collection

This paper conducted an on-site survey to statistically validate the developed elapsed time threshold for each station and time period.
The authors recruited of eight local volunteers and collected field transfer data at four metro stations in Shenzhen. The survey time included two periods: (1) 7:00–9:00 on 21–22 March (Thursday and Friday), 2019; and (2) 18:00–20:00 on 23–24 March (Saturday and Sunday), 2019. Every two volunteers were assigned into one group, where one person was in charge of recording major passengers’ swiping card time, and the other was responsible for counting transfer volume.
In the real-world survey, all volunteers firstly recorded the alighting time of the majority of passengers at one exit of each metro station, and followed them to the ground-level bus station. Then, our volunteers recorded the passengers’ boarding time on the specific bus line. Next, they returned to the next metro station exit and repeated the process. To eliminate random errors, the volunteers were required to replicate the survey several times for each metro exit while covering all exiting gates of four stations (five exits at Guomao Station, six exits at Shenzhen University Station, five exits at Daxin Station, and four exits at Airport east Station).

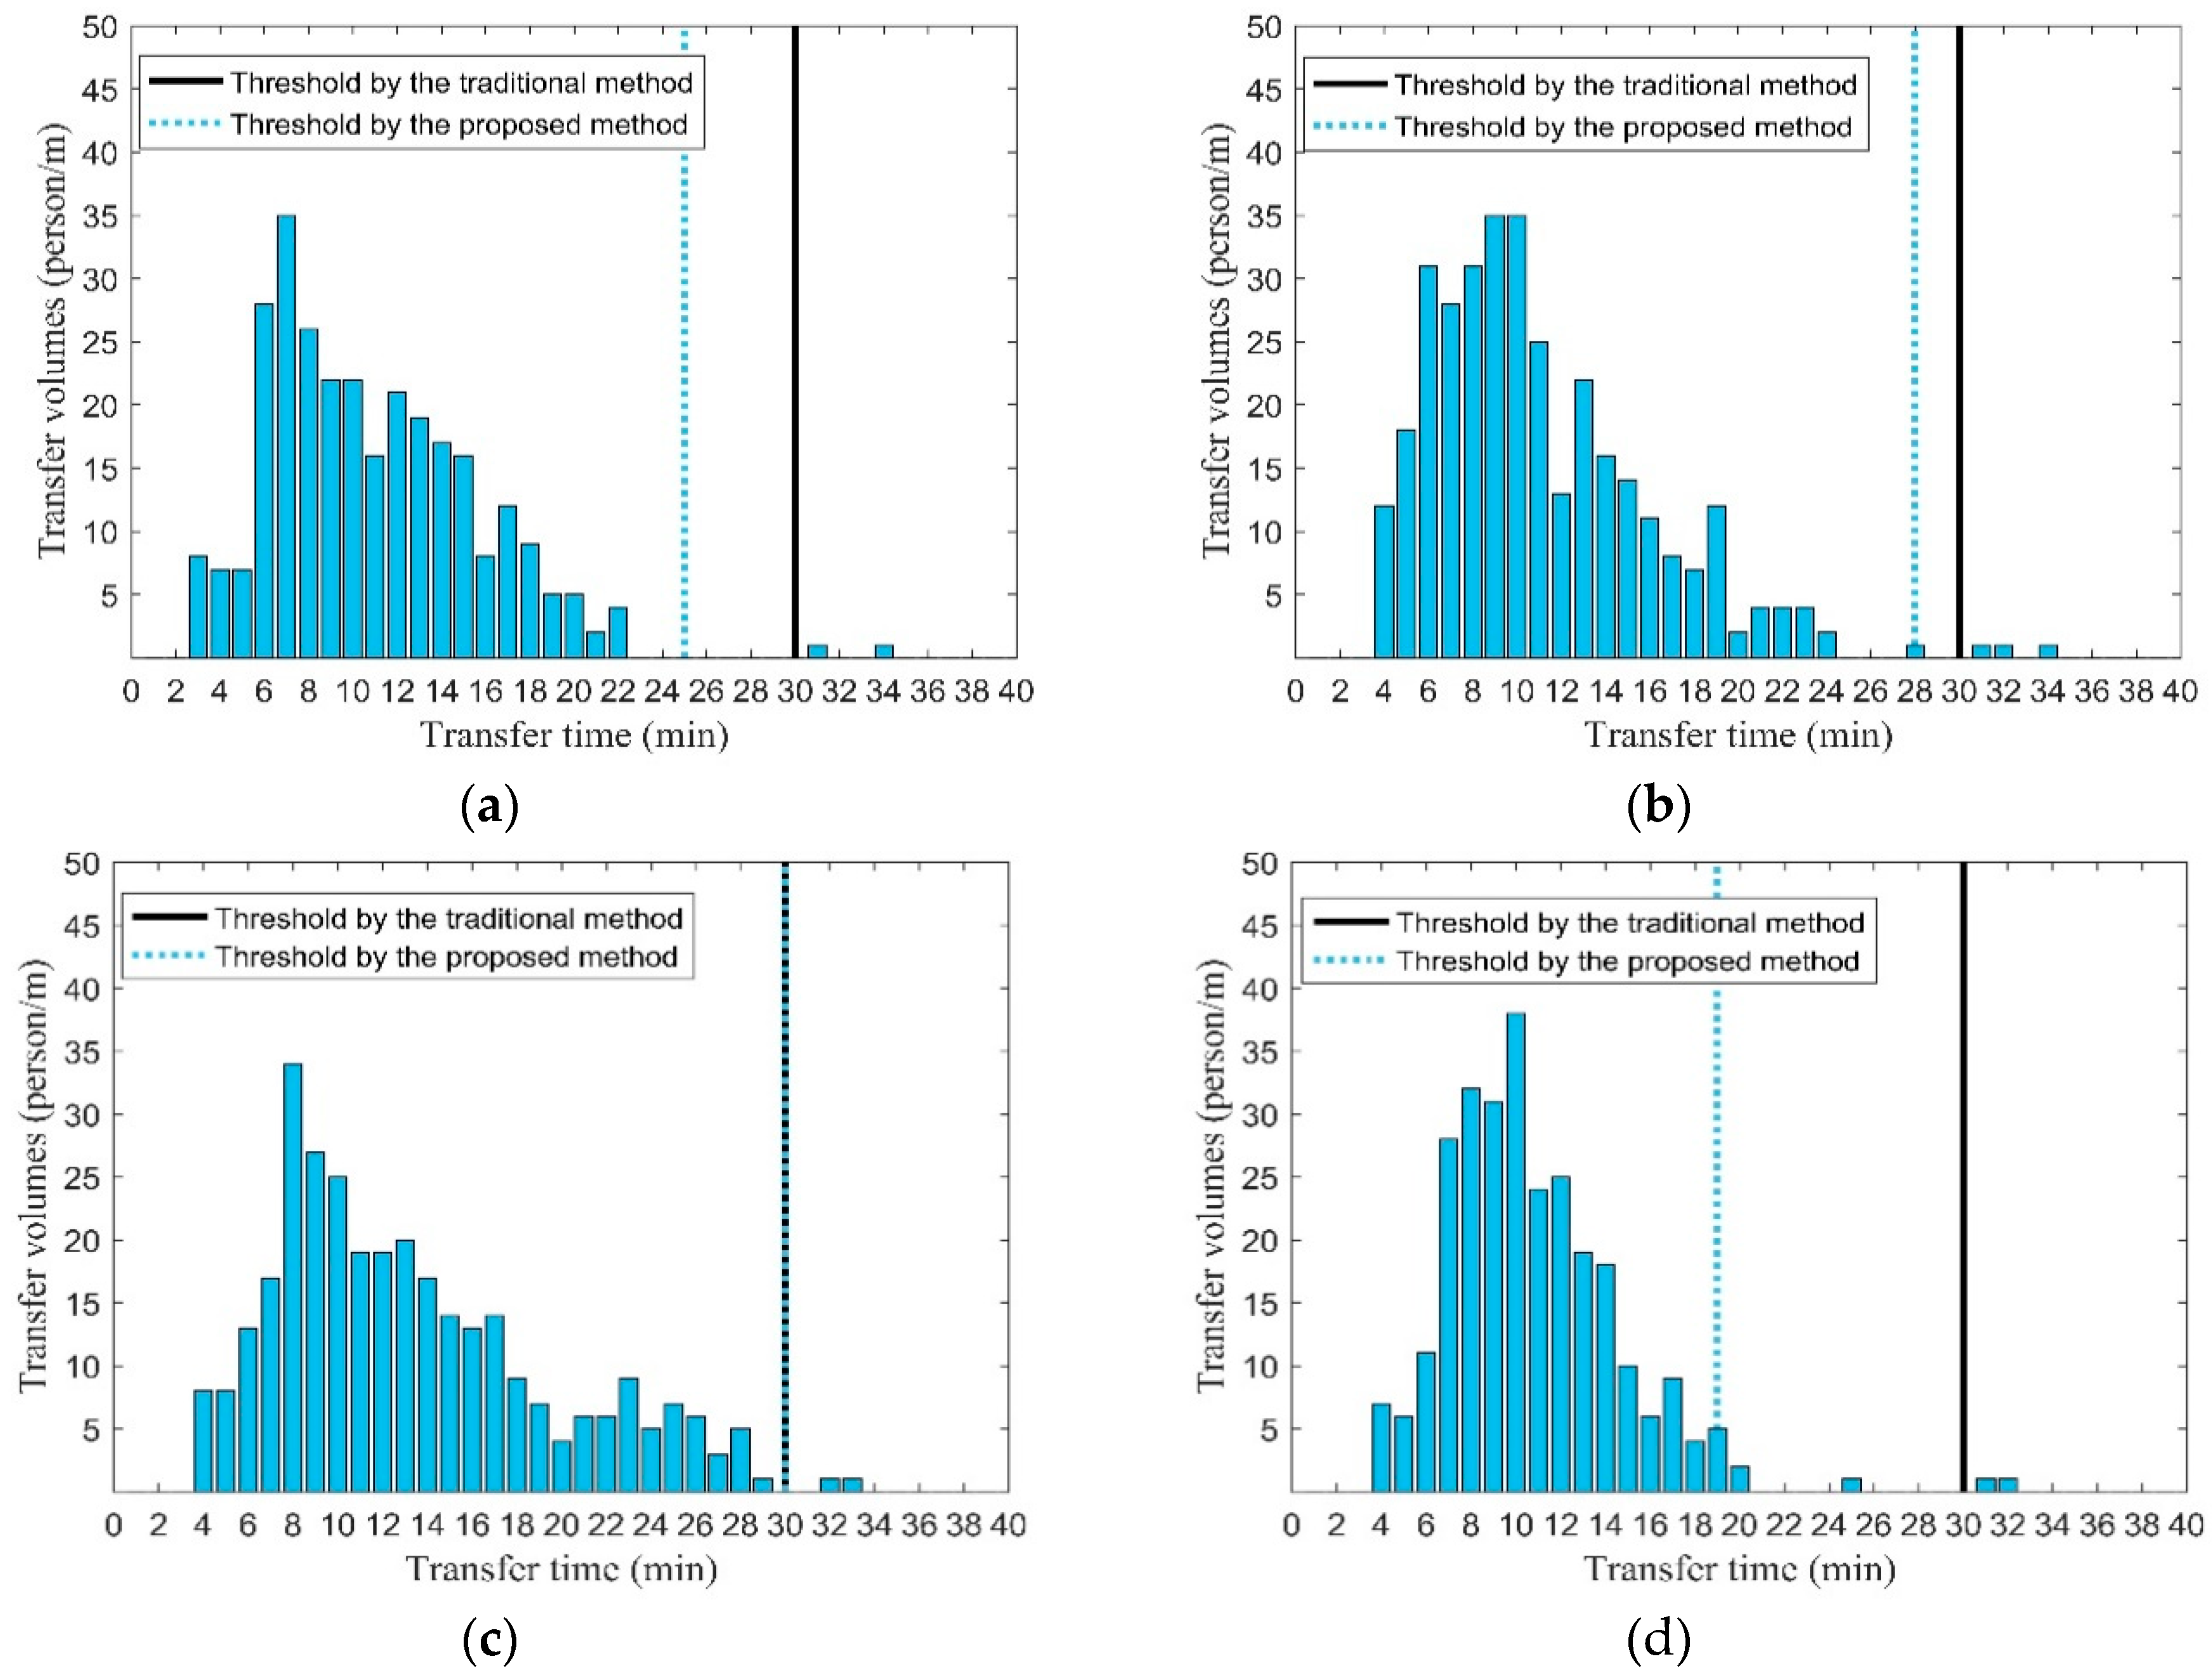
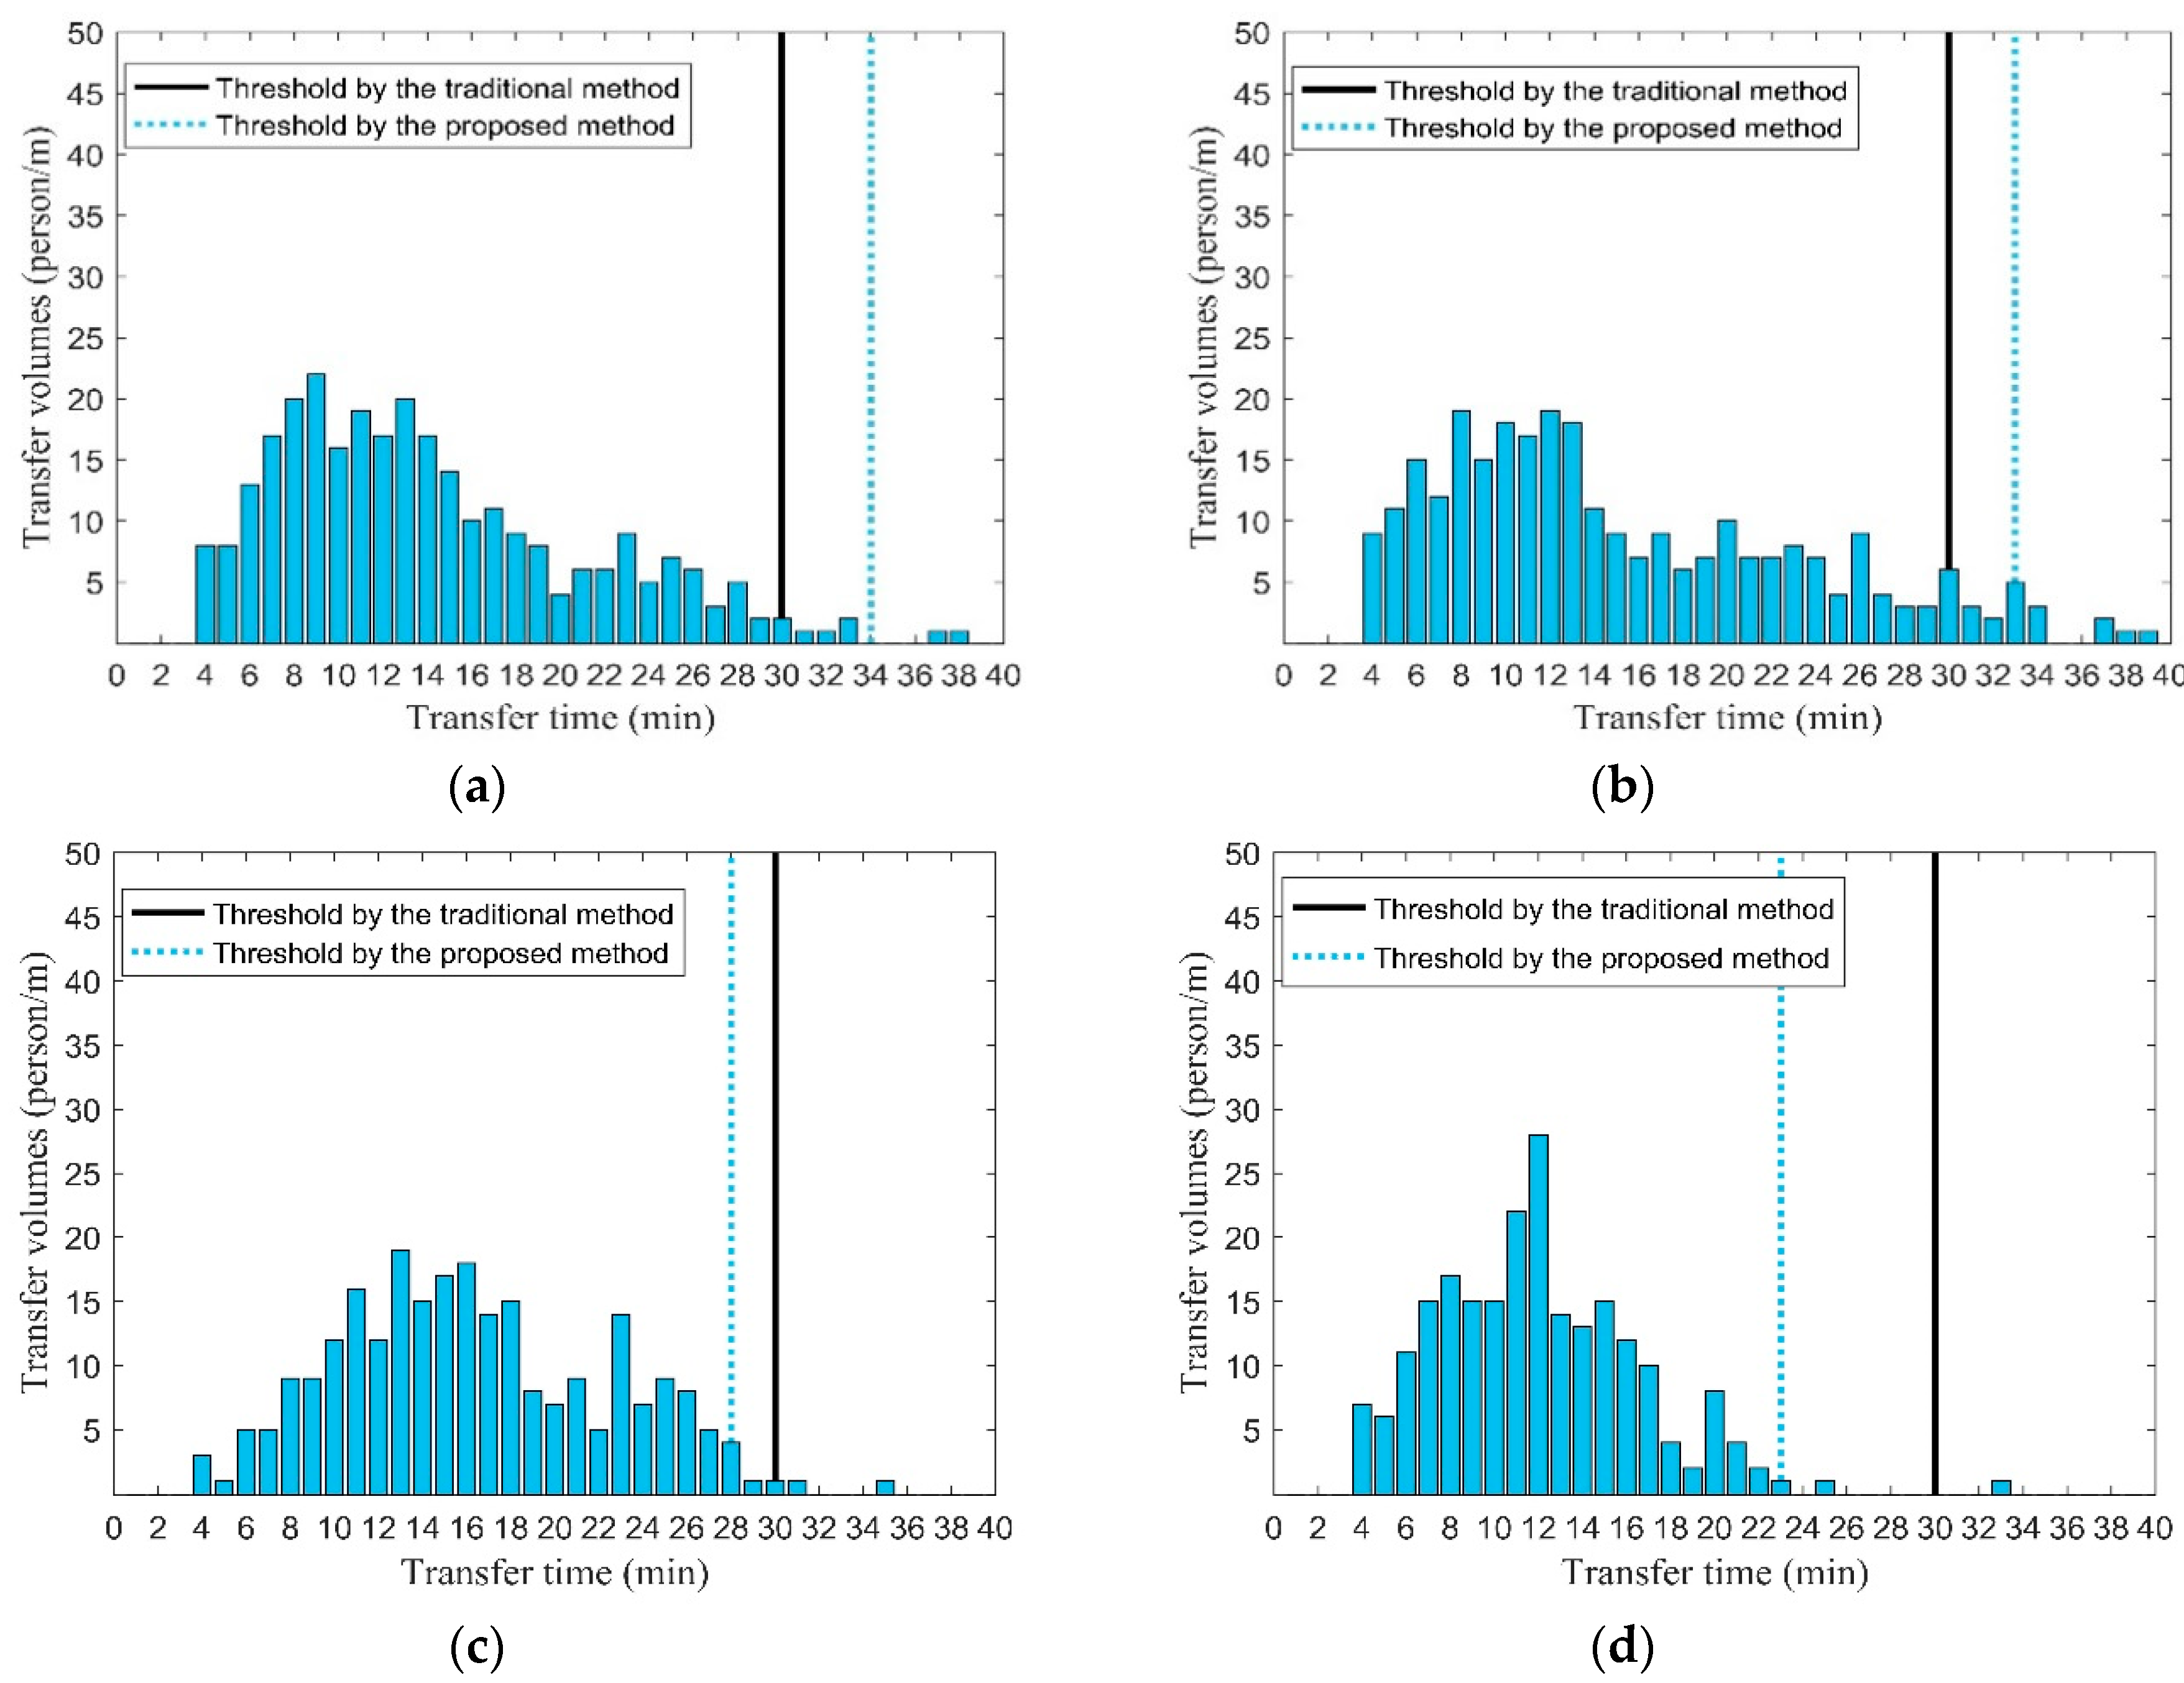
5.1.2. Elapsed Time Threshold Estimation with SC and GPS Data

To validate the effectiveness of the proposed method, the SC data and GPS data at 7:00–9:00 on 11–15 March and 18:00–20:00 on 16–17 March was assessed. The metro-to-bus transaction pairs at 7:00–9:00 on 11–15 March and 18:00–20:00 on 16–17 March at these four metro stations were filtered by Rules 1 and 2, and the CDF curves are drawn as shown in Figure 6 and Figure 7. The estimated results show that the 95th quantile of the CDF curves for the specific stations during different time periods is basically the same, which proves that the method has better robustness. Further, the average of the 95th quantile of different time periods is estimated as the elapsed time threshold for each scenario in Table 2, which is used to identify passengers’ transfer trips.

5.1.3. Comparisons and Analysis

In the survey experiments of this study, the volunteers collected a total of 2275 passenger transfer trips from metro to bus. Figure 8 and Figure 9 show the distribution of metro-to-bus passenger transfer time derived from the survey data. Statistically, it is easy to assess whether two independent samples belong to the same distribution via hypothesis testing or not. The Mann–Whitney U test, which is also known as the Wilcoxon rank sum test, is a much better nonparameter test to identify the difference between two groups than the t-test [35]. Therefore, this study employed the U test to conduct a significance analysis between passenger transfer trips extracted by two methods (the dynamic threshold by this study and static one of 30 min) and on-site survey data. As shown in Table 3, the columns of survey data are the field-measured metro-to-bus statistic transfer data of partial passengers sampled by the eight local volunteers, and the other columns represent the statistic results of all transferred passengers recognized by the dynamic model in this study (Table 2) and the static model with the one-size-fits-all criterion elapsed time threshold of 30 min, respectively. The row data of volume means the total number of transfer trips at the specific time period and metro station, and the average or variance represents the statistical value of all trips, respectively. Notably, the surveyed transfer volume is much smaller than the two others because the volunteers could only track a fraction of the transferring passengers in practice. Therefore, our focus is to test the statistical gaps between the three data sources.
  • From the U test results, the transfer results obtained by the two recognition methods are not significantly different from the survey data at 7:00–9:00 on 21–22 March and 18:00–20:00 on 23–24 March because all p values are greater than 0.05. In particular, the p value obtained by the developed dynamic model in this paper is improved by 0.04 and 0.23 compared to the traditional static method at 7:00–9:00 on 21–22 March and 18:00–20:00 on 23–24 March, respectively. These improvements indicate that the station-specific transfer recognition in this study has greater accuracy and reliability to capture actual transfer trips than the one-size-fits-all criterion.
  • The average transfer trip time of the two recognition methods are a little less than that of the surveyed data. Especially, the estimated average transfer time of four metro stations at 7:00–9:00 on 21–22 March in this study is much smaller than the traditional method because the transfer time thresholds identified in this study are less than 30 min. On the contrary, the means of transfer time in this study at 18:00–20:00 on 23–24 March are greater and the thresholds of the previous method are greater than 30 min. Hence, the dynamic station-specific recognition method can effectively identify the actual interchange behavior of the majority of bus passengers and remove the few transfer trips which have other purposes, such as shopping or business holding near the metro or bus station.

5.2. Identification Performance Analysis

Based on the previous accuracy analysis, the proposed model outperforms the traditional one-size-fits-all criterion. To further evaluate application to different stations and time periods, this section selects the number of transfer trips for MOE. Table 4 shows the dynamic elapsed time thresholds of four stations under six scenarios estimated by this paper. All recommended thresholds range from 18 min to 35 min. The corresponding transfer volumes for each scenario are calculated from the SC data of 21 March and 23 March as shown in Table 5. Similar to Table 3, the static model uses the traditional one-size-fits-all criterion of 30 min, and the dynamic one employs the specific-station threshold estimated by this paper.
The total transfer volume recognized by this study is re less than that of the traditional static method during the morning and evening peak hours on weekdays, such as scenario S1, S2, S4, and S5. The main reason may be that commuters are highly concentrated due to work-related activities during peak hours, and thus they prefer taking transfer-time-saving routes. On the contrary, the fluctuation in passengers’ transfer time distribution is very high and diverges during the nonpeak hours, and the identified transfer time thresholds are greater than 30 min under scenarios S3 and S6, which means that the off-peak travelers consume more transfer time.

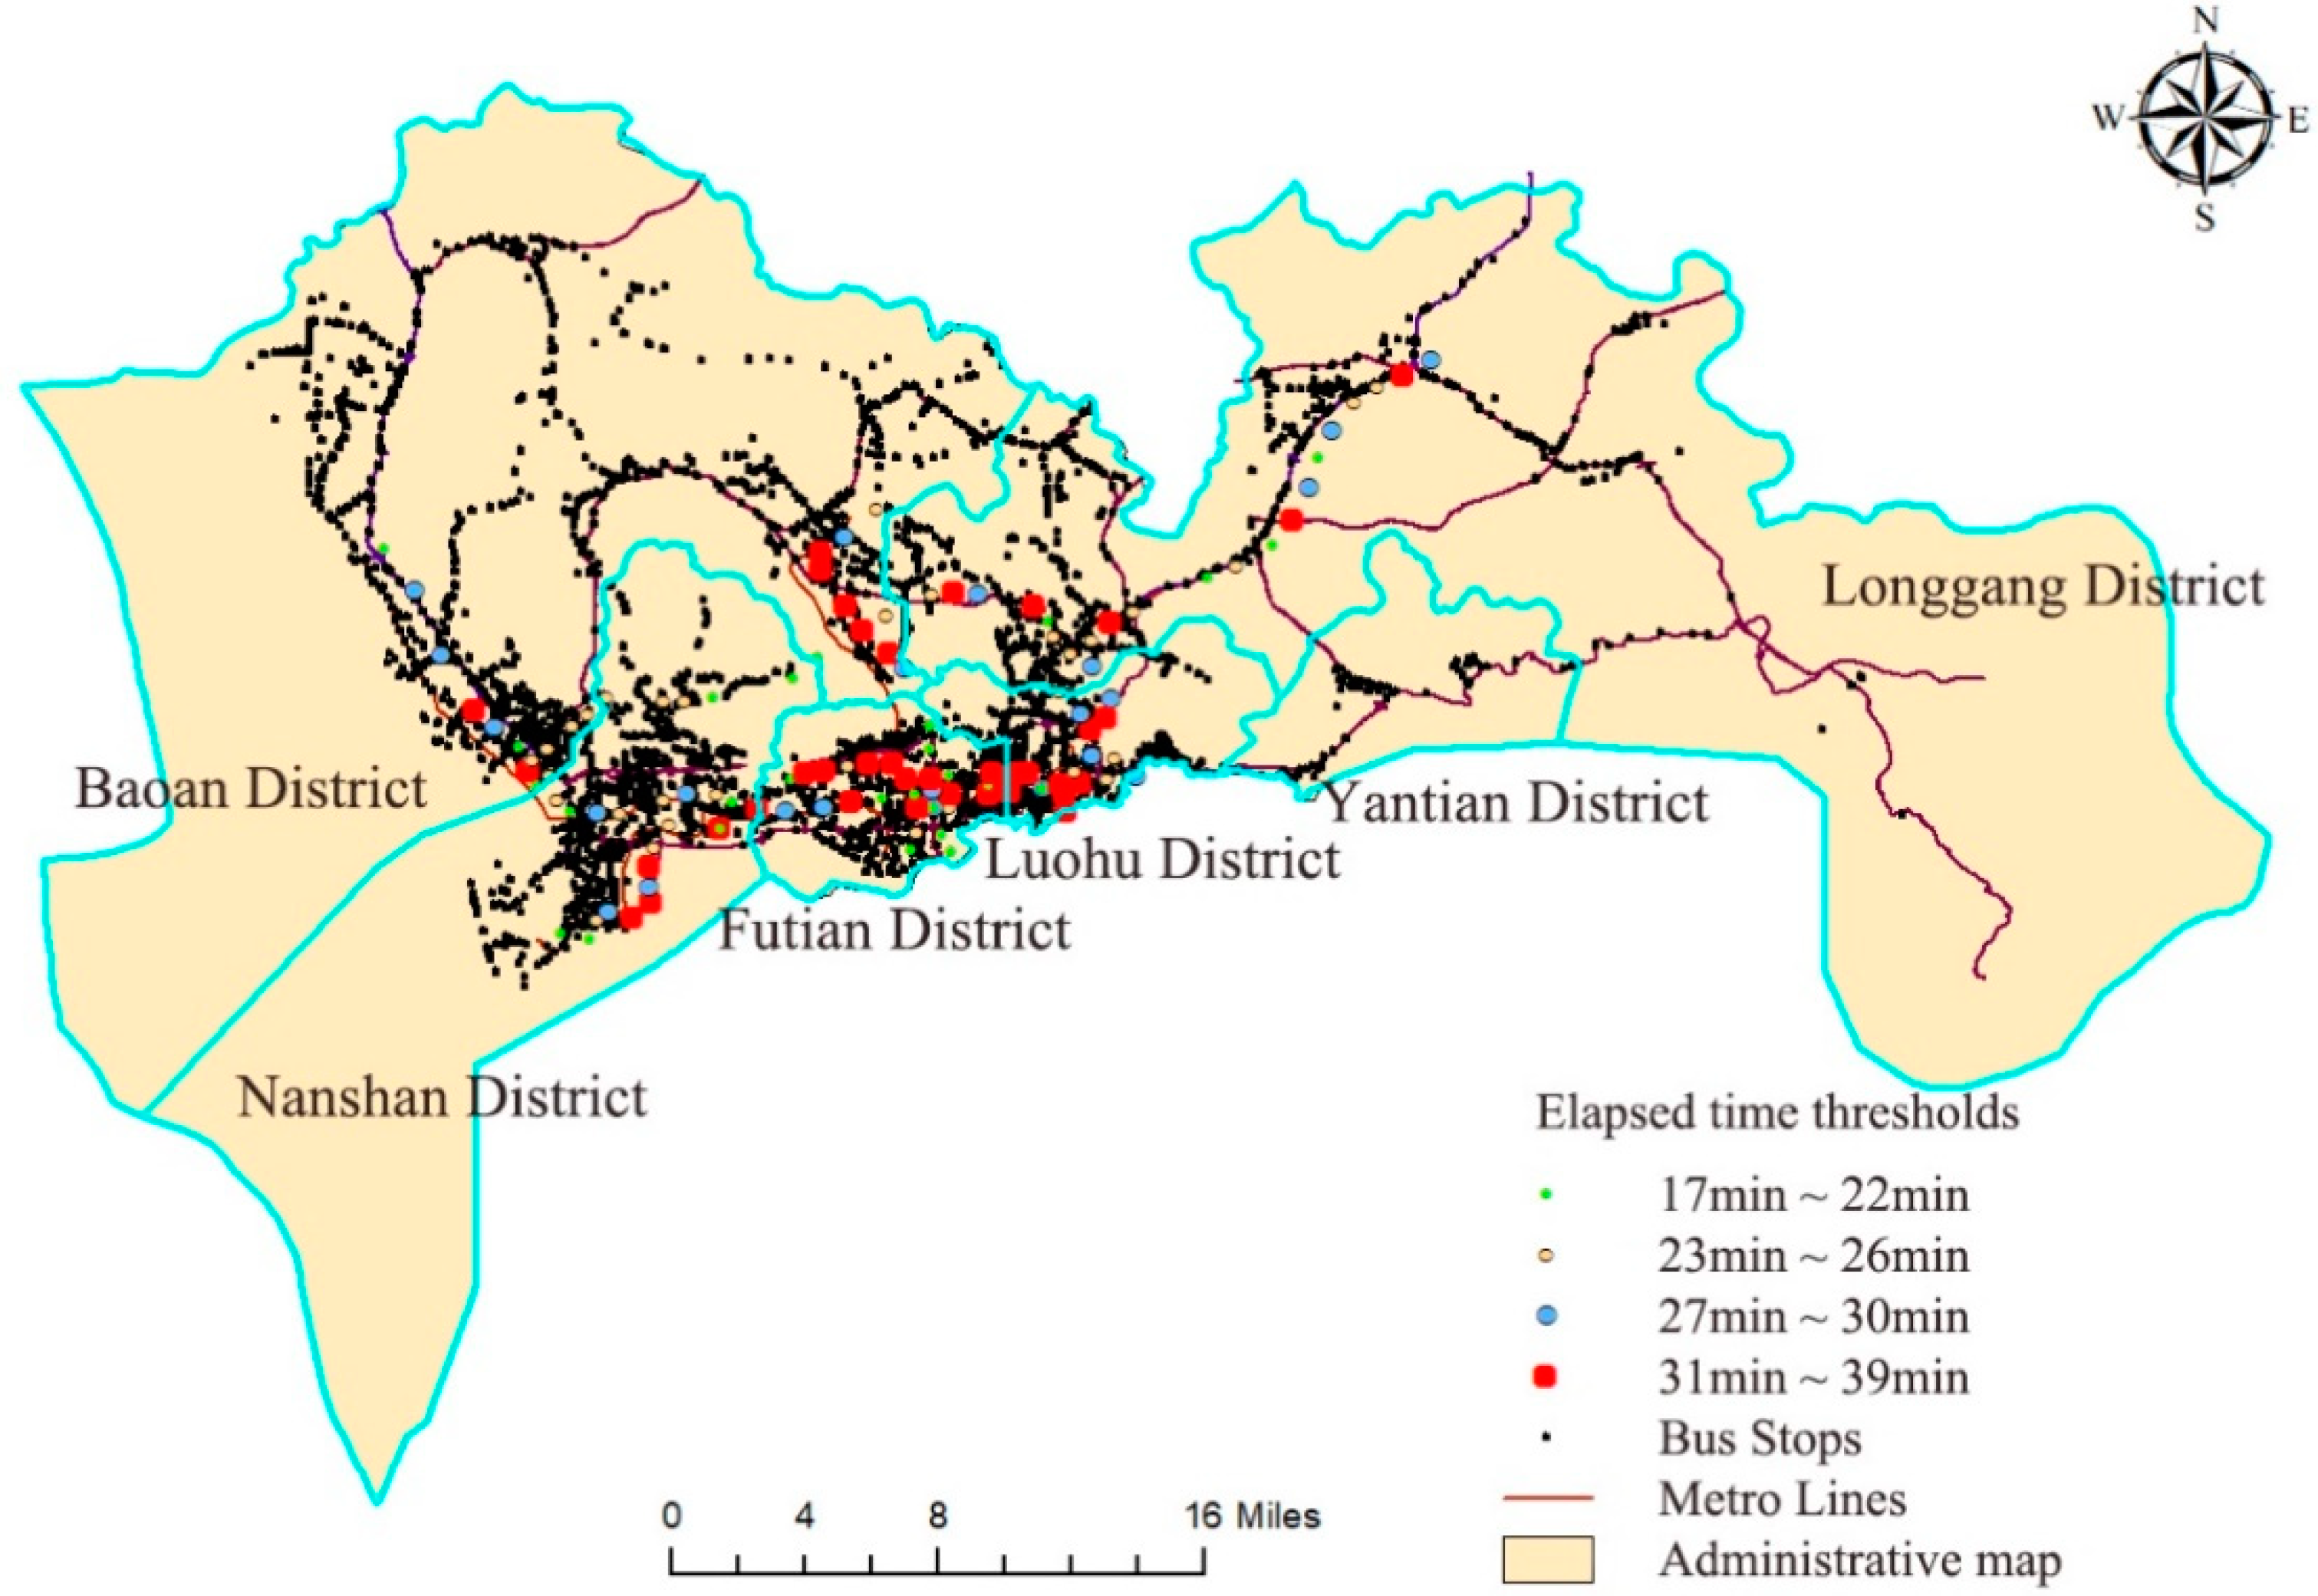
5.3. Application to Citywide Transfer Analysis

In this section, the authors used GIS data to investigate the citywide transfer characteristics in Shenzhen. The average transfer time is been regarded as one of the most important performance indexes to evaluate the efficiency and reliability of a public transport network. However, it is quite difficult to calculate accurate average transfer time because the traditional methods cannot recognize each passenger’s transfer trip in practice. Alternatively, the authors have presented the dynamic station-specific elapsed time threshold to recognize transfer trips and measure the transfer performance of public transportation systems for a city.
To further explore the characteristics and profiles of passenger metro-to-bus transfer behavior in Shenzhen, this study has completed estimating the weekday morning-peak-hour elapsed time thresholds of total 131 metro stations belonging to five metro lines based on the huge training dataset at 7:00–9:00 from 11 March to 15 March 2019, which were calculated within no less than 16 min. Statistically, it is found that the elapsed time thresholds of all stations vary in the range of 18–39 min, and the corresponding network-level average transfer time threshold is about 27 min. Over 52.67% of the thresholds range from 22 min to 30 min, and about one third of them (32.06%) exceeds the threshold of 30 min. Furthermore, the remaining (15.27%) are below 22 min. Briefly, the results show that local transit agencies should focus more on transit network connectivity improvements between metro and ground-level buses for attracting ridership by decreasing transfer time.
Figure 10 summarizes the distribution of metro-to-bus transfer elapsed time threshold estimated by the proposed method in this paper under scenario S1, which includes 131 metro stations belonging to metro lines 1–5 in Shenzhen. The results demonstrate that those metro stations with poor connectivity to their feeding ground-level bus stations are scattered all over the city, but are concentrated more in the central areas, such as Luohu District and Futian District.
The authors have also conducted a field survey at four metro stations with poor connectivity to nearby bus stations for validation, including Science Hall Station, Shopping Park Station, Chegongmiao Station, and Shenzhen North Station. The estimated elapsed time thresholds of Science Hall Station, Shopping Park Station, and Shenzhen North Station are about 37 min, and that of Chegongmiao Station is 38 min.
The authors also identified some well-designed transfer stations, such as Xiangmi Lake Station and Shangmeilin Station. According to the field survey, some key design elements of good transfer stations are:
  • The metro-to-bus walking distance should be no greater than the acceptable threshold.
  • Transit agencies should consider opening more transfer bus lines or increase bus frequency at overcrowded metro stations.
  • Some narrow corridors connecting metro and bus stations should be changed to one-way roads.
  • Convenient crossing facilities such as pedestrian overpasses and underground subways are crucial for high-quality metro-to-bus interchanges.

6. Discussion & Conclusions

The main contribution of this study is the station- and time-specific recognition method for transfer time threshold determination to accurately identify the citywide metro-to-bus interchange trips by using smart card data and GPS data. Firstly, the dynamic and specific elapsed time threshold for each station pair from metro to ground-level bus can be estimated from the metro alighting time at the station and time interval between the metro alighting and the next feeder bus boarding. Thus, metro-to-bus interchange trip recognition is available when the transfer distance and time of a trip meet two spatial-temporal criteria developed by this study. Finally, using transaction data from the metro and bus automatic fare collection system and a person trip survey, we demonstrated that the proposed method can correctly recognize the specific elapsed time thresholds of each station for nine different time periods. The estimated results of transfer time threshold and transfer volume can aid city planners and transit agencies to interpret metro-to-bus interchange behavioral features and evaluate the performance of transit network connectivity.
In conclusion, one of the advantages of this study is that it presents spatial-temporal dynamic thresholds by comparing with the traditional static methods of one-size-fits-all criterion, which is validated because it has much better goodness-of-fit to surveyed data than the latter. Furthermore, transit agencies are able to diagnose the quality of metro-to-bus connectivity by applying the proposed method to continuous monitoring of transfer time threshold, which will help them to develop policy changes and improve design. For example, the transfer time threshold for 32.06% of the 131 metro stations belonging to Shenzhen Metro Lines 1–5 is more than 30 min during a.m.-peak hours on weekdays, which illustrates that these stations have poor connectivity and require improvement.
Future research along this line will address the following three issues: (a) validation of the reliability and effectiveness of the station-specific methods under various geometric metro configurations and transfer demand patterns through more extensive field tests in Shenzhen or other cities; (b) transfer behavior analysis and the identification of related impact factors based on demographic data; and (c) improvement of metro stations that are evaluated to have the bad connectivity to ground-level bus stations.

Author Contributions

All authors discussed and commented on the manuscript at all stages. More specifically, Z.H., P.W. and B.F. collected the related literatures, conducted the analysis and completed the draft writing under the supervision of L.X. and Y.L.; L.X. and Y.L. contributed to the revision of the paper structure and the presentation style, funding support, as well as the proofreading of the paper.

Funding

This work was supported by National Key R&D Program of China (2018YFB1601601), Natural Science Foundation of Guangdong Province (2018A030310395), and Science and Technology Program of Guangzhou, China (201803030045).

Acknowledgments

The authors especially appreciate data support from Shenzhen Traffic Operation Command Center, China.

Conflicts of Interest

The authors declare no conflict of interest.

References

  1. Nesheli, M.M.; Ceder, A.A. Improved reliability of public transportation using real-time transfer synchronization. Transp. Res. Part C Emerg. Technol. 2015, 60, 525–539. [Google Scholar] [CrossRef]
  2. Guo, X.; Sun, H.; Wu, J.; Jin, J.; Zhou, J.; Gao, Z. Multiperiod-based timetable optimization for metro transit networks. Transp. Res. Part B Methodol. 2017, 96, 46–67. [Google Scholar] [CrossRef]
  3. Brons, M.; Givoni, M.; Rietveld, P. Access to railway stations and its potential in increasing rail use. Transp. Res. Part A Policy Pract. 2009, 43, 136–149. [Google Scholar] [CrossRef]
  4. Seriani, S.; Fernández, R. Planning guidelines for metro–bus interchanges by means of a pedestrian microsimulation model. Transp. Plan. Technol. 2015, 38, 569–583. [Google Scholar] [CrossRef]
  5. Pronello, C.; Longhi, D.; Gaborieau, J.B. Smart Card Data Mining to Analyze Mobility Patterns in Suburban Areas. Sustainability 2018, 10, 3489. [Google Scholar] [CrossRef]
  6. Cherry, T.; Townsend, C. Assessment of potential improvements to metro–bus transfers in Bangkok, Thailand. Transp. Res. Rec. J. Transp. Res. Board 2012, 2276, 116–122. [Google Scholar] [CrossRef]
  7. Navarrete, F.J.; de Dios Ortúzar, J. Subjective valuation of the transit transfer experience: The case of Santiago de Chile. Transp. Policy 2013, 25, 138–147. [Google Scholar] [CrossRef]
  8. Wang, Z.J.; Chen, F.; Xu, T.K. Interchange between metro and other modes: Access distance and catchment area. J. Urban Plan. Dev. 2016, 142, 04016012. [Google Scholar] [CrossRef]
  9. Munizaga, M.A.; Palma, C. Estimation of a disaggregate multimodal public transport Origin–Destination matrix from passive smartcard data from Santiago, Chile. Transp. Res. Part C Emerg. Technol. 2012, 24, 9–18. [Google Scholar] [CrossRef]
  10. Park, J.Y.; Kim, D.J.; Lim, Y. Use of smart card data to define public transit use in Seoul, South Korea. Transp. Res. Rec. J. Transp. Res. Board 2008, 2063, 3–9. [Google Scholar] [CrossRef]
  11. Munizaga, M.; Devillaine, F.; Navarrete, C.; Silva, D. Validating travel behavior estimated from smartcard data. Transp. Res. Part C Emerg. Technol. 2014, 44, 70–79. [Google Scholar] [CrossRef]
  12. Trépanier, M.; Habib, K.M.; Morency, C. Are transit users loyal? Revelations from a hazard model based on smart card data. Can. J. Civ. Eng. 2012, 39, 610–618. [Google Scholar] [CrossRef]
  13. Kusakabe, T.; Iryo, T.; Asakura, Y. Estimation method for railway passengers’ train choice behavior with smart card transaction data. Transportation 2010, 37, 731–749. [Google Scholar] [CrossRef]
  14. Jánošíková, Ľ.; Slavík, J.; Koháni, M. Estimation of a route choice model for urban public transport using smart card data. Transp. Plan. Technol. 2014, 37, 638–648. [Google Scholar] [CrossRef]
  15. Ma, X.; Wang, Y. Development of a data-driven platform for transit performance measures using smart card and GPS data. J. Transp. Eng. 2014, 140, 04014063. [Google Scholar] [CrossRef]
  16. Zhou, J.; Murphy, E.; Long, Y. Commuting efficiency in the Beijing metropolitan area: An exploration combining smartcard and travel survey data. J. Transp. Geogr. 2014, 41, 175–183. [Google Scholar] [CrossRef]
  17. Okamura, T.; Zhang, J.; Fujiwara, A. Finding behavioral rules of urban public transport passengers by using boarding records of integrated stored fare card system. In Proceedings of the 10th World Conference on Transport Research World Conference on Transport Research Society Istanbul Technical University, Istanbul, Turkey, 4–8 July 2004. [Google Scholar]
  18. Bagchi, M.; White, P. What role for smart-card data from bus systems? Munic. Eng. 2004, 157, 39–46. [Google Scholar] [CrossRef]
  19. Bagchi, M.; White, P.R. The potential of public transport smart card data. Transp. Policy 2005, 12, 464–474. [Google Scholar] [CrossRef]
  20. Seaborn, C.; Attanucci, J.; Wilson, N.H. Analyzing multimodal public transport journeys in London with smart card fare payment data. Transp. Res. Rec. J. Transp. Res. Board 2009, 2121, 55–62. [Google Scholar] [CrossRef]
  21. Mohamed, K.; Côme, E.; Oukhellou, L.; Verleysen, M. Clustering smart card data for urban mobility analysis. IEEE Trans. Intell. Transp. Syst. 2016, 18, 712–728. [Google Scholar]
  22. Devillaine, F.; Munizaga, M.; Trépanier, M. Detection of activities of public transport users by analyzing smart card data. Transp. Res. Rec. J. Transp. Res. Board 2012, 2276, 48–55. [Google Scholar] [CrossRef]
  23. Wang, Z.J.; Liu, Y.; Chen, F. Evaluation and Improvement of the Interchange from Bus to Metro Using Smart Card Data and GIS. J. Urban Plan. Dev. 2018, 144, 05018004. [Google Scholar] [CrossRef]
  24. Zhao, D.; Wang, W.; Woodburn, A.; Ryerson, M.S. Isolating high-priority metro and feeder bus transfers using smart card data. Transportation 2017, 44, 1535–1554. [Google Scholar] [CrossRef]
  25. Gordon, J.B.; Koutsopoulos, H.N.; Wilson, N.H.; Attanucci, J.P. Automated inference of linked transit journeys in London using fare-transaction and vehicle location data. Transp. Res. Rec. J. Transp. Res. Board 2013, 2343, 17–24. [Google Scholar] [CrossRef]
  26. Nassir, N.; Hickman, M.; Ma, Z.L. Activity detection and transfer identification for public transit fare card data. Transportation 2015, 42, 683–705. [Google Scholar] [CrossRef]
  27. Zhao, D.; Wang, W.; Li, C.; Ji, Y.; Hu, X.; Wang, W. Recognizing metro-bus transfers from smart card data. Transp. Plan. Technol. 2019, 42, 70–83. [Google Scholar] [CrossRef]
  28. Shenzhen Statistics Department. Shenzhen Statistical Yearbook 2018. Available online: http://tjj.sz.gov.cn/xxgk/zfxxgkml/tjsj/tjnj/201812/P020181229639722485550.pdf (accessed on 29 December 2018).
  29. Chen, S. Annual Report on the Development of Shenzhen Economy; Social Science Academic Press (China): Beijing, China, 2018; Volume 11. [Google Scholar]
  30. Shenzhen Shenzhentong, Co.Ltd Shenzhentong Events. Available online: https://www.shenzhentong.com/about/aboutDJS_101009003.html (accessed on 19 January 2018).
  31. De Oña, J.; Gómez, P.; Mérida-Casermeiro, E. Adjustment boarding and alighting passengers on a bus transit line using qualitative information. Appl. Math. Model. 2014, 38, 1147–1158. [Google Scholar] [CrossRef]
  32. Gade, K. A non-singular horizontal position representation. J. Navig. 2010, 63, 395–417. [Google Scholar] [CrossRef]
  33. Limpert, E.; Stahel, W.A.; Abbt, M. Log-normal distributions across the sciences: Keys and clues: On the charms of statistics, and how mechanical models resembling gambling machines offer a link to a handy way to characterize log-normal distributions, which can provide deeper insight into variability and probability—normal or log-normal: That is the question. BioScience 2001, 51, 341–352. [Google Scholar]
  34. Jang, W. Travel time and transfer analysis using transit smart card data. Transp. Res. Rec. J. Transp. Res. Board 2010, 2144, 142–149. [Google Scholar] [CrossRef]
  35. Nachar, N. The Mann–Whitney U: A test for assessing whether two independent samples come from the same distribution. Tutor. Quant. Methods Psychol. 2008, 4, 13–20. [Google Scholar] [CrossRef]
Figure 1. Transfers distribution at different times of day. (a) Transfer time distribution. (b) Transfer volume distribution.
Applsci 09 03597 g001
Figure 2. Transfers distribution on festivals and weekends. (a) Transfer time distribution. (b) Transfer volume distribution.
Applsci 09 03597 g002
Figure 3. Identification framework based on smart card (SC) data and global positioning system (GPS) data.
Applsci 09 03597 g003
Figure 4. The sequence of card swiping time and bus arrival time.
Applsci 09 03597 g004
Figure 5. The algorithmic framework for metro-to-bus interchange behavior identification.
Applsci 09 03597 g005
Figure 6. The cumulative distribution function (CDF) of metro-to-bus transaction time interval at four stations at 7:00–9:00 on 11–15 March. (a) Guomao station. (b) Shenzhen University station. (c) Daxin station. (d) Airport East station.
Applsci 09 03597 g006
Figure 7. The CDF of metro-to-bus transaction time interval at four stations at 18:00–20:00 on 16–17 March. (a) Guomao station. (b) Shenzhen University station. (c) Daxin station. (d) Airport East station.
Applsci 09 03597 g007
Figure 8. Comparison of two metro-to-bus transfer identification methods at four stations at 7:00–9:00 on 21–22 March. (a) Guomao station. (b) Shenzhen university station. (c) Daxin station. (d) Airport east station.
Applsci 09 03597 g008
Figure 9. Comparison of two metro-to-bus transfer identification methods at four stations at 18:00–20:00 on 23–24 March. (a) Guomao station. (b) Shenzhen university station. (c) Daxin station. (d) Airport east station.
Applsci 09 03597 g009
Figure 10. Spatial configuration of metro-to-bus elapsed time threshold during weekday morning peak hours in Shenzhen.
Applsci 09 03597 g010
Table 1. Description of the six investigated scenarios.
ScenarioDay of WeekTime PeriodTime of Day
S1WeekdaysAM-peak hours07:00–09:00
S2PM-peak hours18:00–20:00
S3Off-peak hours09:00–18:00
S4WeekendsAM-peak hours07:00–09:00
S5PM-peak hours18:00–20:00
S6Off-peak hours09:00–18:00
Table 2. The dynamic elapsed time threshold of four survey metro stations estimated in this study.
StationsGuomaoShenzhen UniversityDaxinAirport East
Scenarios
7:00–9:00 on 11–15 March25 min28 min30 min19 min
18:00–20:00 on 16–17 March34 min33 min28 min23 min
Table 3. Statistical comparisons the different methods.
StationsGuomaoShenzhen UniversityDaxinAirport East
Survey DataStatic ModelDynamic ModelSurvey DataStatic ModelDynamic ModelSurvey DataStatic ModelDynamic ModelSurvey DataStatic ModelDynamic Model
7:00–9:00, 21–22 MarchVolumes29114641448338154915383181528152827810321026
Average10.8710.5410.4911.039.118.9613.3110.0910.0910.768.788.66
Variance22.1419.8418.5225.8525.4922.6438.4729.1729.1715.6312.7810.29
U test-0.270.28-0.250.26-0.180.18-0.170.19
18:00–20:00, 23–24 MarchVolumes290857875287823838250858851223792784
Average14.1710.2510.5615.7610.5210.9216.2711.4311.2812.038.728.31
Variance48.5733.1439.6865.2132.2240.1537.3531.0831.0121.9433.2225.53
U test-0.160.29-0.170.27-0.160.17-0.190.18
Table 4. Dynamic elapsed time thresholds of four stations under six scenarios.
StationsS1S2S3S4S5S6
Scenarios
Guomao25 min22 min30 min22 min34 min33 min
Shenzhen University28 min29 min35 min25 min33 min35 min
Daxin30 min29 min35 min30 min28 min33 min
Airport East19 min18 min26 min18 min23 min29 min
Table 5. The estimated transfer volumes of four stations under six scenarios.
StationsS1S2S3S4S5S6
Scenarios Static ModelDynamic ModelStatic ModelDynamic ModelStatic ModelDynamic ModelStatic ModelDynamic ModelStatic ModelDynamic ModelStatic ModelDynamic Model
Guomao927899217210341341182174142143393406
Shenzhen University907897419418611646345341300306871908
Daxin10981098917917642666420420409406806827
Airport East766753745730701698336329443433944940

