Article

The Rapid Detection Technology of Lamb Wave for Microcracks in Thin-Walled Tubes

Science and Technology on Electronic Test and Measurement Laboratory, North University of China, Taiyuan 030051, China
*
Author to whom correspondence should be addressed.
Appl. Sci. 2019, 9(17), 3576; https://doi.org/10.3390/app9173576
Submission received: 25 July 2019 / Revised: 22 August 2019 / Accepted: 27 August 2019 / Published: 1 September 2019
(This article belongs to the Special Issue Nondestructive Testing (NDT))

Abstract

:
Thin-walled tubes are a kind of pressure vessel formed by a stamping and drawing process, which must withstand a great deal of sudden pressure during use. When microcrack defects of a certain depth are present on its inner and outer surfaces, severe safety accidents may occur, such as cracking and crushing. Therefore, it is necessary to carry out nondestructive testing of thin-walled tubes in the production process to eliminate the potential safety hazards. To realize the rapid detection of microcracks in thin-walled tubes, this study could be summarized as follows: (i) Because the diameters of the thin-walled tubes were much larger than their thicknesses, Lamb wave characteristics of plates with equal thicknesses were used to approximate the dispersion characteristics of thin-walled tubes. (ii) To study the dispersion characteristics of Lamb waves in thin plates, the detection method of the A 0 mode was determined using the particle displacement–amplitude curve. (iii) Using a multi-channel parallel detection method, rapid detection equipment for Lamb wave microcracks in thin-walled tubes was developed. (iv) The filtering peak values for defect signal detection with different depths showed that the defect detection peak values could reflect the defect depth information. (v) According to the minimum defect standard of a 0.045-mm depth, 100,000 thin-walled tubes were tested. The results showed that the missed detection rate was 0%, the reject rate was 0.3%, and the detection speed was 5.8 s/piece, which fully meets the actual detection requirements of production lines. Therefore, this study not only solved the practical issues for the rapid detection of microcracks in thin-walled tubes but also provided a reference for the application of ultrasonic technology for the detection of other components.

1. Introduction

1.1. Purpose and Significance

Thin-walled tubes are pressure vessels formed by stamping and drawing. In the production process, due to errors in the processing parameters and faults in the production equipment, microcrack defects form in the inner and outer walls of thin-walled tubes. However, thin-walled tubes must withstand large sudden changes in pressure during use. When the depths of the microcracks on the inner and outer surfaces are greater than a certain threshold, severe safety accidents can occur, such as cracking and crushing. Therefore, it is necessary to carry out nondestructive testing of thin-walled tubes in the production process to eliminate the potential safety hazards.
For the nondestructive testing of thin-walled tubes, the commonly used testing methods include eddy current [1,2], magnetic powder [3], X-ray [4,5], liquid penetrant [6,7,8], and ultrasonic [9] methods. With eddy current detection, it is difficult to distinguish irregular surface defects and detect them quantitatively, which can easily lead to misjudgment [10]. Magnetic particle testing is more suitable for surface defect detection, and it is difficult to quantitatively detect the depth of a flaw [10]. The X-ray method is mainly used to detect the volume of the defect inside the object. For an area defect, there will be an overlap of the front and back, and the angle between the ray beam and the orientation of the crack cannot exceed 10°; otherwise, it cannot be detected [10]. Penetration detection is limited to the defects of the surface opening. The penetrating liquid pollutes the parts and the environment and is not suitable for on-line detection [10]. Ultrasonic testing is sensitive to the area of the defect inside the object and can locate the relative size and location of the defect. The detection depth is much greater than other detection methods, and thus, it has been widely used [10]. For thin-walled tubes, ultrasonic Lamb waves are usually used for testing [11].
The ultrasonic detection principle of thin-walled tubes is the same as that of pipe, and there are many studies on the principle, method, and application of Lamb wave detection of pipe for reference. Therefore, based on the analysis of Lamb wave detection of pipe, the ultrasonic detection method of thin-walled tubes was explored. Defect types in pipe include lamination [12], corrosion [13], and cracking [14,15,16], which can occur on both inner and outer surfaces. The modes of Lamb waves in the pipe are mainly divided into longitudinal [17,18], torsional [19,20,21,22,23], and flexural [24,25].
According to the relevant references, the following work must be completed to realize the Lamb wave detection of pipe defects. (i) Based on analyzing and studying the dispersion characteristics of Lamb waves, the transducer frequency and Lamb wave mode with the highest sensitivity to the detected defect type should be selected. (ii) To study the interaction between defect and Lamb waves in the pipe, simulation should be carried out under a three-dimensional (3D) model. (iii) A test platform should be built to compare the difference between simulation and test results by scanning artificial defects in the pipe with transducers. (iv) Signal processing is used to determine the location and size of defects in the pipe. The difficulties in the detection process mainly focus on the two aspects: mode selection and 3D model simulation. On the one hand, the dispersion characteristics of Lamb waves in pipe have three modes to be analyzed and studied. Compared with only symmetric and antisymmetric modes in a thin plate, the difficulty of modal analysis and selection is increased. On the other hand, a 3D model is needed to analyze the interaction between defects and Lamb waves in the pipe. Compared with the 2D model of a thin plate, there are great challenges in terms of computational complexity.
When the diameters of hollow cylindrical components are much larger than their thicknesses, the dispersion characteristics of Lamb waves in hollow cylindrical components can be approximated by studying the characteristics of Lamb waves in plates with equal thicknesses [26,27,28]. He et al. [29] found that when the diameter to thickness ratio of hollow cylindrical components is less than 0.05, the dispersion curves of the hollow cylindrical components were similar to those of components with the corresponding plate thicknesses. In this study, the diameters and thicknesses of the thin-walled tubes were 35 mm and 0.8–1.2 mm, respectively. Selecting the Lamb-wave dispersion characteristics of plates with equal thicknesses to approximate the propagation characteristics of Lamb waves in thin-walled tubes could not only simplify the model but also facilitate the application of practical engineering practice.

1.2. The State of the Art

1.2.1. Transducers for Lamb Waves

Qiu et al. [30] proposed a multi-physical simulation method for the Lamb wave propagation of piezoelectric transducers under load conditions. The results showed that the phase velocity and amplitude changes of Lamb waves obtained by simulation were in good agreement with experiment. He et al. [31] designed two electromagnetic acoustic transducers to generate and receive S 0 Lamb waves in ferromagnetic steel plates, which were kept within 5 and 19 mm from the sample surface, respectively. This allowed the electromagnetic acoustic transducer to interact with the sample with less force and facilitated easier scanning. Zhang et al. [32] established the finite element model and detection system of laser ultrasound and realized the simulation and test detection of multilayer bonded composite materials. The results showed that this method not only facilitated the visualization of debonding but also provided accurate bonding quality information.

1.2.2. Lamb Mode

Gupta et al. [33] studied the interaction of a basic symmetric Lamb wave mode S 0 with laminations in eight layers of glass-fiber-reinforced polymer (GFRP) laminated composite by numerical simulation and experimental verification. The results showed that the sensitivity of S 0 mode reflection depended on the thickness direction and layering direction of the composite laminate. Among all laminates tested, the S 0 mode was highly sensitive to DL23 and DL34 (Delamination is considered between the layers 2&3 and 3&4 locations, which are abbreviated as DL12 and DL34, respectively. The thickness is 0.42–1.26 mm). Mori et al. [34] experimentally studied the transmission characteristics of Lamb wave S 0 and A 0 modes at the contact edges of two plates. The results showed that the transmission coefficient of the S 0 mode increased monotonically with increasing contact pressure, but the transmission coefficient of the A 0 mode had a non-monotonic relationship with contact pressure and local minimum frequency. Cho et al. [35] calculated the reflection and propagation coefficients of the selected guided wave modes using simulation and compared the results with experimental data. The results showed that defect characterization was possible if a suitable criterion for modal selection was established. Ochoa et al. [36] used two zeroth-order Lamb wave modes to detect various types of invisible impact damage in composite materials. Because the digital shearography and ultrasonic C-scan technology could identify 5- and 10-J impact damage and the impact damage of 3-J could not be detected, the results of the Lamb wave detection were confirmed by comparison.

1.2.3. Characteristics of Lamb Waves

Pant et al. [37] analyzed the influence of material properties, such as E 11 (axial elastic modulus), E 22 (transversal elastic modulus), G 12 (plane shear modulus), and ρ (density), on Lamb wave propagation/dispersion of three kinds of composite laminates. These composite laminates are unidirectional, cross-layered, and quasi-isotropic, which are all composed of 16 layers of unidirectional carbon fiber epoxy prepreg. The results showed that when Lamb waves are used for damage detection, the A 0 mode should be selected when f d (frequency times thickness) is small, and the S 0 mode should be selected when f d is large. Shen et al. [38] proposed an effective numerical method with which to study the nonlinear scattering and mode conversion of Lamb waves interacting with breathing cracks. The results showed that the scattering phenomenon was related to the incident wave mode. Symmetric and antisymmetric scattering modes exhibit alternate properties, which, in turn, carry most of the energy and dominate the harmonic scattering. Ai et al. [39] used the finite element method to study the propagation characteristics of Lamb waves in thin plates, and when compared with the frequency dispersion curve, the error of the simulation was 1.3%. Senyurek et al. [40] studied the notch and impact damage of slats, and the results showed that Lamb waves could provide time and cost efficiency in aircraft structure detection compared with other technologies. The finite element method was used by Alkassar et al. [41] to simulate the propagation of Lamb waves in a thin metal plate. The results showed that when there was damage in the plate, a new packet-wave formed by a mode conversion phenomenon could be observed.

1.2.4. Defects Identification Method

Yelve et al. [42] studied the interaction between the Lamb wave of the S 0 mode and the damage in an aluminum plate and used an artificial neural network (ANN) to locate the damage. The results showed that the ANN was an effective tool for damage location in a plate structure. The local wavenumber method of Lamb waves was used by Fan et al. [43] to characterize the flat bottom defects in isotropic thin plates. The simulation and experimental results showed that the average wavenumber could be used to not only identify the shape, position, and size of the damage but also quantify the depth of the damage.

1.3. The Contribution

In the development process of on-line Lamb wave detection equipment for microcracks in thin-walled tubes, the following work items have been accomplished.
(i)
The dispersion characteristics of Lamb waves in thin plates with the same thickness were used to approximate the ultrasonic characteristics of thin-walled tubes, which reduced the dimensions of the model and laid a foundation for the engineering application of Lamb waves.
(ii)
Based on the calculation and simulation of phase velocity, incident angle, and particle amplitude displacement, the Lamb wave mode with the highest sensitivity to the inner wall and outer wall cracks of a thin-walled cylinder was determined.
(iii)
Multi-channel technology was adopted to solve the problem of rapid detection and improve the stability and reliability of the equipment.
(iv)
The defect signal extraction circuit was designed, which greatly reduced the amount of data acquired and improved the data processing speed.
(v)
Rapid on-line detection equipment for microcracks in thin-walled tubes was developed, and the engineering application of rapid detection of microcracks by Lamb wave was realized.
(vi)
Qualitative and quantitative non-destructive testing of the minimum depth crack of 10 × 0.15 × 0.045 (length × width × depth) was realized.

2. Theoretical Principle

2.1. Testing Object and Artificial Defect

The structural sketch of a thin-walled tube is shown in Figure 1. Each tube was a steel pressure vessel with a variable wall thickness formed by cold stamping and stretching. The wall thickness of the mouth was 0.8 mm, the wall thickness near the bottom was 1.2 mm, and the inner diameter of the mouth was 37 mm. The detection range was a thin-walled tube 255 mm away from the mouth.
Because thin-walled tubes are stamped and stretched in the production process, the inner and outer surfaces are prone to scratches with axial and circumferential distributions. In the actual production process, it was determined by manual inspection that the main defects are axially distributed. Therefore, to study the ultrasonic signal characteristics of these defects, groove defects with axial and circumferential distributions were fabricated on the inner and outer surfaces of thin-walled tube samples. Artificial defects were manufactured by the national measurement unit using electro-processing technology and measured by an optical image method. The lengths and widths of the defects were 10 ± 0.1 mm and 0.15 ± 0.01 mm, respectively. Three depths were used: 0.045 ± 0.005 mm, 0.073 ± 0.005 mm, and 0.10 ± 0.005 mm, and the detailed information is shown in Table 1.

2.2. Dispersion Characteristics of Lamb Waves

In the process of Lamb wave flaw detection, different modes of the Lamb wave will be excited when different incident angles are used, and thus, different sensitivities can be obtained for defects at different locations. Therefore, theoretical analysis is needed to determine which mode is most sensitive to the axial and circumferential distribution defects before testing. The Rayleigh–Lamb frequency equation is used to describe the wave characteristics of Lamb waves [11]. They are expressed mathematically as follows.
Symmetric mode:
4 p q tan π f d c p q + ( p 2 1 ) 2 tan π f d c p p = 0 ,
Antisymmetric mode:
( p 2 1 ) 2 tan π f d c p q + 4 p q tan π f d c p p = 0 ,
where p = ( c p c T ) 2 1 , q = ( c p c L ) 2 1 , c p is the phase velocity of Lamb wave, c T is the S-wave velocity, c L is the P-wave velocity, f is the frequency of Lamb wave, and d is the thickness of the plate.
In calculating the dispersion characteristics of the Lamb waves, the P-wave velocity c L and S-wave velocity c T of the steel plate were 5970 and 3200 m/s, respectively. The Rayleigh–Lamb frequency equation was solved numerically using Matlab, and the phase velocity c p vs. frequency-times-thickness f d dispersion curves of the Lamb wave was obtained, as shown in Figure 2.
Because the wall thickness of the thin-walled tubes varied from 0.8 to 1.2 mm, when a 5 MHz transducer was used for detection, the frequency-times-thickness was 4–6 MHz·mm, as shown by the red dotted line in Figure 2. As shown in the figure, the possible modes of the Lamb wave included the A 0 , S 0 , A 1 , S 1 , A 2 , and S 2 modes. Because the phase velocities of the A 1 , S 1 , A 2 , and S 2 modes vary greatly, the position of the defect echo signal is not fixed on the time axis, and it is difficult to identify the defect signal. Therefore, only the A 0 and S 0 modes were considered in the detection process.

2.3. Mode Selection

Through the dispersion curves of the Lamb waves, we determined that the optional modes were A 0 or S 0 . However, how to distinguish between them required further study of the direction of particle vibrations and the distributions of particle displacements for the A 0 and S 0 modes in plates. The particle displacement-amplitude curve of the Lamb waves reflects the variation and distribution of Lamb wave energy in the plate, which is one of the main bases for mode selection. The in-plane and out-of-plane displacement amplitudes of the particle vibrations are denoted as U and V , respectively. If the vertical distance between the particle and waveguide axis is x , their mathematical expressions are as follows [44]:
Symmetric mode:
U s = ( k z 2 s 2 ) sin ( 0.5 s d ) 2 q sin ( 0.5 q d ) cos ( q x ) B + s cos ( s x ) B ,
V s = ( k z 2 s 2 ) sin ( 0.5 s d ) 2 k z sin ( 0.5 q d ) sin ( q x ) B + k z sin ( s x ) B ,
Antisymmetric mode:
U a = ( k z 2 s 2 ) cos ( 0.5 s d ) 2 q cos ( 0.5 q d ) sin ( q x ) D s sin ( s x ) D ,   V a = ( k z 2 s 2 ) cos ( 0.5 s d ) 2 k z cos ( 0.5 q d ) cos ( q x ) D + k z cos ( s x ) D ,
where k z = 2 π f c p , s = k z ( c p c T ) 2 1 , q = k z ( c p c L ) 2 1 , and c p is the phase velocity of Lamb wave.
In the symmetric mode, the vibration of a particle in a plate is symmetrical in the center of the plate, and its in-plane displacement is symmetric along the thickness of the plate, while the out-of-plane displacement is antisymmetric. Under the antisymmetric mode, the vibration phase of the particle in the plate is the same on the upper and lower surfaces, and the out-of-plane displacement is symmetric along the thickness of the plate, while the in-plane displacement is antisymmetric along the thickness of the plate. For the steel plate with 1-mm thickness, the particle displacement-amplitude curves of the A 0 and S 0 modes are shown in Figure 3.
In Figure 3, the dashed line is the in-plane displacement along the thickness direction; that is, the vibration direction of the particle is parallel to the plate surface, while the real line is the out-of-plane displacement, that is, the vibration direction of the particle is perpendicular to the plate surface. The figure shows that the in-plane displacement of mode S 0 had a larger component in the plate, which is suitable for detecting the defects perpendicular to the plate surface, and the out-of-plane displacement of mode A 0 had a larger component in the plate, which is suitable for detecting defects on the inner and outer surfaces of the plate. Therefore, the A 0 mode, which is sensitive to the surface defects of the inner and outer walls of thin-walled tubes, was selected as the detection mode. This is consistent with the conclusion of Ref. [37].

2.4. Calculation of Incident Angle

The method of water immersion was adopted in the detection process, so it was necessary to calculate the incident angle of the A 0 mode Lamb wave produced by the ultrasonic transducer when the Lamb waves propagate from water into the steel. The mathematical formula is as follows:
α = arcsin c L c p ,
where α is the incident angle, c L is the P-wave velocity in water, and c p is the phase velocity of Lamb wave in steel. The relationship between the incident angle and frequency-times-thickness is shown in Figure 4.
As shown in Figure 4, when the frequency-times-thickness was 4–6 MHz mm, the incident angle of the mode A 0 corresponded to 30.5–29.99°. In practical applications, 30° was chosen as the incident angle to obtain the A 0 mode of the Lamb waves.

3. Testing Equipment

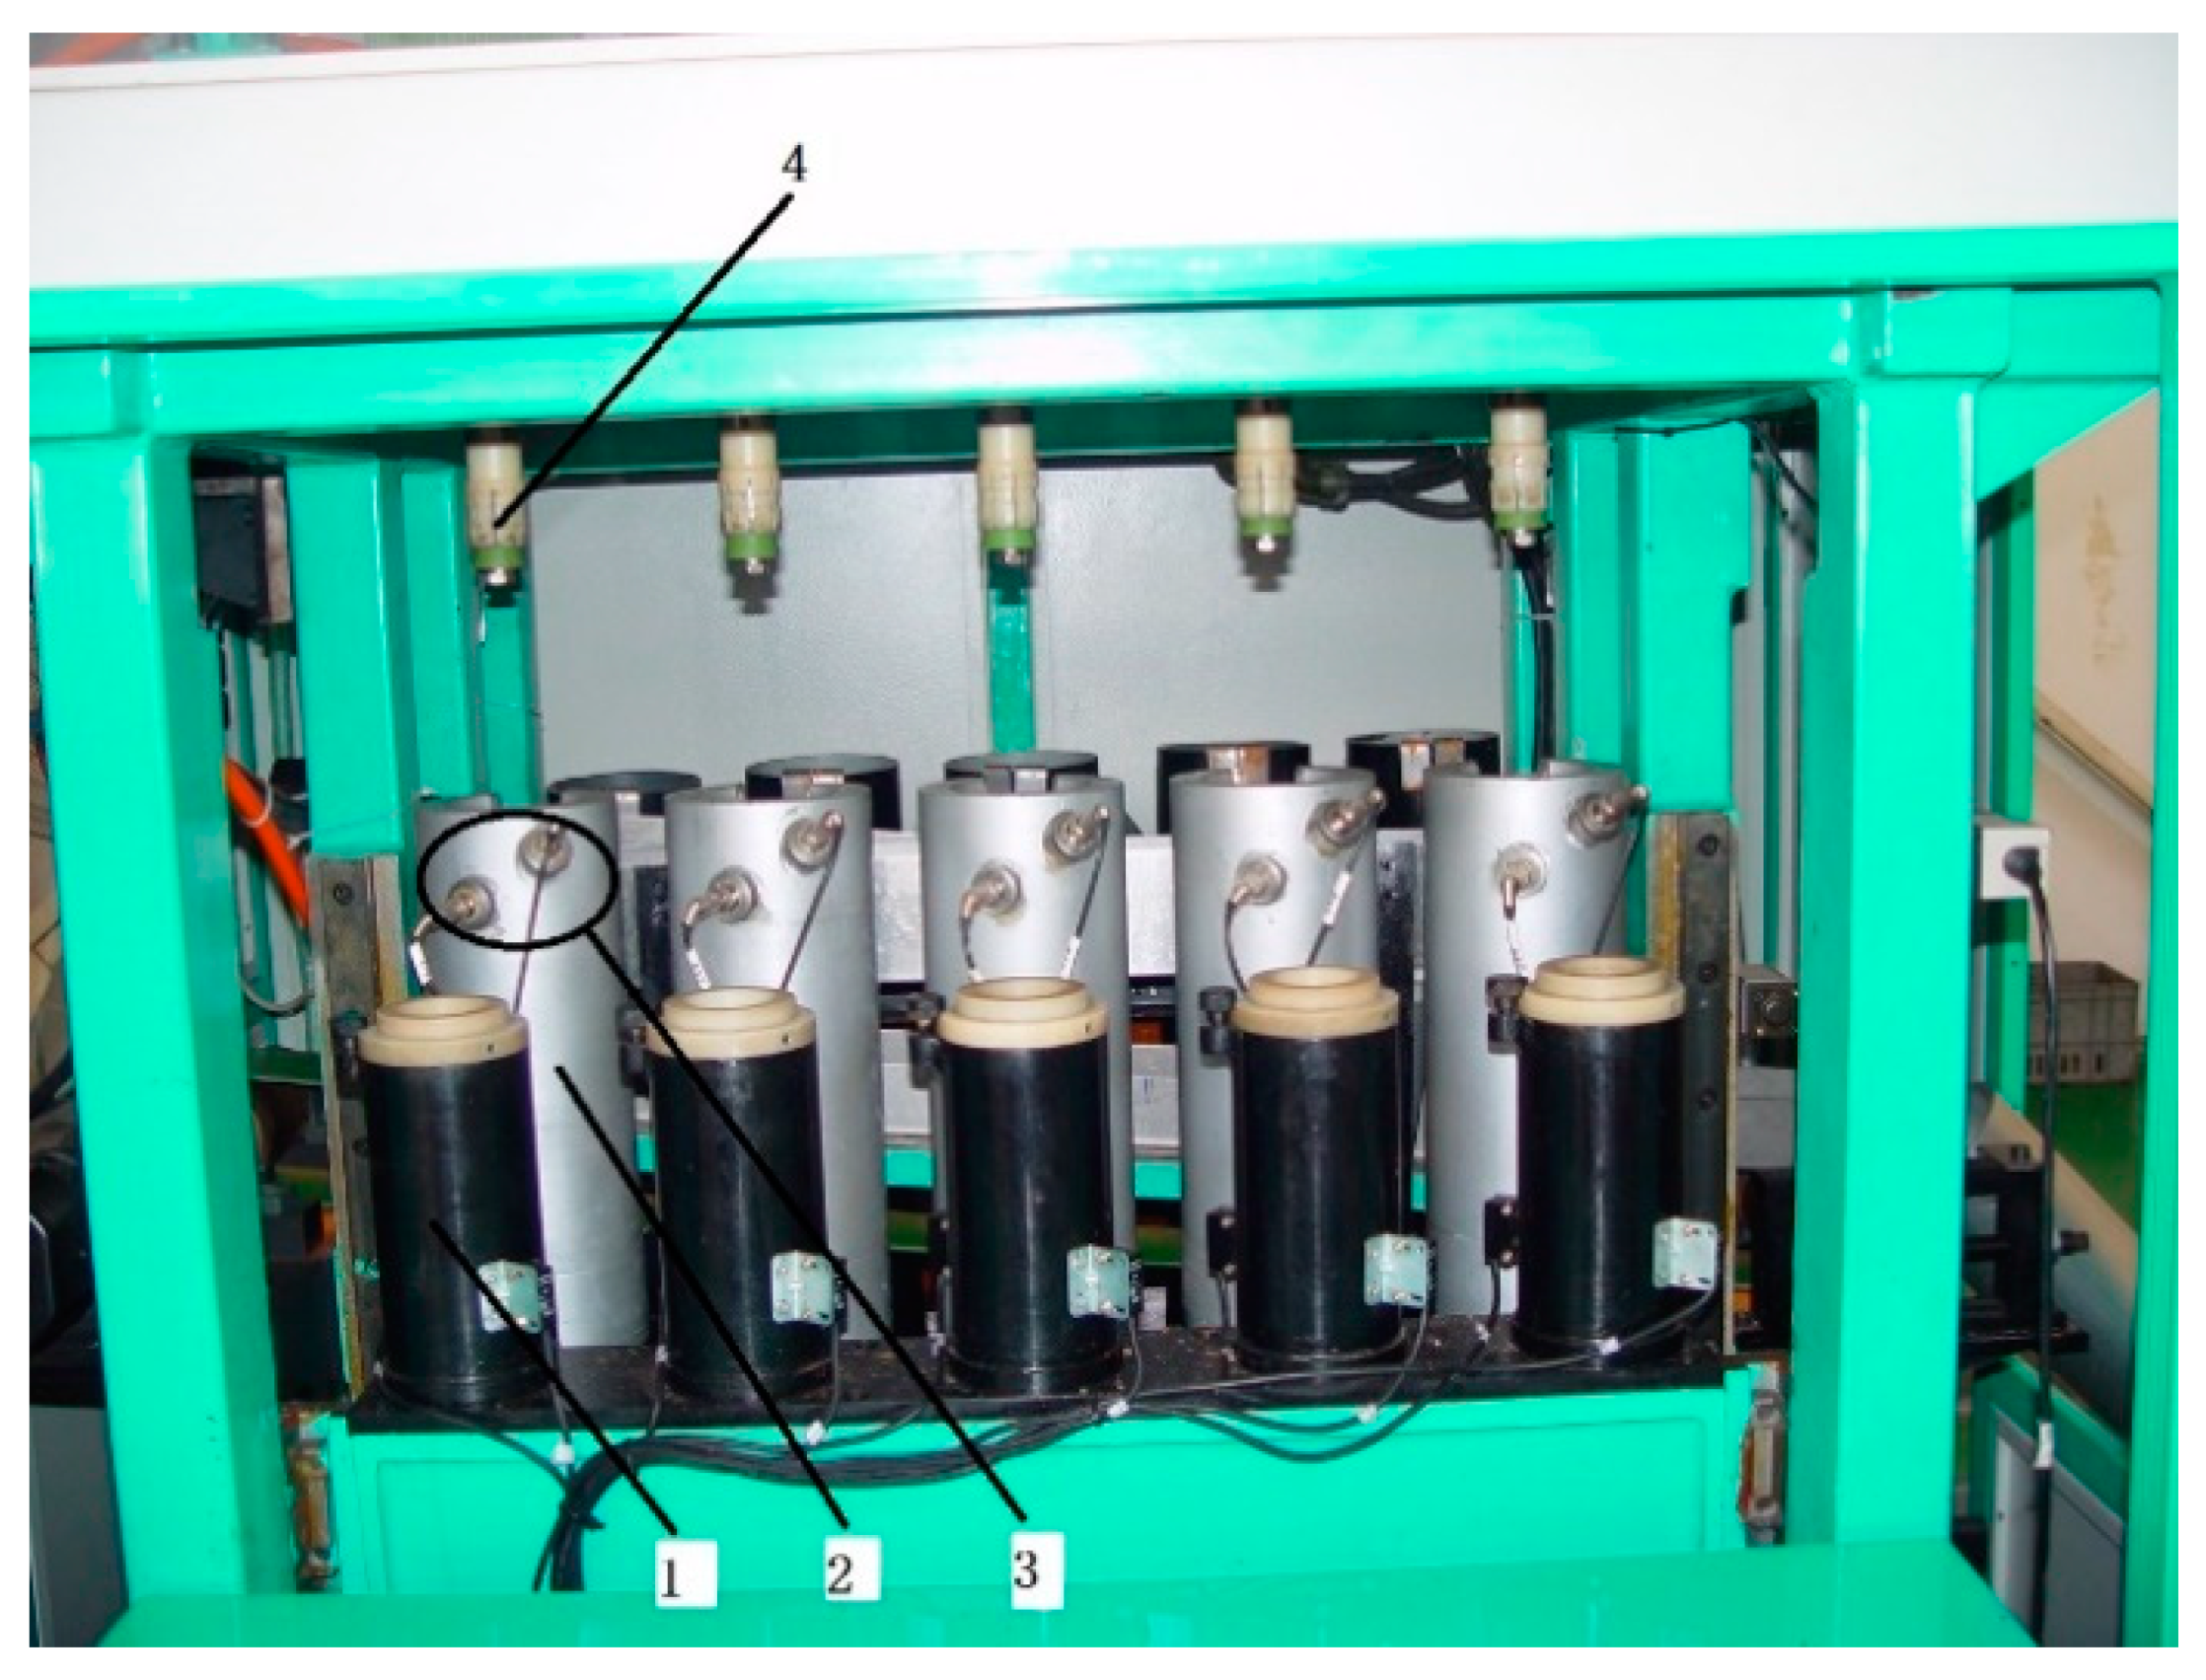
3.1. Appearance and Core Components

As shown in Figure 5, the testing equipment was mainly composed of three parts: a Programmable Logic Controller (PLC) control unit, a Personal Computer (PC) control unit, and a mechanical device. The control unit of the PLC was mainly responsible for the motion control of the mechanical device and communication with the PC through the RS232 serial module. The PC control unit mainly included a multi-channel pulse transmitter/receiver, the extraction device of the detection signal feature, the multi-channel data acquisition card, and the PC. The function of the multi-channel pulse transmitter/receiver was to detect the object using an excitation pulse to trigger the ultrasonic transducer and receive the detection signal from the detected object. The feature extraction device for the testing signal mainly ensured that only the defect echo signal was extracted through the hardware gate to reduce the amount of data acquisition and improve the speed of data processing. The mechanical device mainly performed the mechanical actions of grasping, rotating, and moving the thin-walled tube into place for testing.
The core components of the mechanical equipment are shown in Figure 6, which mainly include the material-preparation container, the testing container, the ultrasonic transducer, and the built-in manipulator. The material-preparation container was mainly used to place the thin-walled tube to be inspected. By moving up and down, the thin-walled tube was conveyed to a position that the built-in manipulator could grasp. There was an overflow outlet at the mouth of the testing container, which was used to discharge the overflow amount of water as the thin-walled tube slowly sank into the testing container. There was a water inlet at the bottom of the testing container, which was used to replace water when the thin-walled tube was removed from the testing container after the detection to ensure the coupling between the ultrasonic transducer and the thin-walled tube. A pair of ultrasonic probes were installed on the side of the testing container to scan the axial and circumferential distribution defects of the thin-walled tube. The movement of the testing container and the rotation of the built-in manipulator carrying the thin-walled tube could cooperate, which allowed the spiral scanning of the thin-walled tube by the ultrasonic probes. The built-in manipulator held the thin-walled tube from the inside. Meanwhile, an airbag at the top of the built-in manipulator sealed the opening of the thin-walled tube to prevent water from penetrating the thin-walled tube during the detection process. The built-in manipulator moved back and forth along the guide rail to grasp, rotate, and move the thin-walled tube into place.
The detection process was as follows. Firstly, when all five material-preparation containers were placed into the thin-walled tubes, the built-in manipulator moved backward to the central position of the material-preparation container. When the material-preparation container rose to a certain position, the built-in manipulator held the thin-walled tube from the inside and allowed the top airbag to seal the opening of the thin-walled tube. The material-preparation container quickly dropped to the original position. Secondly, the built-in manipulator carrying the thin-walled tube moved forward to the center of the testing container and began to rotate at 320 rpm. The testing container quickly rose to a certain position, and the PLC control unit notified the PC through the RS232 serial port to begin the detection. The PC started the data acquisition card and the pulse transmitter/receiver, and the testing container began to rise slowly and uniformly so that the ultrasonic transducer could achieve full coverage spiral scanning of the thin-walled tube to be detected. Thirdly, after the detection, the built-in manipulator stopped rotating, and the testing container quickly dropped to the original position. The PC stopped the data acquisition and transferred the data processing results to the PLC control unit through an RS232 serial port. Finally, the built-in manipulator continued to move forward and based on the data processing results, the thin-walled tube identified as the unqualified product was placed on the conveyor belt of rejected product. Then, the built-in manipulator moved on, and the remaining thin-walled tubes were placed on the conveyor belt of qualified product to complete the detection process.

3.2. Multichannel Detection Method

Because the detection speed required 6 s/piece, there were three high-speed requirements for single-piece detection: (i) the assistant time was zero; (ii) the rotational speed of thin-walled tube was over 3000 rpm; (iii) the sampling frequency was over 100 MHz. These three requirements directly affected the stability, reliability, and service life of the system, and the design risk was very high. If five groups of 10-channel parallel structures were adopted, the detection time could be extended to 30 s (18 s for a detection time, 12 s for auxiliary time; the rotational speed could be reduced to 300 rpm, and the sampling frequency could be reduced to 100 kHz). Thus, not only was the impact of mechanical transmission alleviated but also sufficient processing time was provided for data acquisition and defect signal processing. The problem of detection time, which is difficult to solve, was transferred to a multi-channel problem that was relatively easy to solve. Furthermore, this laid a foundation for the stable and reliable design of the system.

4. Results and Analysis

In the detection process, the ultrasonic transducer was a point focus probe with a frequency of 2.5 MHz, a diameter of 12 mm, a focal length of 20 mm, and a focal spot of 2 mm. The diameter of the thin-walled tube was 37 mm, the length of the detection area was 255 mm, and the rotation speed was 320 rpm. Thus, 0.1875 s was required for the tube to rotate once. Based on the single-channel sampling frequency of 0.75 kHz, the number of points sampled during the rotation of the tube was calculated to be 140. The total sampling length was 20,800 points. For the longitudinal defect with a 10-mm length (i.e., the defect distributed along the axis), the theoretical detection period was 10/1.72 = 5.81 (where 10 is the length of longitudinal defect, in-unit of mm; 1.72 is the pitch; that is, the axial interval of the helix formed by ultrasonic transducer scanning along the circumferential direction of the thin-walled tube, in-unit of mm; 5.81 is the number of defect waves obtained by the ultrasonic transducer scanning the longitudinal artificial defect with 10 mm length, in-unit of cycle). For the transverse defect with a 10-mm length (i.e., the defect distributed along the circumference), the theoretical detection period was 12/1.72 = 6.98 (where 12 is the diameter of the transducer, in-unit of mm; the transverse defect is distributed along the circumference of the thin-walled tube, and the transducer is also spiral-scanned along the circumference of the thin-walled tube, so the number of cycles scanned by the transducer for the transverse defect depends on the ratio of the diameter of the transducer to the pitch; 1.72 is the pitch, in-unit of mm; 6.98 is the number of defect waves obtained by the ultrasonic transducer scanning the transverse artificial defect with a 10-mm length, in-unit of cycle). The actual number of defect detection cycles is shown in Figure 7a–h. The number of transverse defect detection cycles was seven, and the number of longitudinal defect detection cycles was 8–10. The actual detection period of the longitudinal defect was larger than the theoretical value, while that of the transverse defect was equal to the theoretical value. This was due to the different scanning and defect distribution directions.

4.1. Analysis of Qualitative Detection

The signals of the ultrasonic testing with and without flaws are shown in Figure 7. For (a), (c) and (b), (d) in Figure 7, the defects with same depth, same distribution direction, and different location, from the amplitude observation for defect wave, seemed to indicate that (a), (c) and (b), (d) in Figure 7 overlap; in fact, they were ultrasonic echo signals of defects at different locations, but the difference was very small. For (a), (b) and (c), (d) in Figure 7, the defects with the same depth, same location, and different distribution directions, the difference between them was obvious. Among them, Figure 7a–h showed the echo signals of defects with different depths, and Figure 7i,j showed the echo signal without defects. Therefore, regardless of the signal’s periodicity or amplitude, the differences in the echo signals, when flaws were present or absent, were very significant, which showed that the method adopted in this study exhibited a good detection performance for qualitative detection.

4.2. Analysis of Quantitative Detection

To better analyze the quantitative relationship between the defect depth and signal amplitude, all the defect signals were smoothed first to eliminate the influence of single-peak extrema. Second, the peak values of the echo signals at different depths were extracted and plotted. Finally, the first and last peaks of the echo signals with different depths were eliminated, and the mean of residual peaks in the signals was calculated to make the mean curve approach the peak value of the defect signals as stably as possible.
As shown in Figure 8, for longitudinal internal defects, when the defect depth increased from 0.045 to 0.073 mm, the echo signal peak value increased from 1.36 to 2.05 V. When the defect depth increased from 0.073 to 0.10 mm, the echo signal peak value increased from 2.05 to 2.76 V. For the longitudinal defect, when the defect depth increased from 0.045 to 0.073 mm, the peak value of the echo signal increased from 1.36 to 2.39 V. When the defect depth increased from 0.073 to 0.10 mm, the peak value of the echo signal increased from 2.39 to 2.86 V.
The results showed that the quantitative relationship of the internal longitudinal defects was slightly better than that of external longitudinal defects. There was a linear quantitative relationship between the depth of the longitudinal defect and the peak value of the detection signal. The depth of the detected defect could be represented by the peak value of the defect detection signal.

5. Issues and Conclusions

5.1. Issues

5.1.1. Misjudgment

Based on the minimum defect standard of 10 × 0.15 × 0.045 (length × width × depth) (taking a thin-walled tube with a 0.045-mm depth artificial defect as a standard test block, when the signal amplitude of the Lamb wave for the defect in the detected thin-walled tube is greater than or equal to the signal amplitude of the Lamb wave for the artificial defect in the standard test block, and the signal periods of the Lamb wave for the defect is greater than or equal to the signal periods of Lamb wave for the artificial defect in the standard test block, the tested thin-walled tube will be judged as unqualified product. Otherwise, the tested product will be judged as a qualified product. The missed detection rate is the ratio of unqualified products that are identified as qualified products to the total detected quantity, while the reject rate is the ratio of unqualified products to the total detected quantity), 100,000 thin-walled tubes were tested. The test results showed that the leakage rate was 0%, the rejection rate was 0.3%, and the average detection time of each product was 5.8 s, which fully meets the actual application requirements of a production line. Owing to the airbag located at the top of the built-in manipulator being cut, a small amount of water penetrated the thin-walled tubes during detection, resulting in misjudgment. This problem was solved by modifying the sawing technology of the mouth of the thin-walled tube.

5.1.2. Signal-to-Noise Ratio

To solve the problem of the rapid detection of thin-walled tubes, a multi-channel parallel detection method was adopted. Owing to the differences in the components between channels, some channels had high signal-to-noise ratios and no noise, as shown in Figure 7a–d,g,h. Other channels had echo noise with small amplitudes, as shown in Figure 7e,f,i,j. In the follow-up equipment development process, it is necessary to further optimize the design of related hardware circuits to further improve the consistency of multi-channel detection signals.

5.2. Conclusions

In the development process of on-line Lamb wave detection equipment for microcracks in thin-walled tubes, the following conclusions were drawn.
(i)
Based on the calculation and simulation of phase velocity, incident angle, and particle amplitude displacement, the Lamb wave A 0 mode with the highest sensitivity to the inner wall and outer wall cracks of thin-walled tubes was determined. This is consistent with the results of Ref. [37].
(ii)
A defect signal extraction circuit was designed, which greatly reduced the amount of data acquired and improved the data processing speed.
(iii)
Rapid on-line detection equipment for microcracks in thin-walled tubes was developed, and the engineering application of rapid detection of microcracks by Lamb waves was realized.
(iv)
For the 0.045-mm depth of the artificial defect, whether the inner wall, or outer wall of the longitudinal defect, or the transverse defect, there was almost no difference in the shape and amplitude of the defect waveform. However, for the inner wall of the longitudinal defect and the transverse defect, or the outer wall of the longitudinal defect and the transverse defect, waveform amplitude and contour had certain differences.
(v)
For the artificial defects with depths of 0.073 and 0.10 mm, the longitudinal defects of the inner and outer walls were quite different in terms of waveform profile and amplitude.
(vi)
This study not only solved the practical issue of the rapid detection of microcracks in thin-walled tubes but also provided a reference for the application of ultrasonic technology to detect other components.

Author Contributions

Conceptualization, S.Y. and M.W.; Methodology, S.Y.; Software, S.Y. and L.Y.; Validation, L.Y., and S.Y.; Formal Analysis, M.W.; Investigation, L.Y.; Resources, M.W.; Data Curation, L.Y.; Writing—Original Draft Preparation, S.Y.; Writing—Review and Editing, S.Y. and M.W.; Visualization, L.Y.; Supervision, M.W.; Project Administration, S.Y. and M.W.; Funding Acquisition, M.W.

Funding

This work was supported by the National Key Scientific Instrument and Equipment Development Projects of China (Grant No. 2013YQ240803) and the International Science and Technology Cooperation Program of Shanxi, China (Grant No. 201803D421032).

Conflicts of Interest

The authors declare no conflict of interest.

References

  1. Shim, H.; Choi, M.S.; Lee, D.H.; Hur, D.H. A prediction method for the general corrosion behavior of Alloy 690 steam generator tube using eddy current testing. Nucl. Eng. Des. 2016, 297, 26–31. [Google Scholar] [CrossRef]
  2. Buck, J.A.; Underhill, P.R.; Morelli, J.; Krause, T.W. Intranets: Evaluation of machine learning tools for inspection of steam generator tube structures using pulsed eddy. In Proceedings of the 43th Annual Review of Progress in Quantitative Nondestructive Evaluation, Atlanta, GA, USA, 17–22 July 2016; AIP: Atlanta, GA, USA, 2016; Volume 36. [Google Scholar] [CrossRef]
  3. Liu, Y.; Lian, Z.; Lin, T.; Shen, Y.; Zhang, Q. A study on axial cracking failure of drill pipe body. Eng. Fail. Anal. 2015, 59, 434–443. [Google Scholar] [CrossRef]
  4. Dong, B.; Fang, G.; Liu, Y.; Dong, P.; Zhang, J.; Xing, F.; Hong, S. Monitoring reinforcement corrosion and corrosion-induced cracking by X-ray microcomputed tomography method. Cem. Concr. Res. 2017, 100, 311–321. [Google Scholar] [CrossRef]
  5. Lauridsen, T.; Willner, M.; Bech, M.; Pfeiffer, F.; Feidenhans, R. Detection of sub-pixel fractures in X-ray dark-field tomography. Appl. Phys. A 2015, 121, 1243–1250. [Google Scholar] [CrossRef]
  6. Irek, P.; Slania, J. Material factors in relation to development time in liquid-penetrant inspection. Part 1. Material factors. Arch. Metall. Mater. 2016, 61, 509–514. [Google Scholar] [CrossRef]
  7. Irek, P.; Slania, J. Material factors in relation to development time in liquid-penetrant inspection. Part 2. InvestIgatIon programme and preliminary tests. Arch. Metall. Mater. 2016, 61, 1697–1708. [Google Scholar] [CrossRef]
  8. Irek, P.; Slania, J. Material factors in relation to development time in liquid-penetrant inspection. Part 3. Testing of model plates. Arch. Metall. Mater. 2017, 62, 41–49. [Google Scholar] [CrossRef] [Green Version]
  9. Rose, J.L. Ultrasonic Waves in Solid Media; Cambridge University Press: New York, NY, USA, 2004; pp. 73–143. [Google Scholar]
  10. Hellier, C. Handbook of Nondestructive Evaluation; McGraw-Hill: New York, NY, USA, 2003; pp. 1–7. [Google Scholar]
  11. Rose, J.L. Ultrasonic Guided Waves in Solid Media; Cambridge University Press: New York, NY, USA, 2014; pp. 48–137. [Google Scholar]
  12. Li, Z.; He, C.; Liu, Z.; Wu, B. Quantitative detection of lamination defect in thin-walled metallic pipe by using circumferential Lamb waves based on wavenumber analysis method. NDT E Int. 2019, 102, 56–67. [Google Scholar] [CrossRef]
  13. Howard, R.; Cegla, F. Detectability of corrosion damage with circumferential guided waves in reflection and transmission. NDT E Int. 2017, 91, 108–119. [Google Scholar] [CrossRef]
  14. Liu, K.; Wu, Z.; Jiang, Y.; Wang, Y.; Zhou, K.; Chen, Y. Guided waves based diagnostic imaging of circumferential cracks in small-diameter pipe. Ultrasonics 2016, 65, 34–42. [Google Scholar] [CrossRef]
  15. Yeung, C.; Ng, C.T. Time-domain spectral finite element method for analysis of torsional guided waves scattering and mode conversion by cracks in pipes. Mech. Syst. Signal Process. 2019, 128, 305–317. [Google Scholar] [CrossRef]
  16. Zhanga, X.; Tangb, Z.; Lva, F.; Yang, K. Scattering of torsional flexural guided waves from circular holes and crack-like defects in hollow cylinders. NDT E Int. 2017, 89, 56–66. [Google Scholar] [CrossRef]
  17. Lowea, P.S.; Sandersonb, R.; Pedrama, S.K.; Boulgouris, N.V.; Mudge, P. Inspection of pipelines using the first longitudinal guided wave mode. Phys. Procedia 2015, 70, 338–342. [Google Scholar] [CrossRef]
  18. Liu, Z.; Hu, Y.; Fan, J.; Yin, W.; Liu, X.; He, C.; Wu, B. Longitudinal mode magnetostrictive patch transducer array employing a multi-splitting meander coil for pipe inspection. NDT E Int. 2016, 79, 30–37. [Google Scholar] [CrossRef]
  19. Heinlein, S.; Cawley, P.; Vogt, T.K. Reflection of torsional T (0,1) guided waves from defects in pipe bends. NDT E Int. 2018, 93, 57–63. [Google Scholar] [CrossRef]
  20. Nakamura, N.; Ogi, H.; Hirao, M. EMAT pipe inspection technique using higher mode torsional guided wave T (0,2). NDT E Int. 2017, 87, 78–84. [Google Scholar]
  21. Niu, X.; Duan, W.; Chen, H.P.; Marques, H.R. Excitation and propagation of torsional T (0,1) mode for guided wave testing of pipeline integrity. Measurement 2019, 131, 341–348. [Google Scholar] [CrossRef]
  22. Kim, Y.; Park, K. Characterization of axial and oblique defects in pipes using fundamental torsional guided modes. NDT E Int. 2017, 92, 149–158. [Google Scholar] [CrossRef]
  23. Muggleton, M.; Kalkowski, M.; Gao, Y.; Rustighi, E. A theoretical study of the fundamental torsional wave in buried pipes for pipeline condition assessment and monitoring. J. Sound Vib. 2016, 374, 155–171. [Google Scholar] [CrossRef]
  24. Zhang, X.; Tang, Z.; Lv, F.; Pan, X. Helical comb magnetostrictive patch transducers for inspecting spiral welded pipes using flexural guided waves. Ultrasonics 2017, 74, 1–10. [Google Scholar] [CrossRef]
  25. Zhang, X.; Tang, Z.; Lü, F.; Pan, X. Excitation of dominant flexural guided waves in elastic hollow cylinders using time delay circular array transducers. Wave Motion 2016, 62, 41–54. [Google Scholar] [CrossRef]
  26. Li, J.; Rose, J.L. Natural beam focusing of non-axisymmetric guided waves in large-diameter pipes. Ultrasonics 2005, 44, 35–45. [Google Scholar] [CrossRef] [PubMed]
  27. Nishino, H.; Takashina, S.; Uchida, F.; Takemoto, M.; Ono, K. Modal analysis of hollow cylindrical guided waves and applications. Jpn. J. Appl. Phys. 2001, 40, 364–370. [Google Scholar] [CrossRef]
  28. Velichko, A.; Wilcox, P.D. Excitation and scattering of guided waves: Relationship between solutions for plates and pPipes. J. Acoust. Soc. Am. 2009, 125, 3623–3631. [Google Scholar] [CrossRef] [PubMed]
  29. He, C.; Li, L.; Wu, B. Guided circumferential waves in hollow cylinders. Chin. J. Mech. Eng. 2004, 40, 7–12. [Google Scholar] [CrossRef]
  30. Qi, L.; Ya, X.X.; Li, X.D.; Yu, S.F. Multiphysics simulation method of lamb wave propagation with piezoelectric transducers under load condition. Chin. J. Aeronaut. 2019, 32, 1071–1086. [Google Scholar] [CrossRef]
  31. He, J.; Dixon, S.; Hill, S.; Xu, K. A new electromagnetic acoustic transducer design for generating and receiving S0 lamb waves in ferromagnetic steel plate. Sensors 2017, 17, 1023. [Google Scholar] [CrossRef]
  32. Zhang, K.; Zhou, Z. Quantitative characterization of disbonds in multilayered bonded composites using laser ultrasonic guided waves. NDT E Int. 2018, 97, 42–50. [Google Scholar] [CrossRef]
  33. Gupta, S.; Rajagopal, P. Effect of ply orientation and through-thickness position of delamination on the reflection of fundamental symmetric S0 Lamb mode in GFRP. Ultrasonics 2018, 90, 109–119. [Google Scholar] [CrossRef]
  34. Mori, N.; Biwa, S. Transmission characteristics of the S0 and A0 Lamb waves at contacting edges of plates. Ultrasonics 2017, 81, 93–99. [Google Scholar] [CrossRef]
  35. Cho, Y.; Hongerholt, D.D.; Rose, J.L. Lamb wave scattering analysis for reflector characterization. IEEE Trans. Ultrason. Ferroelectr. Freq. Control 1997, 44, 44. [Google Scholar]
  36. Ochôa, P.; Infante, V.; Silva, J.M.; Groves, R.M. Detection of multiple low-energy impact damage in composite plates using Lamb wave techniques. Compos. Part B Eng. 2015, 80, 291–298. [Google Scholar] [CrossRef]
  37. Pant, S.; Laliberte, J.; Martinez, M.; Rocha, B.; Ancrum, D. Effects of composite lamina properties on fundamental Lamb wave mode dispersion characteristics. Compos. Struct. 2015, 124, 236–252. [Google Scholar] [CrossRef]
  38. Shen, Y.; Cesnik, C.E.S. Nonlinear scattering and mode conversion of Lamb waves at breathing cracks: An efficient numerical approach. Ultrasonics 2019, 94, 202–217. [Google Scholar] [CrossRef] [PubMed]
  39. Ai, C.; Cai, X.; Li, J.; Liu, K. Intranets: Finite element simulation of Lamb wave detection in thin plate. In Proceedings of the International Conference on Mechatronics Engineering & Information Technology, Xi’an, China, 27–28 August 2016; Atlantis Press: Xi’an, China, 2016. [Google Scholar] [CrossRef]
  40. Senyurek, V.Y. Detection of cuts and impact damage at the aircraft wing slat by using Lamb wave method. Measurement 2015, 67, 10–23. [Google Scholar] [CrossRef]
  41. Alkassar, Y.; Agarwal, V.K.; Alshrihi, E. Simulation of Lamb wave modes conversions in a thin plate for damage detection. Procedia Eng. 2017, 173, 948–955. [Google Scholar] [CrossRef]
  42. Yelve, N.P.; Mulla, I.B. Locating damage in thin metallic plates using Lamb waves and Artificial Neural Network. In Proceedings of the International Conference on Nascent Technologies in Engineering, Navi Mumbai, India, 27–28 January 2017. [Google Scholar]
  43. Fan, G.; Zhang, H.; Zhang, H.; Zhu, W.; Chai, X. Lamb wave local wavenumber approach for characterizing flat bottom defects in an isotropic thin plate. Appl. Sci. 2018, 8, 1600. [Google Scholar] [CrossRef]
  44. Viktorov, I.A. Rayleigh and Lamb Waves: Physical Theory and Applications; Plenum Press: New York, NY, USA, 1967; pp. 75–82. [Google Scholar]
Figure 1. Structural sketch of a thin-walled tube.
Applsci 09 03576 g001
Figure 2. Relationship between the phase velocity c p and frequency-times-thickness f d for Lamb waves in a steel plate (the S-wave velocity was 5970 m/s, the P-wave velocity was 3200 m/s, and Poisson’s ratio was 0.28).
Applsci 09 03576 g002
Figure 3. Particle displacement-amplitude curves of A 0 and S 0 modes in steel plate ((a) A 0 mode; (b) S 0 mode).
Applsci 09 03576 g003
Figure 4. Relationship between the incident angle and frequency-times-thickness in steel (the P-wave velocity in water was 1480 m/s).
Applsci 09 03576 g004
Figure 5. Appearance of testing equipment (1. PLC control unit; 2. PC control unit; 3. mechanical device).
Applsci 09 03576 g005
Figure 6. Core components of testing equipment (1. material-preparation container; 2. testing container; 3. ultrasonic transducer; 4. built-in manipulator).
Applsci 09 03576 g006
Figure 7. Signal with and without flaw ((a) Depth of inner transverse flaw was 0.045 mm; (b) Depth of inner longitudinal flaw was 0.045 mm; (c) Depth of outer transverse flaw was 0.045 mm; (d) Depth of outer longitudinal flaw was 0.045 mm; (e) Depth of inner longitudinal flaw was 0.073 mm; (f) Depth of outer longitudinal flaw was 0.073 mm; (g) Depth of inner longitudinal flaw was 0.10 mm; (h) Depth of outer longitudinal flaw was 0.10 mm; (i) Signal without flaw and with strong noise; (j) Signal without flaw and with weak noise).
Applsci 09 03576 g007aApplsci 09 03576 g007b
Figure 8. The peak of flaw signal with different depths ((a) The peak of inner flaw signal with different depths; (b) The peak of outer flaw signal with different depths).
Applsci 09 03576 g008
Table 1. Artificial defects of different depths.
Defect TypesDefect Position (Away from the Mouth)/mmDefect Depth/mm
Inner circumferential distribution400.045 ± 0.005
Inner axial distribution600.045 ± 0.005
Outer axial distribution500.045 ± 0.005
Inner axial distribution800.045 ± 0.005
Outer axial distribution600.073 ± 0.005
Inner axial distribution800.073 ± 0.005
Outer axial distribution600.10 ± 0.005
Outer axial distribution800.10 ± 0.005

