Article

An Experimental and Numerical Study of CO2–Brine-Synthetic Sandstone Interactions under High-Pressure (P)–Temperature (T) Reservoir Conditions

1
PetroChina Exploration and Development Research Institute, Beijing 100083, China
2
Key Laboratory of Basin Structure and Hydrocarbon Accumulation, CNPC, Beijing 100083, China
3
Department of Middle East E & P, CNPC, Beijing 100083, China
4
School of Geosciences, China University of Petroleum, Qingdao 266580, China
5
Enhanced Oil Recovery Research Institute, China University of Petroleum, Beijing 100083, China
*
Author to whom correspondence should be addressed.
Appl. Sci. 2019, 9(16), 3354; https://doi.org/10.3390/app9163354
Submission received: 28 June 2019 / Revised: 31 July 2019 / Accepted: 12 August 2019 / Published: 15 August 2019

Abstract

:
The interaction between CO2 and rock during the process of CO2 capture and storage was investigated via reactions of CO2, formation water, and synthetic sandstone cores in a stainless-steel reactor under high pressure and temperature. Numerical modelling was also undertaken, with results consistent with experimental outcomes. Both methods indicate that carbonates such as calcite and dolomite readily dissolve, whereas silicates such as quartz, K-feldspar, and albite do not. Core porosity did not change significantly after CO2 injection. No new minerals associated with CO2 injection were observed experimentally, although some quartz and kaolinite precipitated in the numerical modelling. Mineral dissolution is the dominant reaction at the beginning of CO2 injection. Results of experiments have verified the numerical outcomes, with experimentally derived kinetic parameters making the numerical modelling more reliable. The combination of experimental simulations and numerical modelling provides new insights into CO2 dissolution mechanisms in high-pressure/temperature reservoirs and improves understanding of geochemical reactions in CO2-brine-rock systems, with particular relevance to CO2 entry of the reservoir.

1. Introduction

Carbon dioxide emissions from fossil-fuel combustion are projected to increase from 13 Gt yr−1 in 2010 to 20–24 Gt yr−1 in 2050 [1]. CO2 capture and storage (CCS) technologies beneficially affect the lifecycle of greenhouse gases emitted from fossil-fuel power plants [2,3], with CCS expected to account for up to 19% of global CO2 emission reductions by 2050, making it the most significant technology worldwide in this area [4]. Suitable geological formations for CCS include depleted oil and gas reservoirs, un-mineable coal seams, salt caverns, and deep saline aquifers [5,6]. After CO2 injection, the initial physico-chemical equilibrium between saline formation fluid and reservoir rocks can be disturbed by the triggering of reactions between CO2, fluid (brine), and reservoir rock [2]. Such interactions could lead to the dissolution of carbonates, feldspars, and clay cement in the aquifers [7,8]. In the absence of dynamic forces, such mineral dissolution could increase porosity and permeability by etching new pore spaces or widening narrow pore channels, temporarily increasing injectivity [9,10]. However, while sequestration of CO2 in carbonate minerals can contribute to long-term storage security [11], rapid mineral dissolution, especially of carbonates, could corrode caprocks, wellbores, and fault seals, potentially leading to migration of CO2 into overlying formations. Study of CO2-fluid-rock interactions is thus crucial for us to understand the physico-chemical processes involved.
Laboratory experiments can reveal the mineralogical and chemical changes resulting from CO2-brine-rock interactions, how they impact the lithological porosity and permeability of the geological sequence, and the effects on CCS potential [12,13,14,15]. However, experiments are limited to short-term effects of CO2 injection, whereas CCS is a long-term geochemical issue. Numerical modelling or simulation is useful for longer-tern studies. Several reactive geochemical transport models have been developed to simulate CCS, including NUFT [16], PFLOTRAN [17], CMG-GEM [18], STOMP [19], and TOUGHREACT [20,21]. The TOUGHREACT program has been widely used in studying geological CO2 sequestration [22,23,24,25,26]. However, simulations are less reliable without the availability of parameters derived from laboratory studies, so a combination of physical experiments and numerical simulation is the optimal choice for investigating the geochemical effects following CO2 injection.
In this study, both laboratory experiments (physical simulation) and numerical modelling were used to study geochemical interactions between CO2-induced fluids and reservoir rock during CCS. In the physical simulation, synthetic cores with composition consistent with geological samples were used to avoid interference from other geological factors such as sedimentary processes and diagenesis. The numerical simulation involved the same conditions of sample compositions, temperature, pressure, and fluid composition, with the two simulation types being mutually authenticating. Both numerical and physical simulations were used to document the process of short-term geochemical interactions after CO2 injection. A consistency of results would indicate the reliability of the simulations, with outcomes expected to be similar to those pertaining to actual geological conditions.

2. Samples and Methods

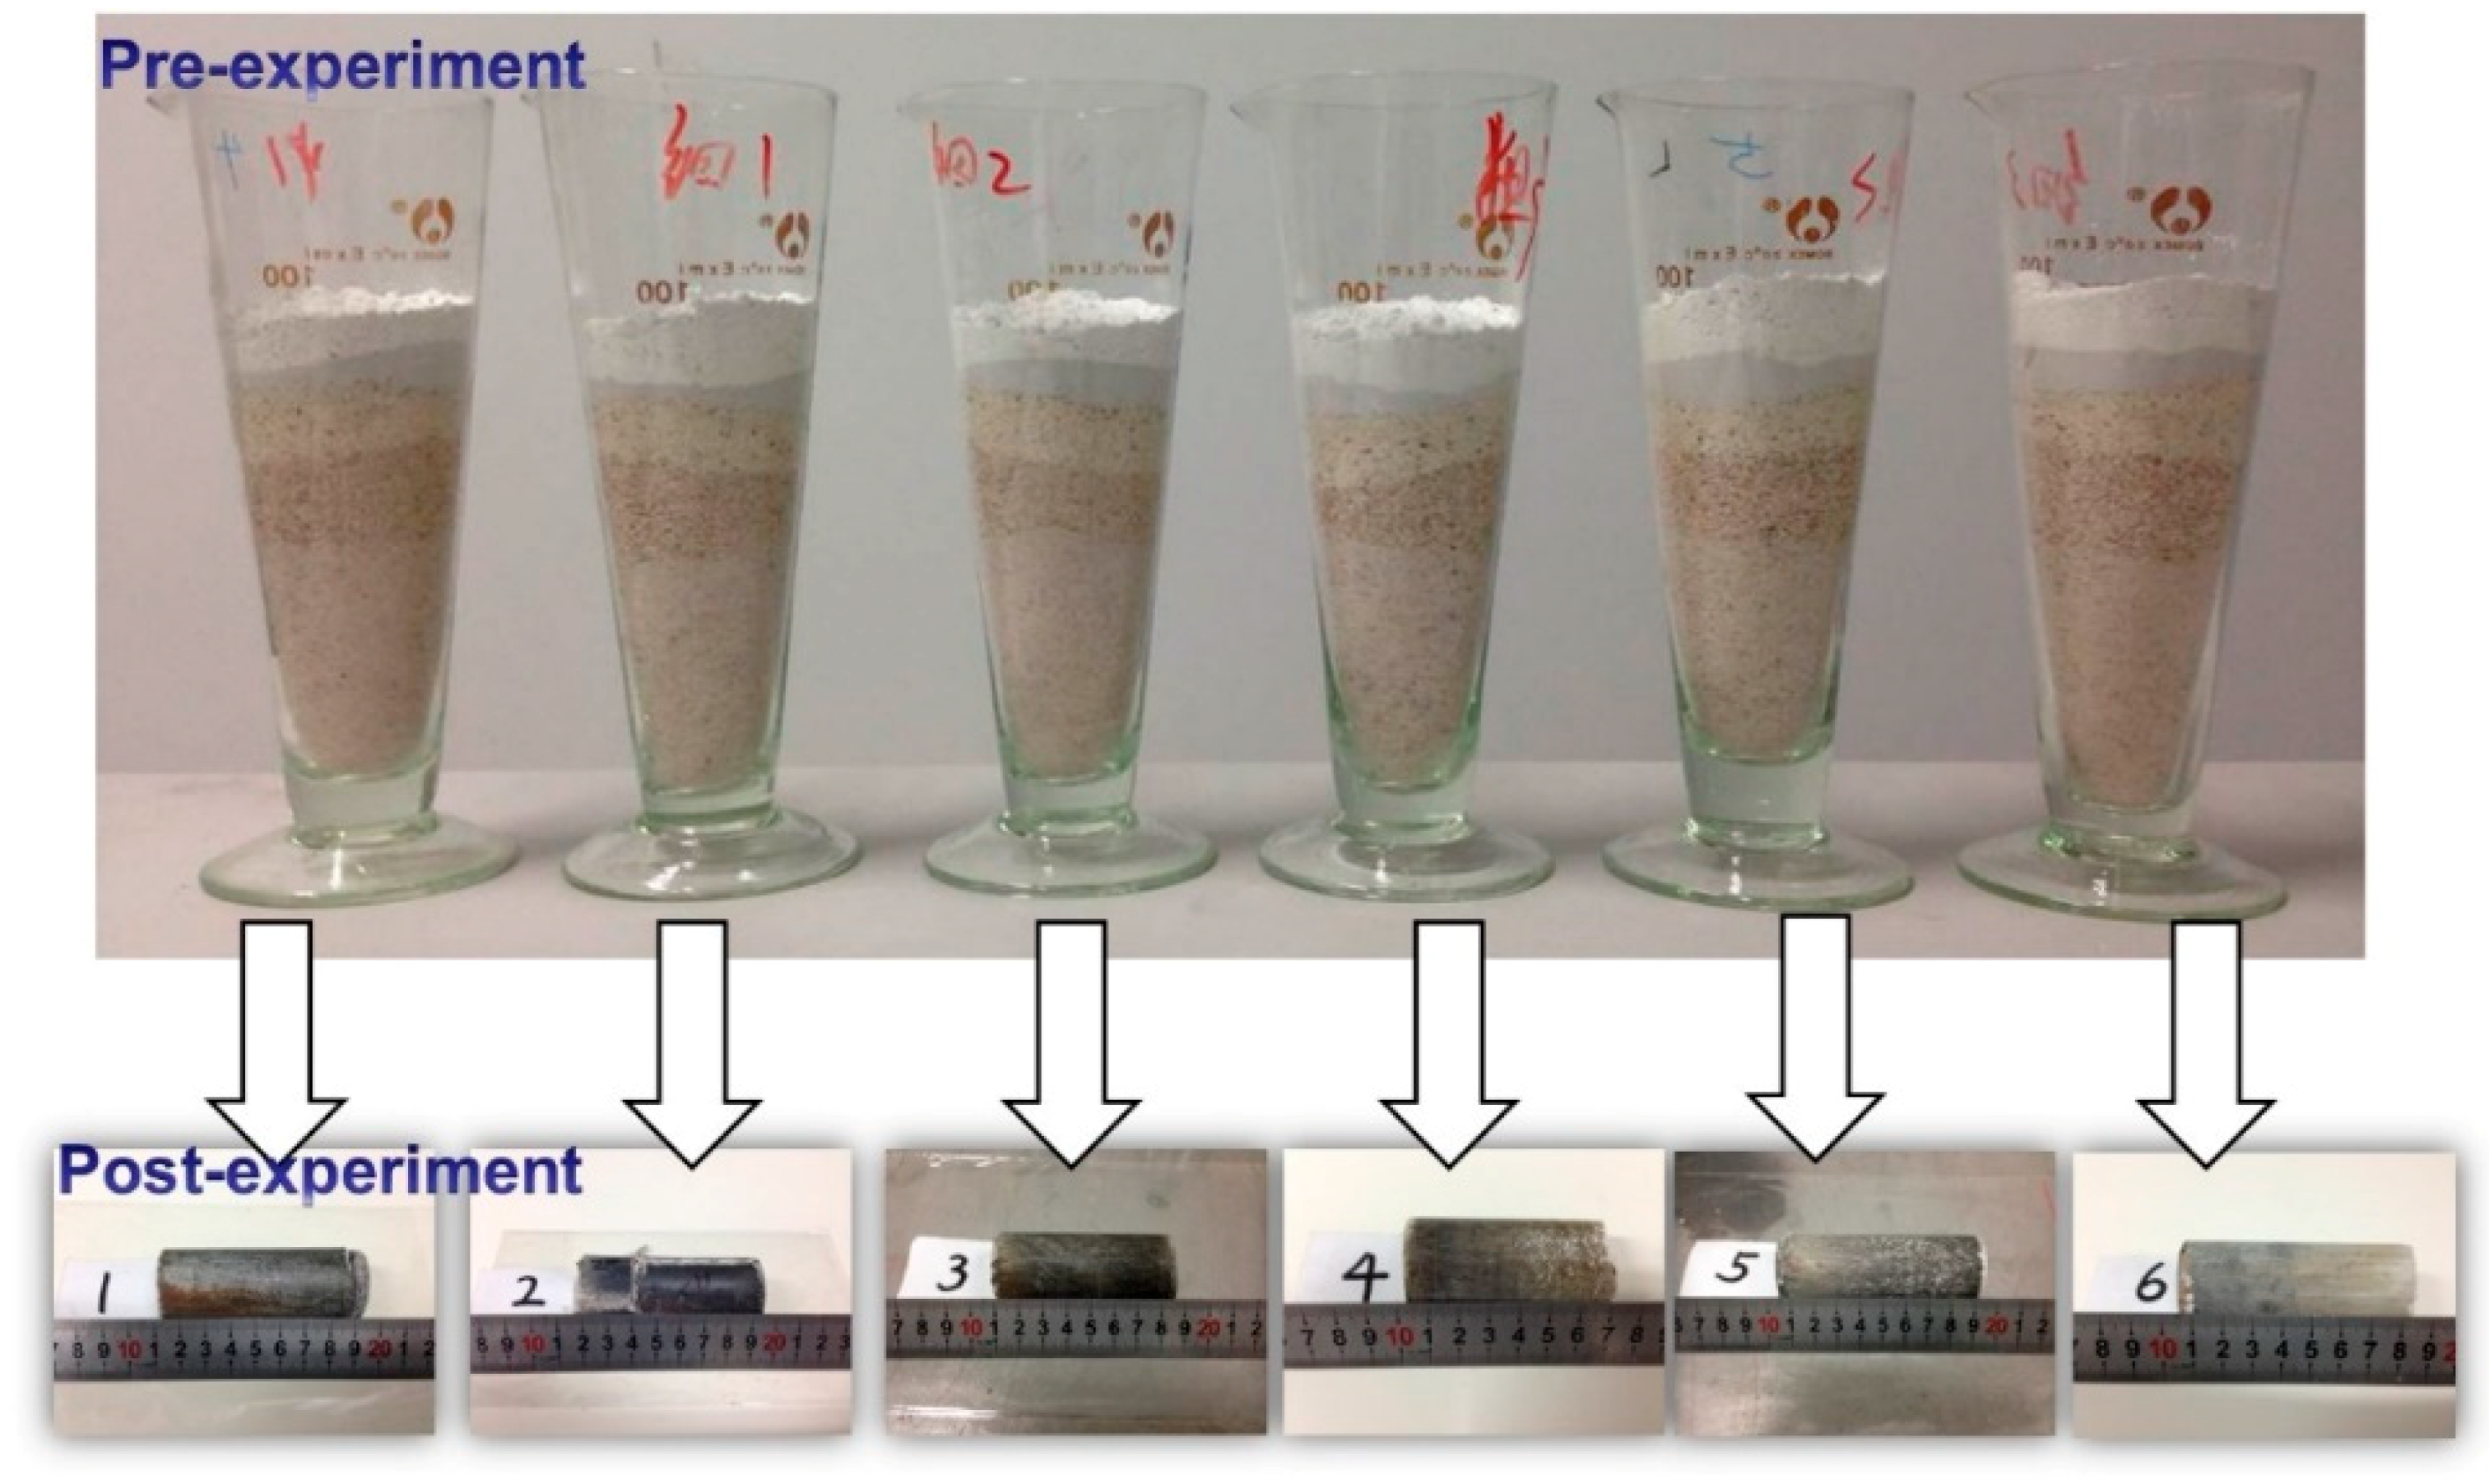
2.1. Sample Descriptions

Six synthetic sandstones were prepared for the physical simulation, with mineralogical compositions similar to sandstones of the Cretaceous Bashijiqike Formation (K1bs) of the Kuqa Depression, Tarim Basin, and western China. In order to identify mineralogical compositions of K1bs sandstones, the sandstone samples were prepared in thin sections and examined petrographically by point counting 300 to 400 points per section. In addition, these sandstones were also measured using quantitative X-ray diffraction analysis (D/max2500, Rigaku, Tokyo, Japan), which can provide quantitative mineralogical results within ±0.1 weight percentage (wt. %). The detail analysis processes can be found in Yu et al. (2012) [15]. The analytical results indicated that K1bs sandstones are fine- to medium-grained lithic sandstones with particle sizes of 0.25~0.5 mm, comprising mainly quartz (average ~37.5 wt. %), plagioclase (~20.8 wt. %), K-feldspar (~23.3 wt. %), calcite (~9.5 wt. %), dolomite (~7.4 wt. %), and kaolinite (~1.5 wt. %) (Table 1). According to Yu et al. (2015) [27], the K1bs reservoir sandstones were at the stage of mesogenetic diagenetic phase. Then we used the fine- to medium-grained mineral powders (particle size of 0.25~0.5 mm), having the above-mentioned mineralogical compositions, to reconstruct the six synthetic cores under the condition of mesogenetic diagenesis.

2.2. Physical Experimental Conditions

The experimental condition is outlined as the following: (1) 48.45 MPa back-pressure (pore fluid pressure), (2) 60 MPa confining pressure, (3) 150 °C reaction autoclave temperature (formation temperature). The injection solutions were prepared by dissolving NaCl in deionized water saturated with CO2 at 150 °C and 48.45 MPa, similar to actual K1bs conditions. The injection solutions had a salinity of 14,182 mg L−1, approximating K1bs formation water. Here we only used the NaCl solution as the injection fluids and did not employ the imitate reservoir brines, because an amount of divalent cations, such as Ca2+ and Fe2+, were present in the reservoir bines. After CO2 induced fluid injection into the autoclaves, some carbonates will precipitate and affect experimental results. Thus, pure NaCl solution, having a similar salinity with K1bs formation water, would be the most appropriate.
Under the experimental condition (P = 48.45 MPa and T = 150 °C), the injection solution was saturated with CO2. For the solution with a salinity of 14,000 mg L−1, the solubility of CO−2 was 1.5451 mol/Kg, according to the CO−2 solubility in bine of Duan and Sun (2003) [28]. During the experiment, the injected Vbrine (brine volume), and the volume of CO2 injected into the cylinder was VCO2. Based on the equation of sate (EOS ) for gas, PV = ZnRT, where Z is the compressibility, n is the mole number of CO2 (nCO2) in the injection solution, R is gas constant, and T is temperature, we can obtain the volume of CO2 (VCO2soluble) dissolved in the injection solutions under the experimental condition (P = 48.45 MPa and T = 150 °C). Thus we can calculate the volume of the CO2 gas cap (VCO2gc) in the intermediate container. The derivation is as follows:
VCO2gc = VCO2 − VCO2soluble
VCO2 =1030 − Vkerosene − Vbrine
VCO2soluble = ZnCO2RT/P
Based on the above, it is possible to calculate the volume of CO2 in the gas cap of the intermediate container, which was ca.190.56 mL. Therefore the brine was CO2 saturated throughout the experiments.

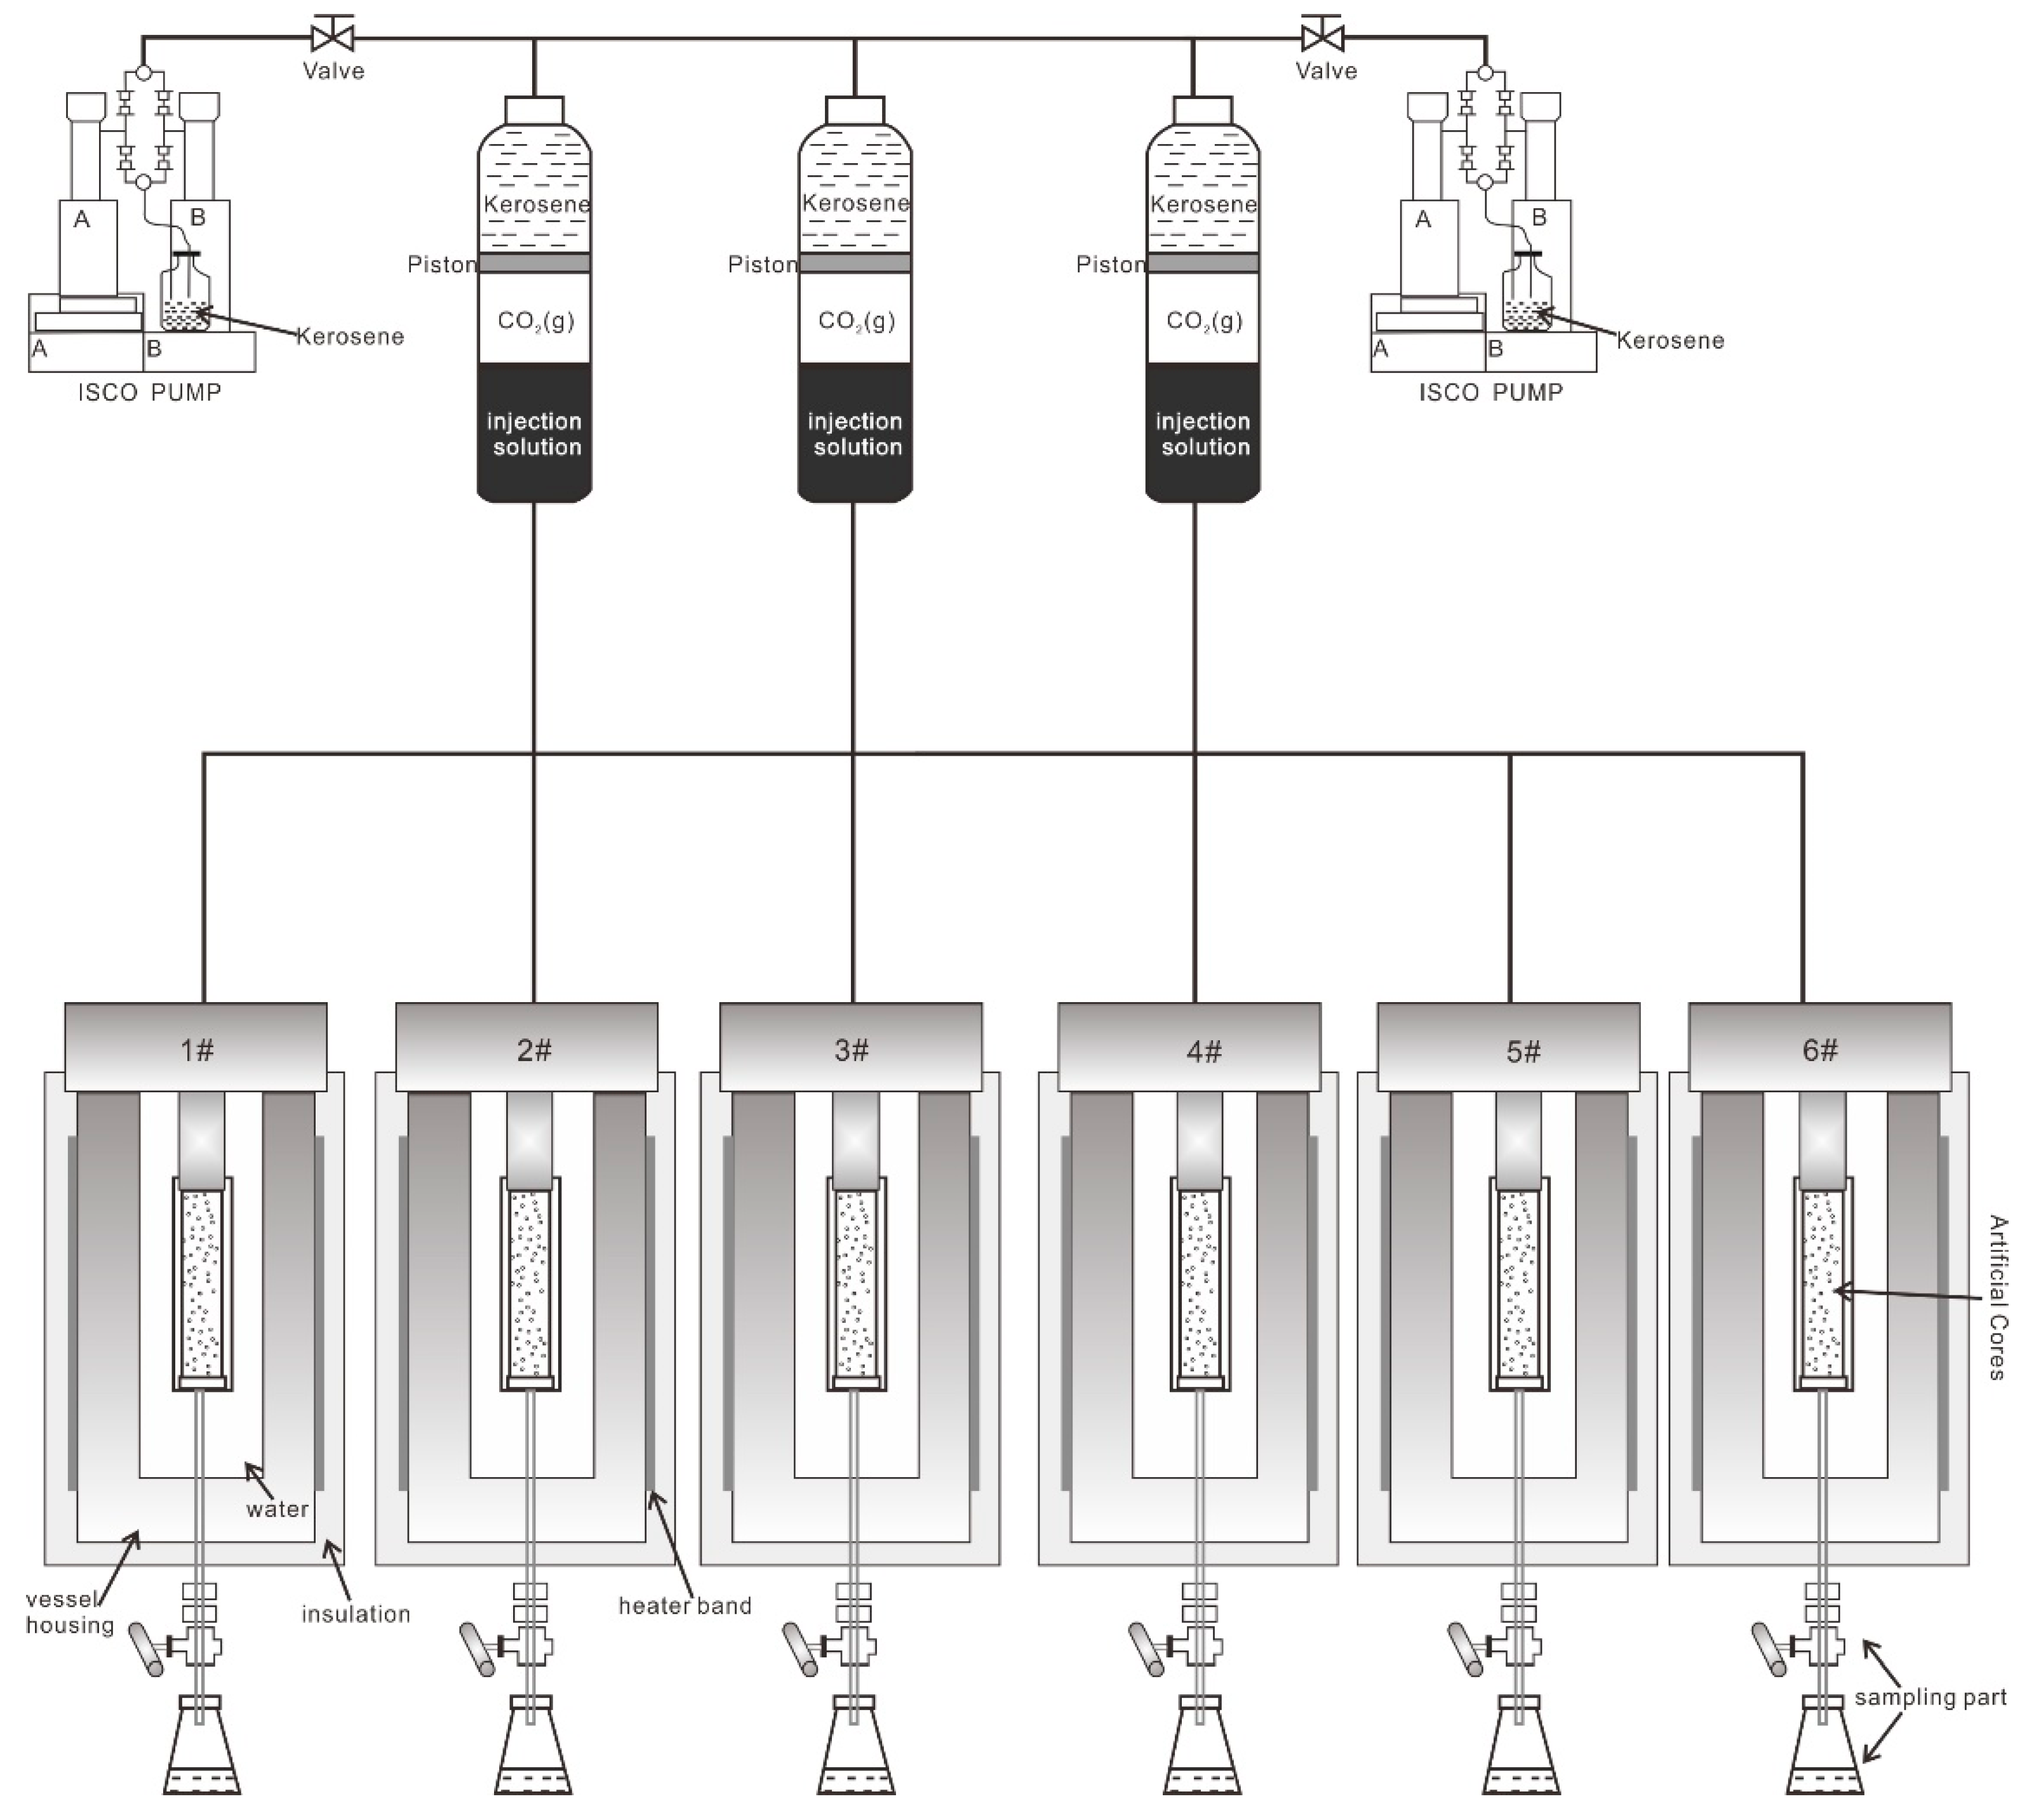
2.3. Experimental Apparatus

The physical simulation experiment was conducted at the Key Laboratory of Basin Structure and Hydrocarbon Accumulation of the China National Petroleum Corporation, Beijing, China. A reservoir diagenesis modelling system with six identical reaction autoclaves was employed (Figure 1). The system includes six modules: heating furnace, pressure system, fluid-injection system, sampling system, control panel, and auxiliary system. In addition, a corrosion-resistant HP/HT CFR-50-100 cylinder (1030 mL) from TEMC, USA was used as an intermediate container for storing the CO2-bearing experimental solution. The six reaction autoclaves (Huaxing Company, Nan tong, Jiangxi Province, China) have a working pressure of 165 MPa and temperature of 300 °C. The pressure and fluid injection systems are controlled by the injection syringe pump and a back-pressure regulator. The 100DX syringe pump (Teledyne ISCO, Lincoln NE, USA) was used to control the fluid injection system, which consists of two separate systems (A and B), each of which has a capacity of 103 mL (Figure 1). It is capable of injecting at rates of 0.001~60 mL/min, with a precision of 0.5% of set point. The pump can handle pressure from 0.1 to 68.97 MPa. The advantage of this pump is its capability of continuous injection of any fluids including supercritical CO2. The pore-fluid pressure was controlled by the back-pressure regulator (DBRP-005, Honeywell, USA), which has a high precision and operating pressure range up to 51.72 MPa. All experimental parameters including the injection pressure, pore fluid pressure, and temperature were monitored.

2.4. Physical Simulation Workflow and Analysis

The experiment was undertaken in two steps: preparation of the synthetic core, and geochemical reaction between the core and CO2 fluids. During the first step, the selected mineral powder (particle size 0.25~0.5 mm) was blended with distilled water and placed in six columnar autoclaves (diameter 3.0 cm, length 11 cm, volume 77.7 cm3). The six core samples (# 1 to # 6) were used in the experiment over 5 days under P/T conditions equivalent to mesogenetic diagenesis (Figure 2). The syringe-pump injection system injected synthetic formation water saturated with CO2 into the six synthetic core pores at 150 °C and 48.45 MPa, after which temperature and pressure were kept constant for 4 d (# 1), 7 d (# 3), 10 d (# 4), 13 d (# 5), and 16 d (# 6), while # 2 was used as a blank.
During the experiment, the temperature and pressure of each autoclave were monitored automatically by the control system. After reaction, core and fluid samples were analyzed for ion contents, mineralogical changes, and porosity. The producing fluid was measured for its pH values using an Orion4 STAR acidity meter from Thermo within 6 h of each sampling. The ionic compositions of the water were analyzed after being spiked with 1 mol/L HCl in order to avoid carbonates precipitation, and measured using an OPTIMA 7300DX ICP-OES (Inductively Coupled Plasma–Optical Emission Spectrometry) with an analytical precision of 10−3~10−9. Mineralogical changes were examined using a JSM6700F scanning electron microscope from JEOL with EDS (Energy Dispersive Spectrometer) from INCA software (Oxford Company, Oxford, England). The porosity changes were analyzed using visual porosity estimation, which is an image analysis technique. Firstly, core samples were impregnated with blue epoxy and then polished and made into casting thin sections. Then, combined high-resolution images of these thin sections were taken under the optical petrographic microscope; the image analysis software can delineate different types of porosity and calculate the percentages of these porosities in the thin sections with an accuracy of up to 0.01%.

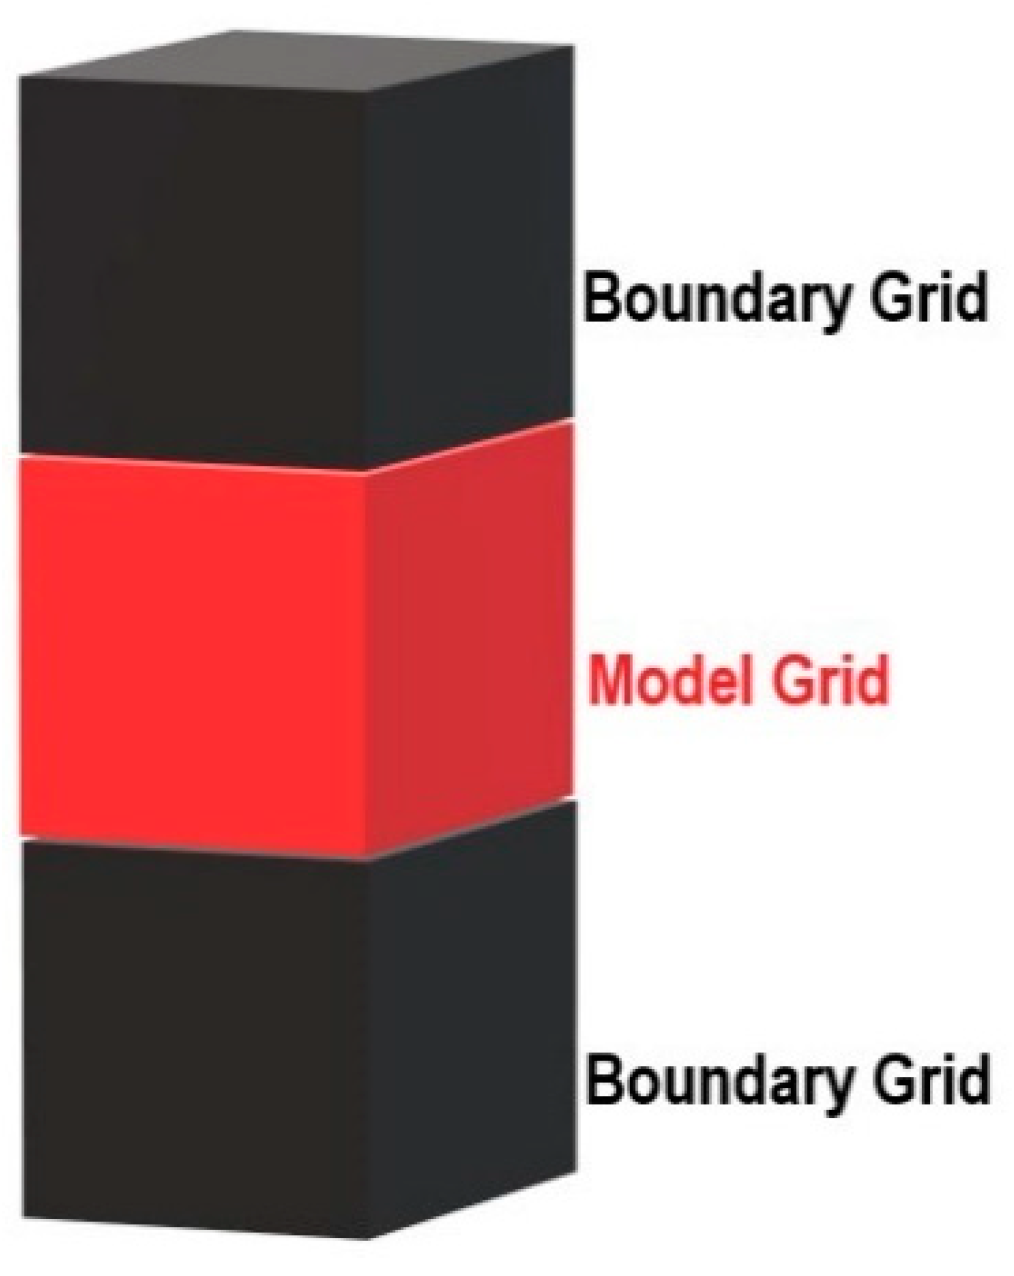
2.5. Numerical Simulation

The program TOUGHREACT was used in the numerical simulations. This program is a non-isothermal, multiphase reactive transport simulation code that was used here to simulate fluid-rock interactions [21]. The kinetic data used during the simulation are shown in Table 2.
According to the columnar autoclaves employed by the physical simulation, three identical cubic grids with volumes of 77.7 cm3 were used to construct the model (Figure 3). The upper and lower grids were used as boundary cells, while the middle grid was the objective model grid for simulating the processes of injection and sampling. The numerical model simulated six autoclave reactions, corresponding to the laboratory experiment, with the same mineralogical cores, temperature, pressure, and pore fluids. We used the simulation duration to mimic the six numbered autoclaves. The entire simulation ran for 16 days with intermittent sampling on day 0, 4, 7, 10, 13, and 16, corresponding to the physical simulation. At the start of simulation (Day zero), the numerical model had an initial mineralogical composition and visual porosity, which corresponded to Autoclave # 2. In the same way, Day 4 corresponded to Autoclave # 1, Day 7 corresponded to Autoclave # 3, Day 10 corresponded to Autoclave # 4, Day 13 corresponded to Autoclave # 5, and Day 16 corresponded to Autoclave # 6. Accordingly, these results of different simulation duration from the numerical models can be used for comparison with the results from the physical simulations. The boundary cell here is an “inactive” element, whose thermodynamic conditions do not change at all from fluid or heat exchange with finite-size blocks (numerical model cell) in the flow domain. The boundary cell can confine geochemical interactions that only occur in the numerical model, which makes the results more reasonable.

3. Results

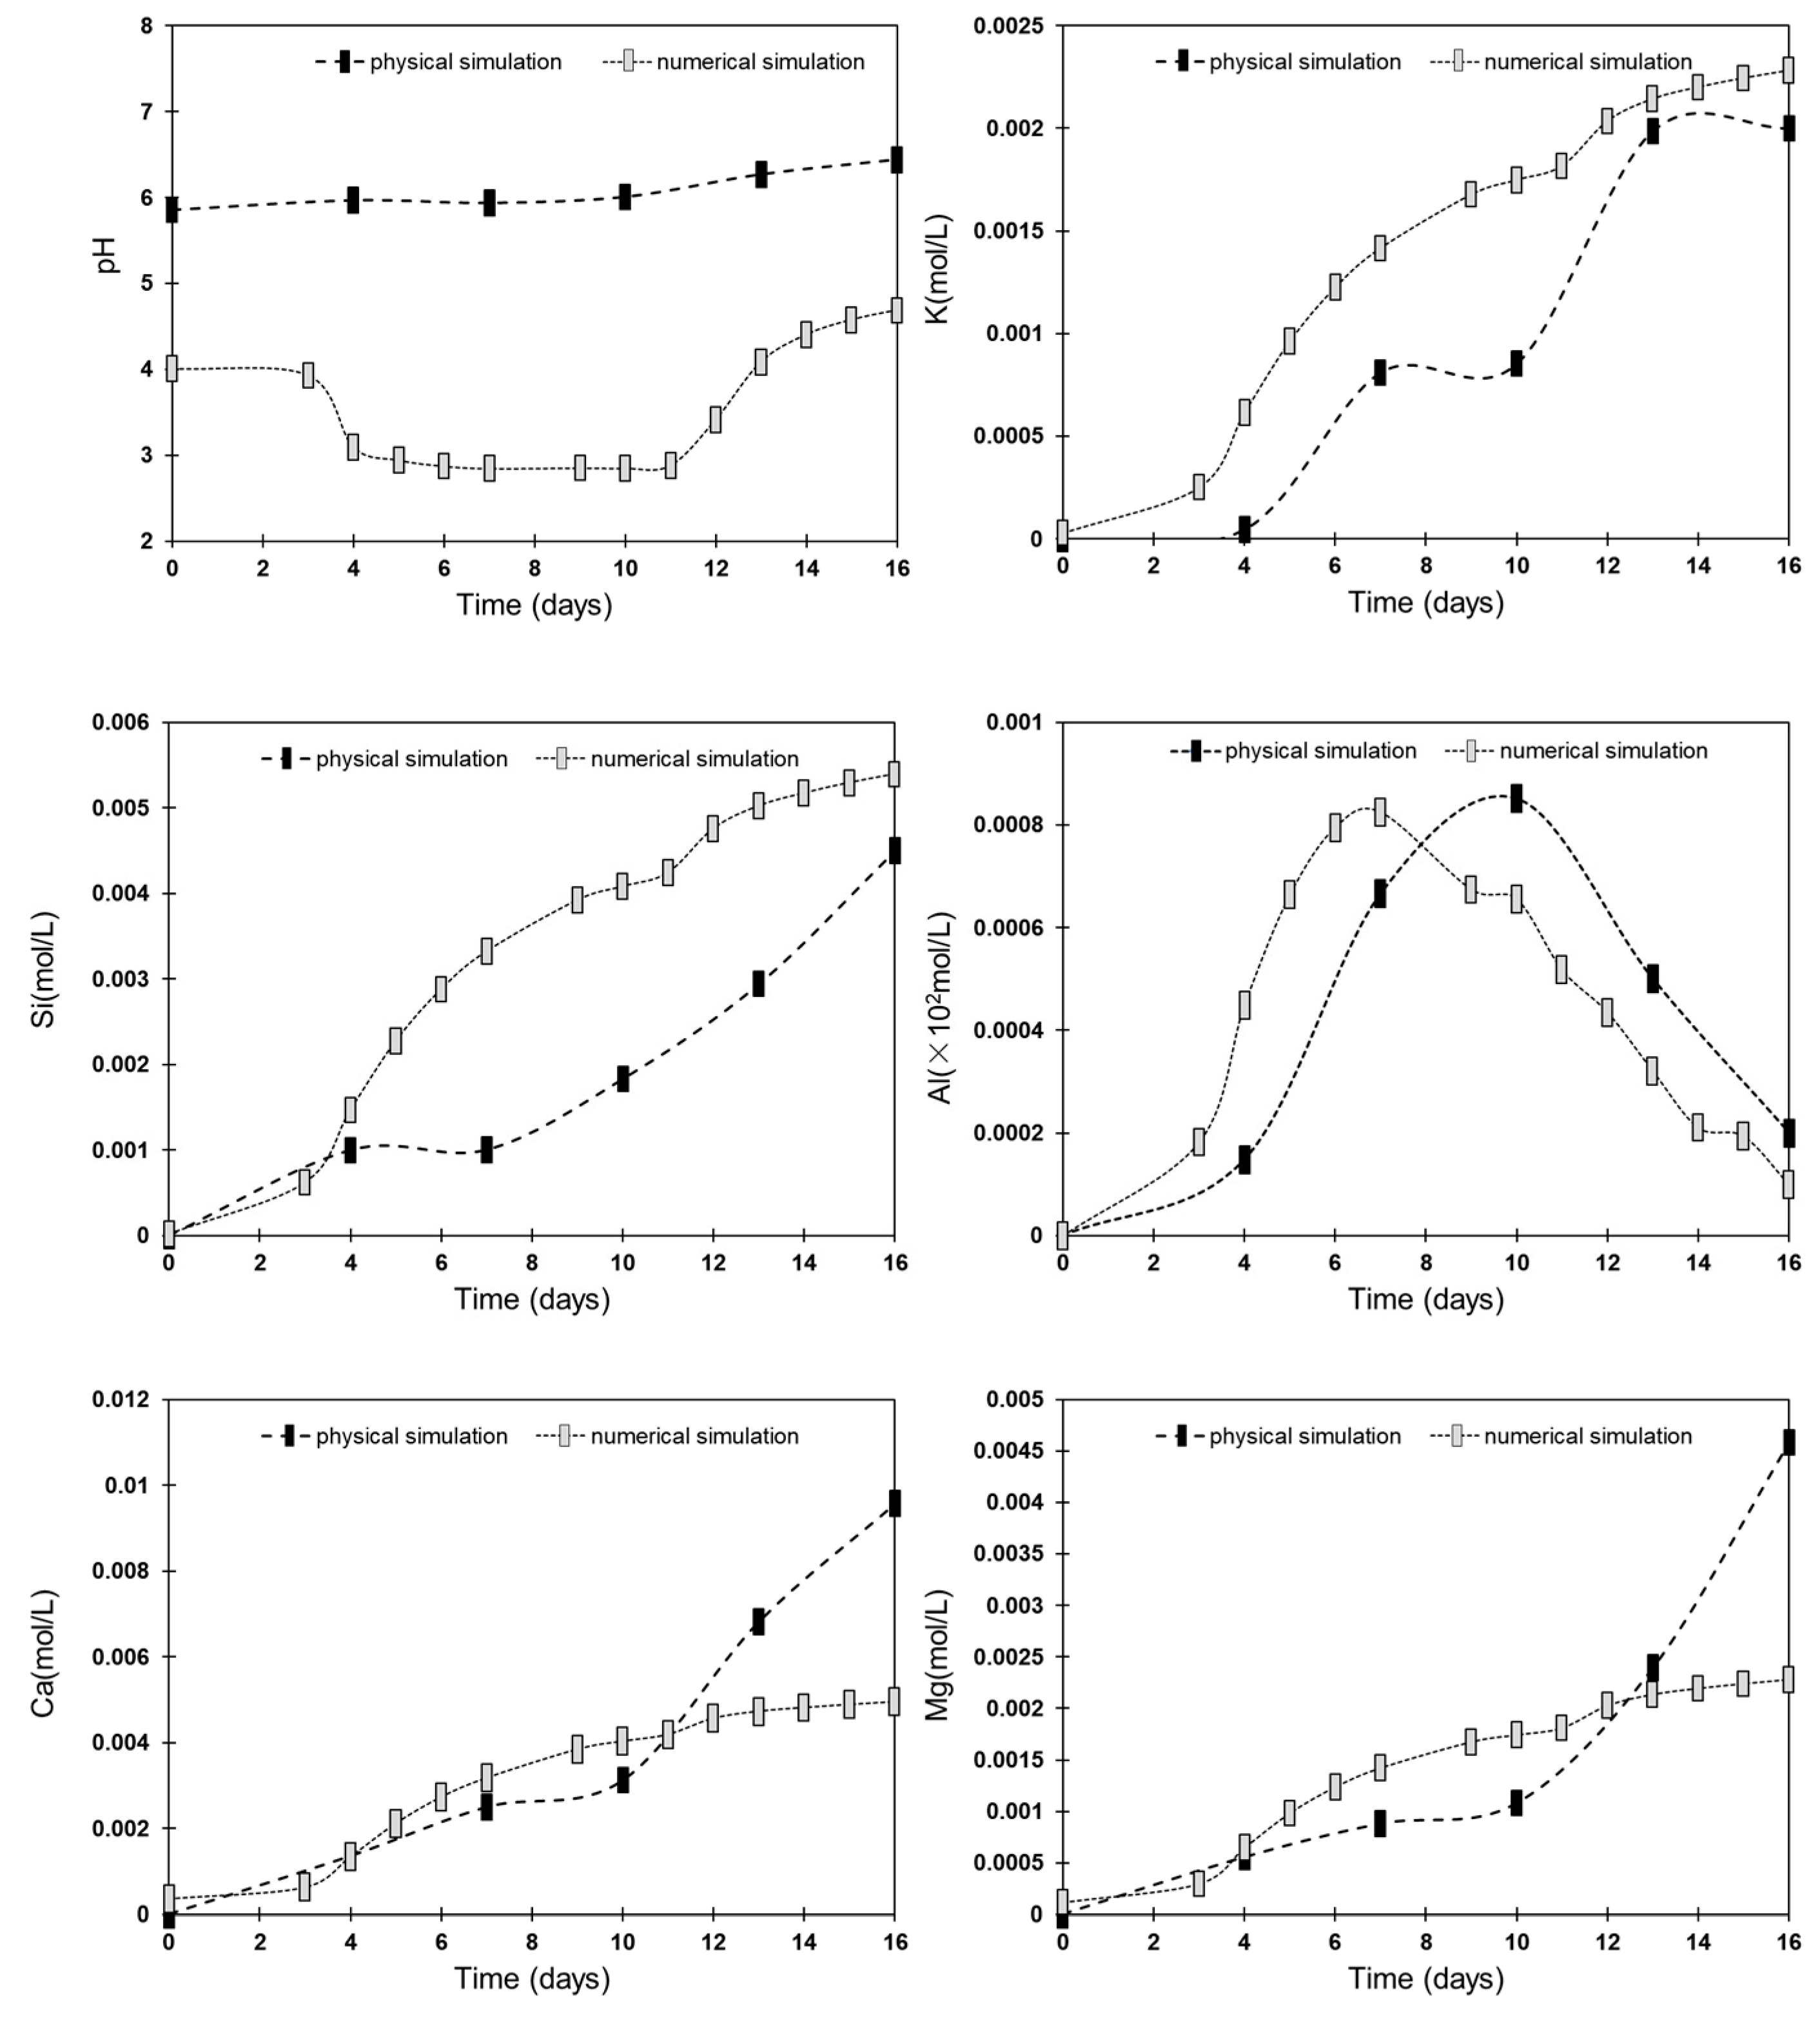
3.1. Changes in Fluid Chemistry

Results of physical and numerical analyses of reaction products are summarized in Table 3. Significant changes in solution chemistry were observed in both sets of experiments (Figure 4). In the physical simulation, the pH continued to increase during the 16 d of the experiment, from 5.86 to 6.44 (Figure 4). In the numerical simulation, the pH first decreased to ~2.8 within 12 d, then increased to 4.6 over the next 4 d (Figure 4).
Fluid Si and K contents show similar changes in both simulations (Figure 4), with concentrations continuing to increase with reaction time (Figure 4). Fluid Ca and Mg concentrations increased with reaction time in the physical simulation, but were more constant in the numerical simulation (Figure 4). The Al content exhibited a distinct trend (Figure 4), reaching maximum values after 7 d and 10 d for the physical and numerical simulations, respectively, and then decreasing during further reaction. Absolute value of ion concentration differed between the simulations, with the numerical simulation set generally being higher, not including pH and Al (Figure 4).

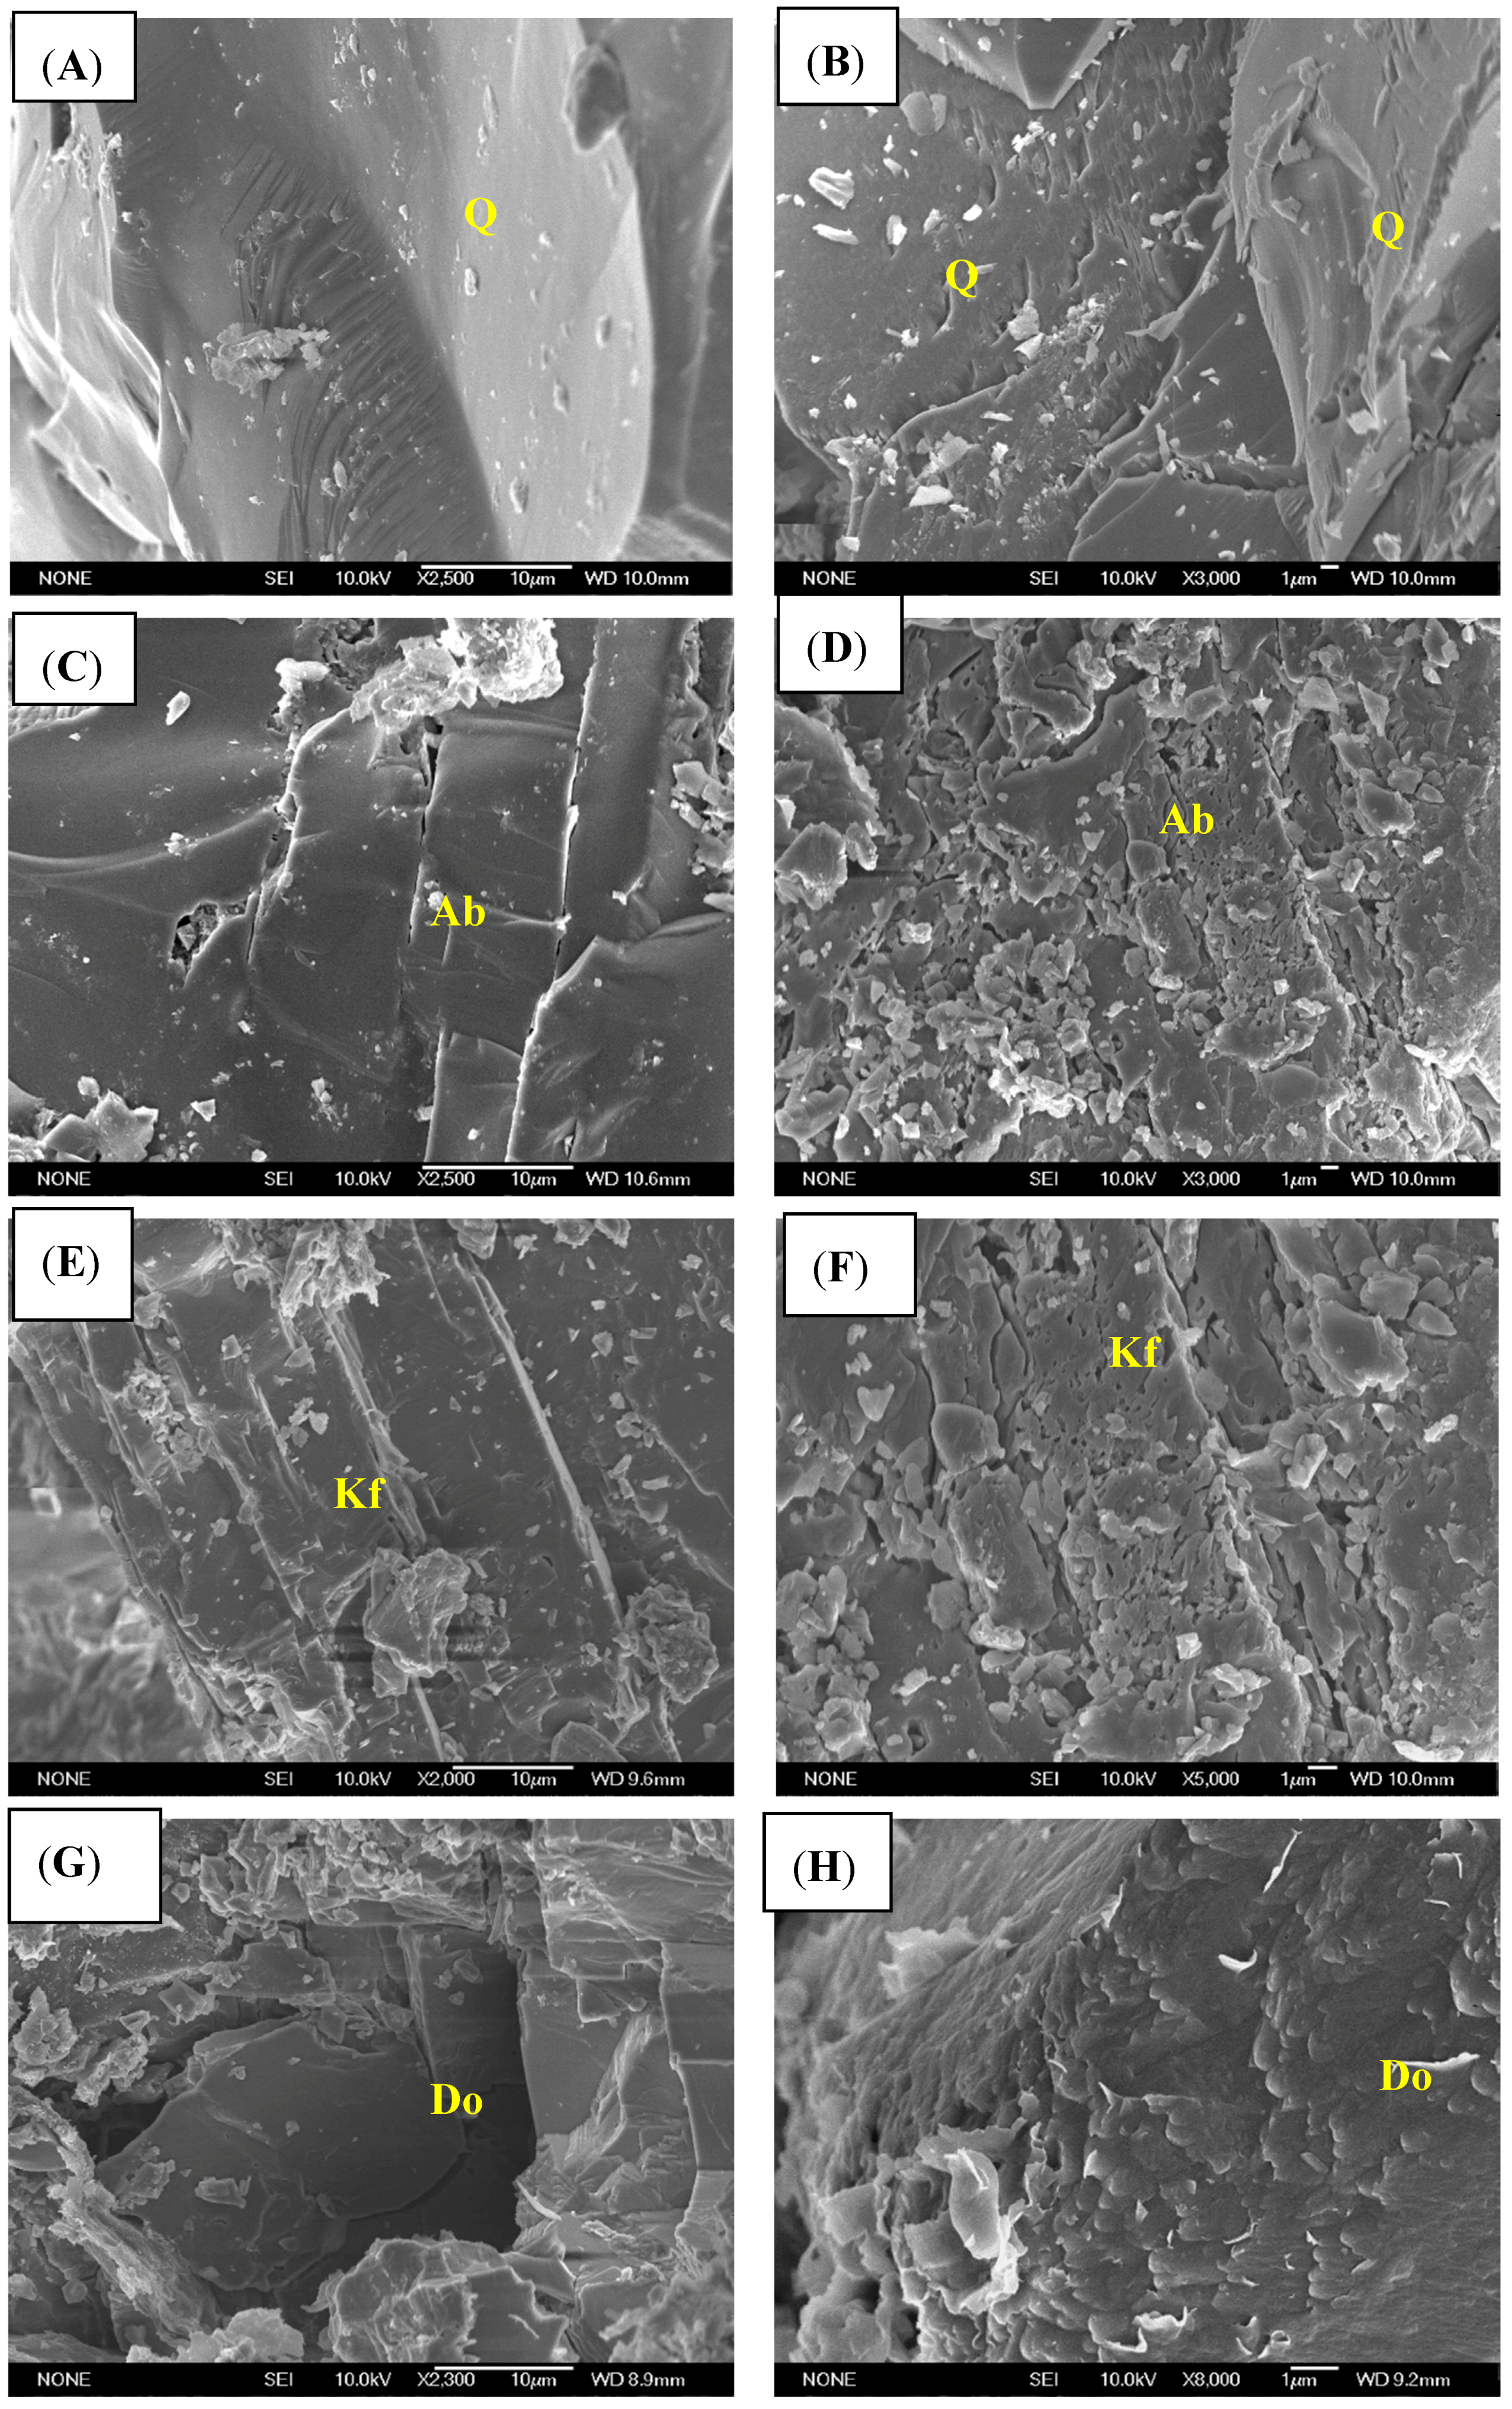
3.2. Changes in Mineral Morphology during the Physical Simulation

Scanning electron microscope (SEM) analyses of core samples before and after physical simulations showed that minerals such as quartz, K-feldspar, albite, and dolomite dissolved after CO2 injection, with feldspar and dolomite showing pronounced dissolution and quartz weak dissolution. Before the experiment, mineral surfaces of quartz grains were generally smooth with terraced growth patterns (Figure 5A), with dissolution effects and corrosion pits being evident afterwards (Figure 5B). Initially, the albite surface was relatively flat and exhibited no obvious dissolution, but dissolution pits and fissures along cleavage surfaces were evident after the experiment (Figure 5C,D). K-feldspar was partially dissolved after the experiment, with the formation of corrosion pits (Figure 5E,F). The dissolution of K-feldspar was stronger than that of quartz and weaker than that of albite. Carbonates exhibited stronger dissolution than silicates, with entire dolomite particles being dissolved into a cloud-like phase and showing a paste-like flow structure (Figure 5G,H). Calcite was not observed after the experiment, indicating that it was completely dissolved.

3.3. Changes in Porosity

Surface porosity of the synthetic cores remained relatively constant at 12.64% during the physical simulation, with no variation being observed (perhaps limited by the analytical method). Similarly, porosity changes were not evident in the numerical simulation (Figure 6), with porosity being constant up to 8 d of reaction, then increasing with carbonate dissolution to only 12.646% over the next 8 d (Figure 6).

4. Discussion

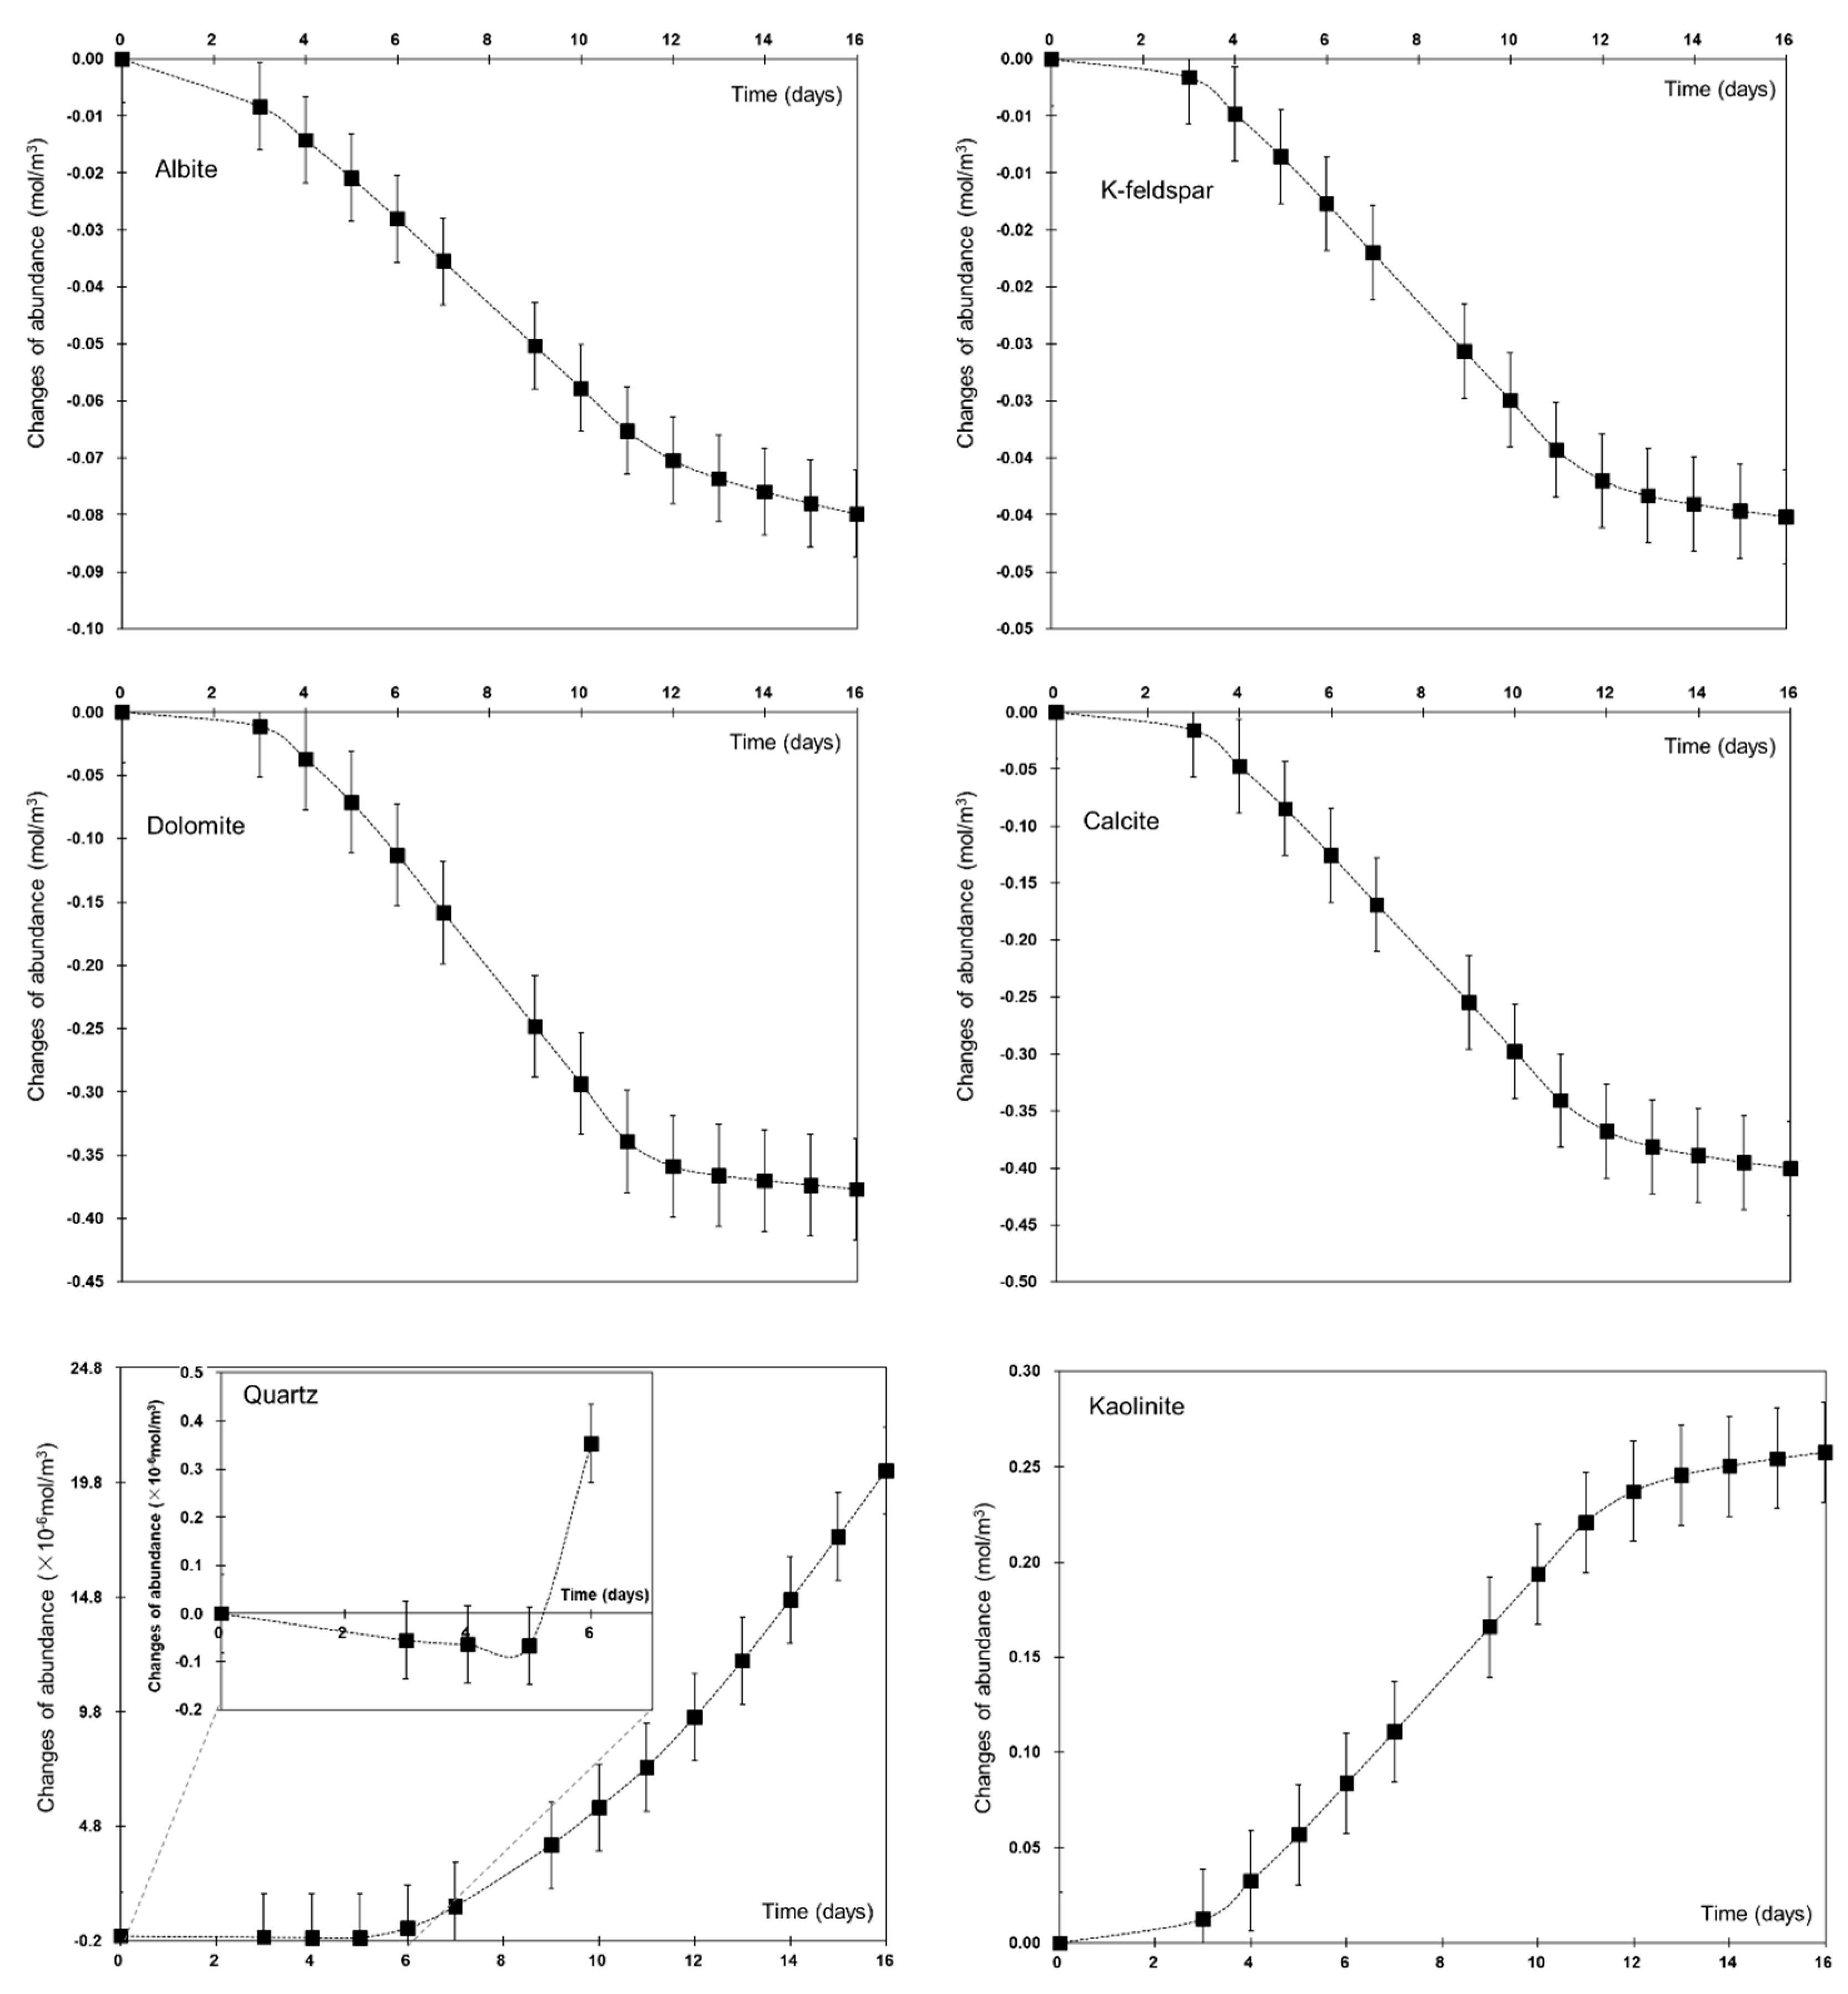
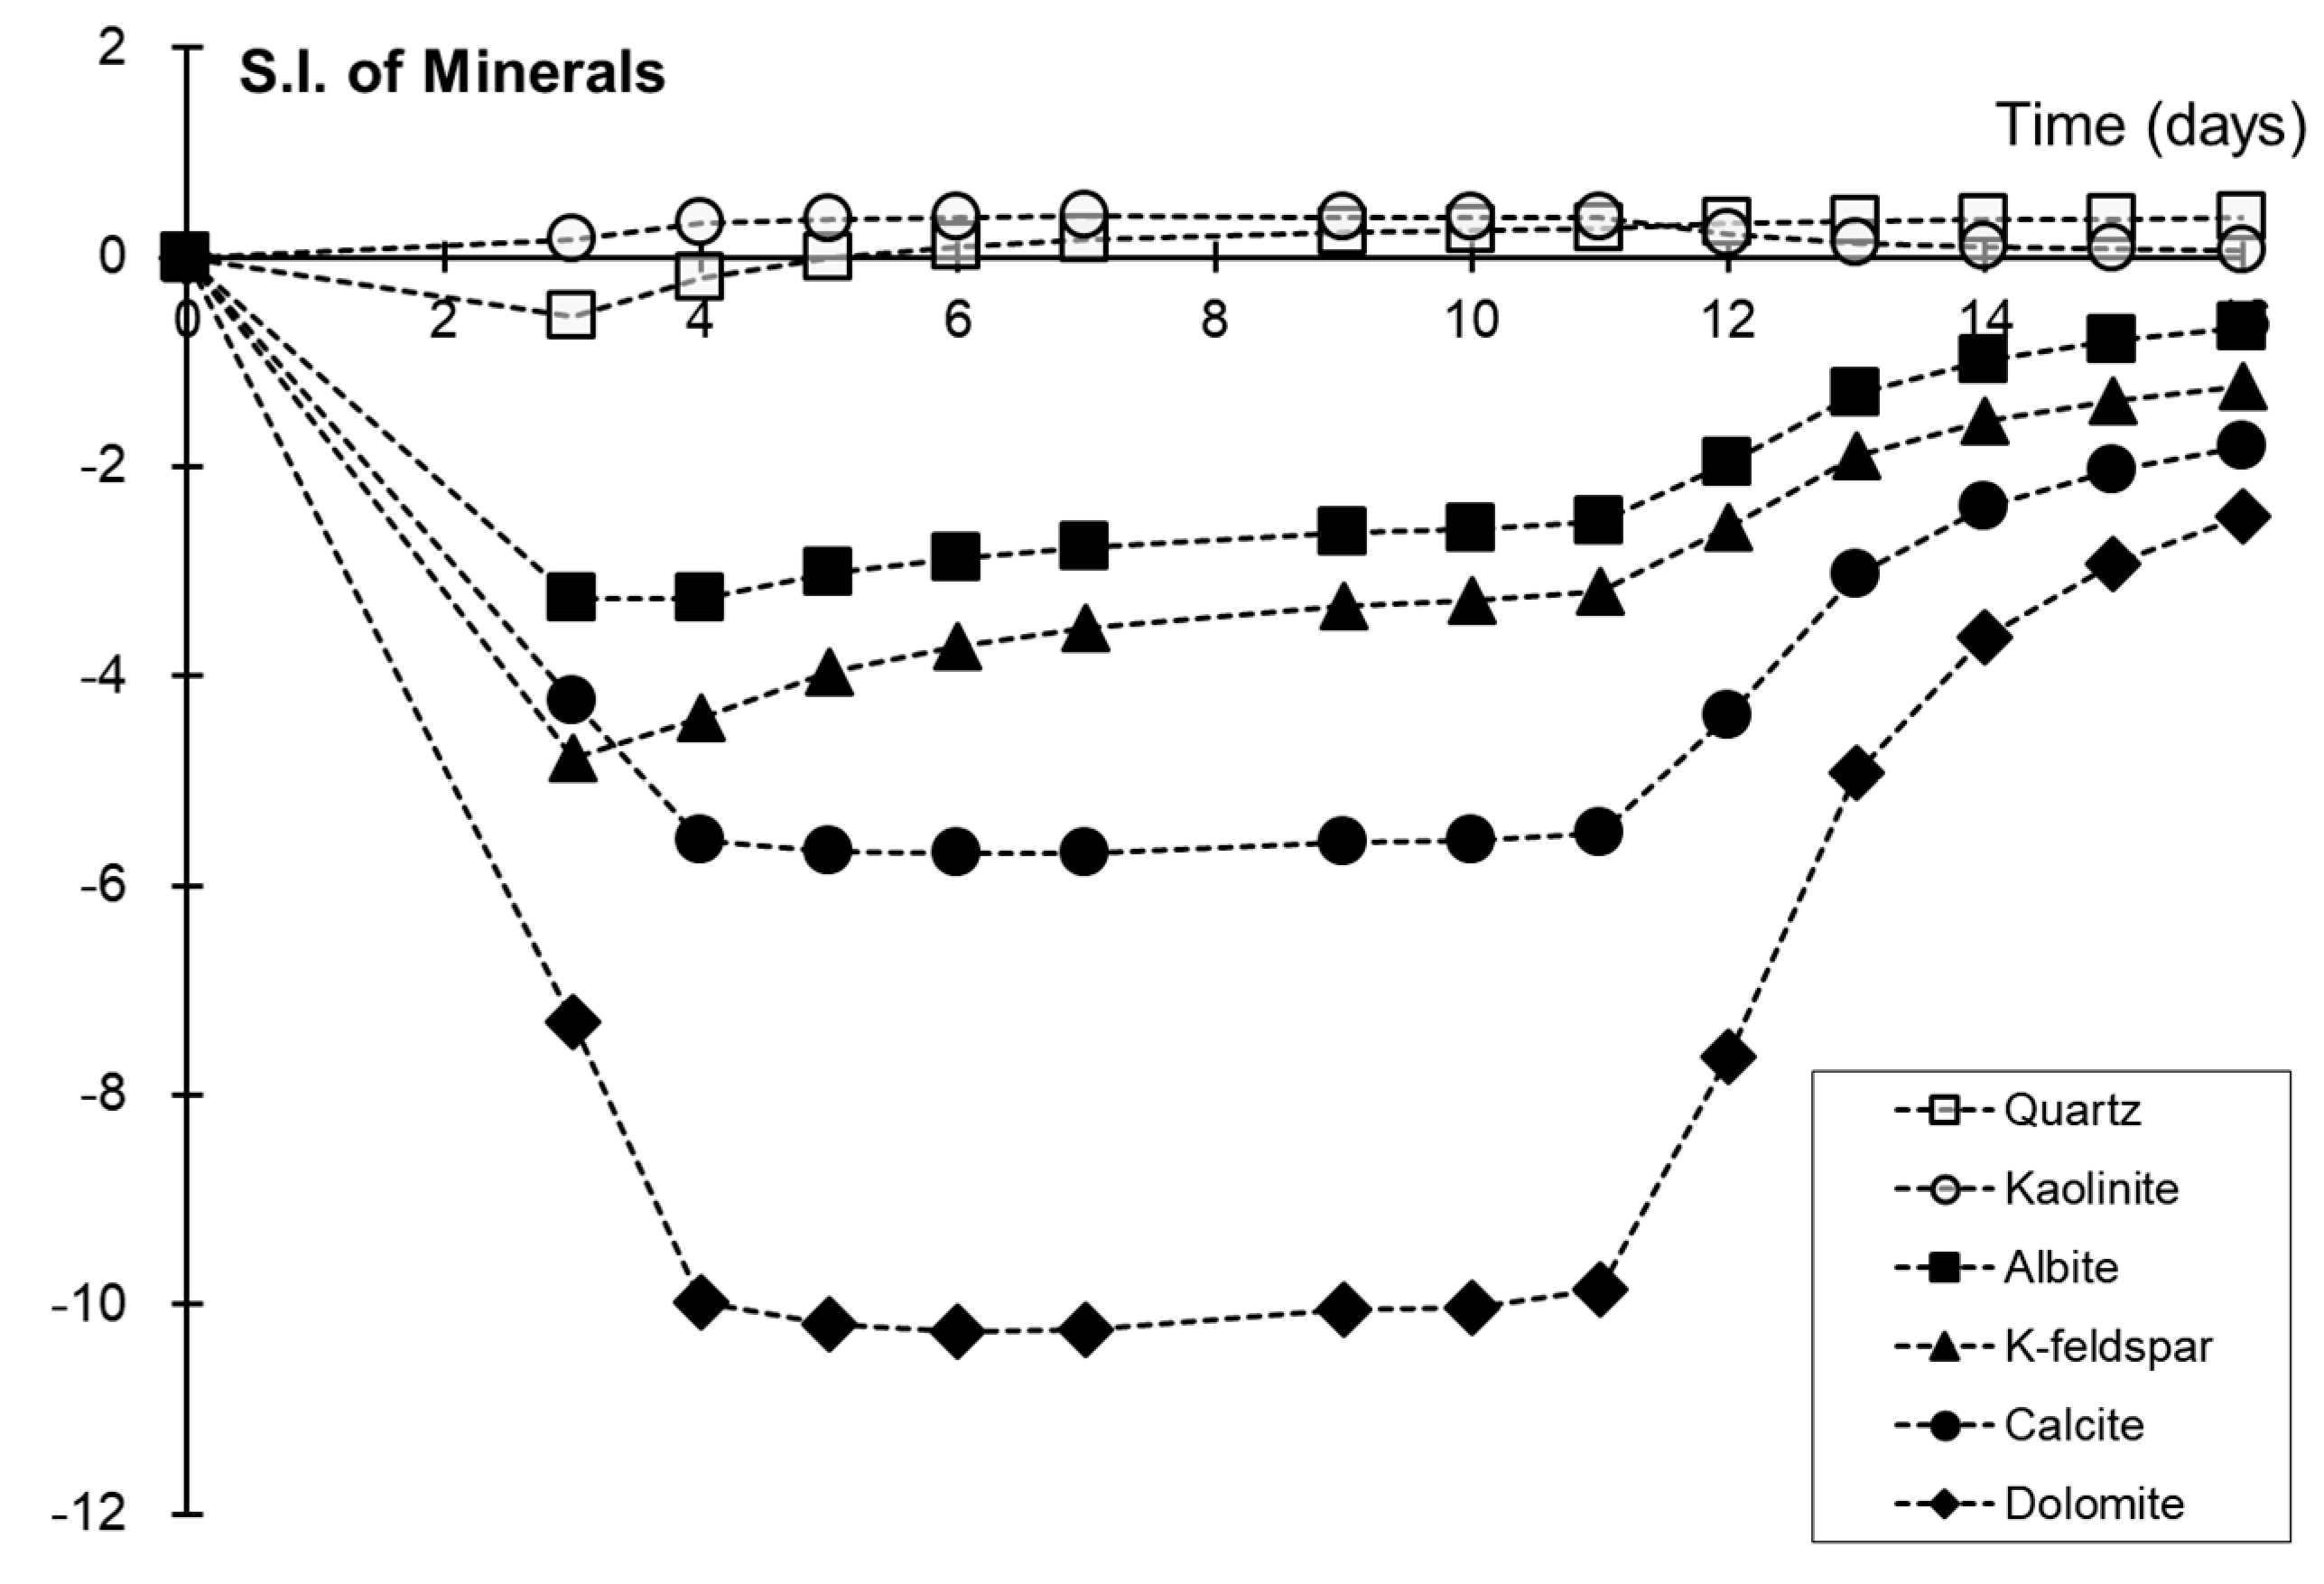
4.1. Mineral Dissolution and Precipitation

Feldspars and carbonates are known to be easily corroded by acidic fluids during CO2 injection [2,30,31], as confirmed by numerical simulations [32,33,34], in situ, real-time field monitoring [35,36], and natural analogies [37,38]. Changes in fluid ion contents and SEM core observations in the physical simulation confirm that feldspar and carbonate were altered by CO2 injection. This is consistent with the numerical simulation, which also indicated dissolution of feldspars and carbonates (Figure 7). Both simulations indicate that Si and K, and Ca and Mg exhibit similar trends with ongoing reaction (Figure 4). Statistical analysis of Si, K, Ca, and Mg data using SPSS (Statistical Program for Social Sciences) software indicates correlation coefficients >0.5 (Table 4). Ion contents are thus likely controlled by a common reaction mechanism, as follows.
The main mechanism controlling these reactions involves the formation of H2CO3 from dissolved CO2, causing the formation water to become acidic (Equation (4)), with reducing pH. Reactions between the acidic fluid and core minerals, especially carbonates and feldspars (Equations (5)–(8), below), buffer formation-water pH, causing an increase in pH of fluid produced during the experiments [39]. This process is described by the following equations:
CO2 + H2O → H+ + HCO3
CaCO3 (calcite) + H+ → Ca2+ + HCO3
CaMg (CO3)2 (dolomite) + 2H+ → Ca2+ + Mg2+ + 2HCO3
2KAlSi3O8 (K-feldspar) + 2H+ + 9H2O → Al2Si2O5(OH)4 (kaolinite) + 2K+ + 4H4SiO4(aq)
ΔG0 = 18 KJ mol−1, ΔS0 = 73J mol−1
NaAlSi3O8 (albite) + CO2 + H2O → NaAlCO3 (OH) 2 (dasownite) + 3SiO2 (chalcedony)
ΔG0 = −132 KJ mol−1, ΔS0 = −101J mol−1
where ΔG0 is the Gibbs free-energy change and ΔS0 is the entropy change.
The degree of dissolution of albite is significantly greater (by a factor of ~2) than that of K-feldspar (Figure 7), possibly due to differences in their ΔG0 and ΔS0 values. Albite ΔG0 and ΔS0 values are both negative, with albite therefore needing little energy to dissolve, whereas K-feldspar values are positive, with more energy input needed for dissolution. The numerical simulation indicated that some kaolinite (up to 0.25 mol m−3) and quartz (up to 19.8 × 10⁻⁶ mol m−3) precipitated after 4 d of reaction (Figure 7), although quartz precipitation can obviously be ignored. Equations (7) and (8) indicate that kaolinite precipitation restrains the reactions, leading to reduced K-feldspar dissolution. This is consistent with the results of other studies [15,40].
The precipitation of carbonate minerals is common during CO2-induced reactions [41], and our physical and numerical results indicate that the concentrations of carbonate minerals, calcite, and dolomite all decreased significantly during reaction. In particular, dolomite was almost completely dissolved, with no carbonate minerals remaining after the experiments. This is consistent with previous experimental findings [36,37,42]. However, the numerical simulations indicate that calcite and dolomite have similar dissolution tendencies (Figure 8), whereas calcite was completely dissolved in the physical simulations. We infer that under actual geological conditions, CO2 fluids react first with the most reactive minerals until they are exhausted before reacting with other minerals. In contrast, in the numerical simulations the reactions followed normal geochemical dynamic processes associated with the different minerals. Carbonate minerals did not precipitate during reaction (but produced minor amounts of kaolinite and quartz) because under the experimental conditions the reaction liquid was unsaturated with carbonates (Figure 8). Similarly, results akin to the above-mentioned calculations have also been presented by Ketzer et al. (2009) [43] and Tutolo et al. (2015) [44]. Quartz dissolution began after 5 d, and it precipitated later (Figure 8), but this reaction was very weak and is ignored here. Kaolinite was the predominant precipitated mineral (Figure 7 and Figure 8), consistent with the results of Yu et al. (2012) [15]. However, carbonate precipitation is usually observed in CO2-formation-water–rock autoclave experiments conducted in closed systems over extended periods. For example, in an experiment using Triassic Sherwood Sandstone and sea water, Pearce et al. (1996) [37] observed calcite precipitation on the sample surface in an autoclave reaction under reservoir P/T conditions after almost eight months.
Equations (4)–(6) indicate that calcite is the main reaction product, with some dolomite dissolving rapidly in the CO2-saturated formation water at the beginning of the experiments. However, the silicate minerals (mainly detrital albite and K-feldspar) also gradually become unstable and start dissolving. Precipitation of clay minerals such as kaolinite occurs under acidic conditions during the reaction process. Details of the reaction process are indicated by Equations (7) and (8). These reactions lead to a rapid increase in pH of liquid produced during the initial stage, but with pH gradually reaching a stable equilibrium value, as also observed by Bowker and Shuler (1991) [35].

4.2. Porosity Changes

No obvious porosity changes were observed in the synthetic core after the physical simulation, with plane porosity being constant (within measurement uncertainty) at 12.64%. This was also observed in the numerical simulation (Figure 6) where porosity only increased from 12.64% to 12.646% (Figure 6). Minor changes in mineral contents after CO2 injection lead to minor changes in core porosity, as confirmed by changes in ion content in the physical simulation and other mineral changes in the numerical simulation (Figure 4 and Figure 7). However, there were variations in porosity in the numerical simulations, where after six days of reaction the dissolution of minerals was very weak and porosity did not change noticeably, but over the following four days mineral dissolution increased with marked changes in porosity (Figure 4 and Figure 7). Especially, a notable changes happened in porosity (Figure 6). This is due to the remarkable changes in the mineral dissolution (Figure 7). After nine days, the dissolution of feldspars and carbonates reached their peaks, indicating that the dissolution volume induced by the CO2-fluid injection increased to its maximum. A large number of newly added pore spaces lead to the porosity increase. By Day 10, minerals such as kaolinite and quartz began to precipitate, with porosity becoming less variable (Figure 4, Figure 6 and Figure 7). Overall, porosity varied little, indicating limited dissolution and precipitation during short-term CO2 injection.
The lack of reduction in porosity is common in CO2-induced reactions in sandstone [7,14,40,45], with a reduction of permeability being the dominant result of short-term CO2 injection. The precipitation of kaolinite, solid-phase materials, and clay particles released by the dissolution of carbonate cement may account for the non-reduction of porosity and the reduction of permeability. Shiraki and Dunn (2000) [40] considered that the precipitation of kaolinite crystals in pores is the main reason for the reduction of permeability after CO2 displacement reactions, while Luquot et al. (2012) [14] considered that newly formed minerals of amorphous carbon cause the reduction in permeability. Our results also indicate that precipitation of new minerals is related to the non-reduction of porosity. In both the physical and numerical simulations, the concentration of Al increased over the first six days before decreasing over the following 10 days. In the numerical simulation, the precipitation of kaolinite occurred after six days of reaction, with this requiring large amounts of Al (Equation (7)). While minor kaolinite was precipitated during the reaction, core porosity remained almost unchanged, for two possible reasons: (1) the dissolution of minerals was very weak in short-term CO2-induced reactions, with few changes occurring in feldspars and carbonates after CO2 injection (<1% mol m−3 variation); and (2) the precipitation of minerals was limited. Kaolinite content varied by a few percent, while changes in quartz content were negligible, with porosity being unchanged during such weak reactions.
The physical simulation was an autoclave experiment with the inlet connected to an injection pump (an open system), and with the outlet being a closed system opened only during sampling at the end of the experiment. The reaction system was therefore a semi-closed system. Under conditions of deep burial in semi-closed space, dissolution of carbonates rarely occurs or is very weak [46]. Regarding the volumes of water required to increase porosity through calcite or dolomite dissolution, the problem is essentially the inverse of the effect on porosity loss in limestones of calcite cementation caused by dissolved calcium carbonate from external sources [47,48,49,50]. For example, to increase the porosity of a 100 m thick limestone bed by 1%, 1 m3 of calcite must be dissolved for each m2 of bedding surface. For pore water that is undersaturated by 100 ppm, ~27,000 volumes of water are required to dissolve one volume of calcite. Increasing the porosity by 1% in 100 m thick limestone thus requires 27,000 m3 of water per square meter of surface. Even if the limestone was underlain by 5 km of sediments in which an average porosity loss of 10% of total rock volume occurred, the pore water released from the underlying sediments would not exceed 500 m3 m−2 [46], which, in an actual geological reservoir, would not be sufficient to dissolve the carbonates. In our experiment, the autoclave volume was 77.7 cm3, and it was impossible to provide sufficient water for carbonate dissolution. However, it is certain that dissolution and precipitation are very weak at the beginning of CO2 fluid-rock interactions, with our physical and numerical simulations confirming that only limited geochemical reactions, including dissolution and precipitation, occur during short-term CO2 injections, with no sharp variations in core porosity or permeability. Similar results were also found by Tutolo et al. (2015), which confirmed that only very weak geochemical reactions could happen during the reaction of CO2 and feldspar-rich sandstone [51]. For long-term CO2 injections, however, dissolution and precipitation are the dominant geochemical processes occurring between CO2-induced fluids and sandstones [51,52,53]. Our study of short-term geochemical interactions in a semi-closed system therefore showed no remarkable changes in the porosity of cores.

5. Conclusions

(1)
No significant short-term CO2-rock-formation-water geochemical reactions are induced by CO2 injection.
(2)
Neither physical nor numerical simulation found significant core porosity variations after CO2 injection.
(3)
Minor amounts of kaolinite and quartz were precipitated during the numerical modelling but were not observed in the physical simulation.
(4)
Physical and numerical simulations conducted in tandem can be used to verify each other and improve their reliability.

Author Contributions

Z.Y. collected and analyzed the data and wrote the original draft. S.Y. reviewed and edited the paper. K.L. conducted the English editing work of this paper. Q.Z. contributed to the constructive discussions. L.Y. contributed to the numerical simulations.

Funding

This research and APC were both funded by the National Hydrocarbon Accumulation, Distribution and Favorable Areas Evaluation in Foreland Thrust Belts and Complex Tectonic Zones (No. 2016ZX05003-002).

Acknowledgments

We also thank the Key Laboratory of Basin Structure and Hydrocarbon Accumulation for allowing us to carry out laboratory experiments and access its rock characterization facilities.

Conflicts of Interest

The authors declare no conflict of interest.

Appendix A. Kinetic Rate Law for Mineral Dissolution and Precipitation

The general rate expression used in TOUGHREACT is taken from Lasaga et al. (1994) [54]:
r n = ± k n A n | 1 ( Q n K n ) θ | η
where n denotes the kinetic mineral index, positive values of rn indicate dissolution, while negative values indicate precipitation; kn is the rate constant (moles per unit mineral surface area and unit time) and is temperature dependent; An is the specific reactive surface area per kg H2O; Kn is the equilibrium constant for the mineral-water reaction for the destruction of one mole of mineral n; and Qn is the reaction quotient. The parameters θ and η must be determined from experiments. However, they are usually, but not always, set to 1.
For many minerals, the kinetic rate constant k can be summed from three mechanisms (Palandri and Kharaka, 2004) [29]:
k = k 25 nu exp [ E a nu R ( 1 T 1 298.15 ) ] + k 25 H exp [ E a H R ( 1 T 1 298.15 ) ] a H n H + k 25 OH exp [ E a OH R ( 1 T 1 298.15 ) ] a OH n OH
where superscripts or subscripts nu, H, and OH indicate neutral, acidic, and alkaline mechanisms, respectively; Ea is the activation energy; k25 is the rate constant at 25 °C; R is gas constant; T is the absolute temperature; a is the activity of the species; and n is an exponent (constant).

References

  1. Intergov Panel on Climate Change. Climate change 2014: Mitigation of Climate Change Working Group III Contribution to the Fifth Assessment Report of the Intergovernmental Panel on Climate Change; Cambridge University Press: Cambridge, UK; New York, NY, USA, 2014; pp. 10013–12473. [Google Scholar]
  2. Fischer, S.; Liebscher, A.; Wandrey, M.; the CO2 SINK Group. CO2–brine–rock interaction—First results of long-term exposure experiments at in situ P–T conditions of the Ketzin CO2 reservoir. Chem. Erde 2010, 70, 155–164. [Google Scholar] [CrossRef]
  3. Hutcheon, I.; Shevalier, M.; Durocher, K.; Bloch, J.; Johnson, G.; Nightingale, M.; Mayer, B. Interactions of CO2 with formation waters, oil and minerals and CO2 storage at the Weyburn IEA EOR site, Saskatchewan, Canada. Int. J. Greenh. Gas Control 2016, 53, 354–370. [Google Scholar] [CrossRef]
  4. IEA. CO2 Emissions from Fuel Combustion, 2012th ed.; OECD/IEA: Paris, France, 2012; p. 136. Available online: http://www.iea.org/ publications/freepublications/publication/CO2emissionfromfuelcombustionHIGHLIGHTS.pdf (accessed on 25 November 2012).
  5. Bachu, S.; Gunter, W.D.; Perkins, E.H. Aquifer disposal of CO2: Hydrodynamic and mineral trapping. Energy Convers. Manag. 1994, 35, 269–279. [Google Scholar] [CrossRef]
  6. Hitchon, B.; Gunter, W.D.; Gentzis, T.; Baileyc, R.T. Sedimentary basins and greenhouse gases: A serendipitous association. Energy Convers. Manag. 1999, 40, 825–843. [Google Scholar] [CrossRef]
  7. Sayegh, S.G.; Krause, F.F.; Girard, M.; DeBree, C. Rock/fluid interactions of carbonated brines in a sandstone reservoir: Pembina Cardium, Alberta, Canada. SPE Form. Eval. 1990, 5, 399–405. [Google Scholar] [CrossRef]
  8. Tobergte, D.R.; Curtis, S. Experimental perspectives of mineral dissolution and precipitation due to carbon dioxide-water-rock interactions. J. Chem. Inf. Model. 2013, 53, 1689–1699. [Google Scholar]
  9. Lombard, J.M.; Azaroual, M.; Pironon, J.; Broseta, D.; Egermann, P.; Munier, G.; Mouronval, G. CO2 injectivity in geological storages: An overview of program and results of the GeoCarbone-Injectivity project. Oil Gas Sci. Technol. 2010, 65, 533–539. [Google Scholar] [CrossRef]
  10. Miri, R.; van Noort, R.; Aagaard, P.; Hellevang, H. New insights on the physics of salt precipitation during injection of CO2 into saline aquifers. Int. J. Greenh. Gas Control 2015, 43, 10–21. [Google Scholar] [CrossRef]
  11. Kampman, N.; Bickle, M.; Wigley, M.; Dubacq, B. Fluid flow and CO2–fluid–mineral interactions during CO2-storage in sedimentary basins. Chem. Geol. 2014, 369, 22–50. [Google Scholar] [CrossRef]
  12. Pokrovsky, O.S.; Golubev, S.V.; Schott, J.; Castillo, A. Calcite, dolomite and magnesite dissolution kinetics in aqueous solutions at acid to circumneutral pH, 25 to 150 C and 1 to 55 atm pCO2: New constraints on CO2 sequestration in sedimentary basins. Chem. Geol. 2009, 265, 20–32. [Google Scholar] [CrossRef]
  13. Alemu, B.L.; Aker, E.; Soldal, M.; Johnsen, Ø.; Aagaard, P. Effect of sub-core scale heterogeneities on acoustic and electrical properties of a reservoir rock: A CO2 flooding experiment of brine saturated sandstone in a computed tomography scanner. Geophys. Prospect 2013, 61, 235–250. [Google Scholar] [CrossRef]
  14. Luquot, L.; Andreani, M.; Gouze, P.; Camps, P. CO2 percolation experiment through chlorite/zeolite-rich sandstone (Pretty Hill Formation–Otway Basin–Australia). Chem. Geol. 2012, 294–295, 75–88. [Google Scholar] [CrossRef]
  15. Yu, Z.; Liu, L.; Yang, S.; Li, S.; Yang, Y. An experimental study of CO2–brine–rock interaction at in situ pressure–temperature reservoir conditions. Chem. Geol. 2012, 326–327, 88–101. [Google Scholar] [CrossRef]
  16. Nitao, J.J. User’s Manual for the USNT Module of NUFT Code; Version 2.0. LLNL.; Lawrence Livermore National Laboratory Report UCRL-MA-130653; Lawrence Livermore National Laboratory: Livermore, CA, USA, 1998.
  17. Lichtner, P.C. FLOWTRAN User Manual; Tech. Report, LA-Ur-01-2349; Las Alamos National Laboratory: Las Alamos, NM, USA, 2001.
  18. Nghiem, L.; Sammon, P.; Grabenstetter, J.; Ohkuma, H. Modeling CO2 storage in aquifers with fully-coupled geochemical EOS compositional simulator. Soc. Pet. Eng. J. 2004, 89474. [Google Scholar] [CrossRef]
  19. White, M.D.; Oostrom, M. STOMP: Subsurface Transport over Multiple Phases; Version 4.0; User’s Guide; Pacific Northwest National Laboratory: Richland, WA, USA, 2006; p. 120.
  20. Xu, T.; Sonnenthal, E.L.; Spycher, N.; Pruess, K. TOUGHREACT: A simulation program for non-isothermal multiphase reactive geochemical transport in variably saturated geologic media. Comput. Geosci. 2006, 32, 145–165. [Google Scholar] [CrossRef]
  21. Xu, T.; Spycher, N.; Sonnenthal, E.L.; Zhang, G.; Zheng, L.; Pruess, K. TOUGHREACT Version 2.0: A simulator for subsurface reactive transport under non-isothermal multiphase flow conditions. Comput. Geosci. 2011, 37, 763–774. [Google Scholar] [CrossRef]
  22. Audigane, P.; Gaus, I.; Czernichowski-Lauriol, I.; Pruess, K.; Xu, T. Two dimensional reactive transport modeling of CO2 injection in a saline aquifer at the Sleipner Site. Am. J. Sci. 2007, 307, 974–1008. [Google Scholar] [CrossRef]
  23. Gherardi, F.; Xu, T.; Pruess, K. Numerical modeling of self-limiting and self-enhancing cap rock alteration induced by CO2 storage in a depleted gas reservoir. Chem. Geol. 2007, 244, 103–129. [Google Scholar] [CrossRef]
  24. Okuyama, Y.; Sasaki, M.; Nakanishi, S.; Norifumi, T.; Ajima, S. Geochemical CO2 trapping in open aquifer storage—The Tokyo Bay model. Energy Procedia 2009, 1, 3253–3258. [Google Scholar] [CrossRef]
  25. Zhang, L.; Apps, J.A.; Zhang, Y.Q.; Xu, T.; Birkholzer, J.T. Reactive Transport Simulations to Study Groundwater Quality Changes in Response to CO2 Leakage from Deep Geological Storage. Phys. Procedia 2009, 1, 1887–1894. [Google Scholar] [CrossRef]
  26. Xu, T.; Kharaka, Y.; Doughty, C.; Freifeld, B.M.; Daley, T.M. Reactive transport modeling to study changes in water chemistry induced by CO2 injection at the Frio-I brine pilot. Chem. Geol. 2010, 271, 153–164. [Google Scholar] [CrossRef]
  27. Yu, Z.; Liu, K.; Zhao, M.; Liu, S.; Zhuo, Q.; Lu, X. Characterization of Diagenesis and the Petroleum Charge in Kela 2 Gas Field, Kuqa Depression, Tarim Basin. Earth Sci. 2015, 41, 533–545, (In Chinese with English Abstract). [Google Scholar]
  28. Duan, Z.H.; Sun, R. An improved model calculating CO2 solubility in pure water and aqueous NaCl solutions from 273 to 533 K and from 0 to 2000 bar. Chem. Geol. 2003, 193, 257–271. [Google Scholar] [CrossRef]
  29. Palandri, J.; Kharaka, Y.K. A Compilation of Rate Parameters of Water–Mineralinteraction Kinetics for Application to Geochemical Modeling; US Geological Survey Open File Report (of 2004–1068); USGS: Reston, VA, USA, 2004; p. 64.
  30. Bertier, P.; Swennen, R.; Laenen, B.; Lagrou, D.; Dreesen, R. Experimental identification of CO2–water–rock interactions caused by sequestration of CO2 in Westphalia and Buntsandstein sandstones of the Campine Basin (NE-Belgium). J. Geochem. Explor. 2006, 89, 10–14. [Google Scholar] [CrossRef]
  31. Wandrey, M.; Fischera, S.; Zemkea, K.; Liebschera, A.; Scherfb, A.K.; Hillebrandb, A.V.; Zettlitzerc, M.; Würdemann, H. Monitoring petrophysical, mineralogical, geochemical and microbiological effects of CO2 exposure–Results of long-term experiments under in situ conditions. Energy Procedia 2011, 4, 3644–3650. [Google Scholar] [CrossRef]
  32. Xu, T.; Apps, J.A.; Pruess, K. Numerical simulation of CO2 disposal by mineral trapping in deep aquifers. Appl. Geochem. 2004, 19, 917–936. [Google Scholar] [CrossRef]
  33. Xu, T.; Apps, J.A.; Pruess, K. Mineral sequestration of carbon dioxide in a sandstone–shale system. Chem. Geol. 2005, 217, 295–318. [Google Scholar] [CrossRef]
  34. Zerai, B.; Saylor, B.Z.; Matisoff, G. Computer simulation of CO2 trapped through mineral precipitation in the Rose Run Sandstone. Ohio Appl. Geochem. 2006, 21, 223–240. [Google Scholar] [CrossRef]
  35. Bowker, K.A.; Shuler, P.J. Carbon dioxide injection and resultant alteration of the Weber sandstone, Rangely Field, Colorado. Am. Assoc. Pet. Geol. Bull. 1991, 75, 1489–1499. [Google Scholar]
  36. Assayag, N.; Matter, J.; Ader, M.; Goldberg Agrinier, P. Water–rock interactions during a CO2 injection field-test: Implications on host rock dissolution and alteration effects. Chem. Geol. 2009, 265, 227–235. [Google Scholar] [CrossRef]
  37. Pearce, J.M.; Holloway, S.; Wacker, H.; Nelis, M.K.; Rochelle, C.; Bateman, K. Natural occurrences as analogues for the geological disposal of carbon dioxide. Energy Convers. 1996, 37, 1123–1128. [Google Scholar] [CrossRef]
  38. Wilkinson, M.; Haszeldine, R.S.; Fallick, A.E.; Odling, N.; Stoker, S.J.; Gatliff, R.W. CO2-mineral reaction in a natural analogue for CO2 storage–implications for modeling. J. Sediment. Res. 2009, 79, 486–494. [Google Scholar] [CrossRef]
  39. Gaus, I. Role and impact of CO2–rock interactions during CO2 storage in sedimentary rocks. Int. J. Greenh. Gas Control 2010, 4, 73–89. [Google Scholar] [CrossRef]
  40. Shiraki, R.; Dunn, T.L. Experimental study on water–rock interactions during CO2 flooding in the Tensleep Formation, Wyoming, USA. Appl. Geochem. 2000, 15, 265–279. [Google Scholar] [CrossRef]
  41. Weibel, R.; Kjoller, C.; Bateman, K.; Nielsen, L.H.; Frykman, P.; Springer, N.; Laier, T. Mineral changes in CO2 experiments–Examples from Danish onshore saline aquifers. Energy Procedia 2011, 4, 4495–4502. [Google Scholar] [CrossRef]
  42. Flukiger, F.; Bernard, D. A new numerical model for pore scale dissolution of calcite due to CO2 saturated water flow in 3D realistic geometry: Principles and first results. Chem. Geol. 2009, 265, 171–180. [Google Scholar] [CrossRef]
  43. Ketzer, J.M.; Iglesias, R.; Einloft, S.; Dullius, J.; Ligabue, R.; Lima, V. Water–rock–CO2 interactions in saline aquifers aimed for carbon dioxide storage: Experimental and numerical modeling studies of the Rio Bonito Formation (Permian), southern Brazil. Appl. Geochem. 2009, 24, 760–767. [Google Scholar] [CrossRef]
  44. Tutolo, B.M.; Luhmann, A.J.; Kong, X.Z.; Saar, M.O.; Seyfried, W.E. CO2 sequestration in feldspar-rich sandstone: Coupled evolution of fluid chemistry, mineral reaction rates, and hydrogeochemical properties. Geochim. Cosmochim. Acta 2015, 160, 132–154. [Google Scholar] [CrossRef]
  45. Ross, G.D.; Todd, A.C.; Tweedie, J.A.; Will, A.G.S. The Dissolution Effects of CO2-Brine Systems on the Permeability of U.K. and North Sea Calcareous Sandstones; Proc.3rd Joint SPE/DOE Symposium Enhanced Oil Recovery; (SPE/DOE 10685); Society of Petroleum Engineers Enhanced Oil Recovery Symposium: Tulsa, OK, USA, 1982; pp. 149–162. [Google Scholar]
  46. Ehrenberg, S.; Walderhaug, O.; Bjørlykke, K. Carbonate porosity creation by mesogenetic dissolution: Reality or illusion? AAPG 2012, 96, 217–233. [Google Scholar] [CrossRef]
  47. Dunham, R.J. Early vadose silt in Townsend mound (reef), New Mexico. In Depositional Environments in Carbonate Rocks: A Symposium; Friedman, G.M., Ed.; SEPM Special Publication: Los Angeles, CA, USA, 1969; Volume 14, pp. 139–181. [Google Scholar]
  48. Bathurst, R.G.C. Carbonate Sediments and their Diagenesis; Elsevier: Amsterdam, The Netherlands, 1975; p. 658. [Google Scholar]
  49. Scholle, P.A.; Halley, R.B. Burial diagenesis: Out of sight, out of mind! In Carbonate Cements; Mann, N.S., Harris, P.M., Eds.; SEPM Special Publication: Malden, MA, USA, 1985; Volume 36, pp. 309–334. [Google Scholar]
  50. Morse, J.W.; Mackenzie, F.T. Geochemical constraints on CaCO3 transport in subsurface sedimentary environments. Chem. Geol. 1993, 105, 181–196. [Google Scholar] [CrossRef]
  51. Tutolo, B.M.; Kong, X.Z.; Seyfried, W.E.; Saar, M.O. High performance reactive transport simulations examining the effects of thermal, hydraulic, and chemical (THC) gradients on fluid injectivity at carbonate CCUS reservoir scales. Int. J. Greenh. Gas Control 2015, 39, 285–301. [Google Scholar] [CrossRef] [Green Version]
  52. Zhang, W.; Li, Y.; Xu, T.; Cheng, H.; Zheng, Y.; Xiong, P. Long-term variations of CO2 trapped in different mechanisms in deep saline formations: A case study of the Songliao Basin, China. Int. J. Greenh. Gas Control 2009, 3, 161–180. [Google Scholar] [CrossRef]
  53. Yang, L.; Xu, T.; Liu, K.; Peng, B.; Yu, Z.; Xu, X. Fluid–rock interactions during continuous diagenesis of sandstone reservoirs and their effects on reservoir porosity. Sedimentology 2017, 64, 1303–1321. [Google Scholar] [CrossRef]
  54. Lasaga, A.C.; Steefel, C.I. A coupled model for transport of multiple chemical species and kinetic precipitation/dissolution reactions with applications to reactive flow in single phase hydrothermal system. Am. J. Sci. 1994, 294, 529–592. [Google Scholar]
Figure 1. Schematic diagram of CO2-formation water-rock physical experiment.
Applsci 09 03354 g001
Figure 2. Synthetic core samples made by the physical experiment.
Applsci 09 03354 g002
Figure 3. Schematic diagram of CO2-formation water-rock numerical simulation.
Applsci 09 03354 g003
Figure 4. Changes of pH and typical ion concentrations over the physical and numerical simulations.
Applsci 09 03354 g004
Figure 5. Scanning electron photomicrographs of pre-and post-experimental cores. (A) Quartz before the experiment; (B) Quartz after the experiment; (C) detrital albite before the experiment; (D). detrital albite after the experiment; (E) K-feldspar before the experiment; (F) K-feldspar after the experiment; (G) dolomite before the experiment; (H) dolomite after the experiment. Q—quartz; Ab—detrital albite; Kf—K-feldspar; Do—dolomite.
Applsci 09 03354 g005
Figure 6. Porosity changes over time in the numerical simulation.
Applsci 09 03354 g006
Figure 7. Mineral changes over time in the numerical simulation.
Applsci 09 03354 g007
Figure 8. Saturation indices of carbonate minerals vs. reaction time in the numerical simulation.
Applsci 09 03354 g008
Table 1. The mineral composition of synthetic core samples.
Mineral TypesQuartzK-FeldsparAlbiteCalciteKaoliniteDolomite
Content (wt. %)37.523.320.89.51.57.4
Table 2. List of minerals considered and parameters for calculating the kinetic rate constants.
MineralA/(cm2/g)Geochemical Kinetic Rate Constants
K25/(mol/(m2·s))Ea/(kJ/mol)n H+
Quartz9.8
Kaolinite151.64.9 × 10−1265.90.8
Illite151.61.0 × 10−1123.60.3
K-feldspar9.88.7 × 10−1151.70.5
albite9.86.9 × 10−1165.00.5
Chlorite9.87.8 × 10−1288.00.5
Calcite9.85.0 × 10−114.41.0
Dolomite9.86.5 × 10−436.10.5
Siderite9.86.5 × 10−436.10.5
Ankerite9.81.6 × 10−436.10.5
Dawsonite9.81.6 × 10−436.10.5
Magnesite9.84.2 × 10−714.41.0
Pyrite12.93.0 × 10−856.9−0.5
Note that: (1) All rate constants are listed for dissolution; (2) A is specific surface area, k25 is kinetic constant at 25 °C, Ea is activation energy, and n is the power term (Equation (A1) in Appendix A); (3) The power terms n for acid mechanisms are with respect to H+. Data from Palandri and Kharaka (2004) [29].
Table 3. Chemical composition of outlet solutions.
Physical SimulationReaction Time (d)pHKSiCaMgAl
mol/Lmol/Lmol/Lmol/Lmol/L
05.860.0000000.0000000.0000000.000000 0.000000
45.970.0000460.0010000.0013600.000554 0.000148
75.940.0008100.0010040.0025000.000879 0.000667
106.010.0008540.0018320.0031250.001079 0.000852
136.270.0019870.0029430.0068250.002396 0.000500
166.440.0020000.0045000.0095750.004583 0.000200
Numerical simulationReaction Time (d)pHKSiCaMgAl
mol/Lmol/Lmol/Lmol/Lmol/L
04.010.000000 0.000000 0.000000 0.000000 0.000000
33.930.000252 0.000625 0.000631 0.000298 0.000182
43.090.000616 0.001471 0.001344 0.000648 0.000450
52.940.000964 0.002277 0.002119 0.000985 0.000664
62.870.001226 0.002881 0.002733 0.001238 0.000795
72.840.001417 0.003323 0.003178 0.001423 0.000825
92.850.001678 0.003922 0.003846 0.001676 0.000675
102.850.001749 0.004083 0.004035 0.001744 0.000656
112.880.001818 0.004243 0.004192 0.001812 0.000518
123.410.002036 0.004758 0.004568 0.002029 0.000435
134.080.002144 0.005024 0.004732 0.002137 0.000321
144.400.002201 0.005174 0.004819 0.002196 0.000211
154.570.002245 0.005295 0.004891 0.002242 0.000194
164.680.002282 0.005395 0.004953 0.002281 0.000100
Table 4. Correlation coefficient matrix of the outlet solution ions.
Correlation MatrixKCaMgSiFeAl
K1.000
Ca0.9431.000
Mg0.9890.9791.000
Si0.9210.9320.9551.000
Fe0.8770.9780.9380.9311.000
Al−0.035−0.143−0.126−0.301−0.3301.000

