Article

Influence of the Scanning Temperature on the Classification of Whisky Samples Analysed by UV-VIS Spectroscopy

School of Science, RMIT University, GPO Box 2476, Melbourne 3001, Australia
*
Author to whom correspondence should be addressed.
Appl. Sci. 2019, 9(16), 3254; https://doi.org/10.3390/app9163254
Submission received: 5 July 2019 / Revised: 15 July 2019 / Accepted: 5 August 2019 / Published: 9 August 2019
(This article belongs to the Special Issue Non-destructive Sensors in Food Authentication)

Abstract

:
The definition of the optimal temperature and its effects (either increasing or variations) during analysis of alcoholic beverages are of importance to develop protocols based in spectroscopy. Although several reports have been published on the use of spectroscopy combined with chemometrics to classify and authenticate alcoholic beverages (e.g., wine, tequila, whisky), few reports deal with issues related with the spectra collection (e.g., temperature, path length) and its effect on the classification performances. The objective of this study was to evaluate the effect of increasing temperature on both the UV-VIS spectra of whisky and on the classification results of the samples according to country of origin. Whisky samples from different commercial labels were analysed at different temperatures (25, 35, 45, 55 °C) using a UV-VIS instrument (Agilent, Cary 3500). Principal component analysis (PCA) and partial least squares discriminant analysis (PLS-DA) models based in cross validation were used to classify whisky samples according to scanning temperature and origin. The results of this study indicated that temperature did not affect the classification of whisky samples according to country of origin. Overall, well defined protocols need to be defined for routine use of these methods in research and by the industry.

1. Introduction

One of the most popular spirit-based drinks is whisky [1,2,3]. It is one of the distilled alcoholic beverages made from saccharified or malted grains; however, other grains can be used during the manufacturing of whisky, such as wheat, rye, and corn [1,2,3,4]. Whisky is produced mainly via distillation of barley malt followed by an aging process in wooden barrels (e.g., oak) for at least three years until it enters in the market, which provides the liquor with its specific flavour and colour characteristics [2,3,5,6]. However, depending on the country or the region, the production method used may be quite different [7].
In recent years, spectroscopy techniques have been used to evaluate and monitor the origin and the integrity of different alcoholic beverages, including whisky [2,7,8,9,10,11,12,13,14,15,16]. Due to the variety of origins and raw materials used, whisky is often subjected to adulteration [2,3,7]. Recently, several authors reported the use of different methods to trace and authenticate the origin of whisky [2,3,7,16]. These methods included the use of head space mass-spectrometry (HS-MS) [16], paper spray ionization mass spectrometry (PS-MS) [14], Fourier transform infrared (FTIR), and UV and VIS (visible) spectroscopy [2,3,11,12].
The use of spectrophotometric techniques is of interest to the alcoholic beverage industries, since most laboratories are equipped with cheap and easy to use UV-VIS spectrophotometers [2,7]. UV-VIS spectroscopy relies on π bonding and conjugated double bonds, where phenolic compounds have distinct UV fingerprints, while the most abundant sample components, such as water, alcohol, organic acids, and sugars, have no absorbance in the UV wavelength region (200–600 nm) [2,7,15,17]. Recently, analytical methods based in UV-VIS spectroscopy have been reported as having a great potential to target issues related with brand authentication and traceability in a diverse group of distilled spirits, such as whisky, brandy, rum, and other flavoured spirits [7]. In addition, UV-VIS spectroscopy has also shown its potential in the authentication of beer, wine, and other non-alcoholic beverages (although sample filtration and degassing may be required prior to spectral analysis) [2,15,17]. Nowadays, developments in data handling and mining techniques have provided new opportunities to develop and enhance the analysis of the spectra (e.g., the use of derivatives) [3,17,18,19]. UV-VIS spectral analysis can provide information on covalently unsaturated compounds with electronic transition energy differences equivalent to the energy of the UV-VIS light that absorbs at specific wavelengths [20,21]. These compounds are known as chromophores and are responsible for the colour of the sample [20,21]. Covalently saturated groups usually do not absorb in the UV-VIS region of the electromagnetic spectrum but can influence or alter the absorption of some chromophore groups [2,3,20,21]. It is well known that when UV-VIS radiation interacts with chromophores, electrons in the ground state jump to an excited state, known as the electron-excitation state. Meanwhile, other chromophore molecules can act as electron-donating entities with the ability to affect the colour of the chromophores, but they do not change colour themselves [2,3,20,21]. On the other hand, water and other organic compounds (e.g., alcohol) are mostly transparent and do not absorb in the UV-VIS region [2,3,20,21].
It has been reported that the spectrum of alcohols is very sensitive to scanning temperature due to the self-associated forms of the alcohols dissociated into small oligomers, dimmers, and monomers as a function of temperature [22]. For example, it has been demonstrated that temperature changes affect the vibration intensity of molecular bonds in the near infrared (NIR) region, thus the spectrum changes according to the temperature variation [22]. Although extensive research has been done on the effect of temperature on the NIR spectra of alcoholic beverages, no information is available when UV-VIS spectroscopy is used to analyse alcoholic beverages [22,23,24,25,26]. It has been reported that increasing temperature dilates solvents, thus to measure concentration accurately requires a correction factor for the coefficient of thermal expansion. However, volume expansion may impact absorbance less than the effect of temperature on hydration of the chromophore compounds. Therefore, the definition of the optimal temperature and its effects (increasing or variations of temperature) during analysis are of importance to develop a protocol to analyse alcoholic beverages using UV-VIS spectroscopy [22].
Although few reports have been published on the use of spectroscopy combined with chemometric methods to classify and authenticate alcoholic beverages such as whisky [2,3,7,27], no reports were found in relation to the effect of temperature during spectra collection and its consequences on the classification performance. The objective of this study was to evaluate the effect of increasing temperature on both the UV-VIS spectra of whisky and on the classification results of the samples according to country of origin.

2. Materials and Methods

In total, 27 samples (9 commercial labels × 3 bottles per label) from different commercial whisky brands were used. The whisky samples were sourced from commercial labels having different alcohol contents (range between 37 and 40% v/v) and stored during different years (aging) depending on the commercial brand. Commercial labels used in this study included Canadian Club (Canada), Chivas (Scotland), Jameson (Ireland), Crown Royal (Canada), Johnnie Walker (Black Label) (Scotland), Johnnie Walker (Red Label) (Scotland), Jim Beam (Black Label) (USA), Jim Beam (White Label) (USA), and Kilbeggan (Ireland). Prior to analysis, samples were diluted in milliQ water (1/10) to optimise the UV-VIS spectra of the sample (maximum absorbance of 2.5 a.u.). Samples were scanned in transmission mode using a 1 mm path length cuvette before being equilibrated in the instrument and then analysed at 25 °C, 35 °C, 45 °C, and 55 °C (±1 °C). Both milliQ (distilled water) water and 40% ethanol were also scanned as controls. The spectrum of each sample was collected in an Agilent Cary 3500 UV-VIS spectrophotometer in the range 200 nm and 800 nm in progressive steps of 1 nm (Agilent Technologies, Asia-Pacific, Mulgrave, Australia, 2019). Cary 3500 UV workstation software was used to obtain graphs and adjust experiment settings (Agilent Technologies, Asia-Pacific, Australia, 2019). Overall, the data set comprised 108 samples (9 commercial labels × 3 bottles per label × 4 scanning temperatures).
The UV-VIS spectra data were exported in comma-separated values (CSV) format into The Unscrambler (version X, CAMO ASA, Oslo, Norway) for chemometric analysis. Second derivative was calculated using Savitzky–Golay transformation (10 point smoothing and second order filtering) before principal component analysis (PCA) and partial least squares discriminant analysis (PLS-DA). Discrimination models were achieved using PLS-DA (PLS1 algorithm), where the cut-off was set to 0.5 [25,26]. Cross validation (leave one out) was used as the validation method in both PCA and PLS-DA [25,26].

3. Results and Discussion

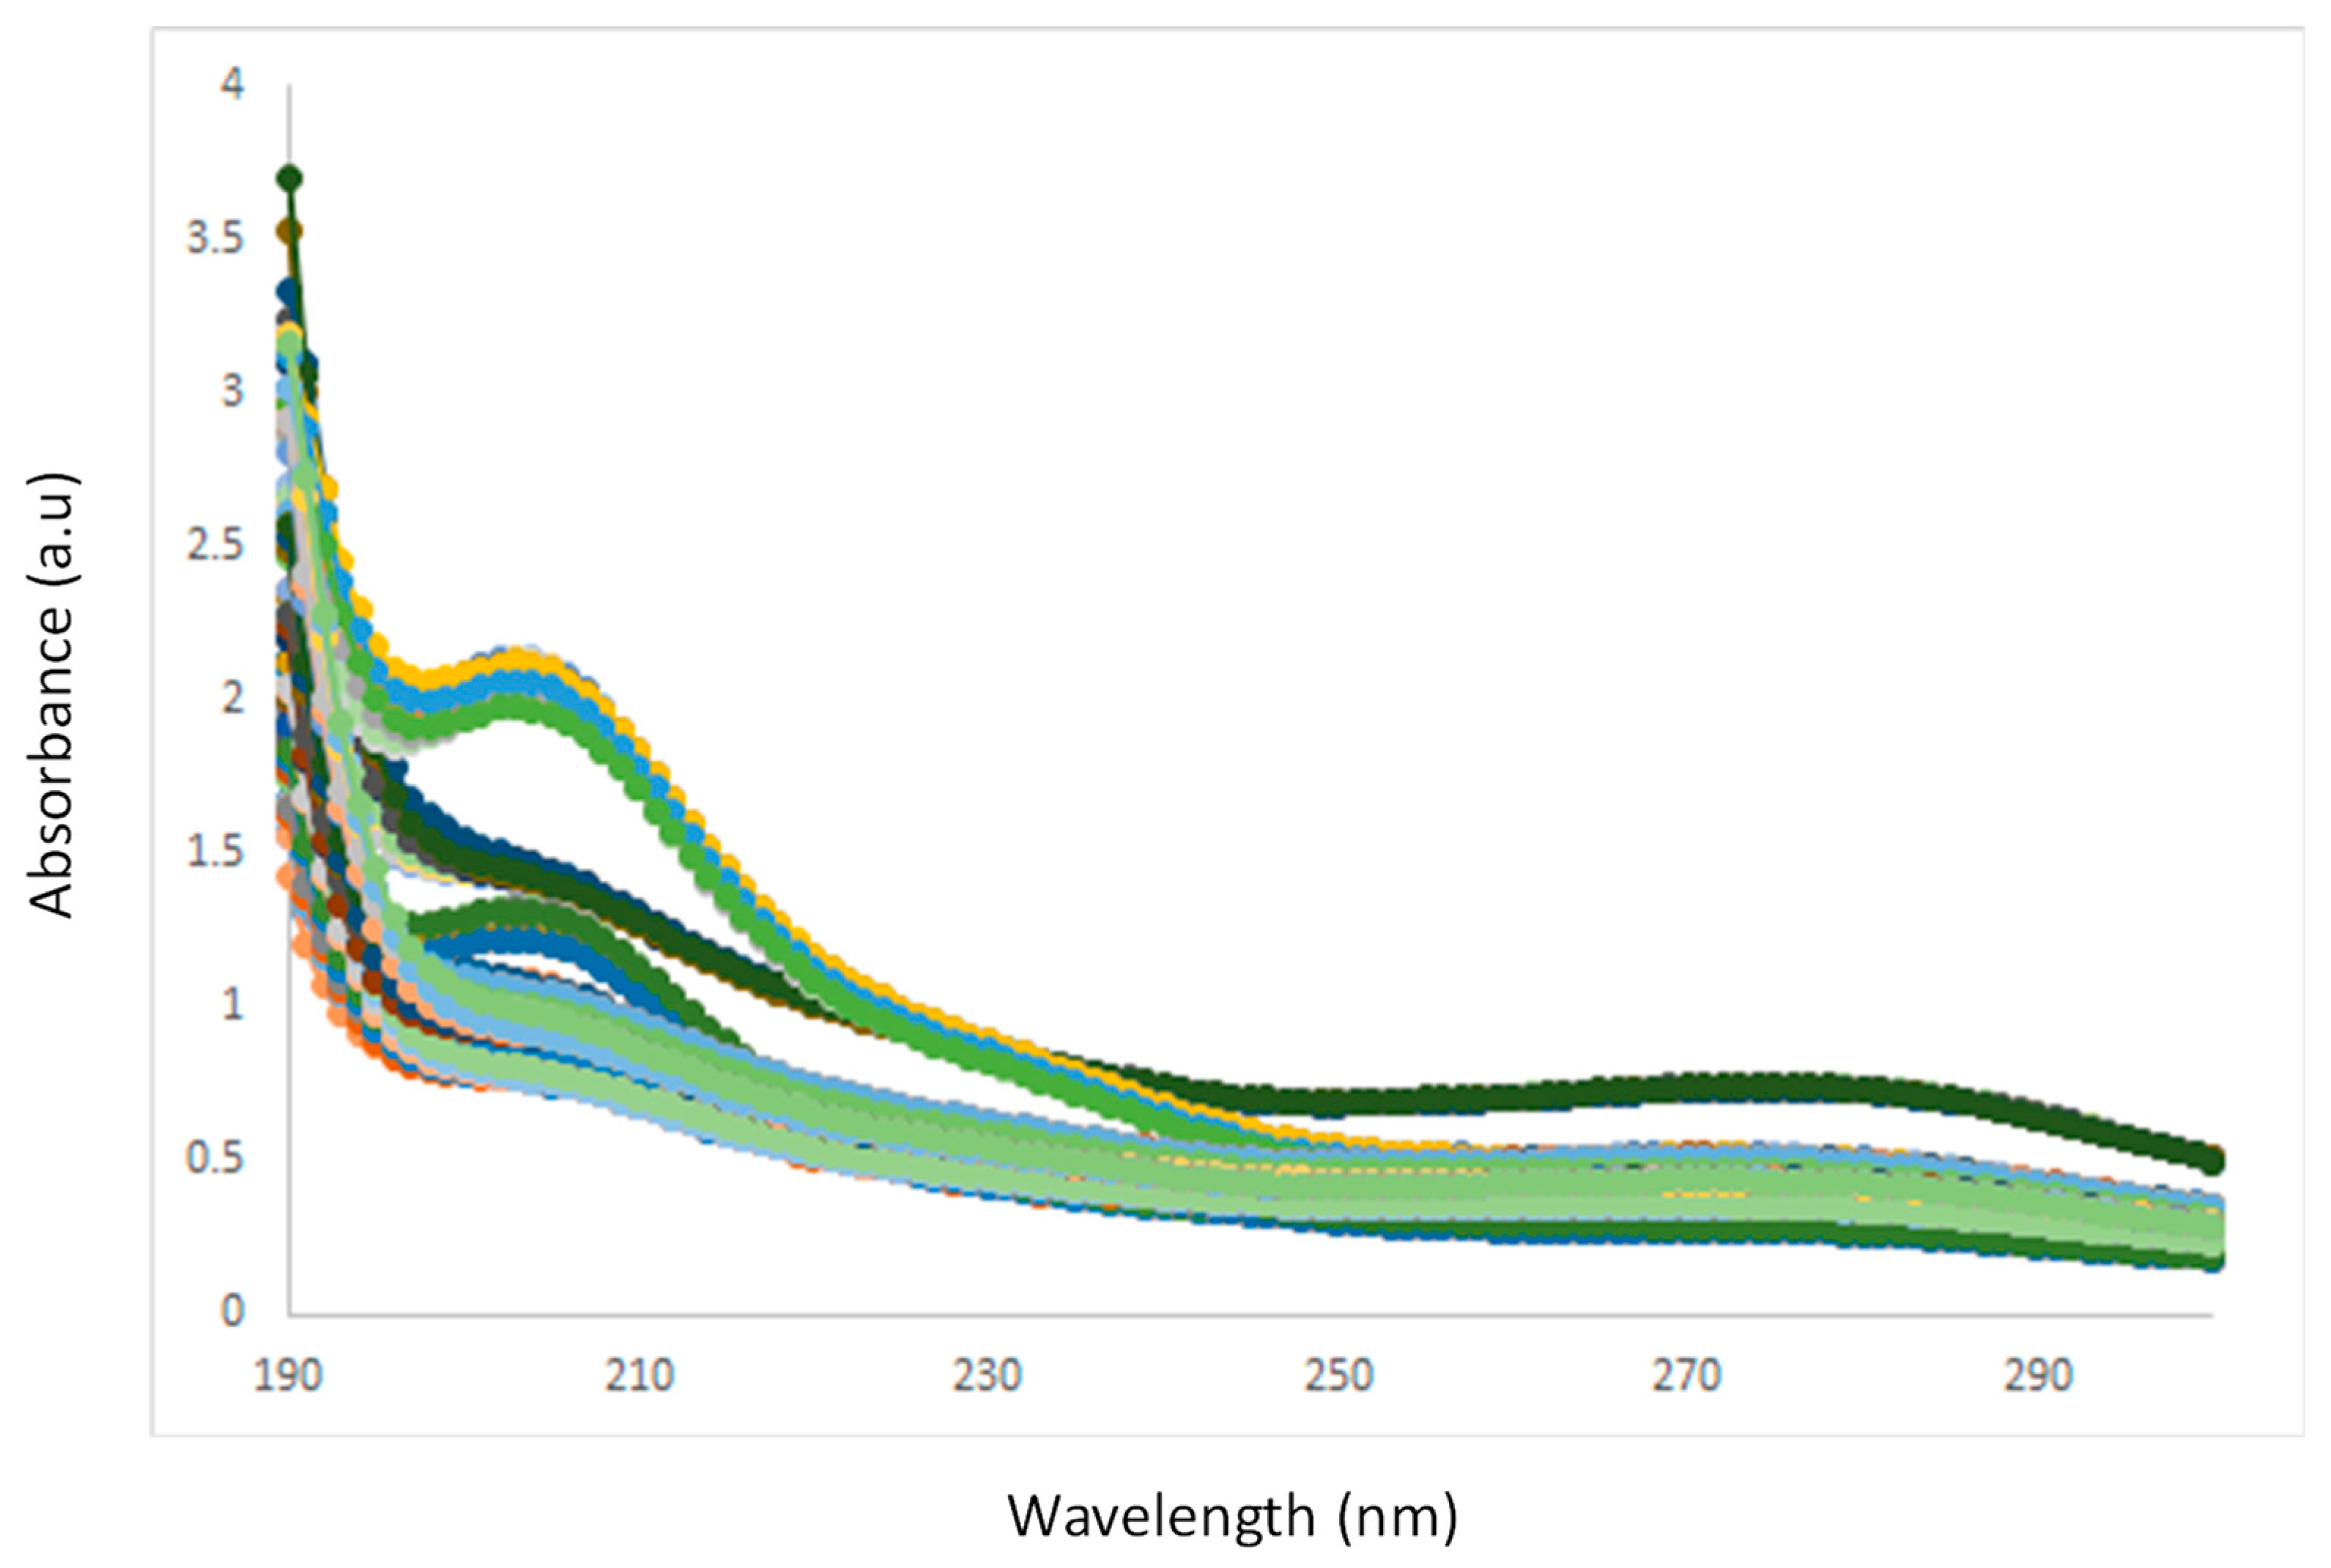
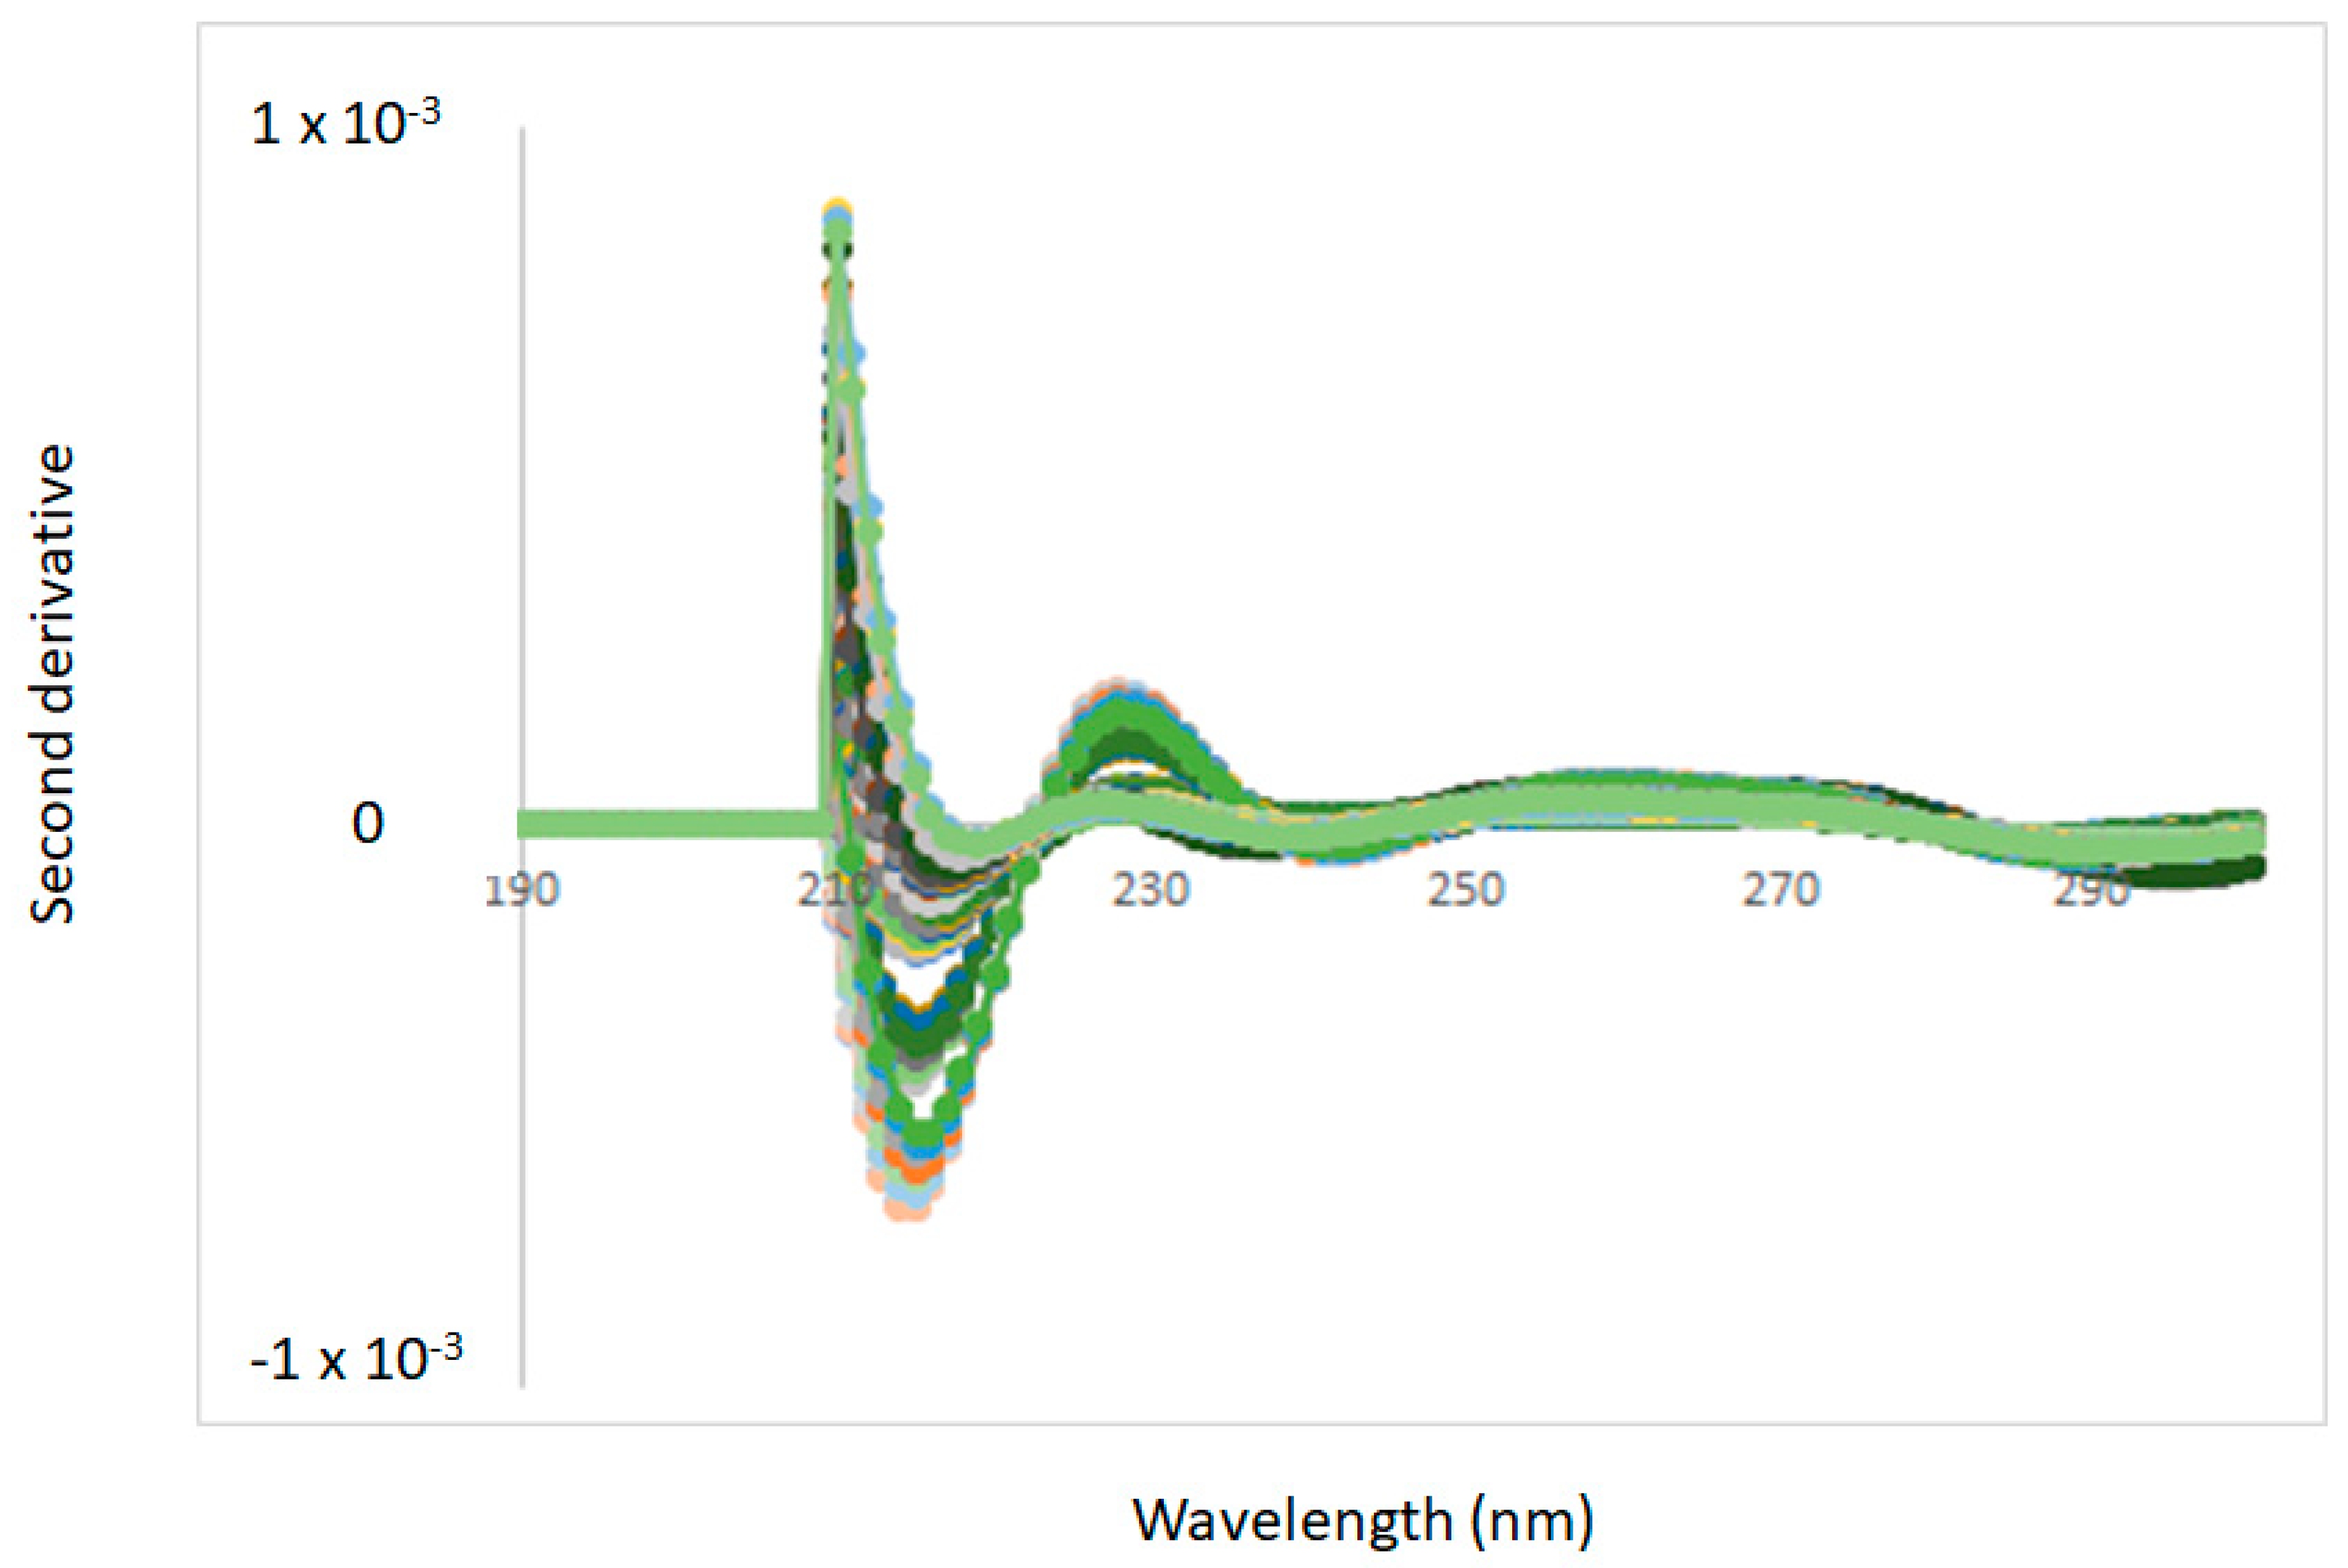
3.1. Spectra Interpretation

Changes in the UV-VIS spectra of the whisky samples at specific wavelengths were observed in either the raw (Figure 1) or the second derivative (Figure 2) spectra as a function of the increase in the temperate during scanning. The observed changes in the values of absorbance in the UV region can be associated with the presence of chromophores originated from compounds present during the maturation process in oak barrels, the presence of volatile phenolic compounds from peat burning during drying, as well as the presence of caramel added to adjust the colour of the whisky during the process, as reported by other authors [2,27]. Absorption bands in the UV-VIS region between 210 nm and 282 nm (Figure 1, raw spectra) were reported to be associated with the presence of furfural and hydroxymethylfurfural (HMF) in aged alcoholic beverages stored in oak barrels [27,28]. These authors also reported that, when furfural is extracted from the oak barrels, HMF might be the main component of caramel present in whisky [27,28]. The latter is believed to be responsible for the high absorbance values around 282 nm in both the raw and the second derivative of the UV-VIS spectra of the whisky samples analysed (Figure 1 and Figure 2) [27,28]. During storage of whisky, HMF content tends to increase, as it is derived from the reaction of sugars (e.g., sucrose) with other compounds present in the oak barrels [2,7,28]. It has been also reported that when whisky is stored in oak wood, furanic compounds such as furfural, 5H-furanone, 2-furyl-1-propanona, 2-furoic acid, methyl furoate, and HMF might contribute to the typical colour and aroma of whisky [2,28]. Therefore, these compounds might be responsible for the characteristic UV-VIS spectral properties in the whisky samples analysed [27,28].
The second derivative of the UV-VIS spectra (Figure 2) of the whisky samples analysed showed absorptions around 210 nm, 222 nm, and 298 nm in addition to those observed in the raw spectra. A small trough around 300 nm was also observed. This wavelength has been reported to be specific to the presence of aromatic and unsaturated compounds in whisky, as reported by other authors [2,27,28]. This region is also associated with the presence of molecules having high antioxidant capacity, such as polyphenol compounds [2,27,28,29]. As reported by other authors, the use of the second derivative provided a better interpretation of the UV-VIS spectra as an increase in the resolution of the absorbance at specific wavelengths [17]. The presence of the above wavelengths in the set of whisky samples analysed is of high importance, as other authors indicated that similar spectral regions can be used as markers to differentiate whisky samples according to region, brand, or blend [2,27,28].

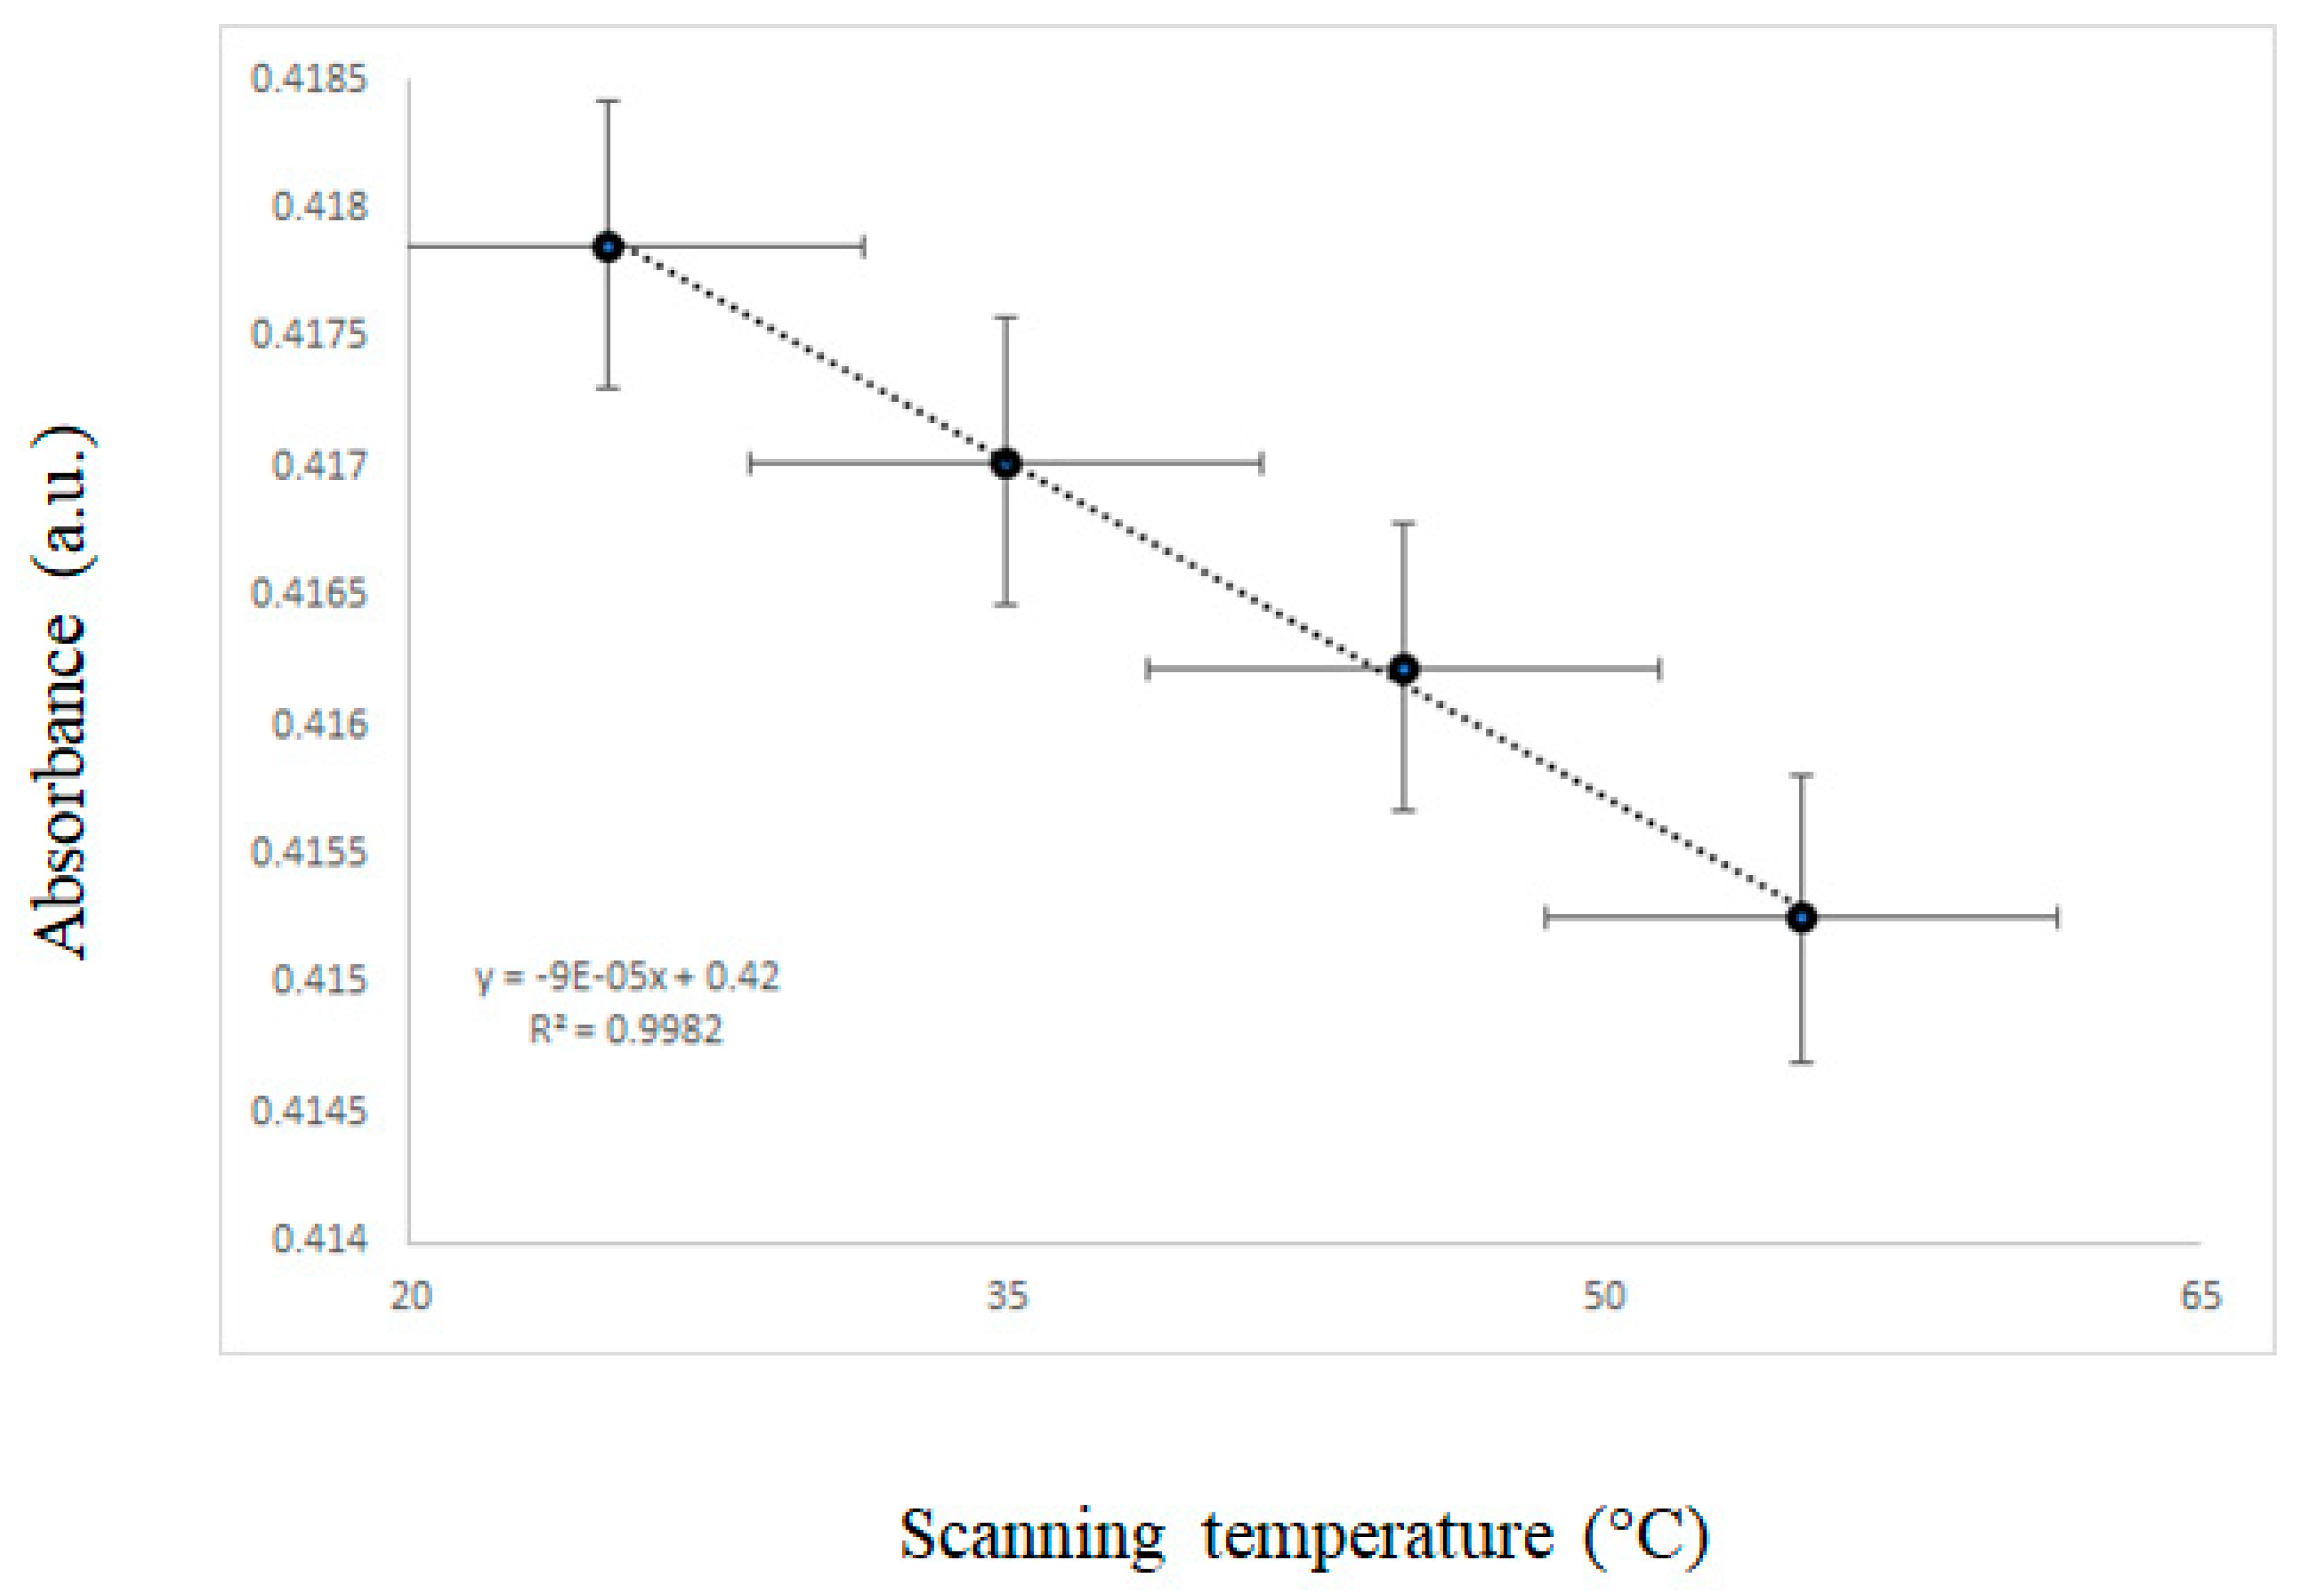
3.2. Effect of Temperature on the UV-VIS Spectra

In our study, the region between 270 nm and 290 nm was negatively correlated with the increase of temperature during the scanning of whisky samples. Therefore, to evaluate the effect of the scanning temperature on the UV-VIS spectra of the samples analysed, a linear regression between the absorbance at single wavelengths (e.g., 280 nm) and scanning temperature was performed. Figure 3 shows the linear regression between the average absorbance at 280 nm of all whisky samples and the scanning temperature. A negative and strong correlation (R2: 0.9982) could be observed between the absorbance selected and the temperature, indicating that an increase in the scanning temperature decreased the absorbance values at specific wavelengths.

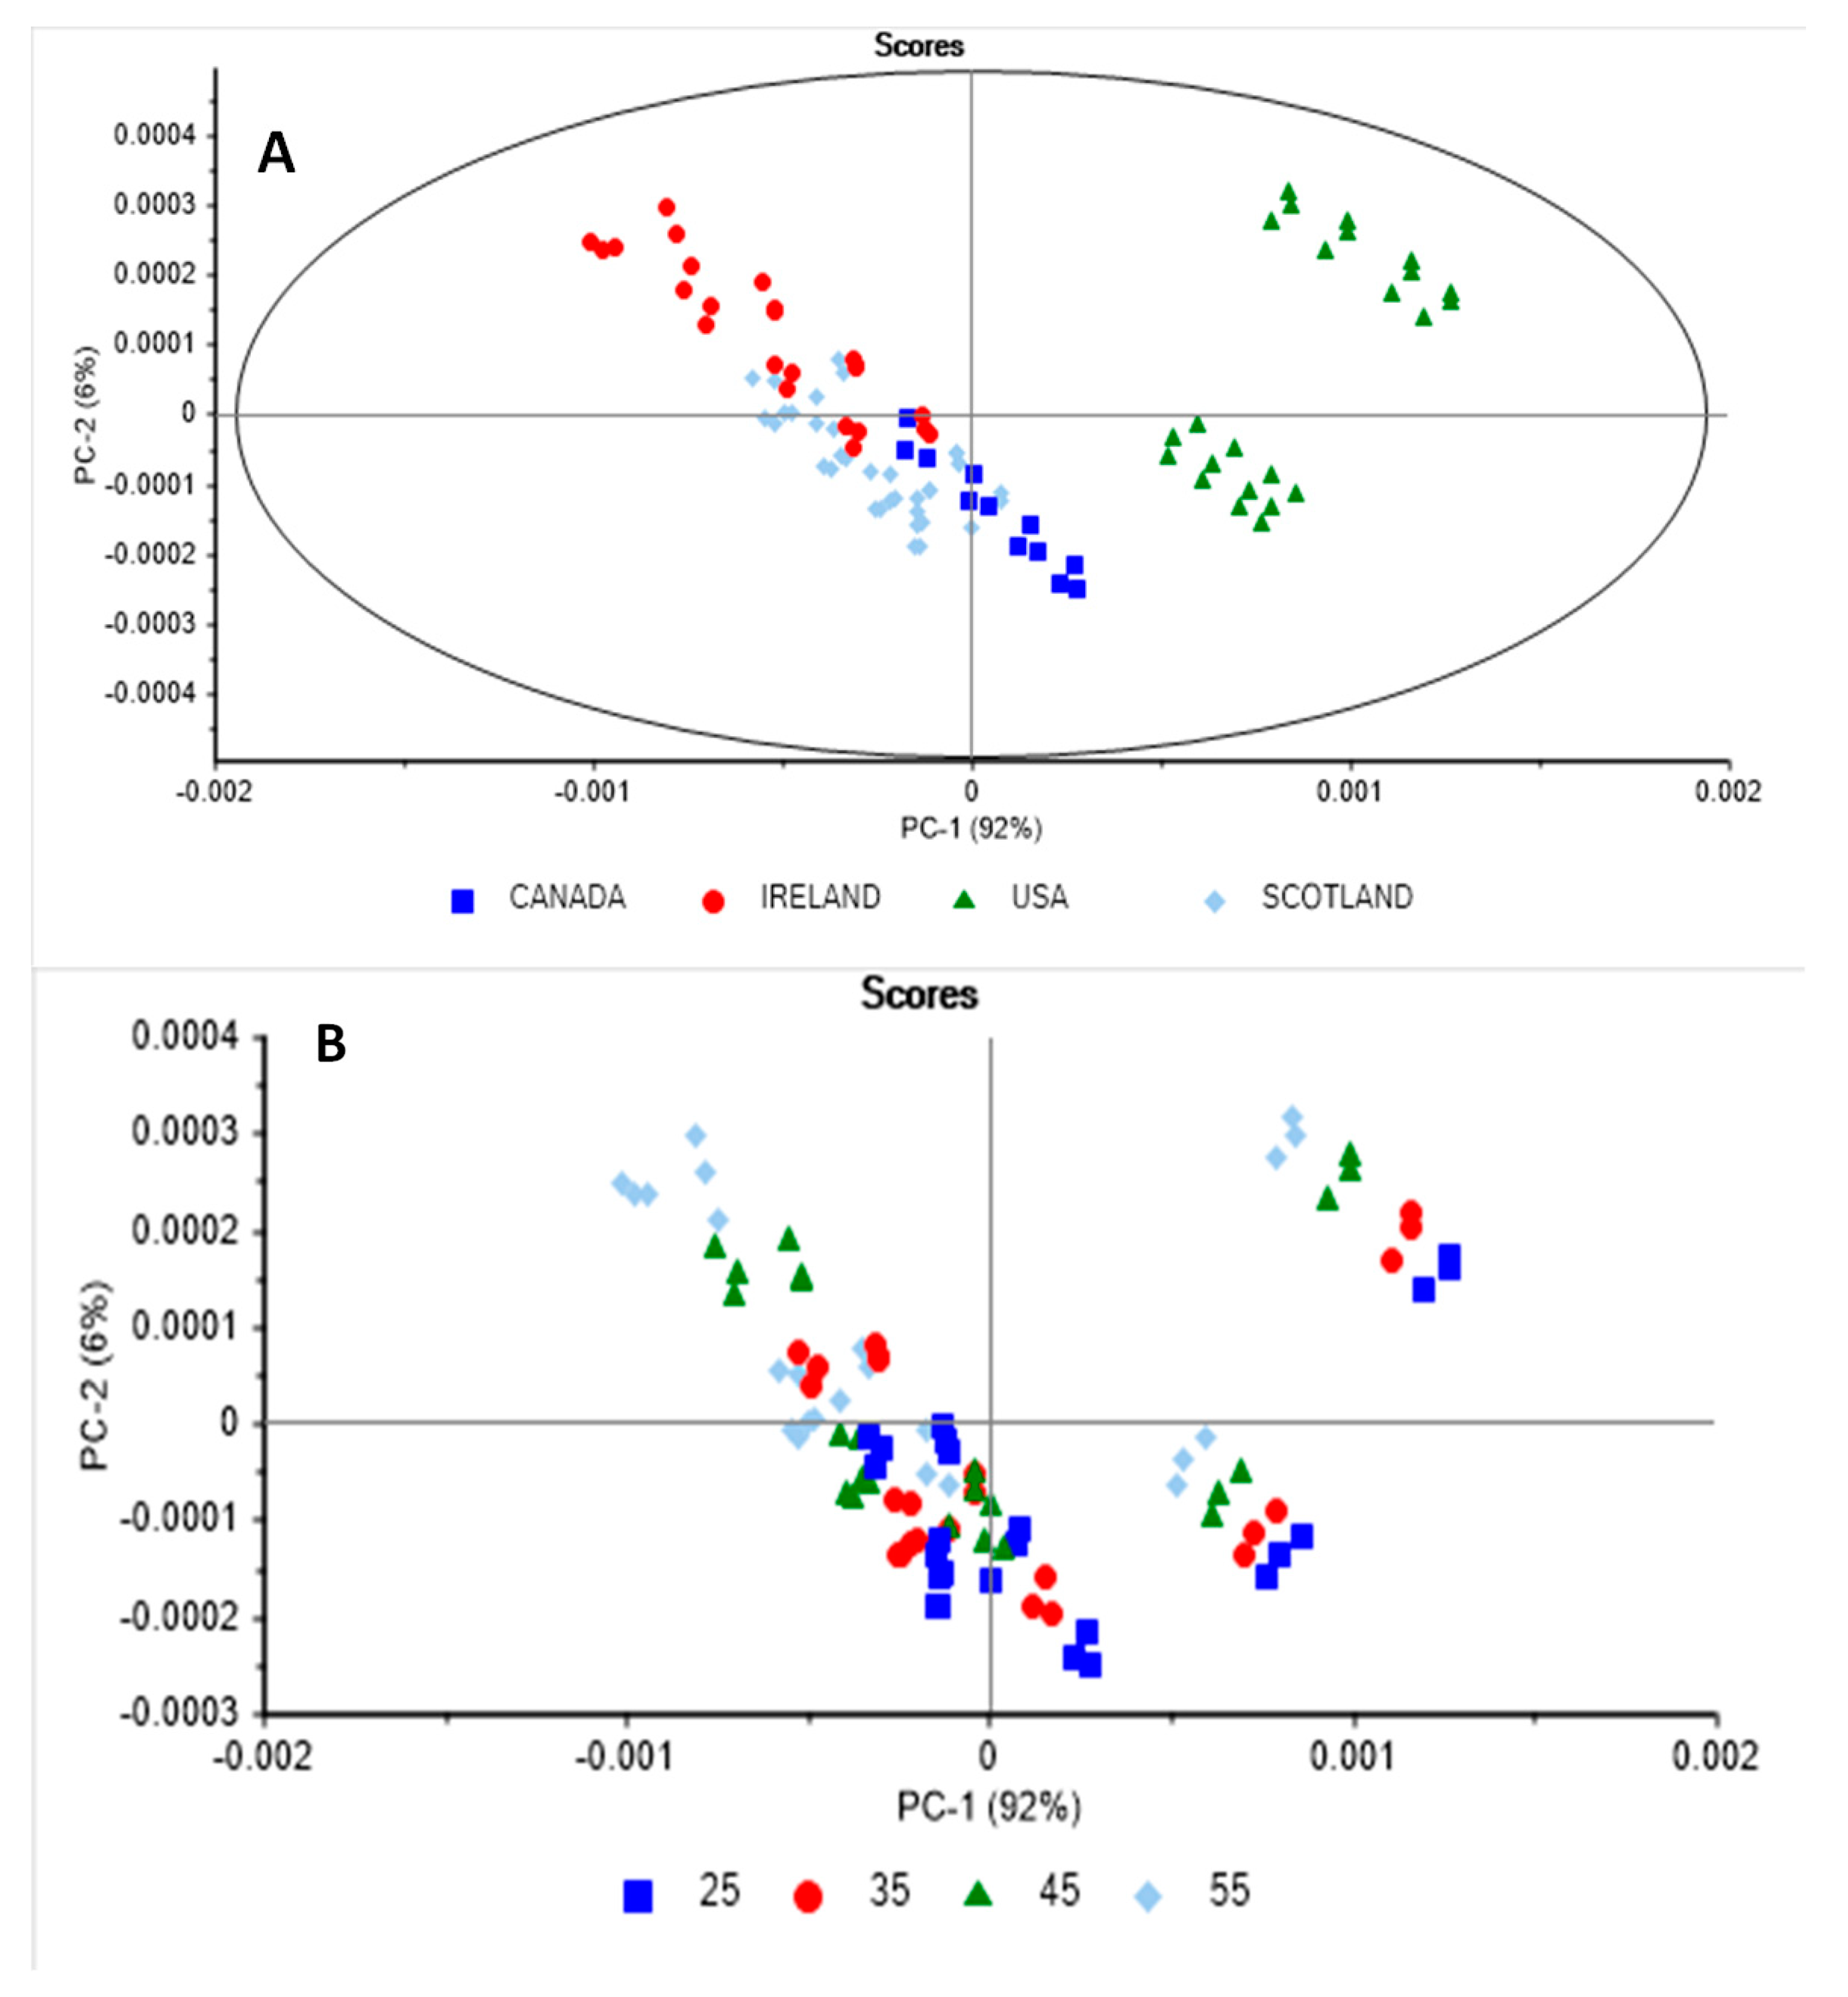
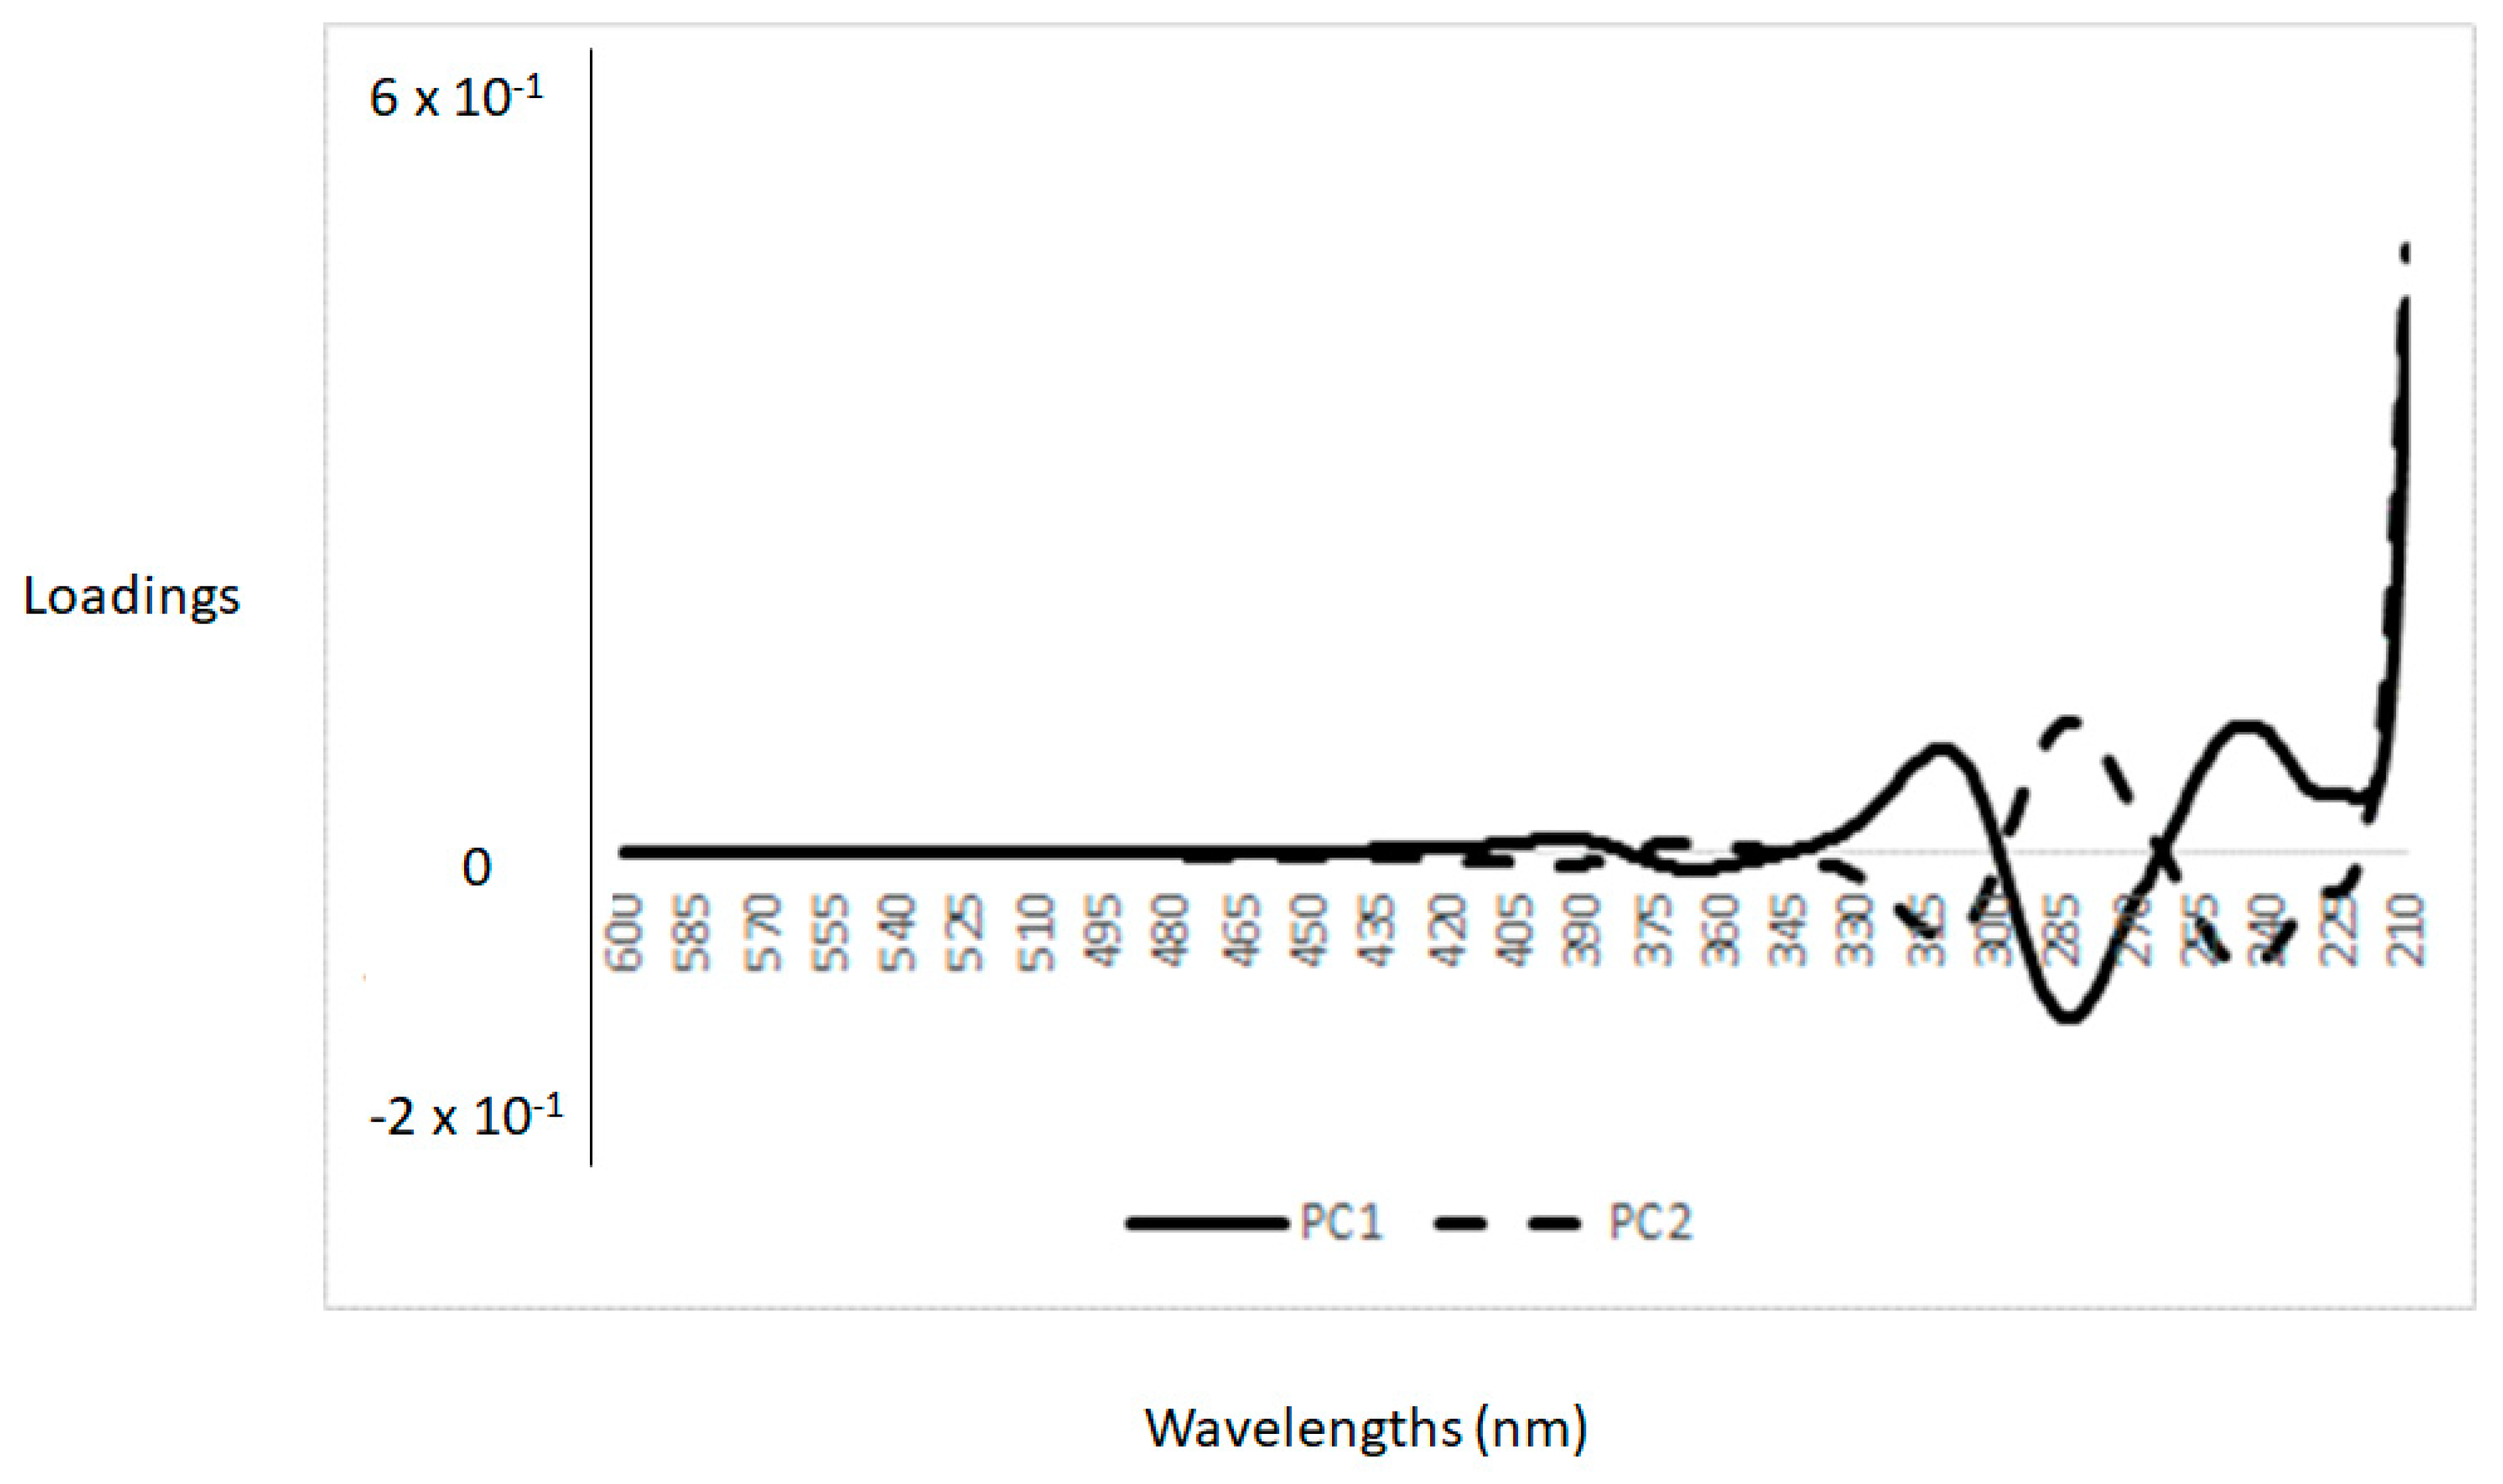
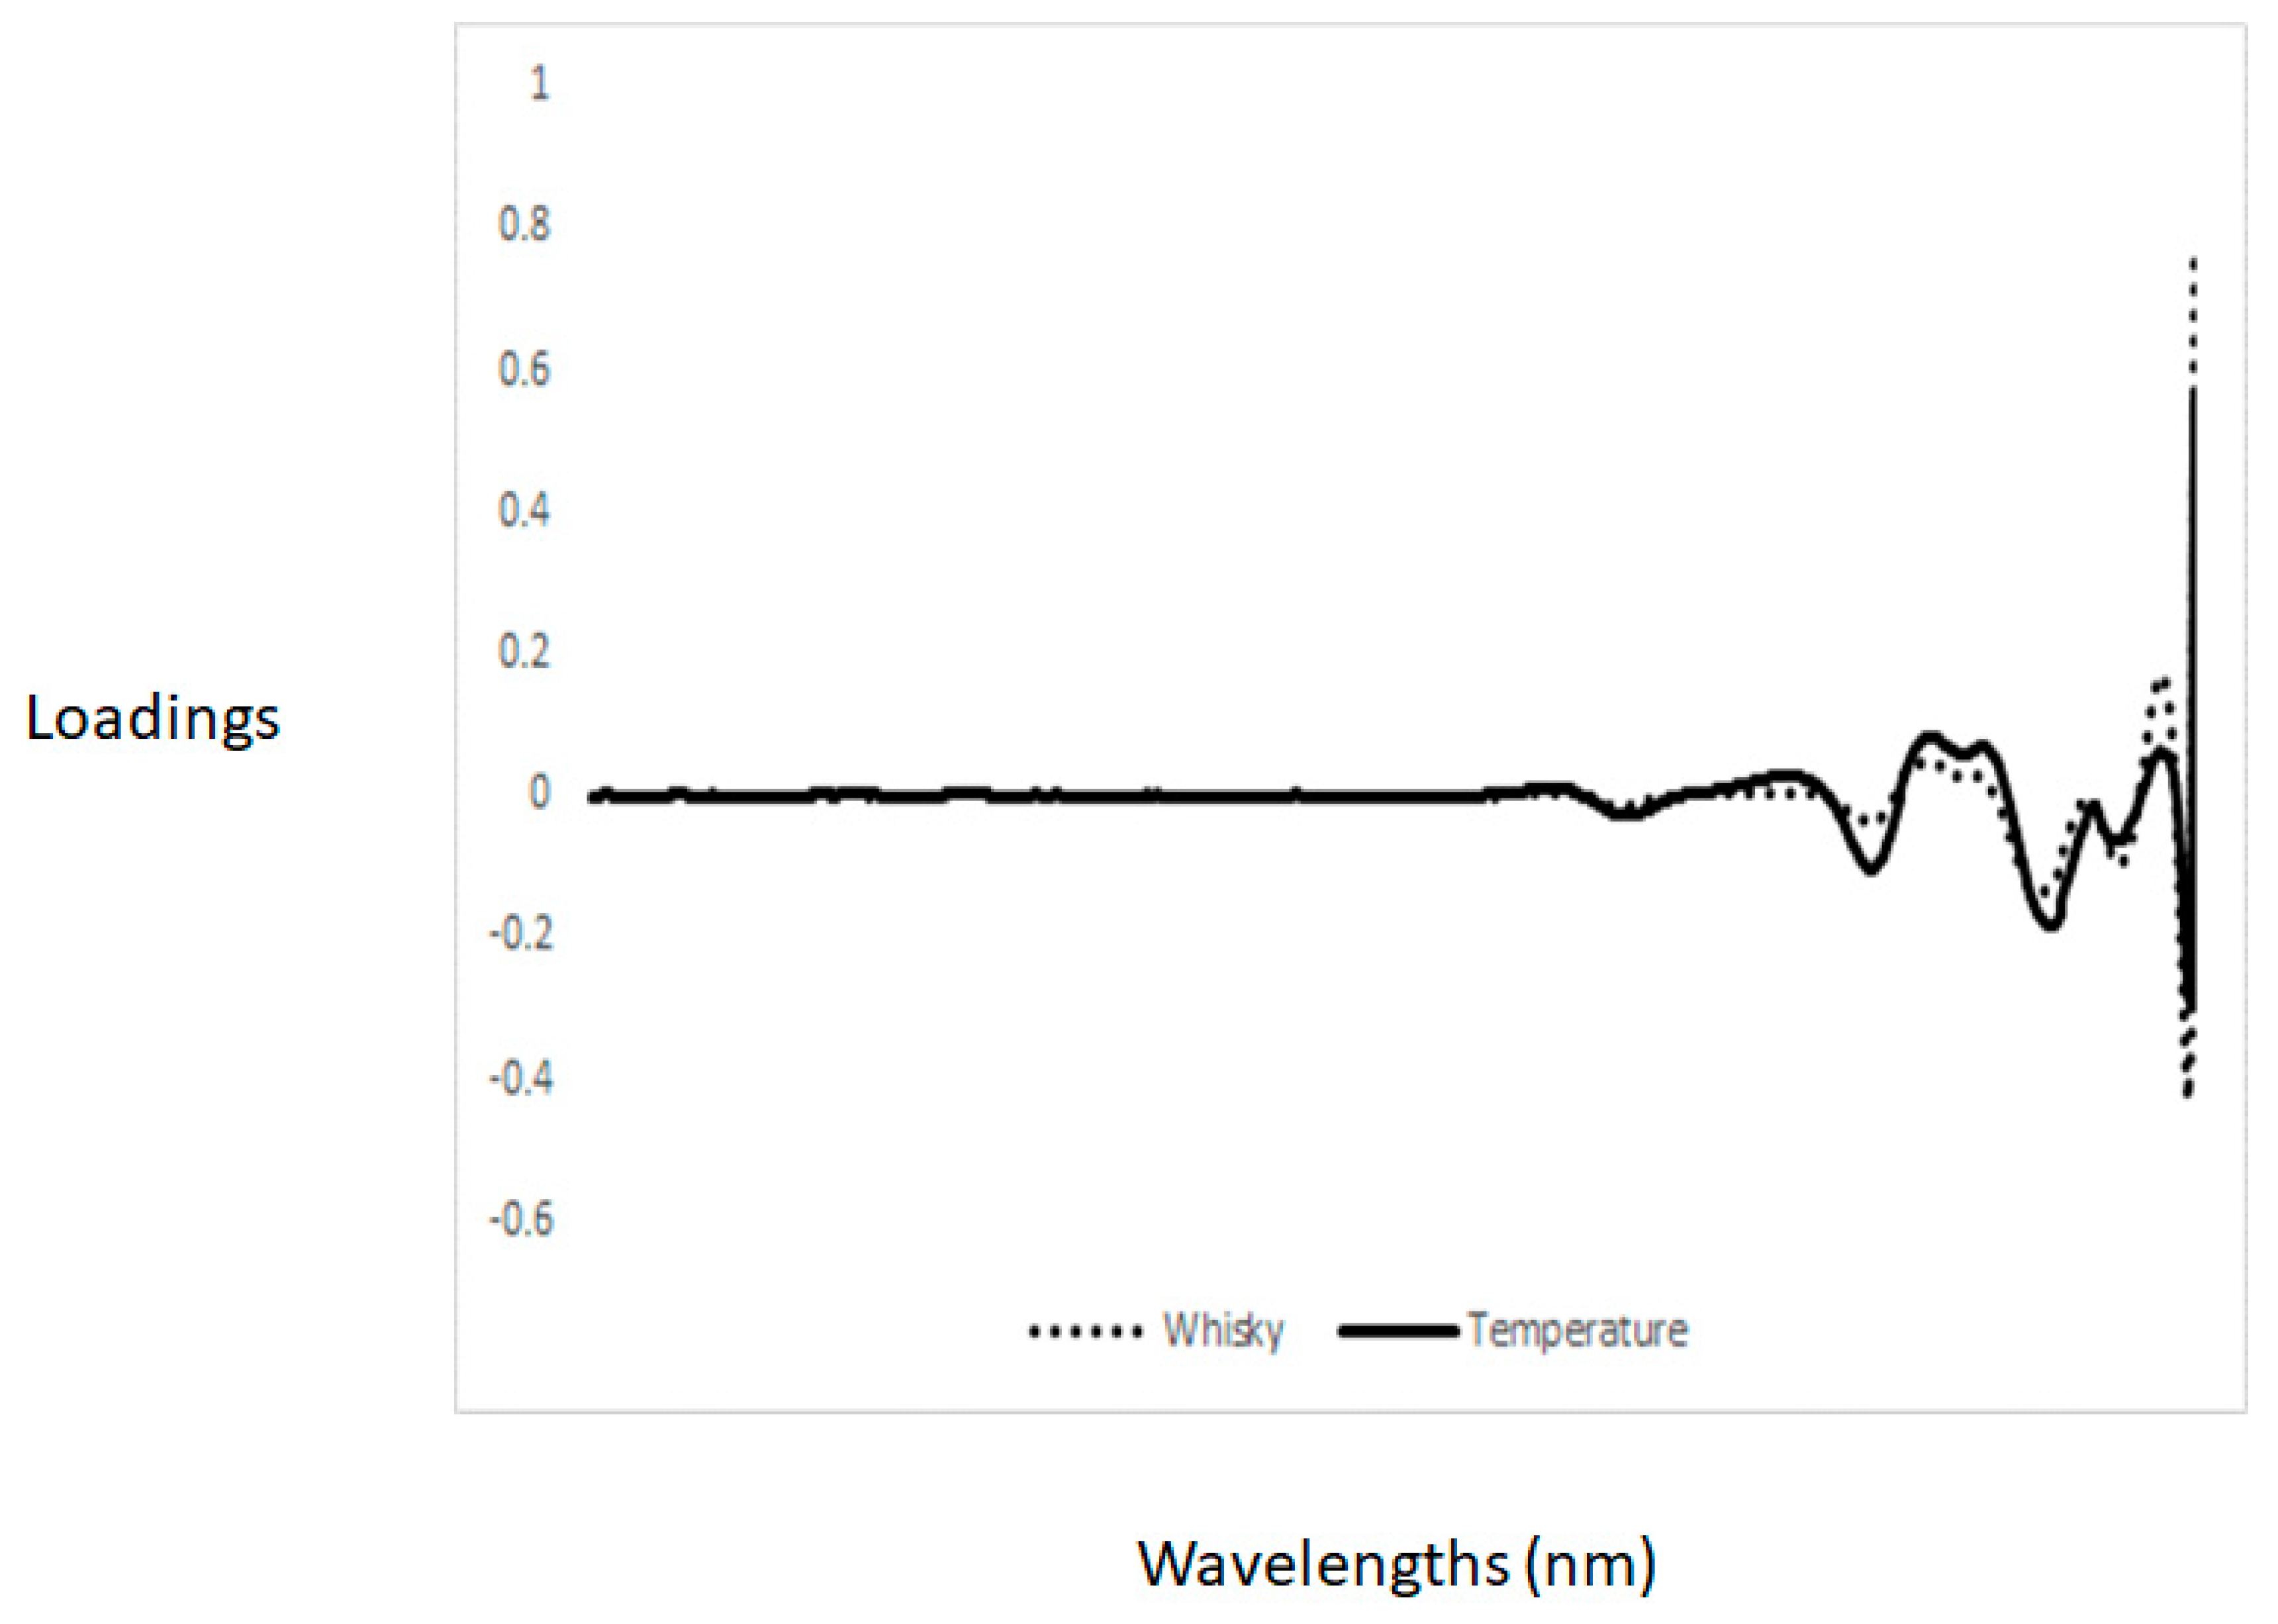
3.3. Principal Component Analysis and Discriminant Analysis

Figure 4 shows the principal component scores plot of the whisky samples analysed at different scanning temperatures (Panel A: country of origin; Panel B: scanning temperature). The score plot showed a clear separation between different whisky samples according to country of origin, and this separation could be achieved independently of the temperature used during the spectra collection. Whisky samples belonging to the same country of origin clustered together independently of the scanning temperature along the first principal component (PC1), while samples belonging to the same commercial brand were arranged in a linear pattern in the direction of the PC2 following the increase in the scanning temperature.
The PCA loadings are reported in Figure 5. The highest loadings in the first (92% of the total variation explained) and the second PC (6% of the total variation explained) were related to chromophores either associated with the presence of phenolic compounds or HMF in the UV region between 250 nm and 300 nm [27,28]. As described above, the UV-VIS region might contain information about different chemical compounds present in the whisky samples analysed. Reports by other authors also indicated that compounds present in whisky such as benzoic acids could be measured in the wavelength range between 235 nm and 305 nm, and hydroxycinnamic acids were measured between 227 nm and 245 nm and between 310 nm and 32 nm [8,9,27,28,29]. Both flavonols and phenolic compounds could be measured between 250 nm and 275 nm, between 350 and 390 nm, and between 475 nm and 545 nm, whereas catechins could be measured at 280 nm [8,9,27,28,29].
PLS-DA was used to classify the whisky samples according to the country of origin based on their UV-VIS spectra. Figure 6 shows the optimal loadings for the PLS-DA regression models used to predict the origin and the scanning temperature in the set of samples analysed. The coefficient of determination (R2) and the standard error in cross validation (SECV) obtained for the prediction of origin were 0.84 and 0.97, respectively. For the prediction of temperature, the R2 and the SECV were 0.87 and 4.5, respectively. Overall, the PLS-DA models correctly classified 100% of the whisky samples belonging to Canada and USA and 98% of the whisky samples belonging to Scotland and Ireland, respectively. The loadings (six latent variables or factors were used to develop the model) also indicated that the models used similar wavelengths for the prediction of whisky and temperature, as described in the PCA analysis. The main absorbances highlighted in the PLS-DA loadings corresponded with wavelengths at 353 nm, 301 nm, 263 nm, and 228 nm. The chemical description of these wavelengths agreed with the absorbances of HMF and polyphenol compounds, as discussed in the section above [27,28].

4. Conclusions

The practical implications of this study are that the temperature used during the scanning of whisky samples might not affect the UV-VIS spectra of the sample and therefore the classification rates. However, it is recommended to define the proper temperature to be used during scanning if an analytical protocol to analyse this type of alcoholic beverages will be developed to target authenticity, integrity, or country of origin in a consistent manner.

Author Contributions

Conceptualization, supervision, writing original draft, and editing, D.C.; Data collection and original draft, I.J.; Supervision and data collection, writing, review and editing, V.K.T., A.E.; J.C.

Funding

This work receives no funding.

Acknowledgments

The authors thank Mathew Quinn from Agilent Australia for providing access to the instrument. The support of RMIT University is acknowledged.

Conflicts of Interest

The authors declare not conflict of interest.

References

  1. Wiśniewska, P.; Dymerski, T.; Wardencki, W.; Namieśnik, J. Chemical composition analysis and authentication of whisky. J. Sci. Food Agric. 2015, 95, 2159–2166. [Google Scholar] [CrossRef] [PubMed]
  2. Mignani, A.G.; Ciaccheri, L.; Gordillo, B.; Azelio Mencaglia, A.; González-Miret, M.L.; Heredia, F.J.; Culshaw, B. Identifying the production region of single-malt Scotch whiskies using optical spectroscopy and pattern recognition techniques. Sens. Actuators B Chem. 2012, 171, 458–462. [Google Scholar] [CrossRef]
  3. MacKenzie, W.M.; Aylott, R.I. Analytical strategies to confirm Scotch whisky authenticity. Part II: Mobile brand authentication. Analyst 2004, 129, 607–612. [Google Scholar] [CrossRef] [PubMed]
  4. Hoffman, M.A. Whiskey: A Fascinating Journey Through the Most Famous Whiskey and Distilleries Worldwide; Parragon Inc.: Bath, UK, 2008. [Google Scholar]
  5. Aoshima, H.; Tsunoue, H.; Koda, H.; Kiso, Y. Aging of whiskey increases 1, 1-diphenyl-2-picrylhydrazyl radical scavenging activity. J. Agric. Food Chem. 2004, 52, 5240–5244. [Google Scholar] [CrossRef] [PubMed]
  6. Fujieda, M.; Tanaka, T.; Suwa, Y.; Koshimizu, S.; Kouno, I. Isolation and structure of whiskey polyphenols produced by oxidation of oak wood ellagitannins. J. Agric. Food Chem. 2008, 56, 7305–7310. [Google Scholar] [CrossRef] [PubMed]
  7. Wiśniewska, P.; Dymerski, T.; Wardencki, W.; Namieśnik, J. Authentication of whisky due to its botanical origin and way of production by instrumental analysis and multivariate classification methods. Spectrochim. Acta Part A Mol. Biomol. Spectrosc. 2017, 173, 849–853. [Google Scholar] [CrossRef] [PubMed]
  8. Acevedo, F.J.; Jimenez, J.; Maldonado, S.; Domínguez, E.; Narváez, A. Classification of Wines Produced in Specific Regions by UV−Visible Spectroscopy Combined with Support Vector Machines. J. Agric. Food Chem. 2007, 55, 6842–6849. [Google Scholar] [CrossRef]
  9. Urbano, M.; De Castro, M.D.L.; Pérez, P.M.; García-Olmo, J.; Gómez-Nieto, M.A. Ultraviolet–visible spectroscopy and pattern recognition methods for differentiation and classification of wines. Food Chem. 2006, 97, 166–175. [Google Scholar] [CrossRef]
  10. Azcarate, S.M.; Cantarelli, M.A.; Pellerano, R.G.; Marchevsky, E.J.; Camiña, J.M. Classification of Argentinean Sauvignon blanc wines by UV spectroscopy and chemometric methods. J. Food Sci. 2013, 78, C432–C436. [Google Scholar] [CrossRef]
  11. Uríčková, V.; Sádecká, J. Determination of geographical origin of alcoholic beverages using ultraviolet, visible and infrared spectroscopy: A review. Spectrochim. Acta Part A Mol. Biomol. Spectrosc. 2015, 148, 131–137. [Google Scholar] [CrossRef]
  12. Rodriguez-Saona, L.E.; Giusti, M.M.; Shotts, M. Advances in Infrared Spectroscopy for Food Authenticity Testing. In Advances in Food Authenticity Testing; Elsevier: Amsterdam, The Netherlands, 2016; pp. 71–116. [Google Scholar]
  13. Cozzolino, D. Near Infrared Spectroscopy and Food Authenticity. In Advances in Food Traceability Techniques and Technologies; Elsevier: Amsterdam, The Netherlands, 2016; pp. 119–136. [Google Scholar]
  14. Tosato, F.; Correia, R.M.; Oliveira, B.G.; Fontes, A.M.; França, H.S.; Coltro, W.K.; Romão, W. Paper spray ionization mass spectrometry allied to chemometric tools for quantification of whisky adulteration with additions of sugarcane spirit. Anal. Methods 2018, 10, 1952–1960. [Google Scholar] [CrossRef]
  15. Kerslake, F.; Longo, R.; Dambergs, R. Discrimination of Juice Press Fractions for Sparkling Base Wines by a UV-Vis Spectral Phenolic Fingerprint and Chemometrics. Beverages 2018, 4, 45. [Google Scholar] [CrossRef]
  16. Kew, W.; Goodall, I.; Clarke, D.; Uhrín, D. Chemical diversity and complexity of scotch whisky as revealed by high-resolution mass spectrometry. J. Am. Soc. Mass Spectrom. 2017, 28, 200–213. [Google Scholar] [CrossRef] [PubMed]
  17. Parmar, A.; Sharma, S. Derivative UV-vis absorption spectra as an invigorated spectrophotometric method for spectral resolution and quantitative analysis: Theoretical aspects and analytical applications: A review. TrAC Trends Anal. Chem. 2016, 77, 44–53. [Google Scholar] [CrossRef]
  18. Wold, S. Chemometrics; what do we mean with it, and what do we want from it? Chemom. Intell. Lab. Syst. 1995, 30, 109–115. [Google Scholar] [CrossRef]
  19. Wold, S.; Albano, C.W.J.D.; Dunn, W.J.; Edlund, U.; Esbensen, K.; Geladi, P.; Hellberg, S.; Johansson, E.; Lindberg, W.; Sjöström, M. Multivariate Data Analysis in Chemistry; Springer: Berlin/Heidelberg, Germany, 1984; pp. 17–95. [Google Scholar]
  20. Fuwa, K.; Valle, B. The Physical Basis of Analytical Atomic Absorption Spectrometry. The Pertinence of the Beer-Lambert Law. Anal. Chem. 1963, 35, 942–946. [Google Scholar] [CrossRef]
  21. Perkampus, H.-H. Recent developments in UV-VIS spectroscopy. In UV-VIS Spectroscopy and Its Applications; Springer: Berlin/Heidelberg, Germany, 1992; pp. 81–130. [Google Scholar]
  22. Cozzolino, D.; Liu, L.; Cynkar, W.U.; Dambergs, R.G.; Janik, L.; Colby, C.B.; Gishen, M. Effect of temperature variation on the visible and near infrared spectra of wine and the consequences on the partial least square calibrations developed to measure chemical composition. Anal. Chim. Acta 2007, 588, 224–230. [Google Scholar] [CrossRef]
  23. Espiñeira, M.; Santaclara, F.J. Advances in Food Traceability Techniques and Technologies: Improving Quality Throughout the Food Chain; Woodhead Publishing is an Imprint of Elsevier: Duxford, UK, 2016. [Google Scholar]
  24. Martin, C.; Bruneel, J.-L.; Castet, F.; Fritsch, A.; Teissedre, P.-L.; Jourdes, M.; Guillaume, F. Spectroscopic and theoretical investigations of phenolic acids in white wines. Food Chem. 2017, 221, 568–575. [Google Scholar] [CrossRef]
  25. Martens, H.; Næs, T. Multivariate calibration. I. Concepts and distinctions. TrAC Trends Anal. Chem. 1984, 3, 204–210. [Google Scholar] [CrossRef]
  26. Næs, T.; Martens, H. Multivariate calibration. II. Chemometric methods. TrAC Trends Anal. Chem. 1984, 3, 266–271. [Google Scholar] [CrossRef]
  27. Martins, A.R.; Talhavini, M.; Vieira, M.L.; Zacca, J.J.; Braga, J.W.B. Discrimination of whisky brands and counterfeit identification by UV–Vis spectroscopy and multivariate data analysis. Food Chem. 2017, 229, 142–151. [Google Scholar] [CrossRef] [PubMed]
  28. Boscolo, M.; Andrade-Sobrinho, L.G.; Lima-Neto, B.S.; Franco, D.W.; Ferreira, M.M.C. Spectrophotometric determination of caramel content in spirits aged in oak casks. J. AOAC Int. 2002, 85, 744–750. [Google Scholar] [PubMed]
  29. Somers, T.C.; Ziemelis, G. Spectral evaluation of total phenolic components in Vitis vinifera: Grapes and wines. J. Sci. Food Agric. 1985, 36, 1275–1284. [Google Scholar] [CrossRef]
Figure 1. UV-VIS spectra of whisky samples scanned at different temperatures (25, 35, 45, and 55 °C) in transmission.
Applsci 09 03254 g001
Figure 2. Second derivative of UV-VIS spectra of whisky samples scanned at different temperatures (25, 35, 45, and 55 °C).
Applsci 09 03254 g002
Figure 3. Linear regression between absorbance at 280 nm and scanning temperature. Please note that each dot represents the average of all whisky samples scanned at that temperature.
Applsci 09 03254 g003
Figure 4. Principal component score plot of whisky samples analysed UV-VIS spectroscopy. (A): label by whisky, (B): label by scanning temperature.
Applsci 09 03254 g004
Figure 5. Principal component loadings of whisky samples analysed UV-VIS spectroscopy.
Applsci 09 03254 g005
Figure 6. Partial least squares (PLS-DA) loadings derived from the prediction of origin and temperature in the whisky samples analysed using UV-VIS spectroscopy.
Applsci 09 03254 g006

