Article

Visible/near Infrared Reflection Spectrometer and Electronic Nose Data Fusion as an Accuracy Improvement Method for Portable Total Soluble Solid Content Detection of Orange

1
Public Monitoring Center for Agro-Product of Guangdong Academy of Agricultural Sciences, Guangzhou 510640, China
2
Guangdong Academy of Agricultural Sciences, Guangzhou 510640, China
3
College of Engineering, South China Agricultural University, Guangzhou 510640, China
4
University of Florida, 2550 Hull Road, Gainesville, FL 32611, USA
*
Author to whom correspondence should be addressed.
Appl. Sci. 2019, 9(18), 3761; https://doi.org/10.3390/app9183761
Submission received: 22 August 2019 / Revised: 5 September 2019 / Accepted: 5 September 2019 / Published: 9 September 2019
(This article belongs to the Special Issue Non-destructive Sensors in Food Authentication)

Abstract

:
The visible/near infrared (VIS/NIR) spectrometer and electronic nose (E-nose) are two commonly used portable and nondestructive detection apparatuses which have a promising application for the quick acquisition of fruit’s internal quality in both the orchard and market. However, the accuracy of these instruments is sometimes unsatisfactory, especially for thick peeled fruit like the ‘Aiyuan 38’ orange, which was investigated in this research. The objective of this research was to find a method to improve the accuracy for the detection of an orange’s total soluble solid content (TSS) using a VIS/NIR spectrometer and E-nose. Different spectrum detection positions and conventional feature extraction methods are compared to get the optimal data fusion parameters. The detection model was then built up based on the obtained fusion data under the optimal parameters. Partial least squares regression (PLSR) and mutual information theory (MIT) were applied for feature extraction, and PLSR and principal component analysis (PCA)-back propagation neural network (BPNN) were applied for modeling and detection. PLSR results showed that the sampling reflection spectrum at the position of the calyx results in a better orange TSS detection than other sampling positions. For VIS/NIR reflection spectrum feature extraction, PLSR and MIT results showed that the optimal data process + feature extraction method is Savitzky-Golay + 763 features, when their mutual information values between the feature and TSS value were larger than 0.74. For E-nose feature extraction, PLSR and MIT results showed that the combined feature (combination of 75 s value, average value, average of differential value, integral value, and maximum value) is the optimal feature extraction method, and all features are retained for modeling. The PLSR detection ability of orange TSS based on fusion data is better than the single detection method, with the detection ability of the single detection methods being unsatisfactory. PCA-BPNN has better orange TSS detection ability than PLSR. The R2, RMSE, and slope from the calibration set for PCA-BPNN detection were 0.9695, 0.1895, and 0.9665, respectively, and from the validation set for PCA-BPNN detection were 0.8872, 0.4709, and 1.0871, respectively, indicating that this method can detect orange TSS efficiently.

1. Introduction

The total soluble solid content (TSS) is an important parameter for fruit. Sugar contributes 75%–85% of TSS, while acids, fructans, proteins, dissolved vitamins, minerals, phenolic compounds, and pigments constitute the remainder [1]. TSS is a key parameter which largely determines the flavor of fruit and is usually used to determine the commercial value of fruit. While consumer fruit quality assessment is still highly determined by external appearance, previous research and experience has shown that the visual appearance quality of fruit often does not match the fruit flavor quality [2]. Thus, an efficient TSS detection method is necessary for the fruit industry.
Sensory and physicochemical detection methods are two conventional flavor detection methods. Sensory detection [3] is destructive, time and labor consuming, and can often not detect TSS accurately. Physicochemical detection [4] measures TSS from extracted juice using a refractometer, which is an accurate detection method, but is also a destructive and invasive measurement requiring much labor force and time. Thus, a nondestructive and intelligent TSS detection method is needed.
Visible/near infrared (VIS/NIR) spectrum is considered one of the most efficient, nondestructive, and automated TSS detection methods for fruit, like peach [5], apple [6], orange [7], watermelon [8], and persimmon [9] etc. However, VIS/NIR spectrum can be divided into transmitted spectrum [10] and reflection spectrum [11]. Transmitted spectrum usually provides rich internal information with high accuracy for TSS detection but has a complicated optical structure and large equipment size because the light source and the fiber-optics probe have to be on the opposite sides of the fruit sample. Thus, transmitted spectrum equipment is not portable, and the technique is commonly applied for fruit TSS detection in an indoor environment. Previous research has shown the high detection accuracy for orange TSS using transmitted spectrum [12]. On the other hand, a spectrometer using the reflection spectrum method has been created for use as a portable TSS detection device, with a compact light source and the fiber-optics probe. However, reflection spectrum focuses more on the surface of the sample, and the deeper the parts of sample have a weaker signal acquisition. That is, reflection spectrum has lower detection accuracy than transmitted spectrum in fruit TSS detection, especially for thick peeled fruit. Cheng et al. found that orange TSS can be feasibly detected by reflection spectrum, but with only mediocre results [13]. In practical applications, a portable spectrometer is more suitable than a non-portable one for many applications, such as fruit TSS detection in an orchard or market. Thus, improving the accuracy of detectors based on the reflection spectrum method needs to be further explored, especially in the case of unsatisfactory detection results.
Electronic nose (E-nose) is another portable, nondestructive, and intelligent food quality detection method, which has been widely reported on in the past years [14,15]. Previous researches showed that the E-nose is a feasible means to detect TSS of many thin peeled fruit like mango [16], persimmon [17], and strawberry [18] etc., because the TSS of fruit is related to its volatile ‘fingerprint’ which can be acquired by E-nose. However, whether the E-nose can nondestructively detect the TSS of thick peeled fruit efficiently has not yet been reported.
The ‘Aiyuan 38’ orange, a new orange cultivar, has become very popular in China in recent years, due to its great flavor and high juice content, but has been less investigated so far. In this research, we find the detection ability of the TSS of ‘Aiyuan 38’ based on the reflection spectrum to be unsatisfactory. Thus, the detection ability of E-nose for TSS of ‘Aiyuan 38’ orange was checked. Then, we tried to find a portable method which improved the accuracy for ‘Aiyuan 38’ orange TSS detection based on VIS/NIR reflection spectrum and E-nose. The research results would also provide a reference for the quality detection of other fruits in a portable and nondestructive way.

2. Materials and Methods

2.1. Experimental Orange Samples

The experimental ‘Aiyuan 38’ orange samples were harvested from Meishan, Sichuan, China, over multiple harvest seasons to guarantee a diversity of samples. All experimental samples were harvested and shipped to our lab in Guangzhou, Guangdong, China, arriving two days later for immediate experimentation. Orange, like other citrus fruit with a thick peel, can withstand storage well, especially short term. Grading occurs at the beginning of the commercial handling process and is usually finished a few days after harvesting. There were 117 defect-free samples used for the experiment.

2.2. VIS/NIR Spectral Data Acquisition

A portable spectrometer (ASD Feildspec 3, Analytica Spectra Devices Inc., Boulder, CO, USA) was applied in this experiment to acquire a sample’s VIS/NIR reflection spectrum information. The wavelength range of this spectrometer is from 350 to 2500 nm. The sampling interval and spectral resolution of 350 to 1000 nm are 1.4 nm and 3 nm, respectively, and the sampling interval and spectral resolution of 1000 to 2500 nm are 2 nm and 10 nm, respectively. The spectrometer’s vegetation probe is composed of a light source (with a wavelength coverage from 350 to 2500 nm) and a fibre-optics probe, which was used to acquire the orange sample’s reflectance spectrum. When sampling, the vegetation probe was kept straight down and put in contact with the surface of the orange sample. The stem position, calyx position, equator position, and the position between equator and stem were sampled for each orange sample. Each sampling was repeated 10 times, with the average used as the sampling result. White board correction was conducted before each sampling.

2.3. E-nose Data Acquisition

A portable E-nose (PEN 3.5, AIRSENSE Inc., Schwerin, Germany) was used for the volatile feature sampling of orange samples. This E-nose is composed of a sensor array, a sampling and cleaning channel, and a data acquisition unit. The sensor array contains 10 metal oxide gas sensors that are sensitive to different type of volatiles. The features of each sensor are shown in Table 1.
Each orange sample was put in a 600 mL glass beaker, and sealed with a double-layer plastic film for 30 min. Before sampling, zero gas (room air that had been filtered through standard activated carbon) was pumped into the cleaning channel to reset the sensors. The operating parameters of the E-nose were set at a sampling interval of 1 s, flush time of 60 s, zero point trim time of 10 s, measurement time of 80 s, pre-sampling time of 5 s, and an injection flow of 300 mL/min.

2.4. TSS Measurement

The actual TSS of each orange was measured using a digital pocket refractometer (PAL-1, ATAGO co. Ltd., Tokyo, Japan). For refractometer measurement, each fruit was peeled, all the flesh was crushed and homogenized, and the juice was filtered through gauze. Two drops of juice were taken to measure the TSS. Each sample was tested three times, and the average was taken as the TSS for the orange sample. Before each testing, the refractometer was calibrated with distilled water to adjust the TSS reading to calibration. The average ± standard deviation, maximum value, and minimum value of the whole batch of oranges was 10.30 ± 1.05%, 14.7%, and 7.7%, respectively.

2.5. Data Analysis Method

In this research, Mutual information theory (MIT) [19] was applied to evaluate the correlation between sample feature and target output (TSS value). Partial least squares regression (PLSR) [20] and back propagation neural network (BPNN) [21] were applied to build the detection model and test the detection ability. Due to the complex network structure of BPNN, principal component analysis (PCA) [22] was needed to simplify and reduce the structure and dimensions of the input data before conducting BPNN. The introduction of MIT, PLSR, PCA, and BPNN were as follow.
MIT is usually used to evaluate the correlative degree between variables, and the correlation can be either linear or nonlinear. By conducting MIT, the amount of common information between variables can be represented by a mutual information (MI) value. The PLSR technique is based on multiple linear regression, which is a statistical method that bears some relation to principal components regression. Instead of finding hyperplanes of maximum variance between the response and independent variables, it finds a linear regression model by projecting the predicted variables and the observable variables to a new space. PCA is a multivariate technique that analyses a data table in which the observations are described by several inter-correlated quantitative dependent variables. The goal of PCA is to extract the important information from the table, to represent it as a set of new orthogonal variables called principal components to simplify the data structure and improve the analysis efficiency. BPNN is one of the most commonly used neural networks and includes input, hidden, and output layers. In the process of training a BPNN for analysis, the weights and threshold values of each layer are constantly revised. The BPNN adjusts the weights and threshold values repeatedly based on the differences between the expected outputs and actual outputs. Thus, a BPNN is a neural network that spreads information in the forward direction and returns the difference in the reverse direction. This training lasts until the difference between the expected outputs and actual outputs is reduced to a preset range or until the scheduled training times are achieved.
All the data analysis was performed by the software Matlab R2017a (MathWorks Inc., Natick, MA, USA). The PCA and BPNN were conducted by invoking the build-in toolbox, and the MIT and PLSR were conducted by self-programming due to no related build-in toolbox.

3. Results

3.1. VIS/NIR Spectrometer for TSS Detection of Orange

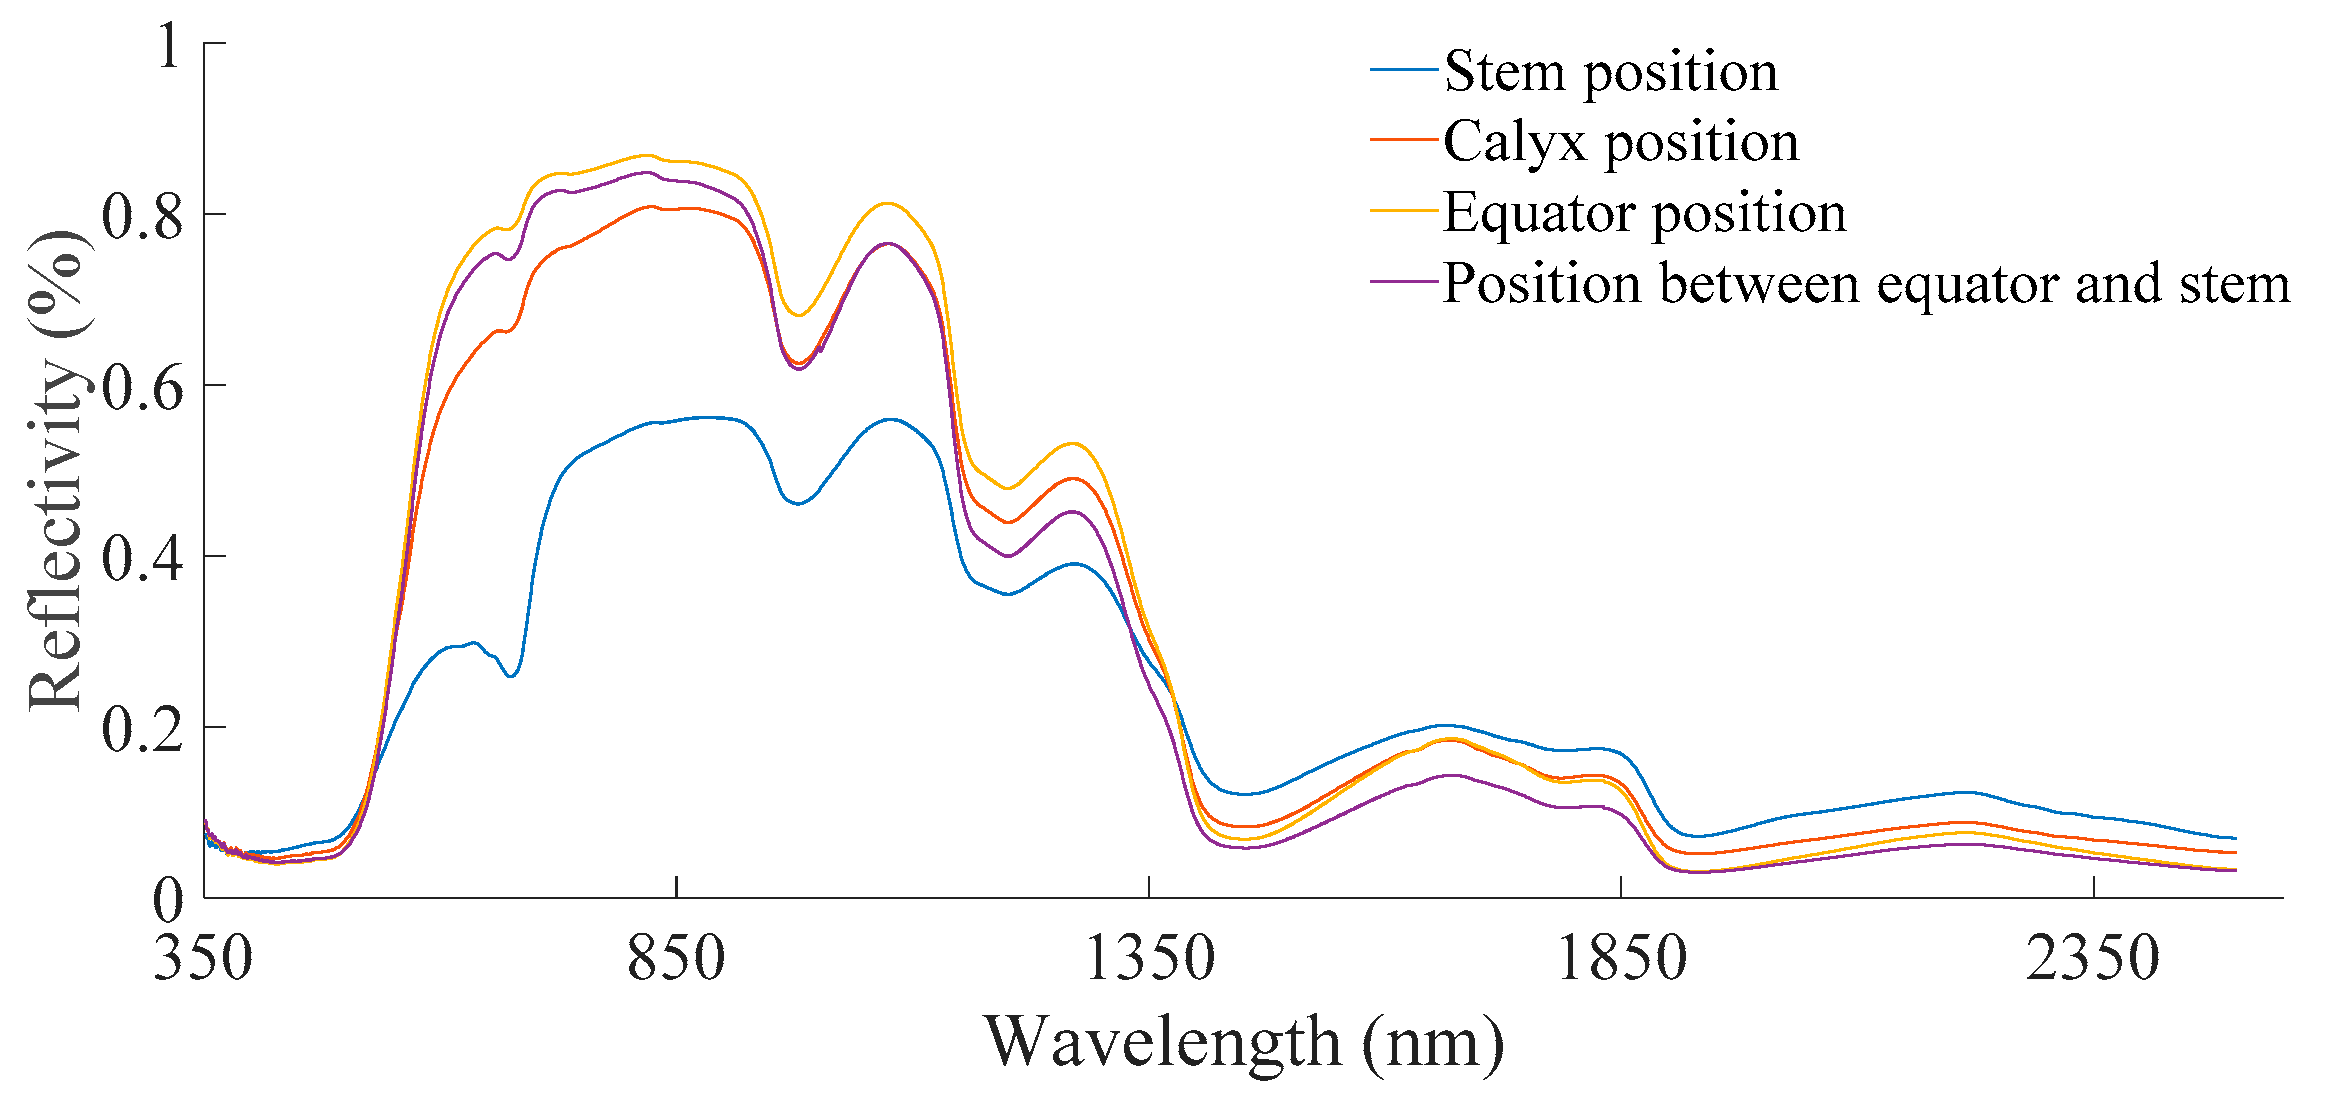
3.1.1. Sampling Position Comparison

To compare the influence of sampling positions of ‘Aiyuan 38’ orange on detection ability, four positions, namely the stem, calyx, equator, and between the equator and stem were tested in this study. The average spectral reflectivity of different sampling positions of orange are shown in Figure 1. The shape of the response curve for the stem position is obviously different from the other three positions due to the effect of stem. In addition, the absorption peak and reflectivity value for the stem position is obviously less than the other three sampling positions, that is, readings from the stem position acquire less spectrum information than readings from other positions do, which should therefore exclude methods which measure from the stem position. The shape of the response curves from the calyx position are slightly different with those from the equator position or the position between the equator and stem, especially on the curve slope from about 500 to 900 nm, due to the structure of calyx itself being relatively different from the surface at the equator or between the equator and stem. Further analysis is still needed to ensure the optimal detection position.
To further select the optimal sampling position, PLSR was applied to detect the TSS of orange based on full spectral data from different sampling positions. There were 117 orange samples in total, with 92 samples were randomly selected as a calibration set, and the remaining 25 samples forming the validation set. The same calibration and validation sets were used throughout the research to better compare the detection ability. For PLSR results, fitting the correlation coefficient (R2) is the key parameter in evaluating the correlation between the predicted value and the actual value. The range of R2 is from 0 to 1, where the greater the R2, the better the predictive ability. Besides, the root mean squared error (RMSE) and the slope are other subsidiary parameters for detection effect evaluation. The closer the RSME value is to 0, the better the prediction effect. And the closer the slope value is to 1, the better the prediction effect. The PLSR detection results of orange TSS based on full spectral data from stem, calyx, equator, and between the equator and stem positions are shown in Figure 2a–d, respectively. As can be seen, measuring from the calyx position results in better TSS detection ability than other sampling positions, with the R2, RMSE, and slope for calibration set of 0.9571, 0.2147, and 0.9571, respectively, for validation set of 0.5650, 0.7927, and 0.8348, respectively. Thus, the spectral data of calyx position was used for next TSS detection modeling.

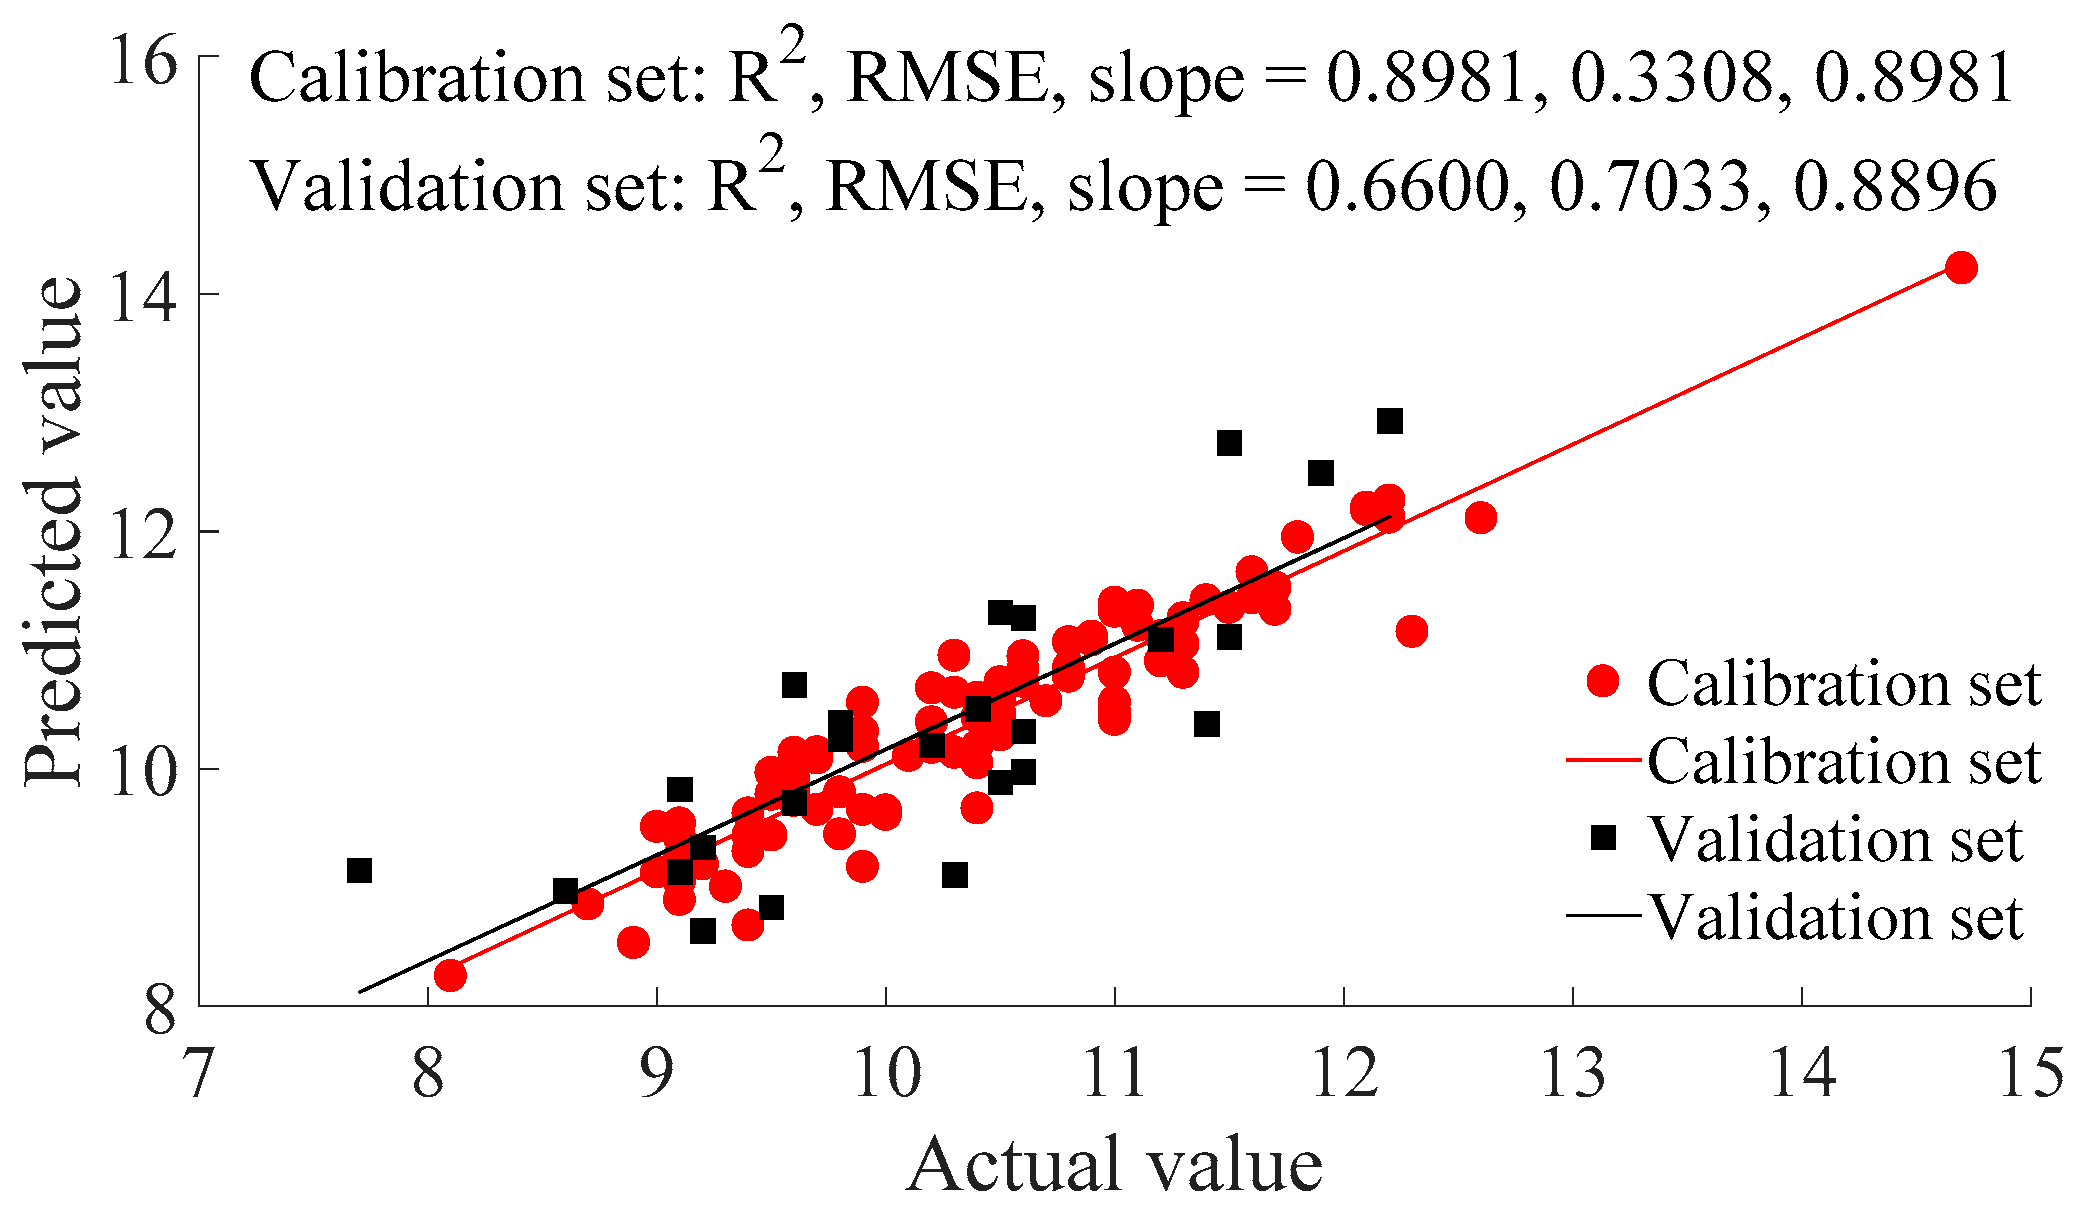
3.1.2. Spectral Data Processing

Data processing is a very important step to discern the differences among spectral sampling data, and different processing methods have their own advantages. To find an optimal data processing method, reference to previous researches of Zhang et al. [23] and Xie et al. [24], 16 data processing methods were applied for comparison in this research. They are first derivative, second derivative, square root, square root + first derivative, square root + second derivative, logarithm, logarithm + first derivative, logarithm + second derivative, reciprocal + logarithm, reciprocal + logarithm + first derivative, reciprocal + logarithm + second derivative, reciprocal, reciprocal + first derivative, reciprocal + second derivative, Savitzky-Golay, and multiplicative scatter correction. These 16 data processing methods were labeled as DP 1 to 16, respectively. After the data processing operations, PLSR was applied for orange TSS prediction to test the treatment effect of the different data processing methods. The PLSR detection results are shown in Table 2. Compared to the TSS detection result based on original spectral data (Figure 2b), Savitzky-Golay method (DP 15) can improve the detection accuracy the most, with an R2 for calibration and validation sets of 0.8991 and 0.6600, respectively.
The PLSR detection results based on Savitzky-Golay processed data are shown in Figure 3. Even though the orange TSS detection accuracy has been improved efficiently after Savitzky-Golay data processing, the accuracy is still not enough.

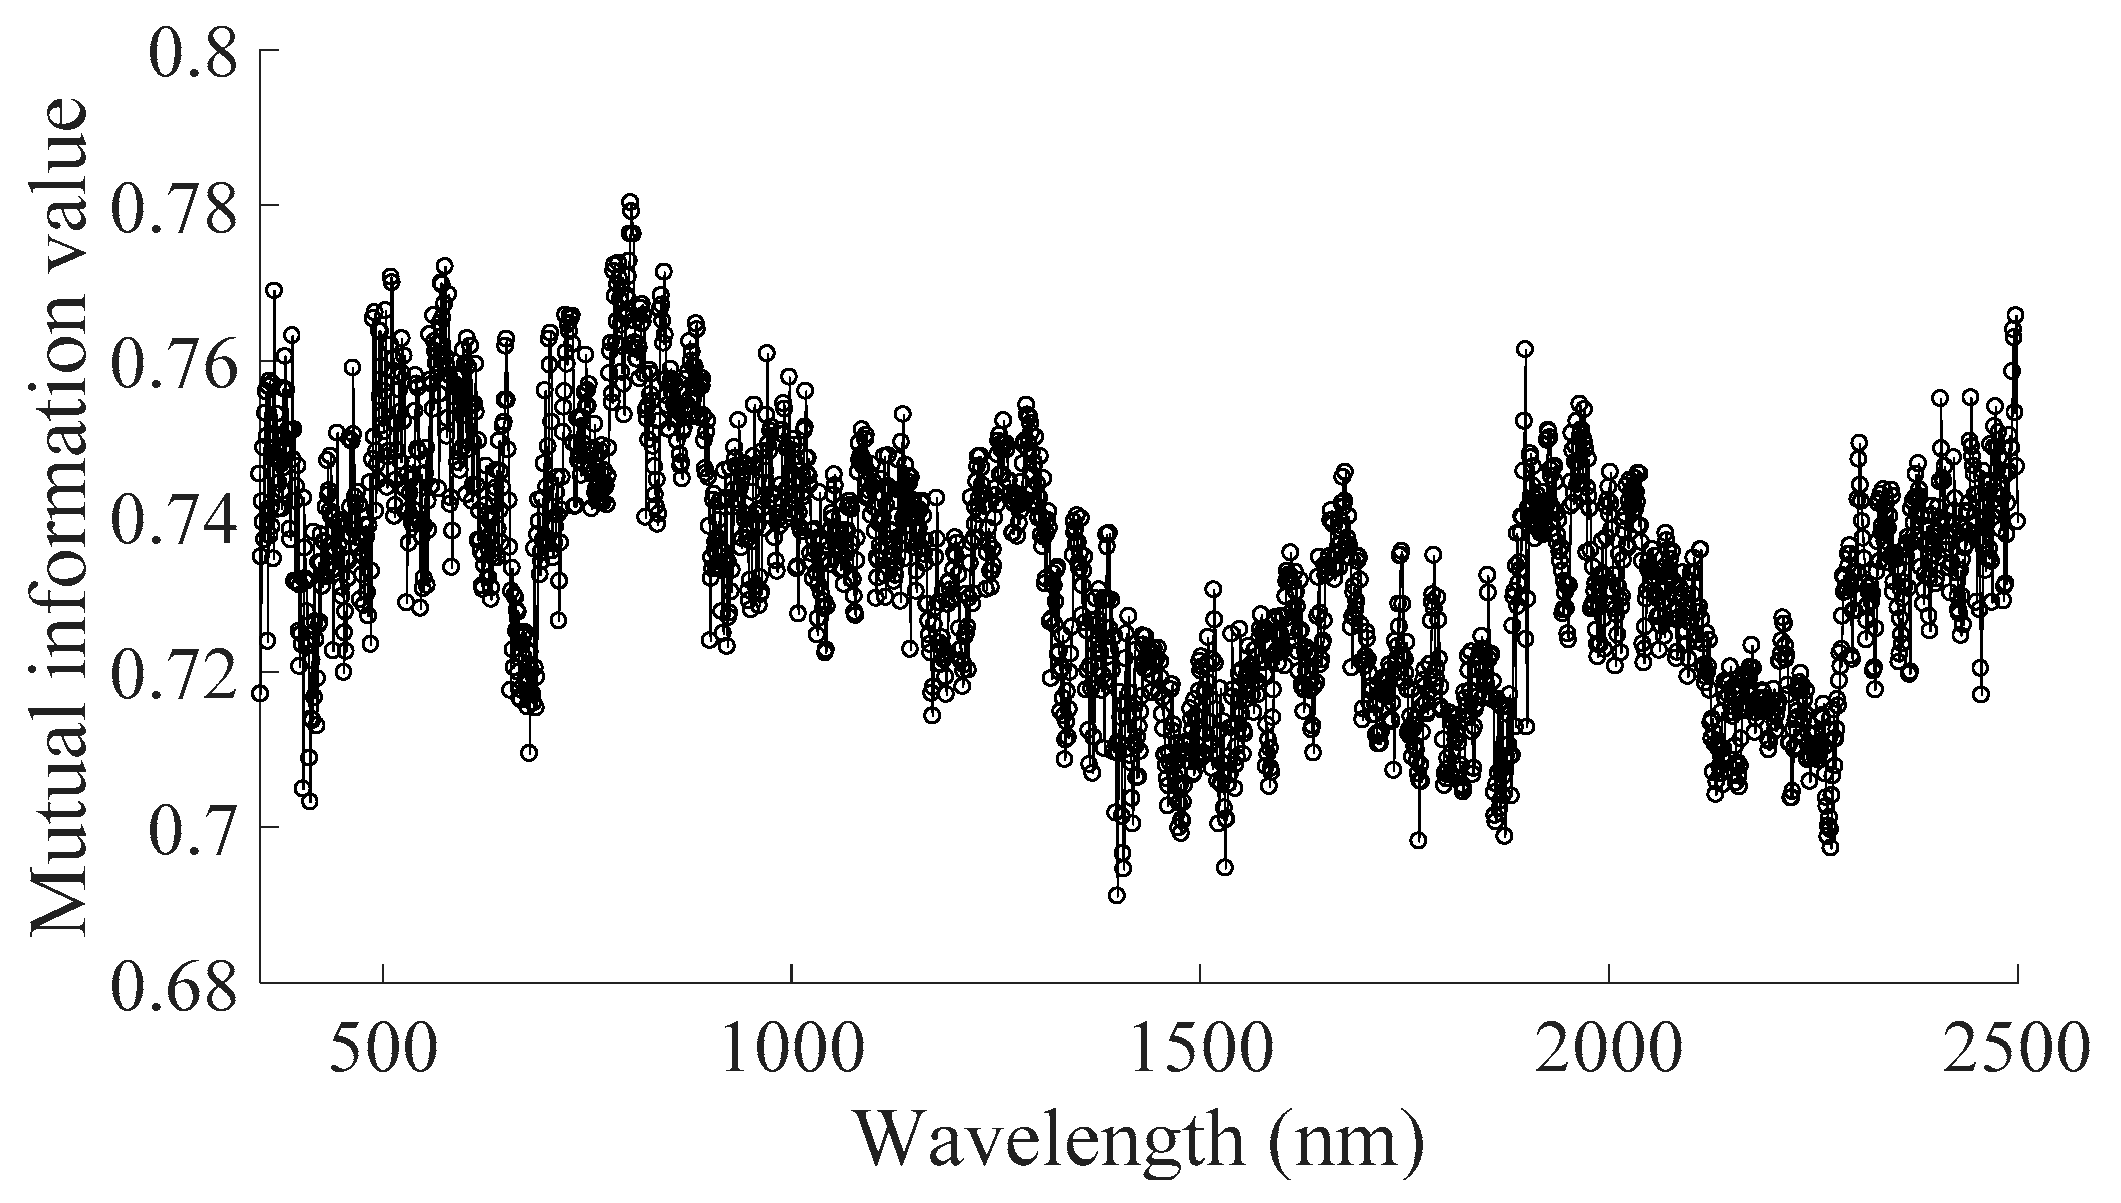
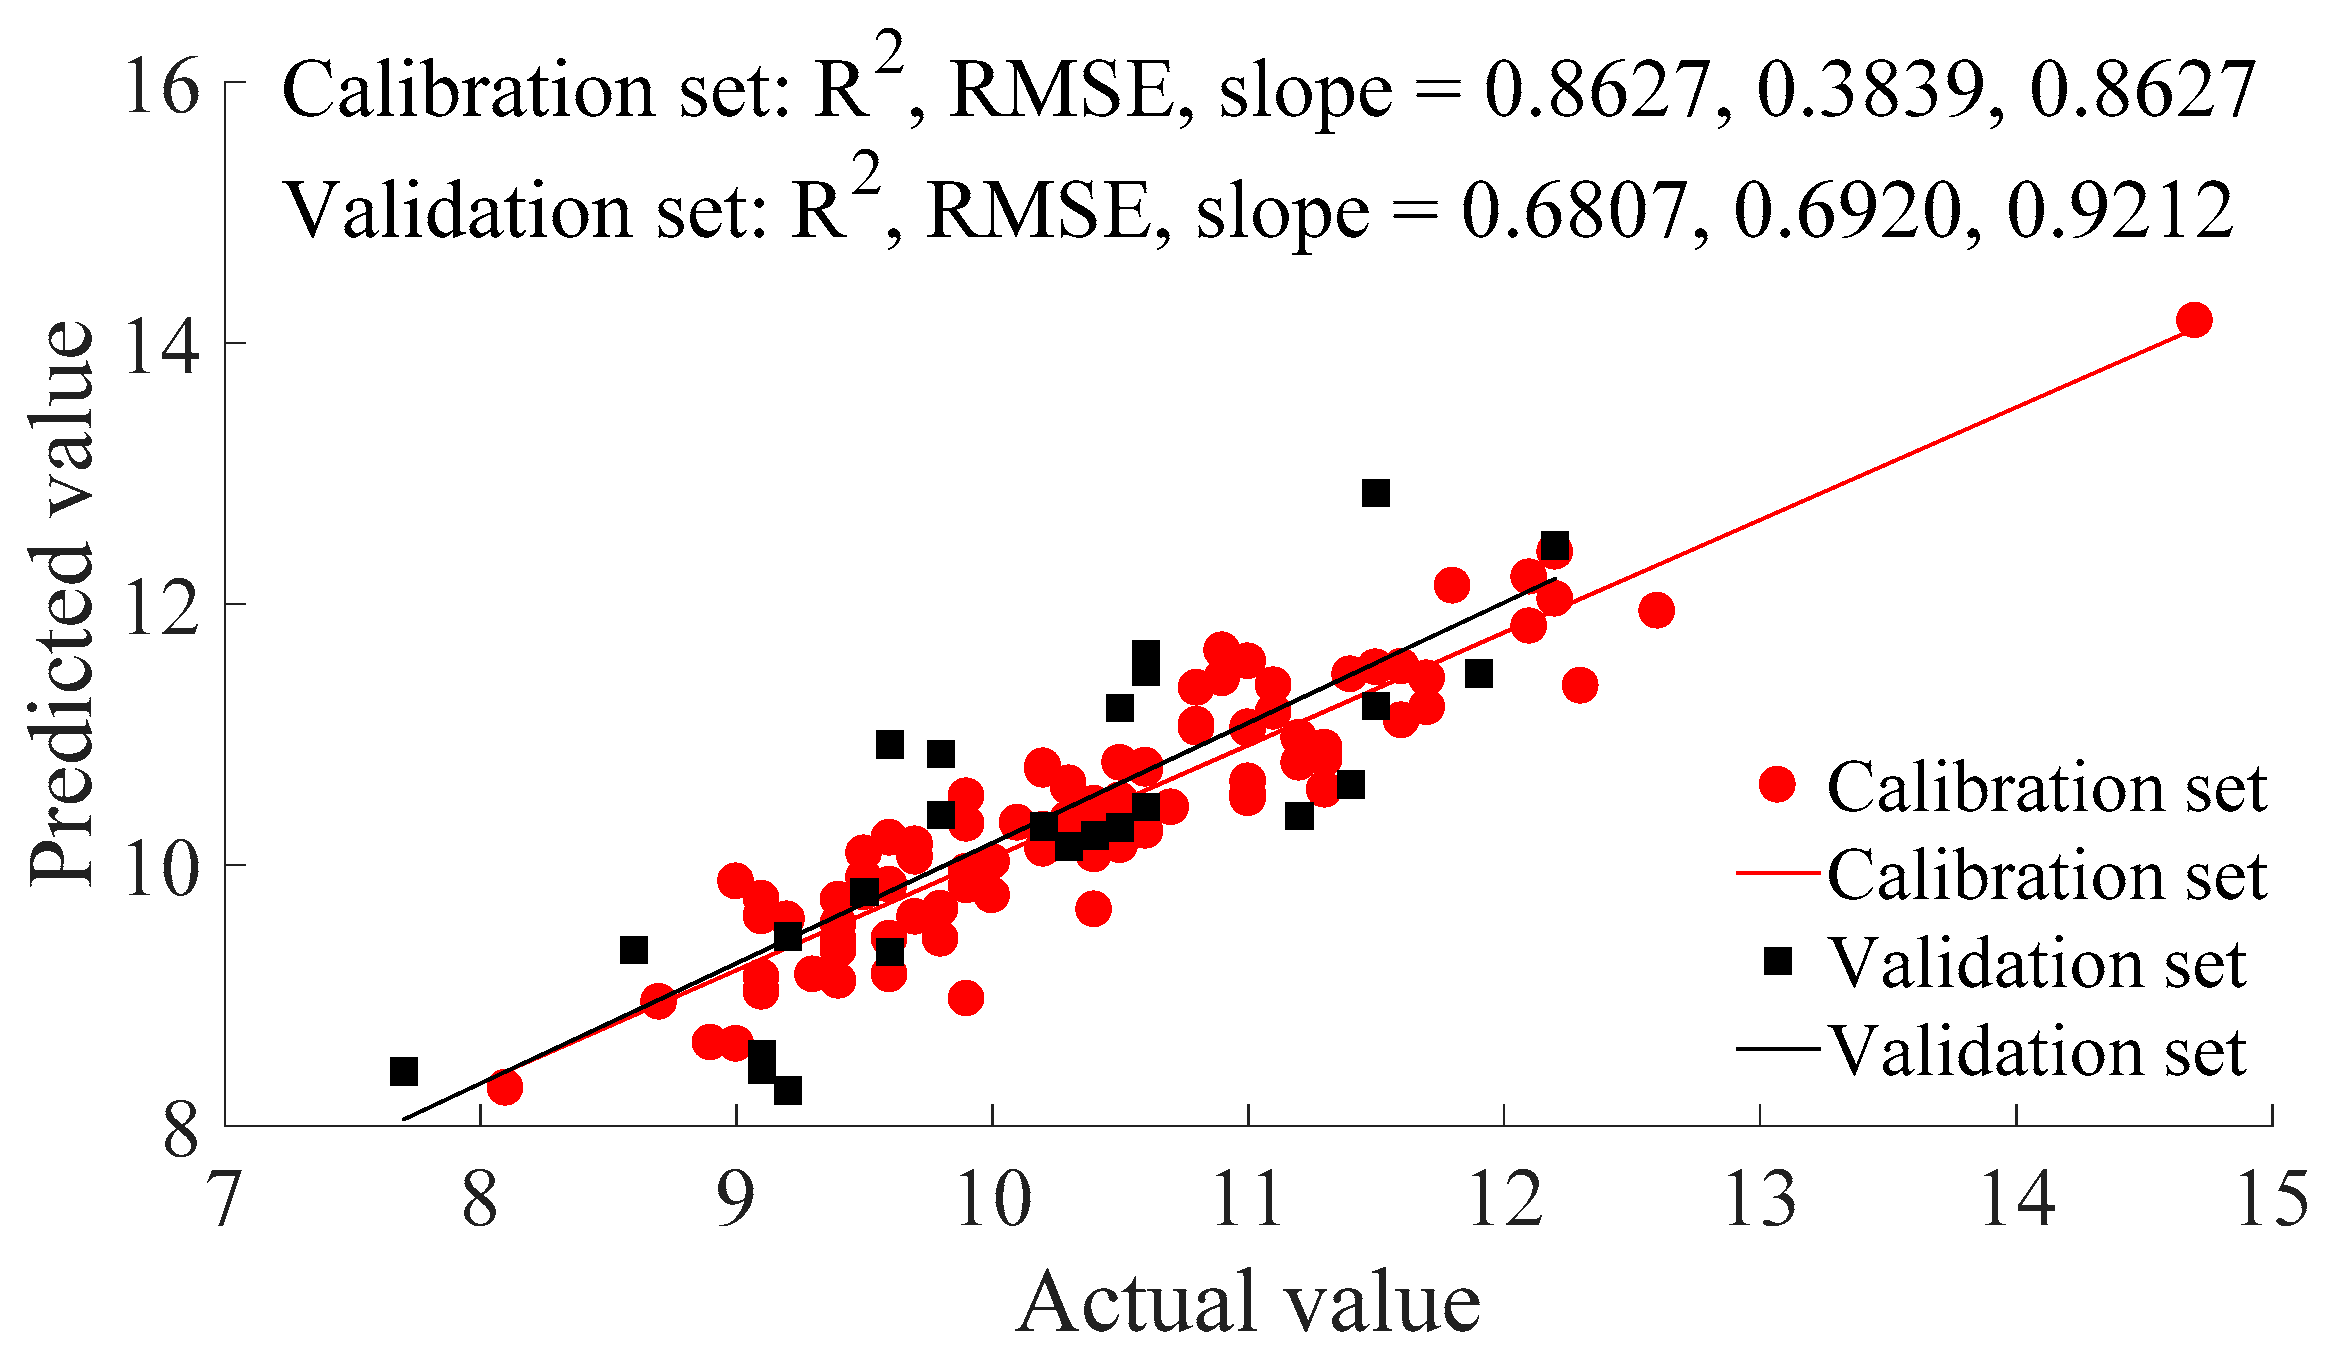
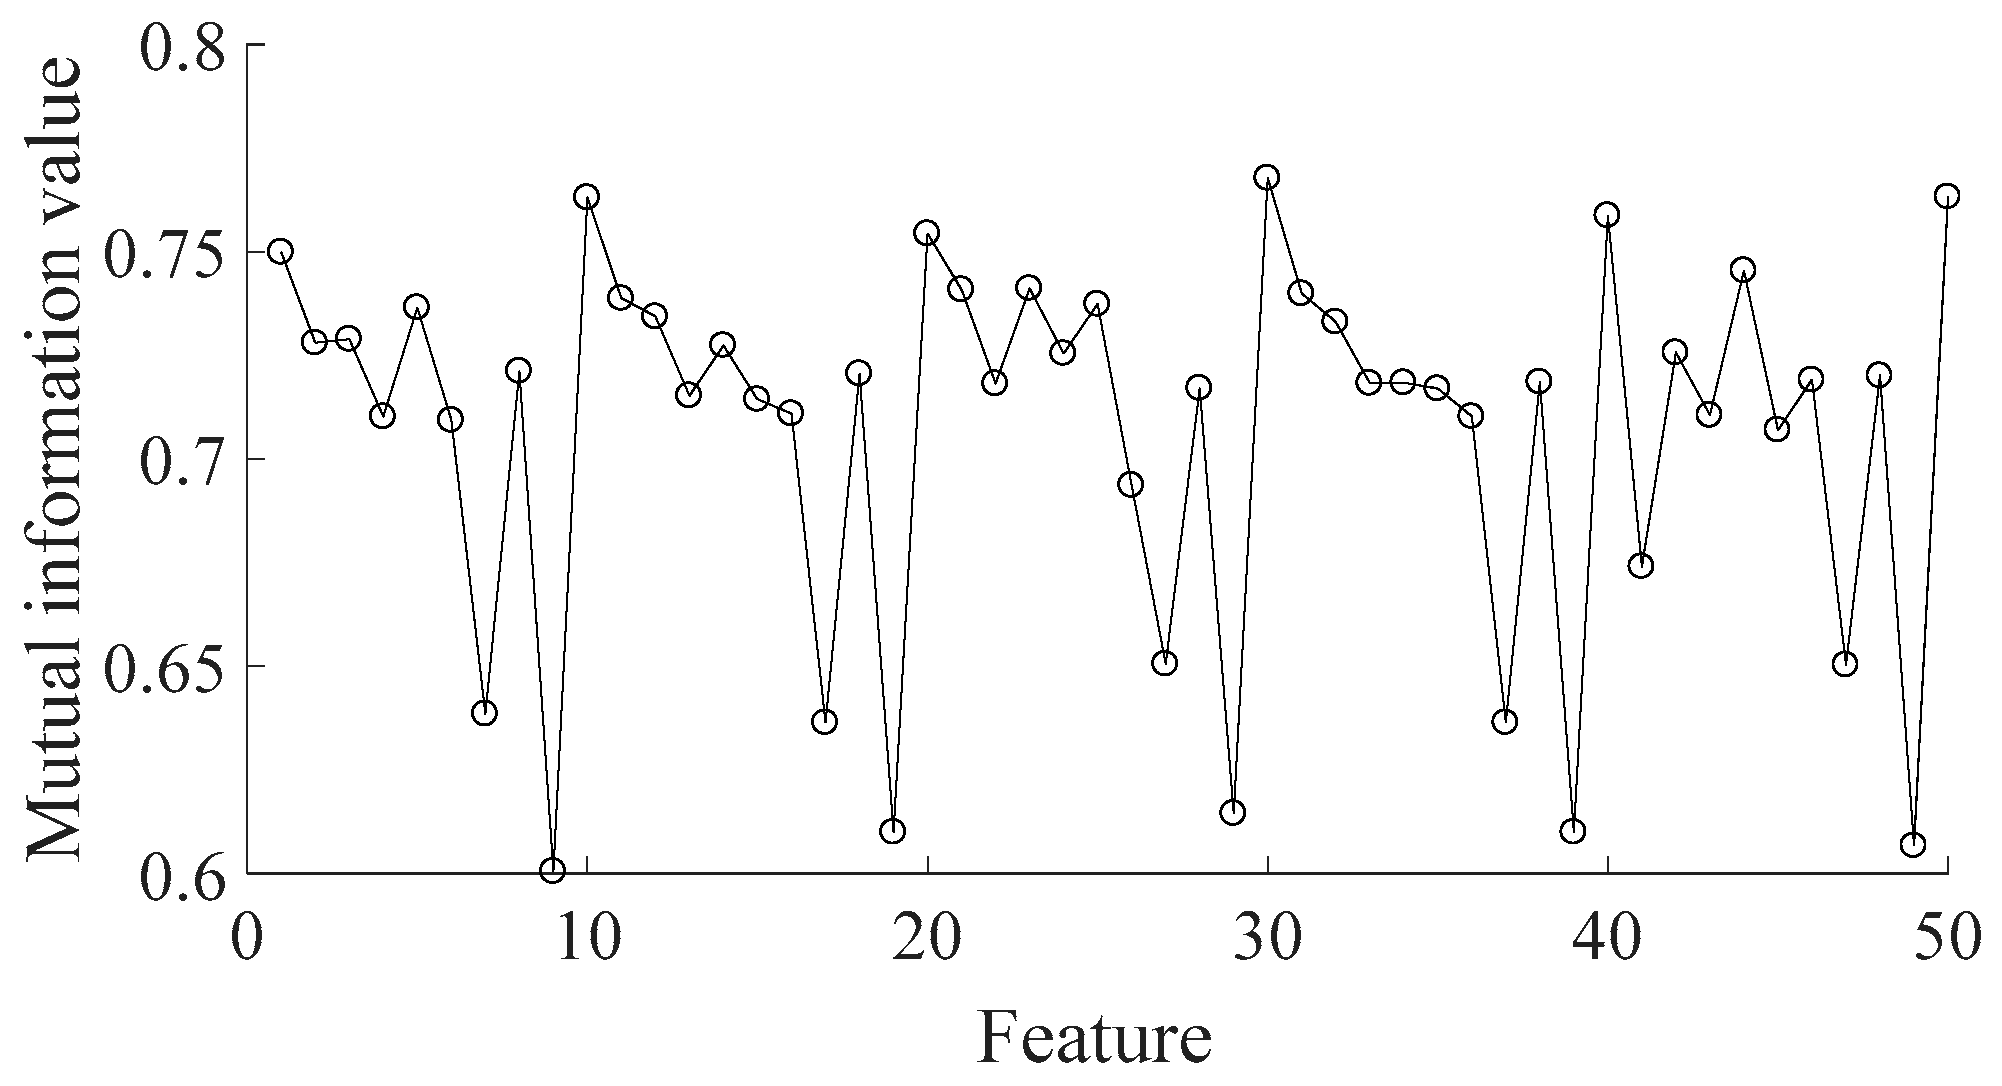
3.1.3. Feature Wavelength Extraction

Each spectrum of data has 2151 features (250–2500 nm). However, not all features are helpful in TSS detection modeling. Some low relation features can even interfere with the detection ability. It is necessary to eliminate non-useful features and keep useful features to improve the computation efficiency and accuracy. For this reason, MI was used to evaluate the correlation between each feature and the TSS value. The range of MI is 0 to 1. The larger the MI, the higher the correlation. MIs between features and TSS value are shown in Figure 4.
The range of MIs was from 0.6911 to 0.7803. In order to eliminate low correlation features to improve the detection ability, we successively deleted the features with corresponding MIs less than 0.70, 0.71, 0.72, 0.73, 0.74, 0.75, 0.76 and 0.77. The remaining features were used for PLSR modeling analysis, to check if the detection ability was better after feature elimination than ability before. The analysis results are shown in Table 3. In this table, the MI range means its corresponding features would be kept for PLSR analysis. The analysis results show that the R2cal (R2 of calibration set) barely changes during the MI larger than or equal to the range of 0.70 to 0.72, slightly decreases during the MI lager than or equal to the range from 0.73 to 0.74, significant decrease during the range of MI lager than 0.74. The R2val (R2 of validation set) increase gradually during the MI larger than or equal to the range of 0.70 to 0.74 but decrease gradually during the range of MI larger than 0.74. Thus, the optimal features should be extracted while the corresponding MIs larger than or equal to 0.74, and the feature number is decreased from 2151 to 736. Even though the R2val of PLSR detection based on whole feature slightly larger than that based on 736 features, that could be redundant information caused over fitting, since the corresponding R2val increased. The PLSR results of calibration and validation sets based on 736 features of Savitzky-Golay processed data were also shown in Figure 5.
As shown in Figure 5, the R2, RMSE, and slope for the calibration set of PLSR detection are 0.8627, 0.3839, and 0.8627, respectively, for the validation set of PLSR detection are and 0.6807, 0.6920, 0.9212, respectively. Thus, it is feasible to detect orange TSS based on based on VIS/NIR reflection spectrometer, however, the detection accuracy needs to be further improved.

3.2. E-nose for TSS Detection of Orange
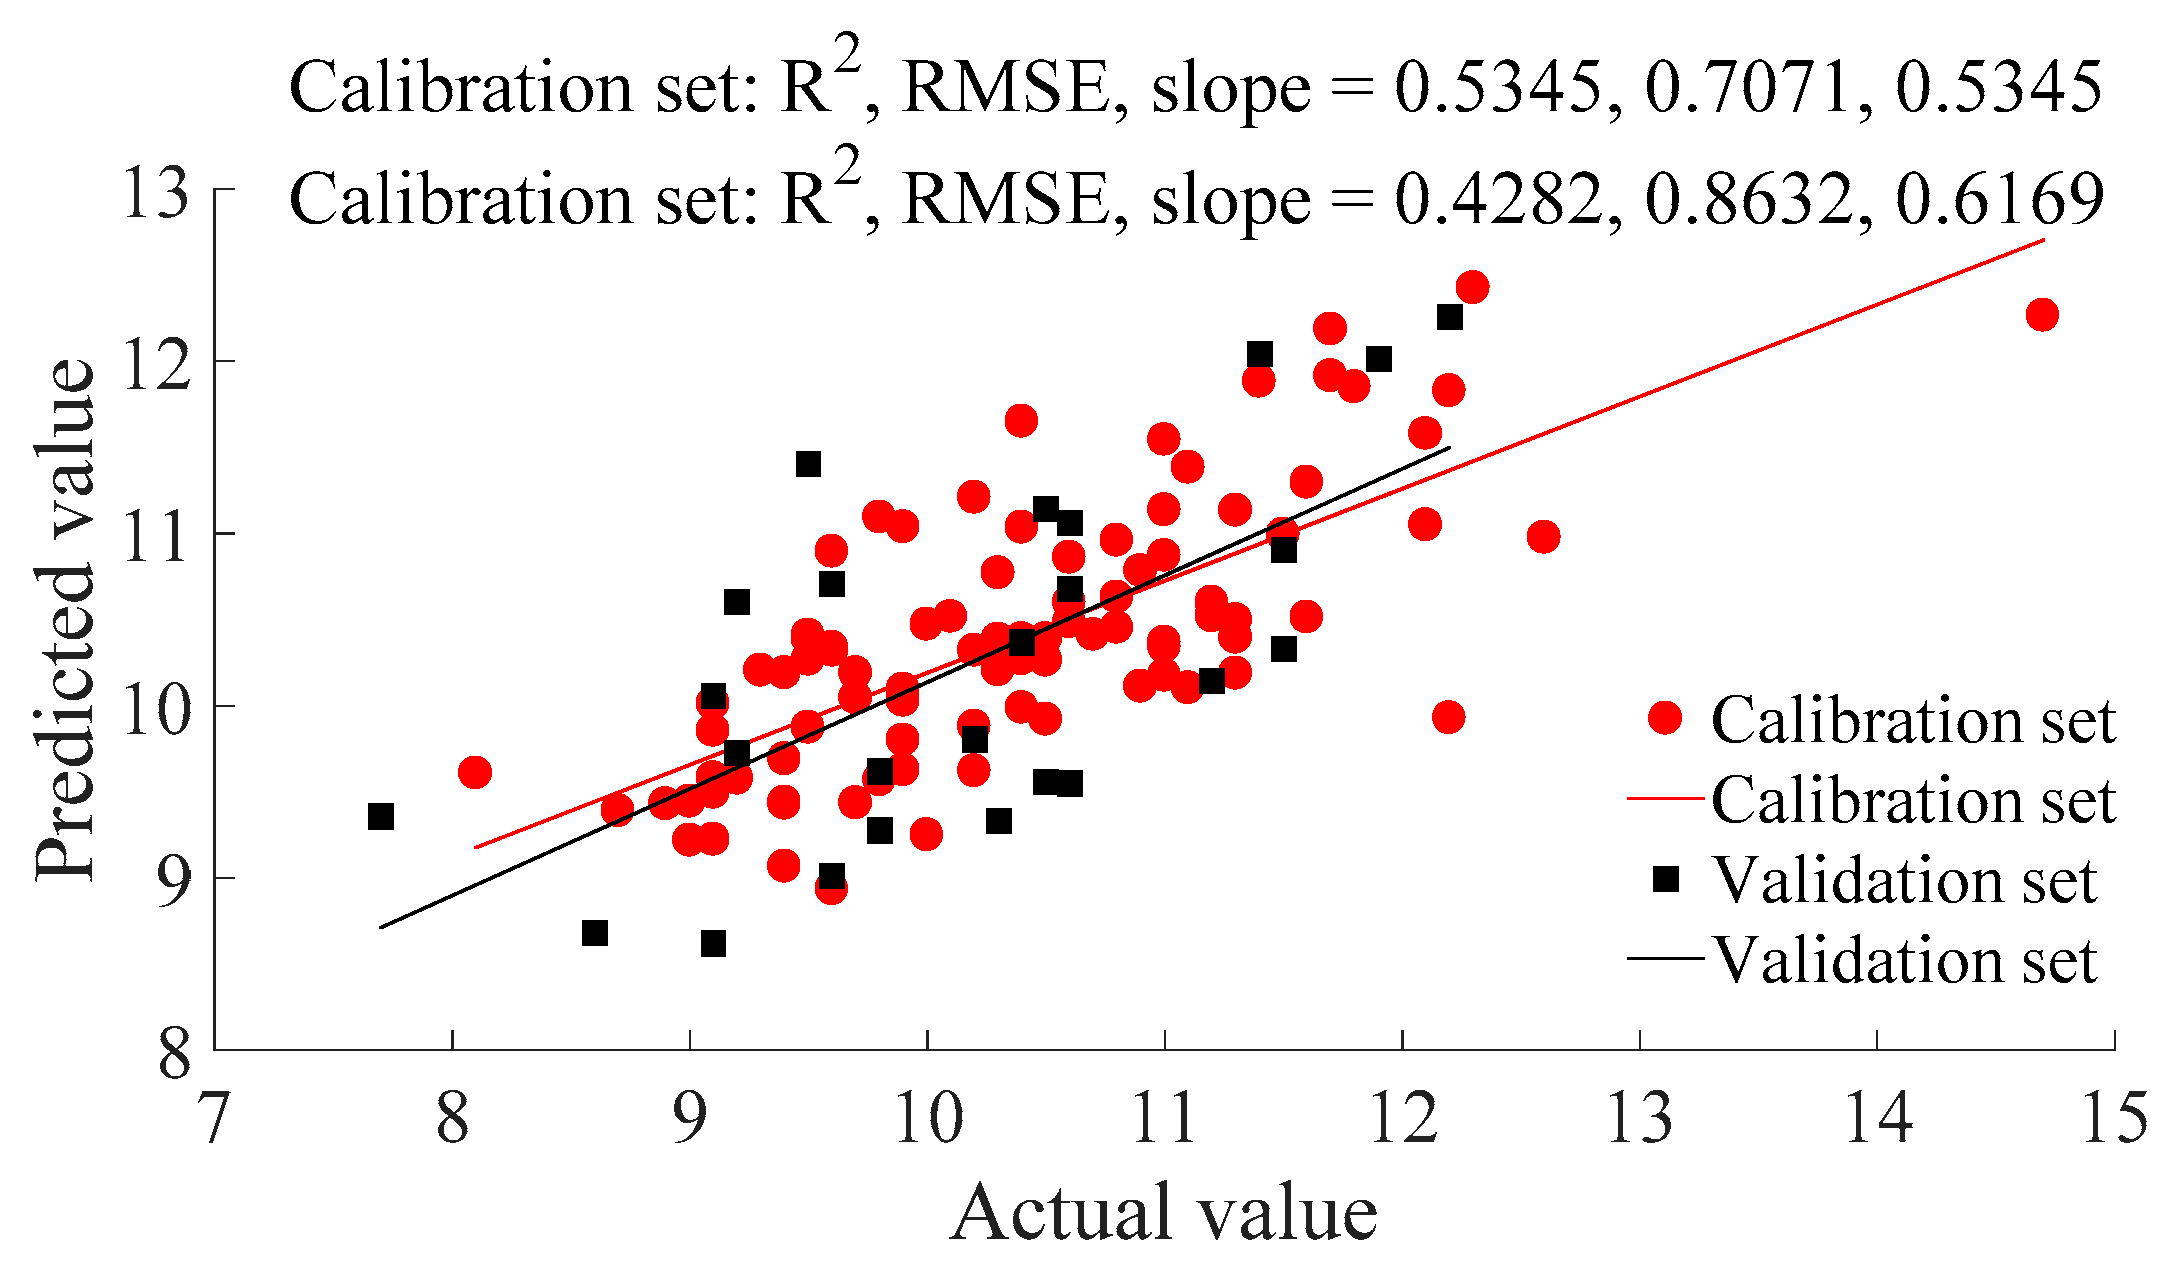
Feature Extraction

Another portable detection method (E-nose) was also applied to test the same orange samples. In accordance with previous research [25,26,27], 5 commonly used feature extraction methods (75 s value, average value, average of differential value, integral value, and maximum value) and combined feature were applied in this research. The 75 s value is the value of the E-nose response curve at 75 s for each sampling time. The average value is the average of a complete response value. The average of the differential value is the mean value of the differential of the E-nose response curve for each sampling time. The integral value is the area formed by the E-nose response curve and coordinate axis. The combined feature is the combination of the 5 commonly used feature extraction methods previously listed. The PLSR detection results of orange TSS based on E-nose analysis with different features is shown in Table 4. For PLSR results based on single features, the R2cals are less than R2vals. We can infer that results based on single features cannot provide enough information to guarantee the stability of detection accuracy. Thus, the error ratio of calibration set is higher than validation set, due to the sample number of calibration set being more than the validation set. However, the PLSR detection ability based on combined features is significantly superior to detection ability based on a single feature. The reason could be that the combined features cover more comprehensive information than a single feature.
The PLSR detection results of orange TSS based on E-nose with combined features is shown in Figure 6. The R2, RMSE, and slope of the calibration set of PLSR detection are 0.5345, 0.7071, 0.5345, respectively, of the validation set of PLSR detection are 0.4282, 0.8632, 0.6169, respectively. Thus, certain useful orange TSS detection information was contained in E-nose data, however, the improvement of orange TSS detection accuracy is needed.
To check the necessity of low relation feature elimination for E-nose data, which may further improve the detection ability of orange TSS, MI between E-nose features and TSS were also calculated. The calculation results are shown in Figure 7. Features 1–10 are the 75 s value of the 10 sensors’ responses, respectively; features 11–20 are the average value of the 10 sensors’ responses, respectively; features 21–30 are the average of the differential values of the 10 sensors’ responses, respectively; features 31–40 are the integral value of the 10 sensors’ responses, respectively, and features 41–50 are the max values of the 10 sensors’ responses, respectively. The MI curves of the 10 sensors are similar for different feature extraction methods. However, for each sensor, its MI value still has a certain difference when feature extraction method is changed. Thus, the correlation between feature and TSS is most influenced by sensor, more so than the feature extraction method. The range of MIs was from 0.6006 to 0.7678.
To further eliminate low correlation features in order to improve detection ability, we successively deleted the features for which their corresponding MIs were less than 0.61, 0.62, 0.63, 0.64, 0.65, 0.66, 0.67, 0.68, and 0.69, and the remaining features were used for PLSR modeling analysis to check if the detection ability would be better after elimination of low relation features than before. The R2s of PLSR modeling analysis are shown in Table 5. The MI range means its corresponding features would be kept for PLSR analysis. With the elimination of features, both R2cal and R2val decreased. That is, all E-nose features are helpful in orange TSS detection, all features should be kept in modeling work.

3.3. Orange TSS Detection by Fusion Data of VIS/NIR Spectrometer and E-nose

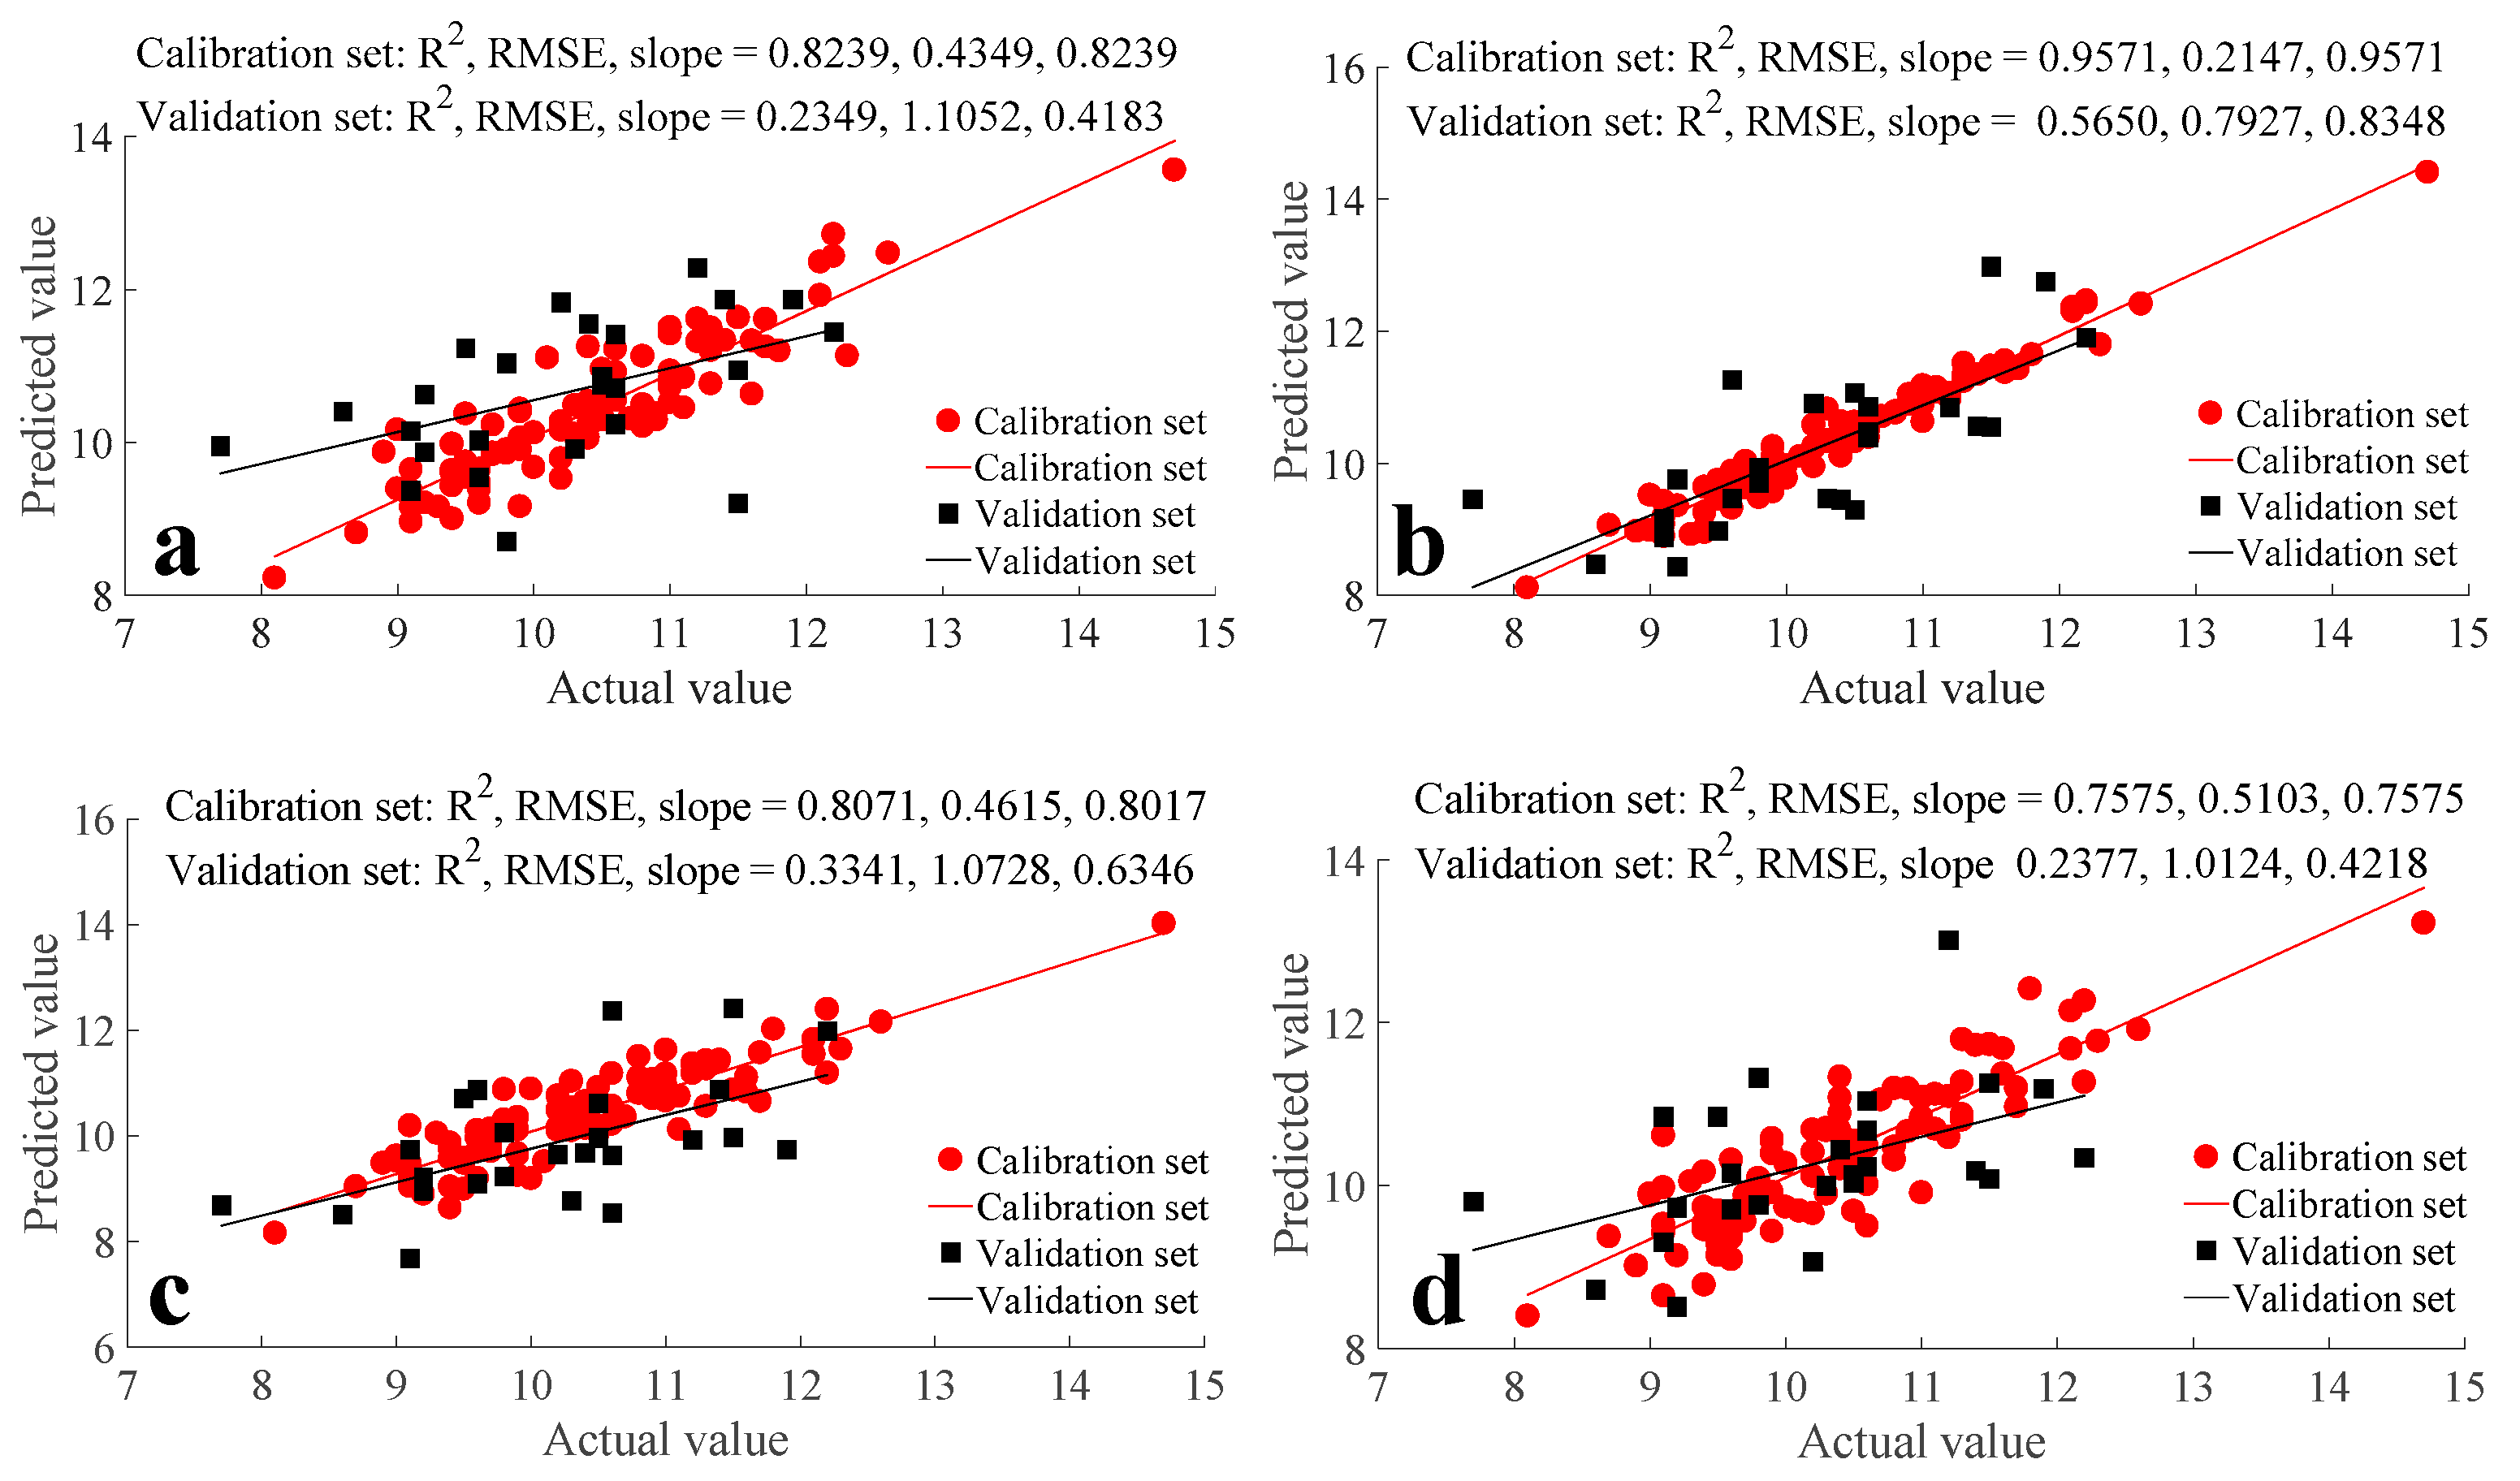
3.3.1. PLSR Detection

Even though both the reflection spectrometer and E-nose can nondestructively acquire orange TSS related information, the detection ability of those single detection methods are unsatisfactory. Multi-source information fusion methods have been reported that can efficiently improve detection accuracy and stability [28]. To further improve the detection accuracy of orange TSS, modeling work based on the reflection spectrometer and E-nose fusion data was researched. According to the research results above, we merged the 736 VIS/NIR spectrum features and combined E-nose features (50 features) for the fusion data. PLSR was applied to test the detection ability of orange TSS based on the fusion data, and the results are shown in Figure 8. The R2, RMSE, and slope for the calibration set of PLSR detection were 0.9466, 0.2395, and 0.9466, respectively, for the validation set of PLSR detection were 0.7516, 0.7804, 1.1072, respectively. Thus, the data fusion can significantly improve the detection accuracy of orange TSS compared to a single detection method.

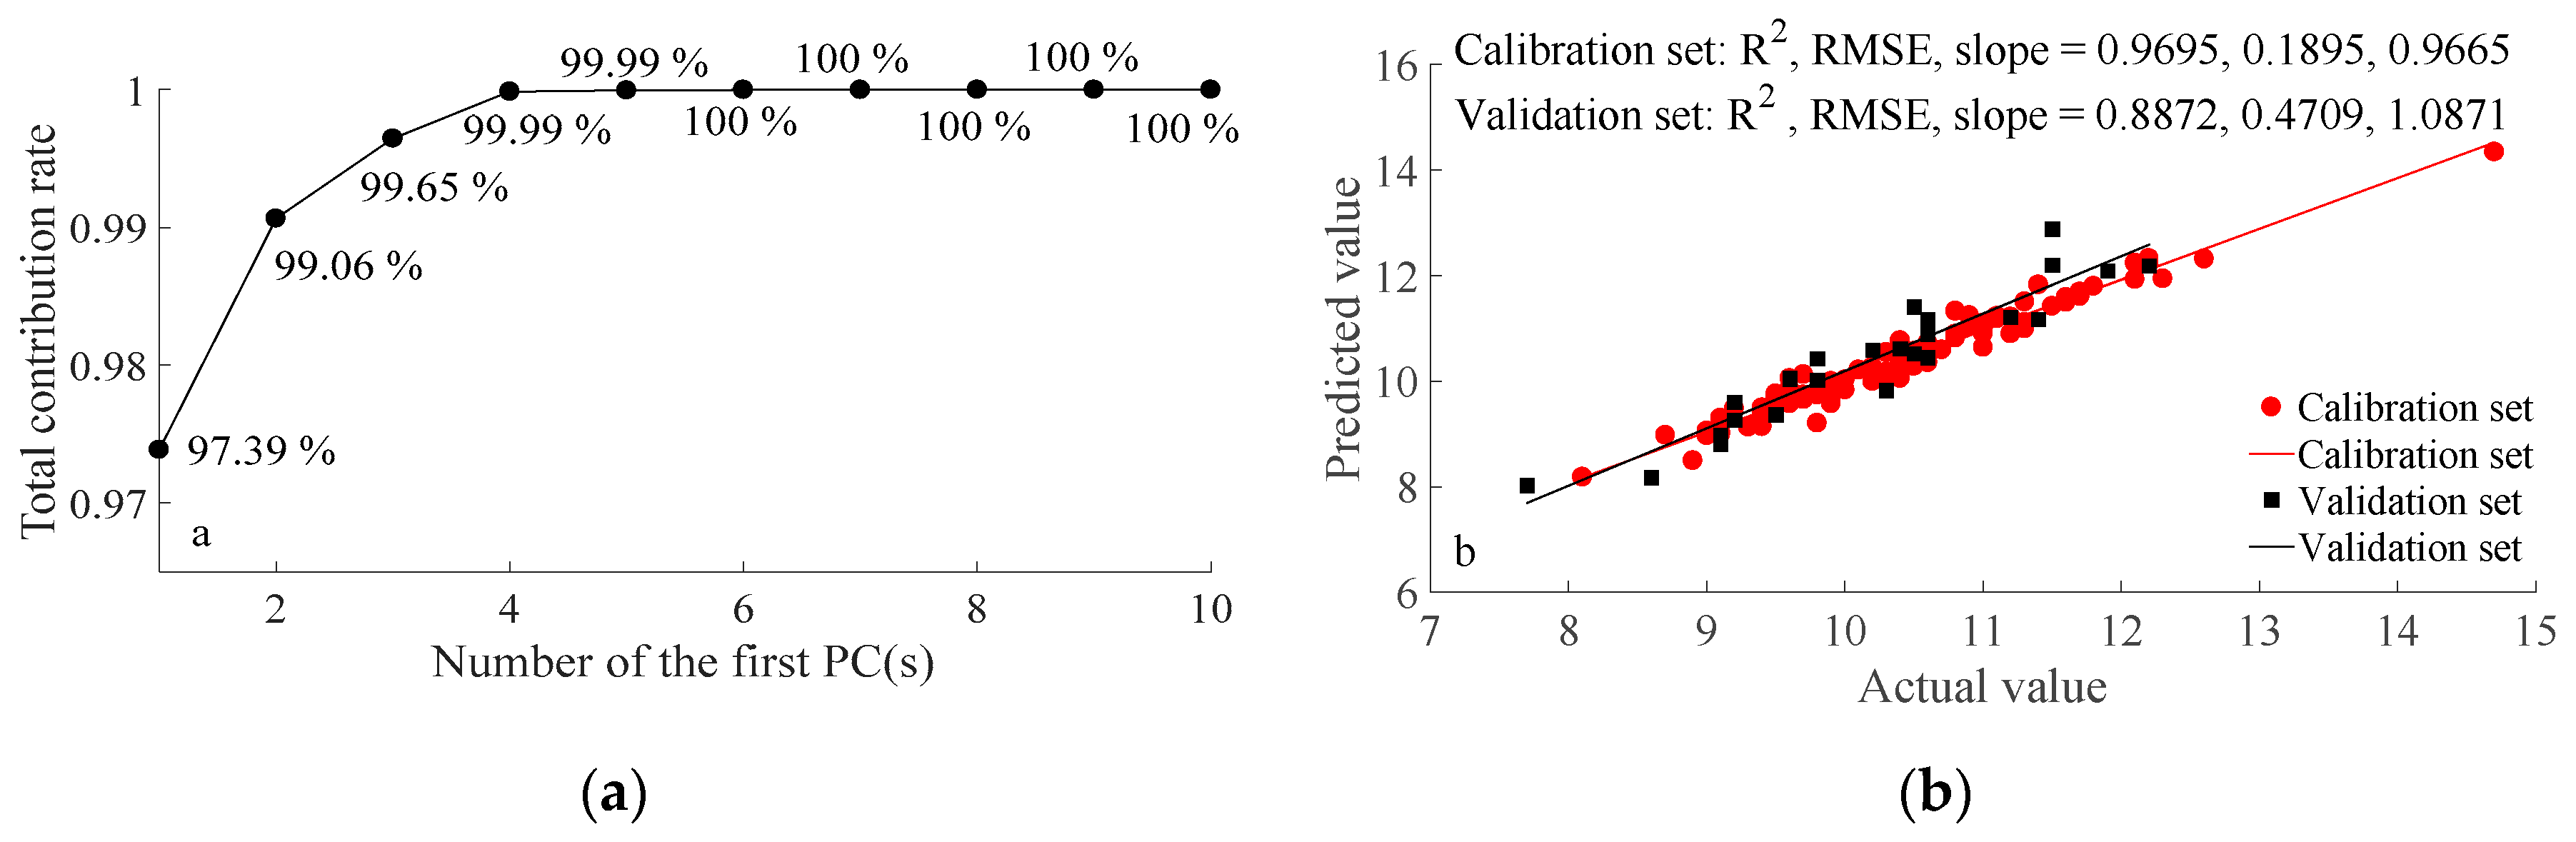
3.3.2. PCA-BPNN Detection

The BPNN was applied to further improve the detection accuracy of orange TSS based on fusion data. However, there were 786 features in total for the fusion data, which results in an input layer of 786 neurons, which in turn makes the computation burden beyond most of today’s computer. Thus, before BPNN operation, PCA was applied for dimensionality reduction of input data. As shown in Figure 9a, the total contribution of the first 6 principle components (PCs) almost reaches 100%. This means that the first 6 PCs contain the majority of the information from all 786 features which were used for the next BPNN modeling. After repeated training, the BPNN model parameters were as follows: the nerve cell number of the hidden layer was 21, the treatments utilized the BPNN “trainlm” training algorithm, the treatments had a BPNN hidden layer number of four, the BPNN output layers used the “tansig” function; and the BPNN iteration number and sampling frequency was 1000 and 25, respectively. The correlation coefficient (R2) also was applied to evaluate the correlation between the predicted value and actual value of BPNN detection. The PCA-BPNN detection results are shown in Figure 9b, the R2, RMSE, and slope from the calibration set for PCA-BPNN detection were 0.9695, 0.1895, and 0.9665, respectively, from the validation set for PCA-BPNN detection were 0.8872, 0.4709, and 1.0871, respectively. Thus, PCA-BPNN has good orange TSS detection ability based on fusion data.

4. Discussion

Jie et al. found that the calyx position is the optimal sampling position for detecting orange TSS based on VIS/NIR transmitted spectrometer [29]. This research further proved the calyx position is also the optimal sampling position for detecting orange TSS utilizing the VIS/NIR reflection spectrometer method.
The detection ability of orange TSS based on multi-source information fusion is better than using a single detection method (for either VIS/NIR reflection spectrometer or E-nose) confirming other reports [30]. However, to achieve the optimal detection ability using multi-source information fusion, it is important to retain useful information while eliminating feature information with low correlation. Thus, this research further provided a feature extraction method for VIS/NIR reflection spectrometer and E-nose, respectively, in orange TSS detection based on fusion data.
In this research, BPNN has a better ability than PLSR for orange TSS detection. That BPNN has better detection ability than PLSR has previously been shown for other parameters as well [31,32]. The optimal prediction function for PLSR involved minimizing the quadratic sum of error. This not only solves linear problems, but also some simple non-linear problems. BPNN is a nonlinear classification method that can achieve arbitrary nonlinear mapping from input to output, and displays good performance when applied to functional mapping, functional approximation and self-adaption. Thus, BPNN is better than PLSR for nonlinear problems, such as orange TSS detection. However, the model structure of PLSR is much simpler than BPNN, thus, PLSR is the optimal option if the detection ability is similar.
With the development of integrated technology, portable handheld reflection spectrometers and E-noses have been produced, such as the PAL-HIKARi 3 reflection spectrometer (ATAGO co. Ltd., Tokyo, Japan) with a size and weight of 6.1 × 6.4 × 11.5 cm and 0.053 kg and the Cyranose 230 E-nose (Cyrano Sciences inc., Pasadena, CA, USA) with a size and weight of 10 × 22 × 5 cm and 0.9 kg. These research results provide reference to the data analysis section.

5. Conclusions

This research used a VIS/NIR reflection spectrometer and an E-nose to develop a method to improve the accuracy of nondestructive and portable orange TSS detection, as the detection ability of single detection methods (VIS/NIR reflection spectrometer or E-nose alone) is currently unsatisfactory. For orange reflection spectrum information acquisition, data should be collected from the calyx position, then processed by Savitzky–Golay followed by extraction of 763 features (with MIs between feature and TSS value larger than 0.74). For orange E-nose information acquisition, the combined feature (the combination of 75 s value, average value, average of differential value, integral value, and maximum value) should be extracted. PCA-BPNN modeling based on fusion data of spectrum and E-nose information provides the optimal orange detection method for efficiently detecting orange TSS. The results of this experiment provide for a portable and nondestructive method for orange TSS detection with improved accuracy, which is important for the quick and nondestructive acquisition of accurate orange internal quality characteristics, particularly in the orchard or market. In addition, these experimental results provide a reference for the portable and nondestructive detection of other fruit when the ability of a single detection method is unsatisfactory.

Author Contributions

H.L. designed the reported study, evaluated the results, prepared and reviewed the manuscript. Q.Z. helped S.X. in the experimental setup and to conduct the experiments. S.X. is responsible for the entire experiment, analyzed the results, and prepared the manuscript. C.F. helped to analyze the experimental data and revised the manuscript. All authors both read and approved the manuscript.

Funding

The authors thank the Guangzhou Science and Technology Planning Program (201904010199), National Natural Science Foundation of China (31901404), Research and Development Program in Key Areas of Guangdong province (2018B0202240001), New Developing Subject Construction Program of Guangdong Academy of Agricultural Science (Project No. 201802XX), the Presidential Foundation of Guangdong Academy of Agricultural Science (Project No. 201920), and the Special Fund of Guangdong Academy of Agricultural Science for Scientific and Technological Talents Introduction/Cultivation.

Conflicts of Interest

The authors declare no conflict of interest.

References

  1. Magwaza, L.S.; Opara, U.L. Analytical methods for determination of sugars and sweetness of horticultural products—A review. Sci. Hortic Amst. 2015, 184, 179–192. [Google Scholar] [CrossRef]
  2. Ncama, K.; Opara, U.L.; Tesfay, S.Z.; Fawole, O.A.; Magwaza, L.S. Application of Vis/NIR spectroscopy for predicting sweetness and flavour parameters of ‘Valencia’ orange (Citrus sinensis) and ‘Star Ruby’ grapefruit (Citrus x paradisi Macfad). J. Food Eng. 2017, 193, 86–94. [Google Scholar] [CrossRef]
  3. Esti, M.; Cinquanta, L.; Sinesio, F.; Moneta, E.; Di Matteo, M. Physicochemical and sensory fruit characteristics of two sweet cherry cultivars after cool storage. Food Chem. 2002, 76, 399–405. [Google Scholar] [CrossRef]
  4. Janssens, P.; Odeurs, W.; Elsen, A.; Verjans, W.; Deckers, T.; Bylemans, D.; Vandendriessche, H. Relations between taste quality of ‘conference’ pear and mineral contents in fruit, leaf and soil. Acta Hortic. 2015, 1094, 333–340. [Google Scholar] [CrossRef]
  5. Shao, Y.; Bao, Y.; He, Y. Visible/Near-Infrared Spectra for Linear and Nonlinear Calibrations: A Case to Predict Soluble Solids Contents and pH Value in Peach. Food Bioprocess Technol. 2011, 4, 1376–1383. [Google Scholar] [CrossRef]
  6. Choi, C.H.; Lee, K.J.; Park, B. Prediction of soluble solid and firmness in apple by visible/near-infrared spectroscopy. J. Biosyst. Eng. 1997, 22, 256–265. [Google Scholar]
  7. Liu, Y.; Ji, L.; Chen, X.; Ying, Y. Rapid assessment of soluble solids content in navel orange by near infrared diffuse reflectance spectra. Spectrosc. Spectr. Anal. 2007, 27, 2190. [Google Scholar]
  8. Jie, D.; Xie, L.; Rao, X.; Ying, Y. Improving accuracy of prediction model for soluble solids content of watermelon by variable selection based on near-infrared spectroscopy. Trans. Chin. Soc. Agric. Eng. 2013, 29, 264–270. [Google Scholar]
  9. Zhang, S.; Zhang, H.; Wang, F.; Zhao, C.; Yang, G. Measurement of soluble solid content in persimmon using visible-near infrared spectroscopy. Trans. Chin. Soc. Agric. Eng. 2009, 25, 345–347. [Google Scholar]
  10. Jie, D.; Xie, L.; Rao, X.; Ying, Y. Using visible and near infrared diffuse transmittance technique to predict soluble solids content of watermelon in an on-line detection system. Postharvest Biol. Technol. 2014, 90, 1–6. [Google Scholar] [CrossRef]
  11. Shaguyimier, M. Establishment of Near Infrared Spectroscopy for Jun Jujube Sugar of Different Mature Period. Anhui Agric. Sci. Bull. 2017, 23, 143–144. [Google Scholar]
  12. Na, L.I.; Yang, X.X.; Dai, S.M.; Rong-Hua, L.I.; Jiang, H.; Luo, Y.X.; Gentile, A.; Deng, Z.N. Establishment of Non-Destructive System for Fruit Quality Grading of ‘Bingtang’ Sweet Orange and Its Application on Packing Line. Sci. Agric. Sin. 2016, 49, 132–141. [Google Scholar]
  13. Cheng, P.F.; Zhang, L.; Hui-Shan, L.U.; Yan, H.W.; Gao, Q.; Wang, F.J. Determination of Valencia Orange Sugar Concentration by Near-infrared Diffuse Reflectance. Hubei Agric. Sci. 2014, 2639–2641. [Google Scholar]
  14. Ramírez, H.L.; Soriano, A.; Gómez, S.; Iranzo, J.U.; Briones, A.I. Evaluation of the Food Sniffer electronic nose for assessing the shelf life of fresh pork meat compared to physicochemical measurements of meat quality. Eur. Food Res. Technol. 2018, 244, 1047–1055. [Google Scholar] [CrossRef]
  15. Lubinska-Szczygeł, M.; Pudlak, D.; Dymerski, T.; Namieśnik, J. Rapid assessment of the authenticity of limequat fruit using the electronic nose and gas chromatography coupled with mass spectrometry. Mon. Chem. Chem. Mon. 2018, 149, 1–10. [Google Scholar] [CrossRef]
  16. Plotto, A.; Ducamp, M.N.; Lebrun, M.; Goodner, K.; Baldwin, E. Discrimination of mango fruit maturity by volatiles using the electronic nose and gas chromatography. Postharvest Biol. Technol. 2008, 48, 122–131. [Google Scholar]
  17. Wei, Z.; Pan, L.; Zhao, X.; Kang, T. A Study on Soluble Solids Content Assessment Using Electronic Nose: Persimmon Fruit Picked on Different Dates. Int. J. Food Prop. 2016, 19, 53–62. [Google Scholar]
  18. Qiu, S.; Wang, J.; Gao, L. Discrimination and characterization of strawberry juice based on electronic nose and tongue: Comparison of different juice processing approaches by LDA, PLSR, RF, and SVM. J. Agric. Food Chem. 2014, 62, 6426. [Google Scholar] [CrossRef]
  19. Yang, Z.R.; Zwolinski, M. Mutual information theory for adaptive mixture models. IEEE Trans. PAMI 2001, 23, 396–403. [Google Scholar] [CrossRef]
  20. Nanni, M.R.; Cezar, E.; Junior, C.A.D.S.; Silva, G.F.C.; Gualberto, A.A.D.S. Partial least squares regression (PLSR) associated with spectral response to predict soil attributes in transitional lithologies. Arch. Agron. Soil Sci. 2017, 64, 682–695. [Google Scholar] [CrossRef]
  21. Zhang, H.; Chang, M.; Wang, J.; Sheng, Y.E. Evaluation of peach quality indices using an electronic nose by MLR, QPST and BP network. Sens. Actuators B Chem. 2008, 134, 332–338. [Google Scholar] [CrossRef]
  22. Cheng, H.; Qin, Z.H.; Guo, X.F.; Hu, X.S.; Wu, J.H. Geographical origin identification of propolis using GC–MS and electronic nose combined with principal component analysis. Food Res. Int. 2013, 51, 813–822. [Google Scholar] [CrossRef]
  23. Zhang, X.; Zhang, F.; Zhang, H.; Li, Z.; Hai, Q.; Chen, L. Optimization of soil salt inversion model based on spectral transformation from hyperspectral index. Trans. Chin. Soc. Agric. Eng. 2018, 34, 184–194. [Google Scholar]
  24. Xia, J. Effect of Different Pretreatment Method of Nondestructive Measure Vitamin C Content of Umbilical Orange with Near-infrared Spectroscopy. Trans. Chin. Soc. Agric. Mach. 2007, 38, 107–111. [Google Scholar]
  25. Wei, Z.; Wang, J.; Zhang, W. Detecting internal quality of peanuts during storage using electronic nose responses combined with physicochemical methods. Food Chem. 2015, 177, 89–96. [Google Scholar] [CrossRef] [PubMed]
  26. Yu, H.; Wang, J. Discrimination of LongJing green-tea grade by electronic nose. Sens. Actuators B Chem. 2007, 122, 134–140. [Google Scholar] [CrossRef]
  27. Chen, Z.; Zhao, W. Detection of Biluochun Green Tea Quality Grade by Using an Electronic Nose. J. Agric. Mech. Res. 2012, 34, 133–137. [Google Scholar]
  28. Lu, C.; Wang, S.; Wang, X. A multi-source information fusion fault diagnosis for aviation hydraulic pump based on the new evidence similarity distance. Aerosp. Sci. Technol. 2017, 71, 392–401. [Google Scholar] [CrossRef]
  29. Jie, D.F.; Yang, J.; Peng, Y.X.; Lian, Y.X.; Zhang, D.; University, H.A. Research on the detection model of sugar content in different position of citrus based on the hyperspectral technology. Food Mach. 2017, 33, 51–54. [Google Scholar]
  30. Huang, X.; Qian, M.; Xu, F. Nondestructive detection of dried apricots quality based on machine vision and near-infrared diffuse reflectance spectroscopy technology. Trans. Chin. Soc. Agric. Eng. 2012, 28, 260–265. [Google Scholar]
  31. Zhang, J.; Zhang, S.; Li, Z.; Wang, Q.; Wu, D. Recognition of Beef Adulterated with Pork Using Electronic Nose Combined with Statistical Analysis. Food Sci. 2018, 39, 296–300. [Google Scholar]
  32. Min, L.I.; Gao, Z.; Zhu, Y.; Zengjian, S.U.; Chen, L.; Zheng, S.; Zhang, Z.; Meijiao, H.U. Non-destructive Test on Predicting Sugar Content and Acidity of Mango by Electronic Nose Technology. Chin. J. Trop. Crop. 2016, 37, 1553–1557. [Google Scholar]
Figure 1. Average of spectral response of different positions on orange.
Applsci 09 03761 g001
Figure 2. Partial least squares regression (PLSR) detection results of total soluble solid content (TSS) based on full spectral data of (a) stem position; (b) calyx position; (c) equator position; (d) position between equator and stem. RMSE: root mean squared error.
Applsci 09 03761 g002
Figure 3. PLSR detection results of TSS based on Savitzky-Golay processed data.
Applsci 09 03761 g003
Figure 4. Mutual information (MI) between TSS and feature of each wavelength.
Applsci 09 03761 g004
Figure 5. PLSR detection results of TSS based on 736 features of Savitzky-Golay processed data.
Applsci 09 03761 g005
Figure 6. PLSR detection results of TSS based on E-nose with combined feature extraction method.
Applsci 09 03761 g006
Figure 7. MI between TSS and feature of each feature. Note: feature 1–10 are the 75 s value of 10 sensor’s response, respectively; Feature 11–20 are the average value of 10 sensor’s response, respectively; Feature 21–30 are the average of differential value of 10 sensor’s response, respectively; Feature 31–40 are the integral value of 10 sensor’s response, respectively; Feature 41–50 are the max value of 10 sensor’s response, respectively.
Applsci 09 03761 g007
Figure 8. PLSR detection results of TSS based on fusion data.
Applsci 09 03761 g008
Figure 9. Principal component analysis (PCA)-BPNN detection results of TSS based on E-nose with combined feature extraction method. (a): the contribution rate distribution of principal component (PC); (b) BPNN detection results.
Applsci 09 03761 g009
Table 1. Sensor name and performance of electronic nose.
Number in ArraySensor NameObject Substances for SensingThreshold Value (mL·m−3)
R1W1CAromatics10
R2W5SNitrogen oxides1
R3W3CAmmonia and aromatic molecules10
R4W6SHydrogen100
R5W5CMethane, propane and aliphatic non-polar molecules1
R6W1SBroad methane100
R7W1WSulfur-containing organics1
R8W2SBroad alcohols100
R9W2WAromatics, sulfur-and chlorine-containing organics1
R10W3SMethane and aliphatics10
Table 2. PLSR detection results of TSS based on full spectral data with data processing methods.
Data Processing MethodDP 1DP 2DP 3DP 4DP 5DP 6DP 7DP 8
R2cal0.98520.73720.91010.99960.64860.92500.93860.9110
R2val0.09320.10470.40010.06870.13360.32360.00630.0077
Data Processing MethodDP 9DP 10DP 11DP 12DP 13DP 14DP 15DP 16
R2cal0.99190.93860.89920.99820.98070.72850.89810.8952
R2val0.25930.00630.00780.16490.01200.00190.66000.5631
Table 3. PLSR detection results of TSS based on spectral data with MI feature elimination.
MI Range≥0.70≥0.71≥0.72≥0.73≥0.74≥0.75≥0.76≥0.77
Remaining Feature Number21401994163512517362789615
R2cal0.89830.89740.89840.86750.86270.83190.78660.3325
R2val0.66020.66070.66200.66550.68070.67690.45310.1516
Table 4. PLSR detection results of TSS based on E-nose with different feature extraction methods.
FeatureF1F2F3F4F5Combined Feature
R2cal0.12980.14380.13260.14420.18680.5345
R2val0.33330.28730.32970.28680.43310.4282
Note: F1–5 are 75 s value, average value, average of differential value, integral value, and maximum value, respectively.
Table 5. PLSR detection results of TSS based on E-nose data with MI feature elimination.
MI Range≥0.61≥0.62/0.63≥0.64/0.65≥0.66/0.67≥0.68/0.69
Remaining Feature Number4845424039
R2cal0.53190.52800.52120.51970.5103
R2val0.35160.34260.33410.22550.1815

