Article

Determination of Young Elasticity Modulus in Bored Piles Through the Global Strain Extensometer Sensors and Real-Time Monitoring Data

by
Hossein Moayedi
1,2,*,
Bahareh Kalantar
3,
Mu’azu Mohammed Abdullahi
4,
Ahmad Safuan A. Rashid
5,
Ramli Nazir
5 and
Hoang Nguyen
6
1
Department for Management of Science and Technology Development, Ton Duc Thang University, Ho Chi Minh City 700000, Vietnam
2
Faculty of Civil Engineering, Ton Duc Thang University, Ho Chi Minh City 700000, Vietnam
3
RIKEN Center for Advanced Intelligence Project, Goal-Oriented Technology Research Group, Disaster Resilience Science Team, Tokyo 103-0027, Japan
4
Civil Engineering Department, University of Hafr Al-Batin, Al-Jamiah, Hafr Al-Batin 39524, Eastern Province, Saudi Arabia
5
Center of Tropical Geoengineering (Geotropik), School of Civil Engineering, Faculty of Engineering, Universiti Teknologi Malaysia, Johor Bahru 81310, Johor, Malaysia
6
Institute of Research and Development, Duy Tan University, Da Nang 550000, Vietnam
*
Author to whom correspondence should be addressed.
Appl. Sci. 2019, 9(15), 3060; https://doi.org/10.3390/app9153060
Submission received: 16 June 2019 / Revised: 11 July 2019 / Accepted: 12 July 2019 / Published: 29 July 2019
(This article belongs to the Special Issue Buildings and Structures under Extreme Loads)

Abstract

:
For friction piles depending on the friction resistance, accurate prediction of unit skin friction around the pile shaft is the dominant resistance to measure the final bearing capacity of a bored-pile. The present study measures the stress–strain transferring in two instrumented bored-piles (BP #1 & BP# 2) embedded within the soil layer in Kuala Lumpur by real-time monitoring global strain extensometer (GSE) sensors. Two bored-piles (i.e., having 1.80 m and 1.0 m diameters, as well as 36 m and 32 m lengths) have been loaded with two times to their design working loads. Extensive data are analyzed to measure the changes in stress–strain in the bored-pile. The effect of loading and unloading stages on the pile’s head and base settlement has been monitored, indicating that Young modulus of elasticity in concrete bored-pile ( E c ), average strain, and unit skin friction changed along the bored-pile based on the ground site conditions and stress registered. One example of two case studies with great real-time monitoring data has been provided to further design.

1. Introduction

In recent years, calculation of pile bearing capacity data in-situ test has been broadly applied by geotechnical engineers and building foundations, because these data are more accurate and reliable than small-scale laboratory tests. In fact, bored-piles have been considered empirically more as an art-work than science [1], and are formed using appropriate machines (capacity-type) to fill the holes with applicable concrete and reinforcement. Their usual sizes are 400 mm to 3,000 mm diameter, with a capacity that reaches up 45,000 kN based on the pile size and geological profile close to the pile, so an excellent pile capacity has reduced the pile cap size and pile numbers in the group [2,3]. Therefore, bored-pile designing in most countries has relied on the results of the conventional standard penetration test (SPT). According to the literature, the procedure of bored-pile design has consisted of stages such as: (1) the calculation of the end bearing capacity ( f b ) in bored-pile; (2) calculation of the shaft bearing capacity in bored-pile ( f s ), note that, the sum of both values is the ultimate bearing capacity of an individual pile; and (3) pile working load which has been presumed from the ultimate bearing capacity by using a safety factor that permits the piles’ interaction within the group [4,5].
Regarding the empirical approach of f s in relation to K s × SPT, f b has been related to K b × SPT widely applied in pile designing. To evaluate K s (i.e., skin friction ratio, f s / S P T ) and K b (i.e., end bearing ratio, f b / S P T ), the value including local soil condition has required vibrating wire strain gauges (VWSG) and a mechanical tell-tale rod installed within the pile to measure the axial stress–strain relation and movement in different levels down to the pile’s toe and shaft. Bored-pile of length (L) and diameter ( D s ) supporting a vertical head load ( P h ) by the mobilized shaft and base resistance ( P s P b ) is illustrated in Figure 1a. The vertical displacement of the pile’s base and head are defined as Δ b Δ h , followed by the pile compressing (shortening) as e p ignoring the pile weight as it is in Equation (1) [6]:
P h = P s + P b
According to the cross-sectional area of concrete A, the stress along with the pile σ h is as Equation (2) [6]:
σ h = P h A
Δ h = e p + Δ b
The length δ z has been located at depth z below the pile head level as shown in Figure 1a–c. Shaft resistance δ P s mobilized along the segment δ z equals the axial force changing in axial force δ P z . The unit shaft resistance f s ( z ) mobilized in δ z has been related to P ( z ) as shown in Equation (4):
d P ( z ) d z = π D s f s ( z )
The negative sign shows that P z decreased as z increased (Figure 1c). Omer et al. [7] mention that if the pile’s elastic feature has been denoted ( E p ), ignoring all vertical soil moving and pile displacement w ( z ) (e.g., pile movement at depth z below the pile head level) at depth z have been offered as Equation (5):
d w ( z ) d z = 4 P ( z ) π D s 2 E p
Equation (5) is different with z and d P ( z ) / d z , replaced by using Equations (1)–(4) as Equation (6):
d 2 w ( z ) d z 2 = 4 D s E p f s ( z )
All the mentioned equations according to force equilibrium and displacement correspondents are valid irrespective of pile type and soil grouping [7].
Few more studies have been performed on longitude strain, which have measured the instrumented piles [8,9,10,11,12,13], transferring of load in rapid pile axial loading [14], static, dynamic, seismic, and cyclic lateral load of pile classifications [15,16,17], rigid and flexible pile behaviors in diverse soft soils [18,19,20], and skin friction resistance measurement in piles [21]. Some studies have been conducted based on numerical simulations, however, others have been performed on field monitoring (Ng and Sritharan [22]; Hung et al. [23]; Tafreshi et al. [24]; Mascarucci et al. [25]; and Lee et al. [26]). Ochiai et al. [27] propose a reliable designing model for bored-piles following in-situ tests by SPT. Poulos [28] has also introduced an appropriate design for piled rafts, comprising three stages: (1) assessing the feasibility of piled raft application accompanied by the required pile number, (2) evaluating where piles are needed and its general features, and (3) obtaining the optimum number, location, and configuration of a pile and computing the settlement distributions, bending moment and shear in the raft, and the pile loads and moments.
Sego et al. [29] studied the effect of an enlarged base on the total and end bearing resistance of a pile for use in ice-rich permafrost. Therefore, the total capacity of a bored-pile has mainly inclined by belled-pile usage. Shariatmadari et al. [30] studied the bearing capacity of driven piles in sands following SPT by applying 60 previous cases. Data included 43 full-scale, 17 dynamic tests, and static pile load testing analyzed by control and provisioning of wireless access points (CAPWAP). Note that, SPT data have been used close to the pile locations. Another model, as standard penetration test N(SPT-N), has been conducted and proved to have less scatter with higher accuracy. Zhang et al. [31] applied an elastic–plastic model showing the load–settlement relationship, and provided a simple method to analyze the behavior of a pile group and/or a single pile embedded in multilayered soils using two methods like an approach to enable a quick estimation of pile group settlement and/or a single pile embedded in multilayered soils providing time and cost saving. Ruan and Zuo [32] explained the relations between the ultimate vertical bearing capacity and SPT for the jacked pile. These case studies confirm the accuracy and reliability of the formula, mainly in silent pipe pile bearing capacity calculation. Assessing the friction capacity of driven piles in clay has been performed through the use of multivariate adaptive regression spline (MARS) by Samui [33], which led to D (diameter), L (length), undrained shear strength, and effective vertical stress as MARS input and friction capacity as output compared using artificial neural network (ANN). MARS, as a robust model, has been applied to predict the friction capacity in driven piles installed in clay.
Meanwhile, another research carrying the same approach has been conducted on cohesionless soil by Samui [34]. Chae et al. [35] investigated the uplift capacity of belled-piles in weathered sandstones of the Persian Gulf coast. Accordingly, few full-scale pullout load tests on belled tension piles in Abu Dhabi have also been performed. Comparing the results from the field, 3D finite element (FE), and theoretical methods have overestimated the ultimate pullout resistance of belled-pile without bell shape considerations [35]. Sakr [36] compared the results of high strain dynamic and static load tests of single helical-screw piles in cohesive soils. High strain dynamic pile load experiments have been performed on both driven steel open-pipe and helical piles. Case Pile Wave Analysis Program (CAPWAP) and full-scale static load test have confirmed high strain dynamic testing (HSDT) as a reliable tool for assessing static helical pile capacity. Zhang et al. [37] stated that in a typical design, the skin friction and the base resistance are majorly independent. Furthermore, the ultimate bearing capacity of a single pile has been composed in ultimate end resistance and confining skin friction.
Yao and Chen [38] promoted a flexible plastic solution for the uplift belled-pile. In the comparison of the provided solution outcome to the theoretical calculation one, the theoretical method results revealed that the elastic–plastic analytical solutions is a good method. Aksoy et al. [39] developed a new chart to estimate the friction angle between the pile and soil materials. Accordingly, in the current research, soil including different internal friction angles (φ) has been initially provided, then the skin friction angles (delta) of the mentioned soils with fiber-reinforced plastic (FRP) like a composite material, wood (pine), and steel (st37) have been defined by undertaking the interface shear test to provide a pile design diagram to determine skin friction angles of the soils and pile materials.
Wang et al. [40] investigated the controlling effectiveness and settlement behavior of two types of rigid pile structure embankments (PSE) constructed on collapsible loess soils beneath a high-speed railway. The results have shown that this type of PSE has mainly reduced embankment settlement so that embankments have to be maintained on collapsible loess. Meanwhile, pile spacing has significant efficiency in settlement reduction. Therefore, the current study has focused on stress–strain transferring throughout the instrumented bored-pile within the layered soil to measure the parameters of soil-pile interaction comprising Young elasticity module in concrete ( E c ), average strain, and unit skin friction changed along with the pile.

2. Material and Methods

2.1. Testing

Maintained load test (MLT), is known as static loading test (i.e., the load will remain constant until the settlement ended to small values), has been followed by ASTM Standard (D1143/D1143M-07). An apparent distance between the reaction pile and test pile should not be less than five times to diameter (D) of the immense pile. Considering setup, the piles are loaded by applying hydraulic jacks toward the main beam operated by an electric pump. Then, the applied load is accurately calibrated by vibrating wire load cells (VWLC) (Table 1). Both instrumental piles are located in Jalan Ampang and Kuchai Lama, Kuala Lumpur, Malaysia.

2.2. Loading Procedure

Poulos [28] states that applied loading is crucial to the bending moment and differential settlements, but less critical to load-sharing or maximum settlement between the piles and raft. In bored-piles, time for loading test has been determined by the piles’ concrete strength (Zhang et al. [37]). In addition, Tomlinson and Woodward [1] suggest that at the testing time, concrete should be in its seven days (at least) with at least doubled strength of applied stress, moreover, in the current pile testing, the load cycles have started 28 days after pile construction. A schematic view of the MLT is shown in Figure 2. Instrumented piles are tested by MLT per two loading-cycle calculated by calibrated VWLCs in every 10 min for one hour (Figure 3).

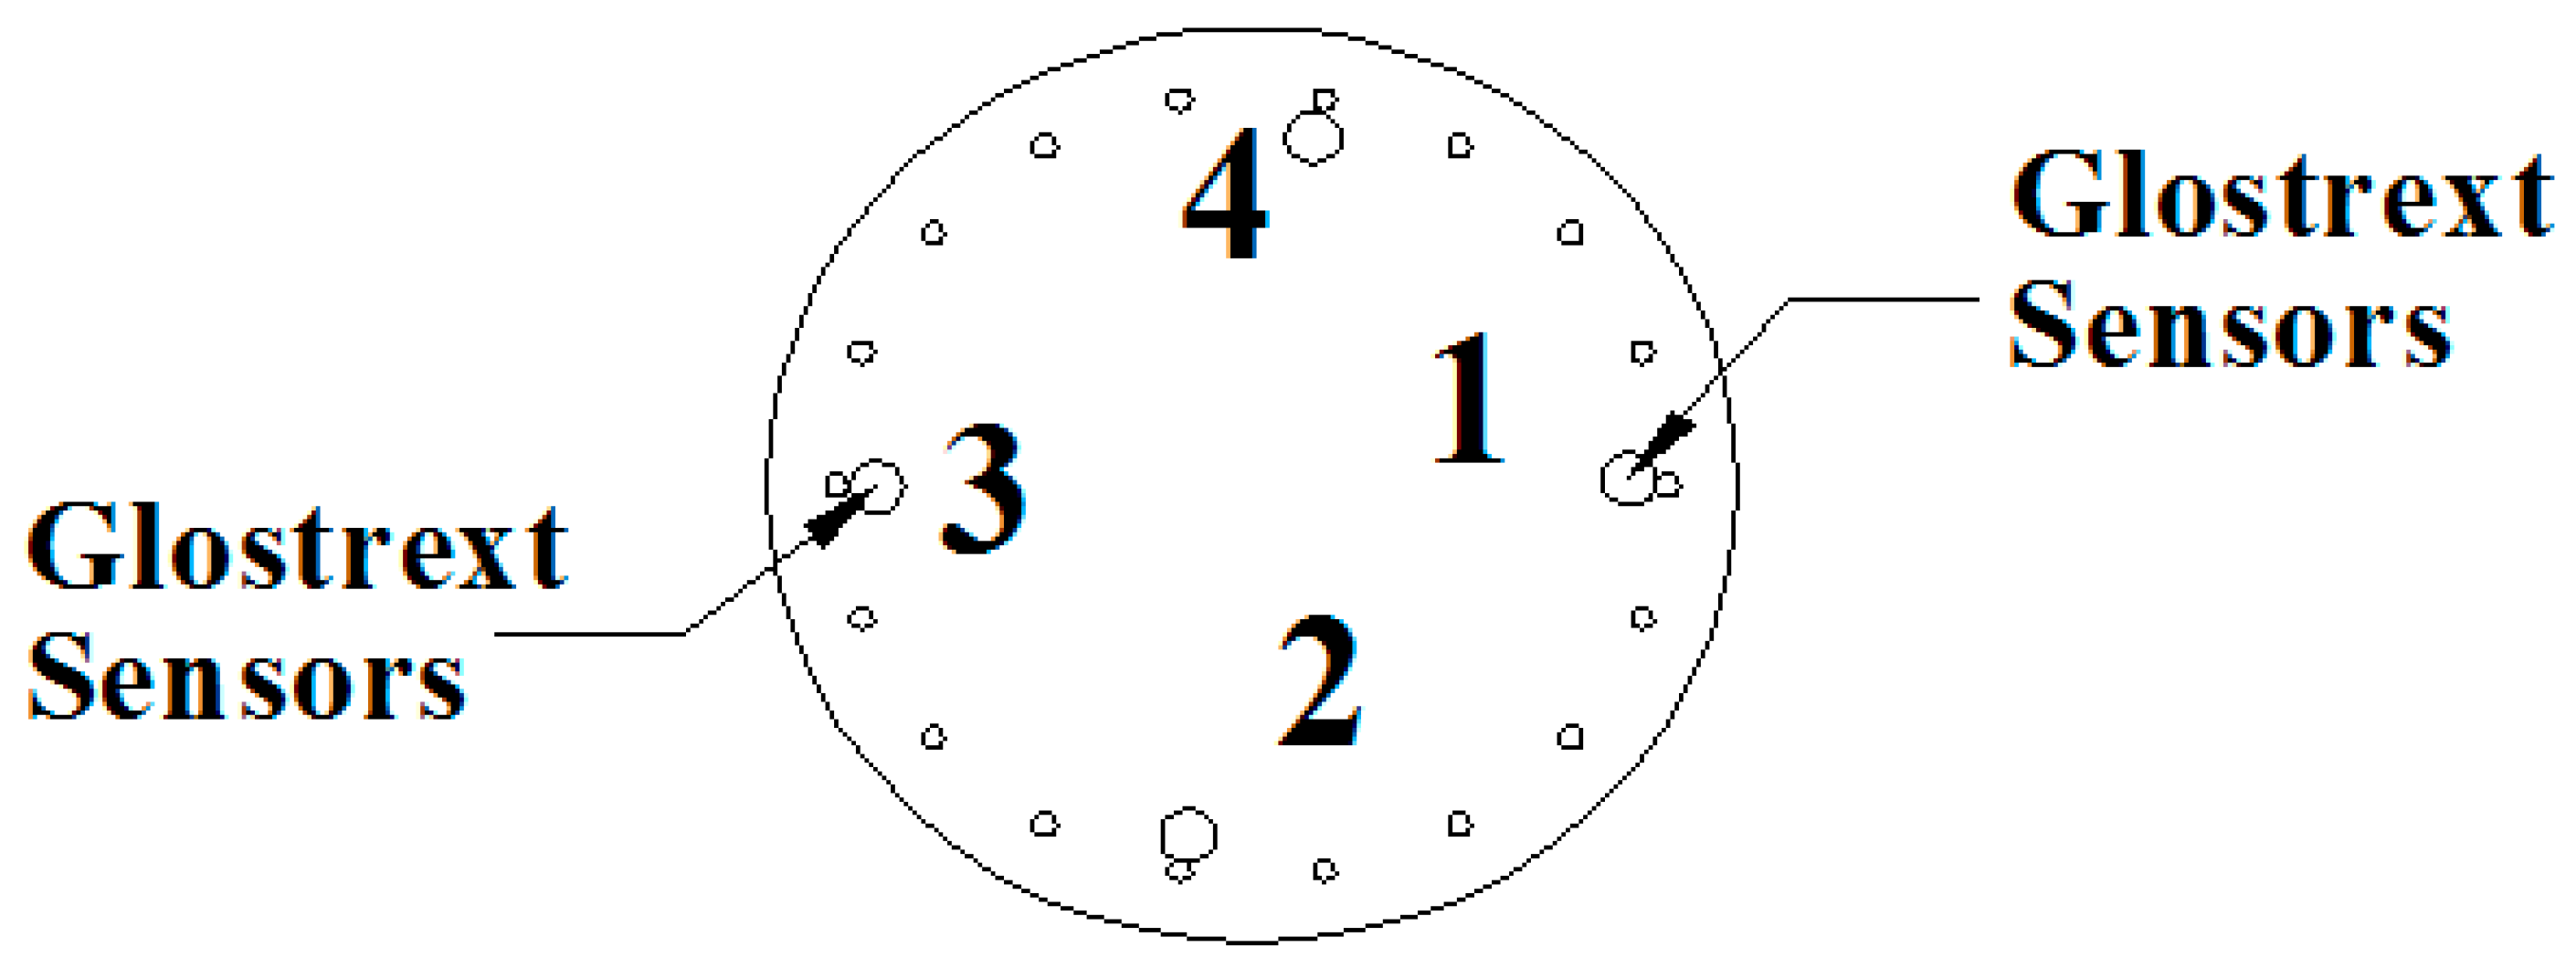
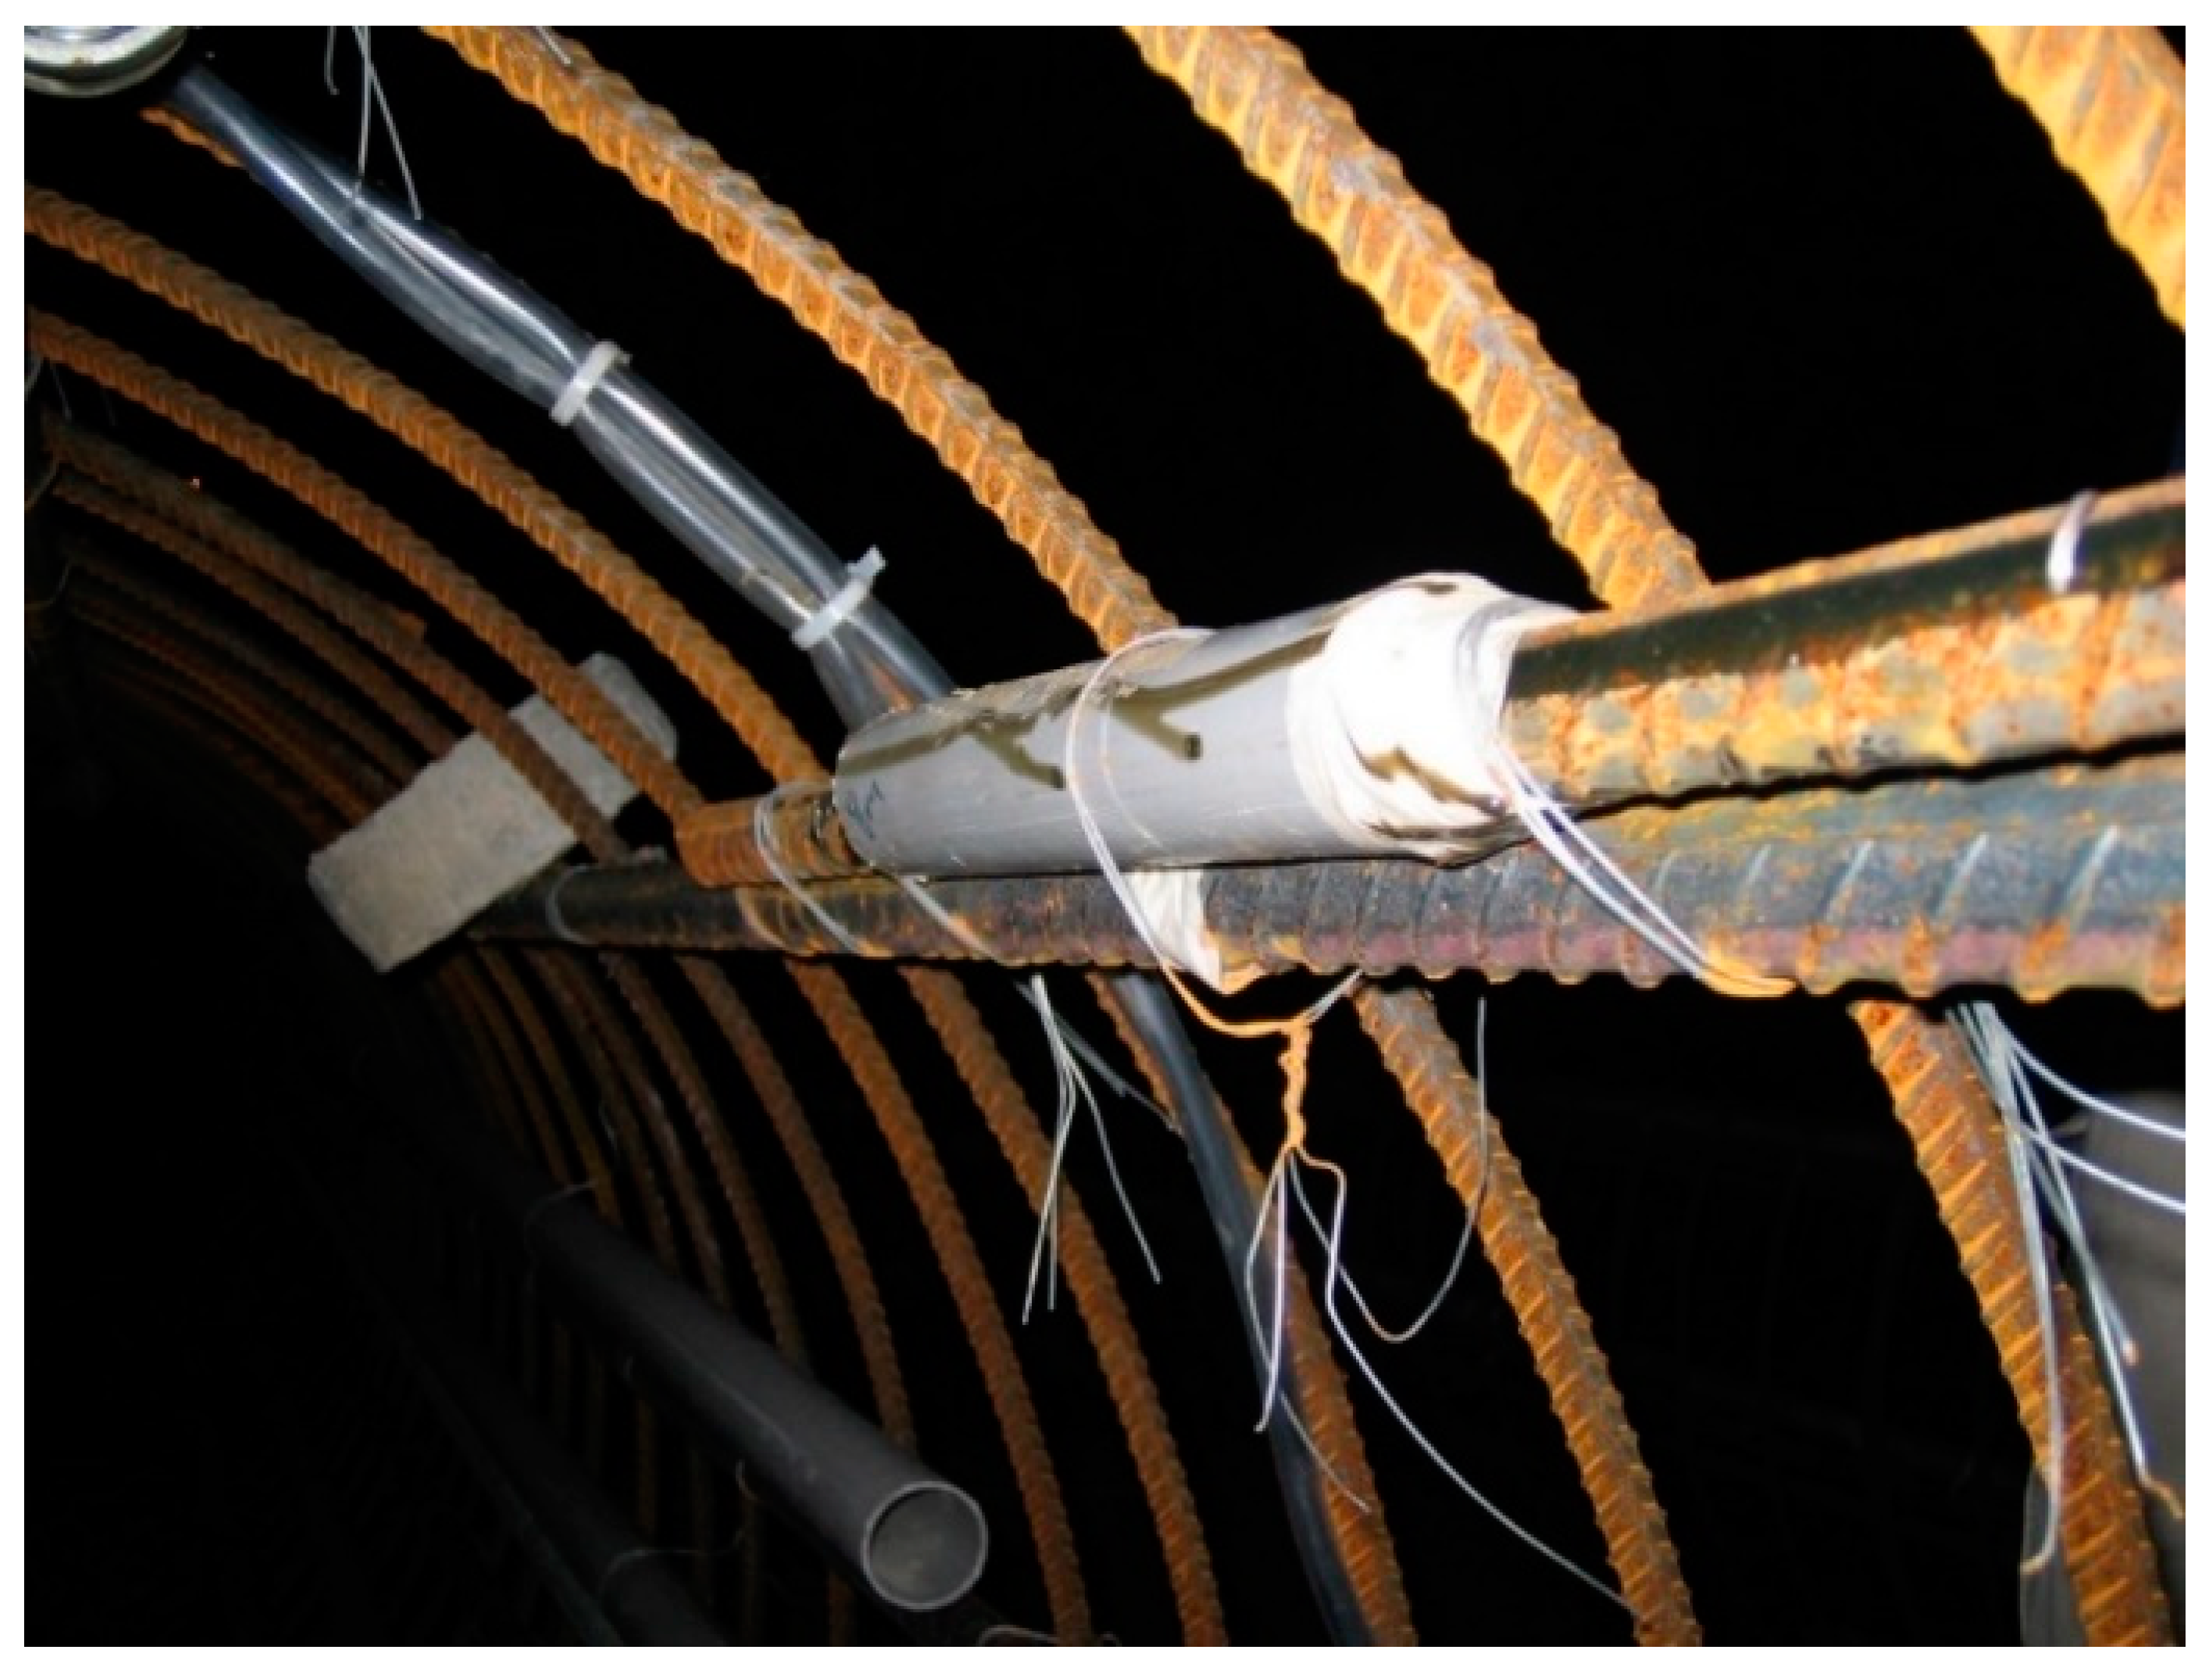
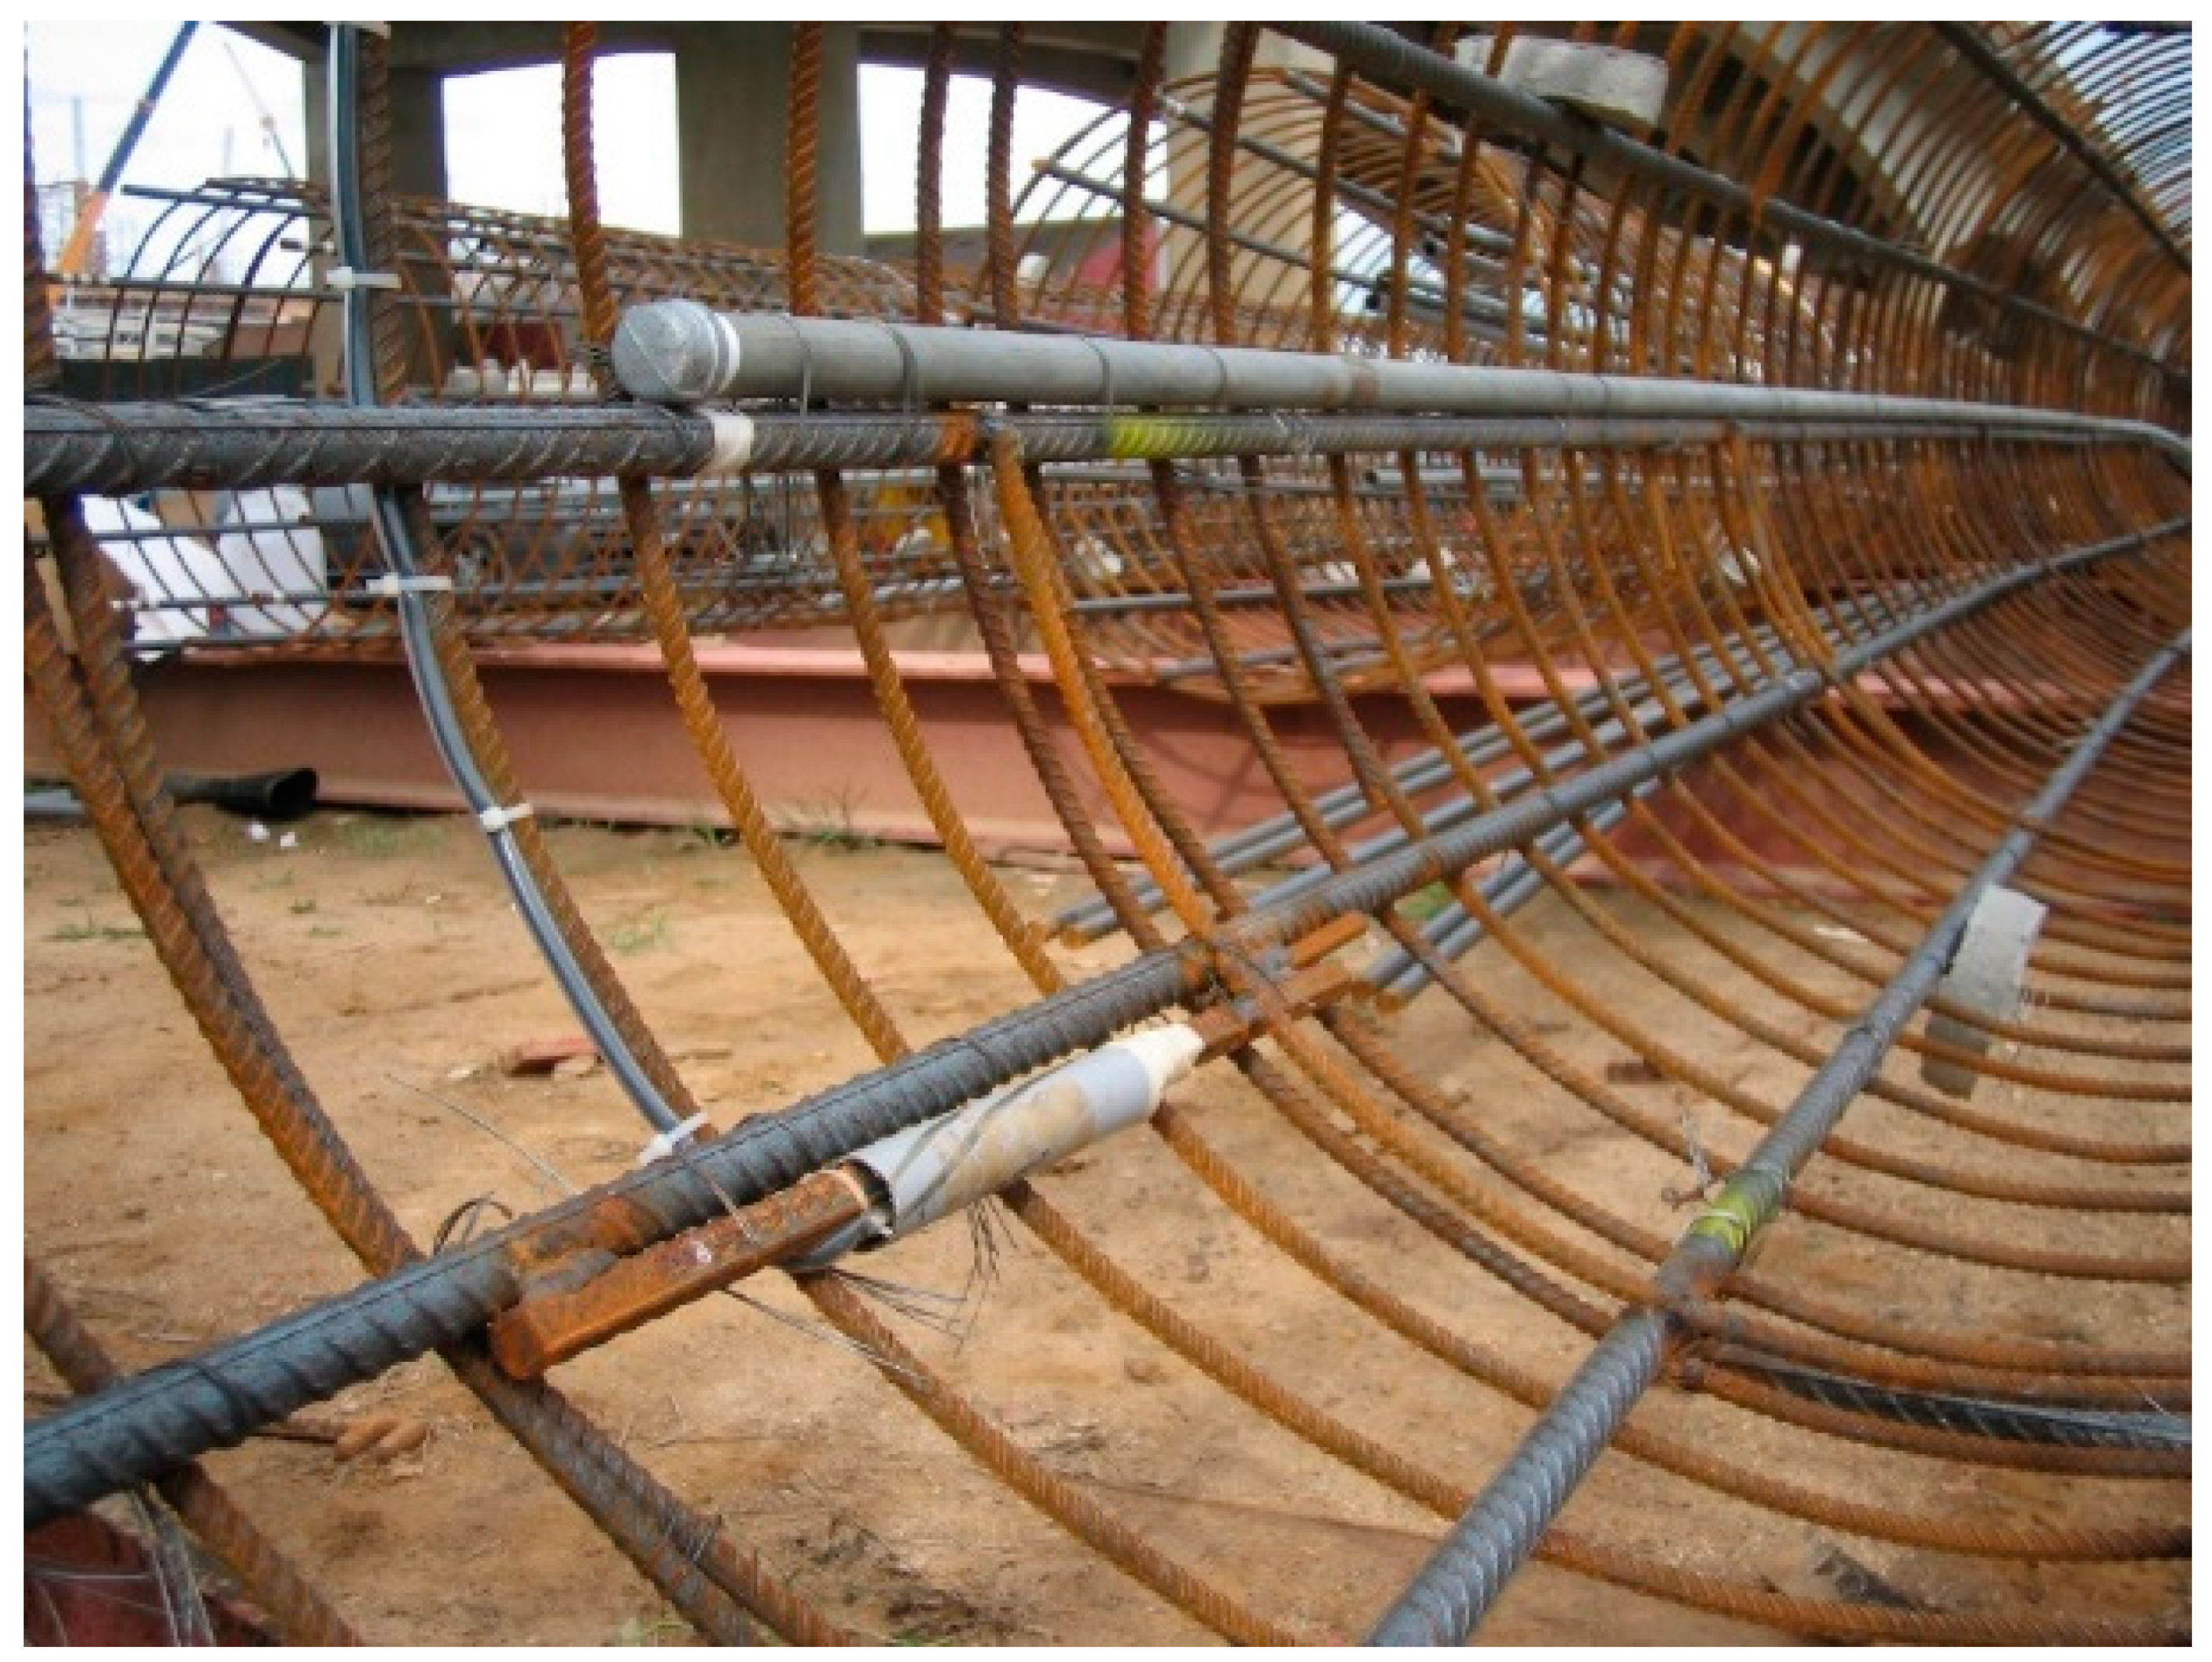
2.3. Instruments Monitoring System

The influence of geologically weak zones through multilayer site conditions has dramatically changed the designing parameters when the majority of these parameters change by depth. In other words, new global strain extensometer (GSE) sensors have recently measured the change of design parameters through the depth, so the pile top settlement has been monitored using: (1) four linear variation displacement transducers (LVDTs) mounted on the reference beams with their plungers vertically placed against glass plates fixed on the pile top, and (2) vertical scale rules attached to the pile top and sighted by a precise level instrument. Vertical scales have also been shown on the reference beams to check any movement in the loading test. Indeed, VWLC, global strain extensometer (GSE) sensors, VWSG, and LVDTs have been automatically logged across the use of Micro-10x data logger and Multi logger at 5-minute spaces for precise controlling during loading/unloading stages, adding that only accurate level readings have been taken manually. Figure 4 shows the cross section of BP# 1 (D = 1,800 mm) and BP# 2 (D = 1,000 mm) and the sensors’ placement along the main steel rods.
Accordingly, the bored-pile has been tested using MLT through the reaction pile. All instruments using Micro-10 data logger and multilevel software have been automatically logged. The conventional instrumented method used VWSG and mechanical tell-tales. While by being attached to the steel cage of bored-pile, VWSG and mechanical tell-tales have permanently been embedded in the concrete. GSE is the second instrument applied in axial load measurement and settlement distribution in the bored-pile.
On static load testing, loaded pile deformation has produced a related moving between every two anchored intervals changed in strain gauge wire tension, in addition to a corresponding change in its resonant vibration-frequency measured by plucking GSE sensors/transducers through a signal cable to readout box/data logger to measure the frequency and display of the shortening and strain reading. Considering the installation set up, GSE has measured shortening and strains on all test pile sections in every load step of a static pile load test, so it has integrated the strains on a larger and more representative sample. Therefore, using a defined instrumental scheme, data derived from instrumented load testing have provided reliable information. The results of GSE have been compared to the conventional instrumentation bored pile results. Subsequently, regarding the test piles, including BP# 2, the Geokon VWSG and tell-tale extensometers have been installed internally to monitor the strain developing and shortening of pile behavior on the test. BP# 1, with the instrumentation of GSE, has been placed with seven levels depending on the pile length and vertical varieties of sub-soil cases in sonic logging tubes (Figure 5).
Due to calibration of the applied axial load and the measured average strain, a calibrated GSE sensor has been installed near the pile’s head, in which there is no interaction between the soil friction and pile shaft. The GSE sensor measured the strain of other levels to determine the axial load transferring in all pile shaft sections, also to measure the loads contributed from the toe or/to end bearing resistance. VW Extensometer is installed on the anchored interval at eight levels (Figure 6). Pile deformation in loading has produced a related motion between every two anchored intervals producing strain gauge wire tension alteration in VW transducers, in addition to a correspondent variation in its frequent resonant vibration measured by plucking GSE sensors to the readout box/data logger. Therefore, the process measured the frequency displayed by the shortening reading and strain reading. VWSG for BP# 2 is also installed at five levels (A to E) in four numbers per level (Figure 6). The connected VWSG to the steel cage and electrical lead wires from the sensors coming to the top, have been illustrated in Figure 7 and Figure 8.
The pile head displacement has also been analyzed using dial gauges and LVDTs, resulting in a reading with 0.01 mm accuracy mounted on stable reference beams and protected from direct sunlight and disturbance of personnel in the whole system. Settlement measuring through the use of proper leveling techniques has also been implemented as a useful backup to check the reference beams’ movement. Vibrating wire load cells, strain gauges, retrievable extensometers, and LVDTs have been automatically logged by applying a Micro-10x Datalogger and Multilogger software at the 3-minute spacing for precise control during load/unload stages. Only accurate level readings are manually considered.
Briefly, the pile movement monitoring system, such as pile top and bottom settlements, has been monitored using the vertical scale rule fixed to the pile top observed by tunnel boring machine (TBM) for correction purposes. On the other hand, LVDTs and GSEs mounted to the reference beam accompanied by a plunger pressed vertically against a glass plate fixed to the pile’s top. The vertical scales have been provided to monitor any movement in the load test. Indeed, strain gauges are manufactured in Geokon, USA. VWSG principles in strain measurement were presented due to the frequent natural vibration of taut wire restrained at both ends and varied with the square root of wire tension. Indeed, this change of tension in the wire has shown all the strain alterations in the structural steel member where the gauge is mounted. Moreover, all strain gauge has been mounted to two end blocks as arc-welded to the main reinforced bar at a proper level. The signal cables of the picked-up sensors fixed to the strain gauges have been tightly tied in the reinforced bars to the top of the piles terminated in a multiplexer box and observed using a Micro-10 Datalogger.

2.4. Site Condition

In the current paper, two full-scale maintained static load experiments on bored-piles are conducted. The first experiment (BP# 1) was performed at Cadangan Pembangunan, Lorong Stonor, Kuala Lumpur, Malaysia. The test pile was initially loaded up to 2 times to pile structural capacity, therefore, regarding BP# 1 with the structural capacity of 22,200 kN , the nominal diameter of 1,800 mm with a penetration depth of 36.95 m from the current piling platform level is RL 36.25 m. The pile was initially examined by up to 44,400 kN (2 x working load) in two loading cycles. The second test (BP# 2) was applied at Utama Lodge, Jalan Senangria, Kuala Lumpur, Malaysia. The summary of soil types, besides the SPT-N values measured near the pile location, are illustrated in Table 2. Noting that the soil stratum was classified according to the unified soil classification system.
The gauges were investigated prior and after installation, after cage placement in the borehole, and after concreting. The strain gauges’ signal cables were reserved for testing approximately after 28 days, allowing for the concrete to achieve the design strength. Therefore, on test day, the strain gauges’ cable was linked to the switch box connected to the data logger to ensure the functional sequences. Regarding the rod extensometer, galvanized iron (GI) pipes were tied to the main reinforced cage with steel wires at each terminating depth (Figure 9). A mild steel rod (10 mm) was inserted untill it touched the bottom of the pipe. In addition, a steel plate was welded to the rod’s end for the plunger to sit on along the experiment (Figure 10).

3. Results and Discussion

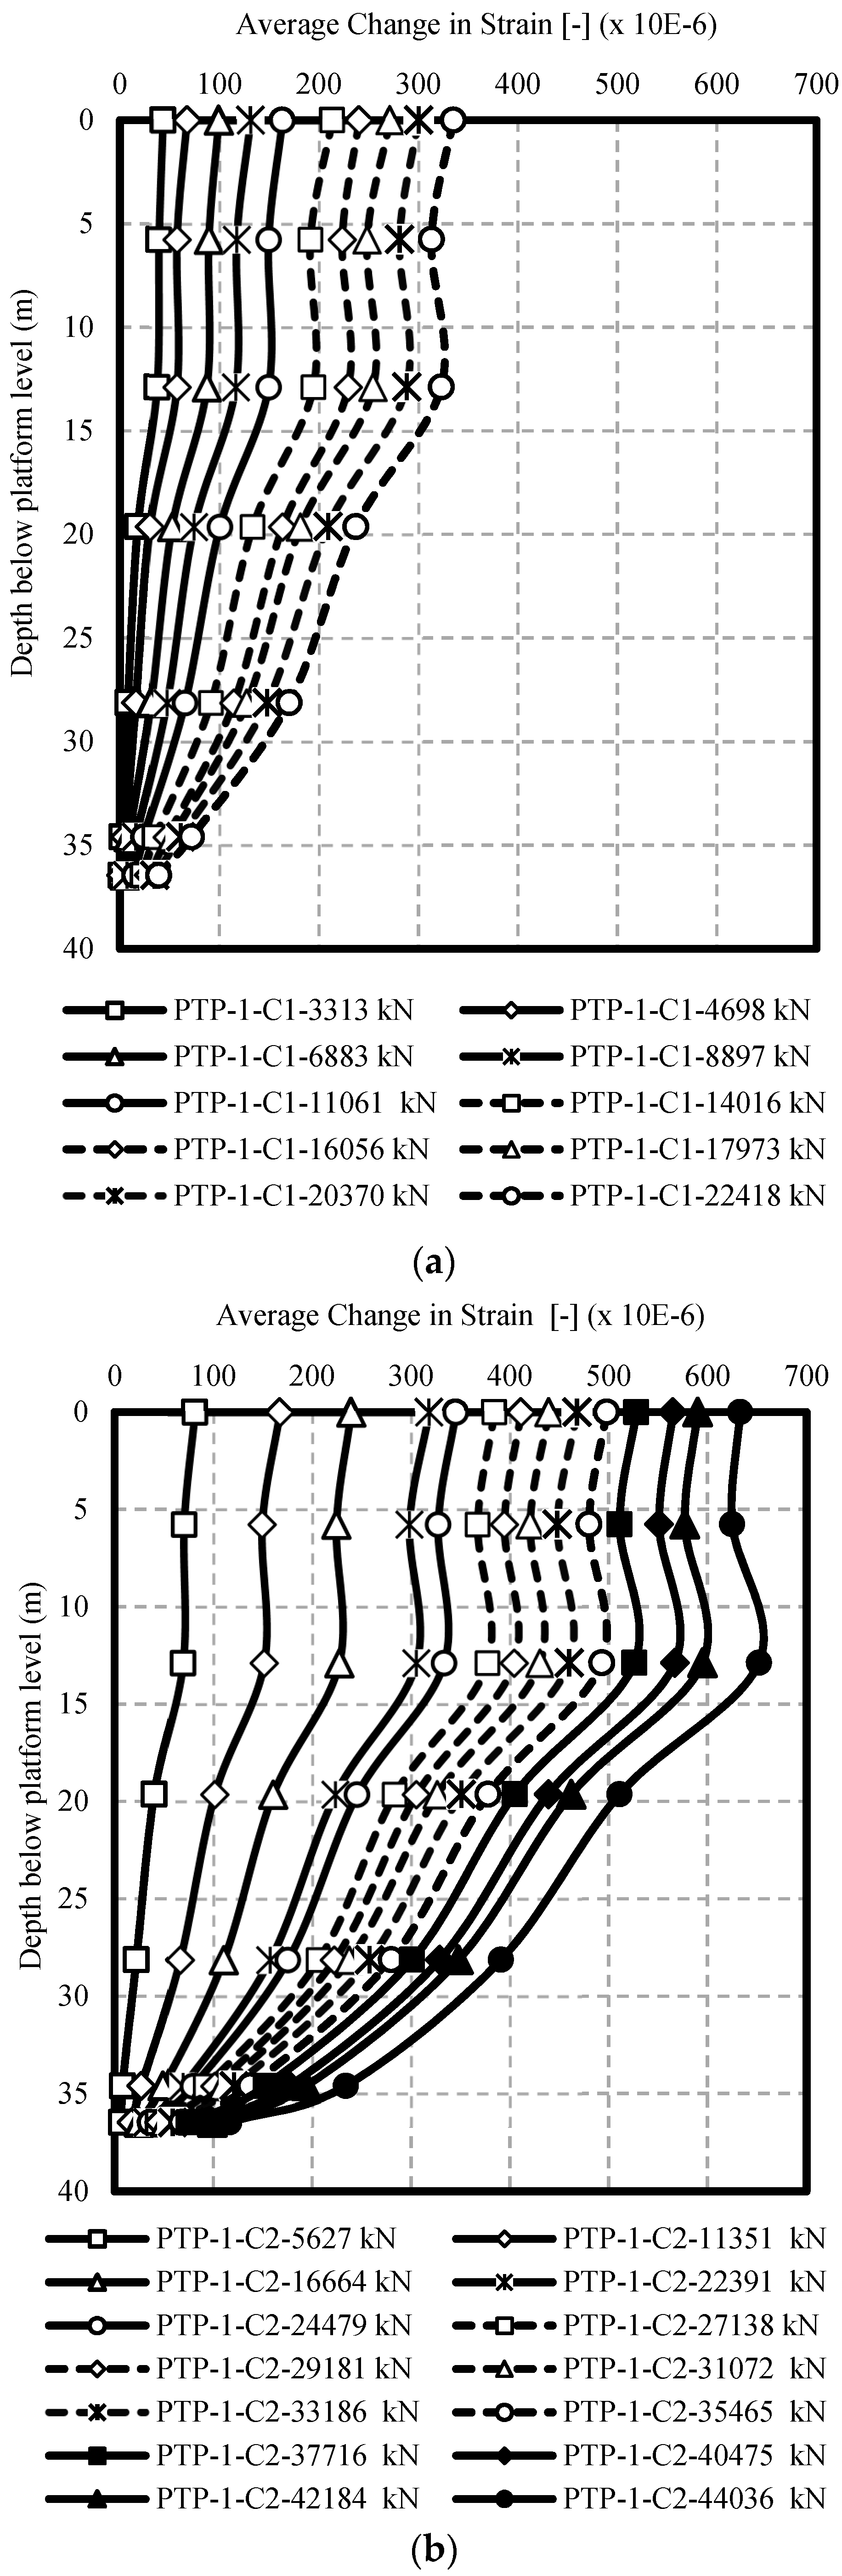
3.1. Stress–Strain Variation in the Piles

Stress distributions along the piles (BP# 1 and BP# 2) in two continuous loading/unloading cycles have been illustrated in Figure 11, Figure 12, Figure 13 and Figure 14, showing that in a specified load, normal stress used in the pile’s surface area is reduced by depth. Therefore, the reduction rate varied along with the pile—it is low in soft soil layers (having low SPT-N) but sharp in stiff layers (with high SPT-N). These results indicate great skin friction capacity of soil where rapid change between two different depths.
Tosini et al. [41] have declared that the forecast of deep foundation settlements in a layered soil profile is not always straightforward due to the problems in value defining of mechanical parameters affecting them. Distribution of average change and their cycles, in both strains (BP# 1 & BP# 2), in addition to the distribution of back-calculated modulus of concrete as E c (kN/mm2) in both strains (BP# 1 & BP# 2) are shown in Figure 15 and Figure 16. In BP# 1, E c for the entire length remained constant at 25 kN / mm 2 except at depths below 5 m within stiff sandy silt with little gravel when the higher load showed slightly lower E c (Figure 15a). Therefore, the results obtained for E c (in BP# 2) changed based on the depth and applied load. The lower applied stress through the first cycle provided minor changes in E c distribution along the pile length. However, higher applied load amounts caused a higher change in E c with depth (Figure 15). The highest and lowest E c for the depth = 17.816 m (in BP# 2) were 38.2 and 33.9 kN / mm 2 , resepectively, for the applied stress of 1,750 kPa and 12,904 kPa. The reverse relation of E c with applied stress occurred when higher applied stress on the pile cap showed lower E c (Figure 16a). Consequently, the highest variation in E c was observed within the silty and/or sandy silt layers, while the lowest change in E c was measured at the weathered sandstone zone at depths above 20 m (Figure 16b).
Average SPT-N and unit skin friction in BP# 1 & BP# 2 presented in Figure 17, indicate the range of ultimate skin friction with value change of SPT-N. Furthermore, in multilayer site conditions, the least SPT-N sum for a soil layer provided the least unit skin friction and vice versa. The outcome derived from GSE sensors was computed according to the displacement amounts recorded by the sensors. A higher alteration for the recorded axial force within two continuous levels provided a larger unit skin friction for a specified soil layer (Figure 17).

3.2. Pile Movement Monitoring

Zhang et al. [42] state that the stress load-settlement curves reflect (1) the pile–soil interaction law, (2) the load transfer law, and (3) the pile load destruction mode. According to the previous explanations, the pile top and base settlements have been monitored for each load increment by applying the dial and strain gauges. Applied stress alteration versus total pile top and base settlement for two well-instrumented field tests (BP# 1, and BP# 2) in multilayered soils are presented in Figure 18 and Figure 19, respectively. In the 1st cycle, the highest sighted pile top settlement at loading 22,418 kN was 9.60 mm. During unloading to zero, the pile was rebounded to a residual settlement of 0.36 mm. On the contrary, in the 2nd cycle, the maximum sighted pile top settlement at the peak load of 44,036 kN was 24.63 mm, so during unloading to zero, the pile was rebounded to a residual settlement of 5.34 mm. Similarly, residual settlements of 2.4 mm and 6.58 mm were recorded for the BP# 1 and BP# 2, respectively. According to Omer et al. [7], the variation of f s ( z ) with depth (z) is affected by different parameters including pile–soil properties, such as(1) pile–soil interface geometry and slip properties, (2) stress performance on the pile–soil interface, (3) pile installment technique, and (4) pile load method and ratio.
Different total pile settlement versus time during BP# 1 and BP# 2 is presented in Figure 20. The settlement rate in the pile’s head is almost linear in the loading steps. However, when unloading begins, the settlement rate of unloading steps significantly increased depending on the loading/unloading sequences, showing that the loading time for the second cycle of BP# 1 and BP# 2 were 400 and 600 min. The measured settlement on the pile’s head was rebounded to permanent vertical deformation of 5.34 mm and 8.55 mm for both tests (BP# 1 and BP# 2) after unloading to zero. Correspondingly, the highest settlements of 24.63 mm and 19.54 mm were recorded for the pile’s head vertical deformation.
Some of the critical factors that were considered to be constant during pile load tests (e.g., BP# 1 and BP# 2.) were (i) piling technology, (ii) concrete maturity, (iii) the location of the groundwater, and most importantly, and (iv) the soil parameters (e.g., both mechanical and physical properties changes). Such a problem may affect E c measurement during the pile servicing period. For instance, it is established that piling technology will influence soil–pile interactions [43,44,45]. Piling techniques that lead to changes in soil properties can affect the axial force, load-displacement response, and tip resistance of each model pile. In most cases, to assess such influences, a large number of small-scale experimental works, or real-scale numerical and analytical studies are helpful.
On the one hand, the other factor that can influence the results of such investigations is concrete maturity [46,47]. Concrete maturity factor reveals the amount of concrete strength gain during the curing period, which is typically challenging to be taken into consideration as a separate variable on the full-scale experimental programme. It is important to note that the lack of such information may cause a significant change in the load-settlement behaviors of the pile during its working lifetime. Factors such as soil properties (e.g., shear strength parameters such as soil internal friction angle, cohesion, etc.) as well as groundwater levels, are primary terms that can remarkably alter the soil–pile responses to heavy external loadings. As an example, saturating the soil can cause soil shear strength reduction, which will influence the pile settlement as well as reducing the pile bearing capacities [48]. Another critical issue that can increase the complexity of soil–pile reactions, as well as load-settlement responses, as highlighted by Chisari et al. [49]. In the study provided by Chisari et al. [49], the influence of dynamic and static loading conditions (e.g., for identification of the primary material properties of a base-isolated bridge) are investigated. Their results showed that static identification is much less complicated compared to dynamic analysis. Although the current study covers the static load test, future work could evaluate the effect of a dynamic loading test in real-time monitoring of Yc.

4. Conclusions

The main objective of this study was to find a reliable estimation of the Ec in the installed bored pile. Two full-scale maintained a static loads test on instrumented bored-piles had been conducted in Kuala Lumpur, Malaysia to obtain a reliable range for ultimate skin friction with SPT-N value (i.e., blow counts) alteration. The effects of geologically weak zones through the layered soil ground conditions in crucial parameter-design changing such as elastic concrete modulus and strain–stress along the piles have also been researched. The details of the conclusion are as follows.
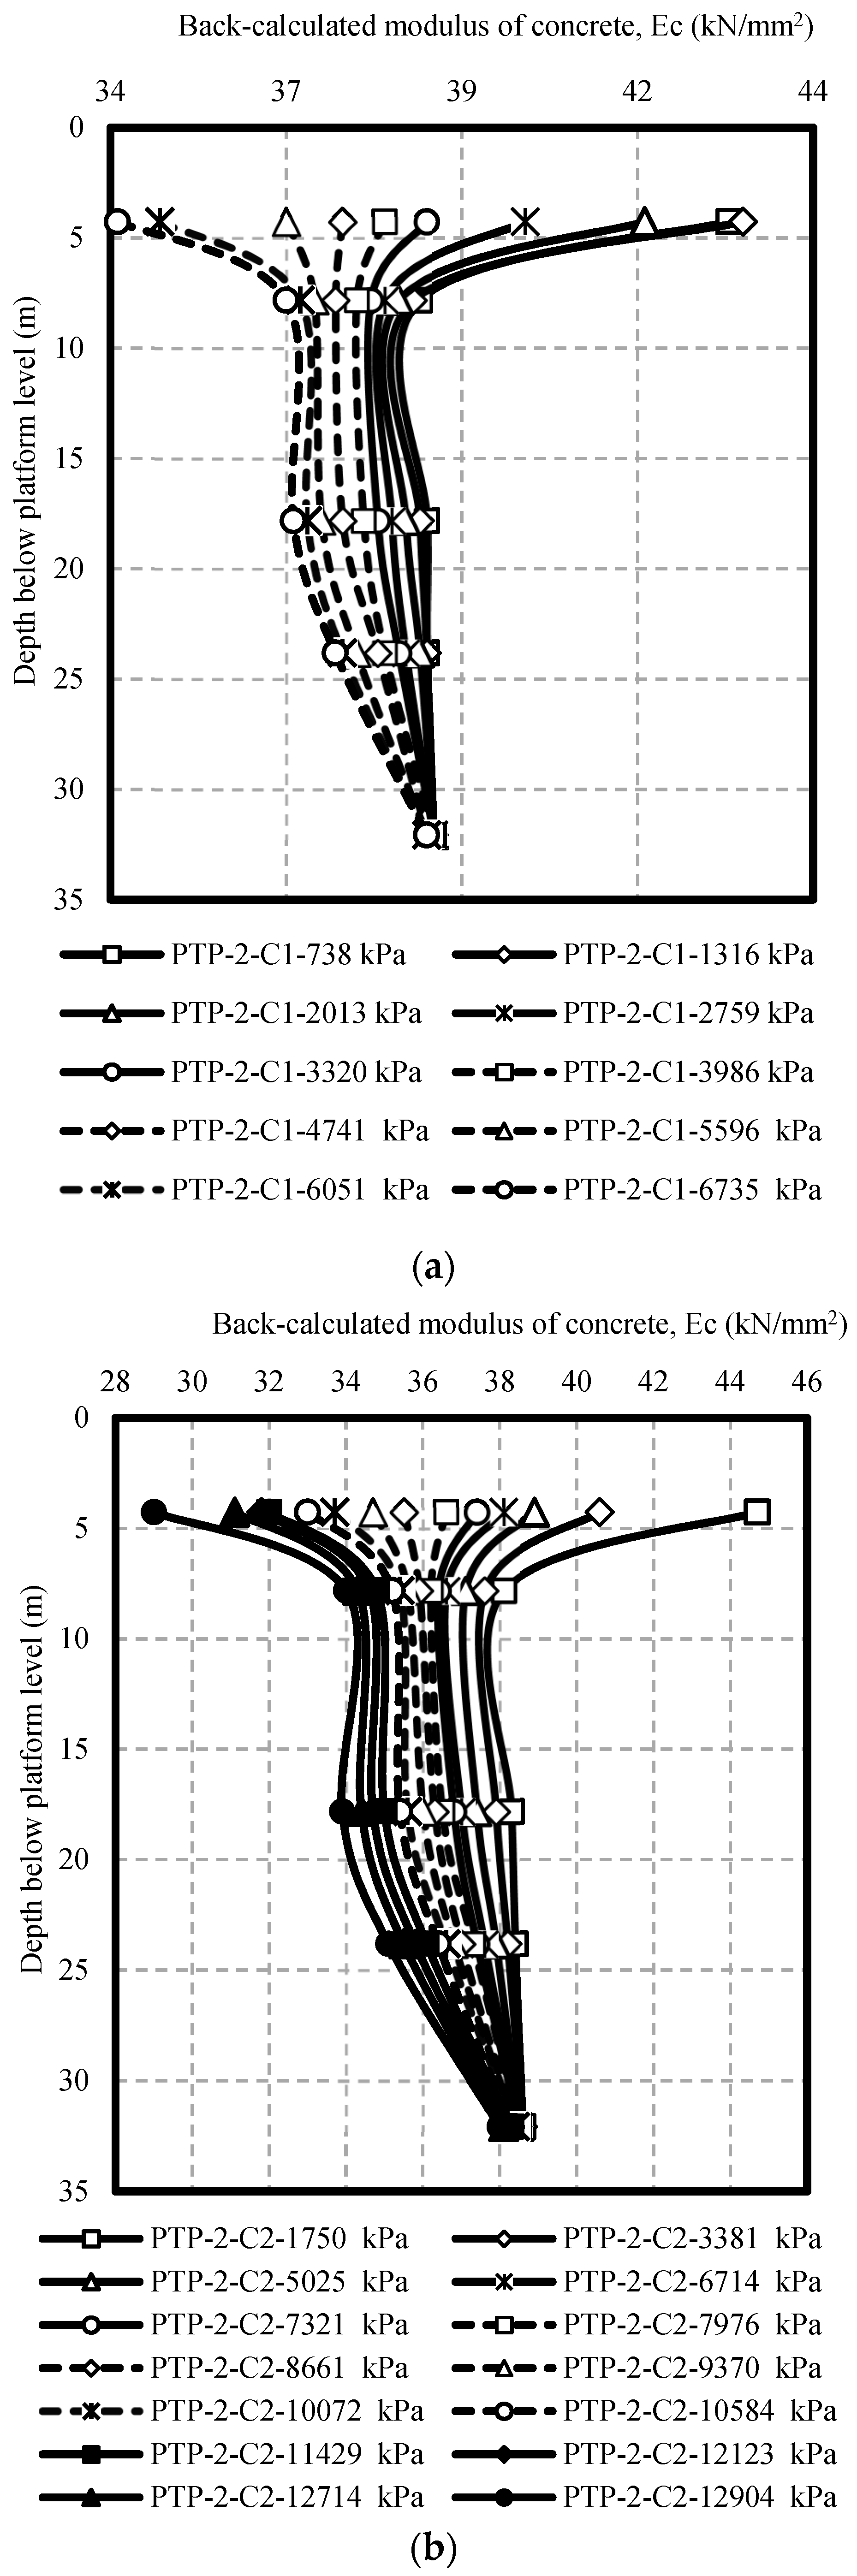
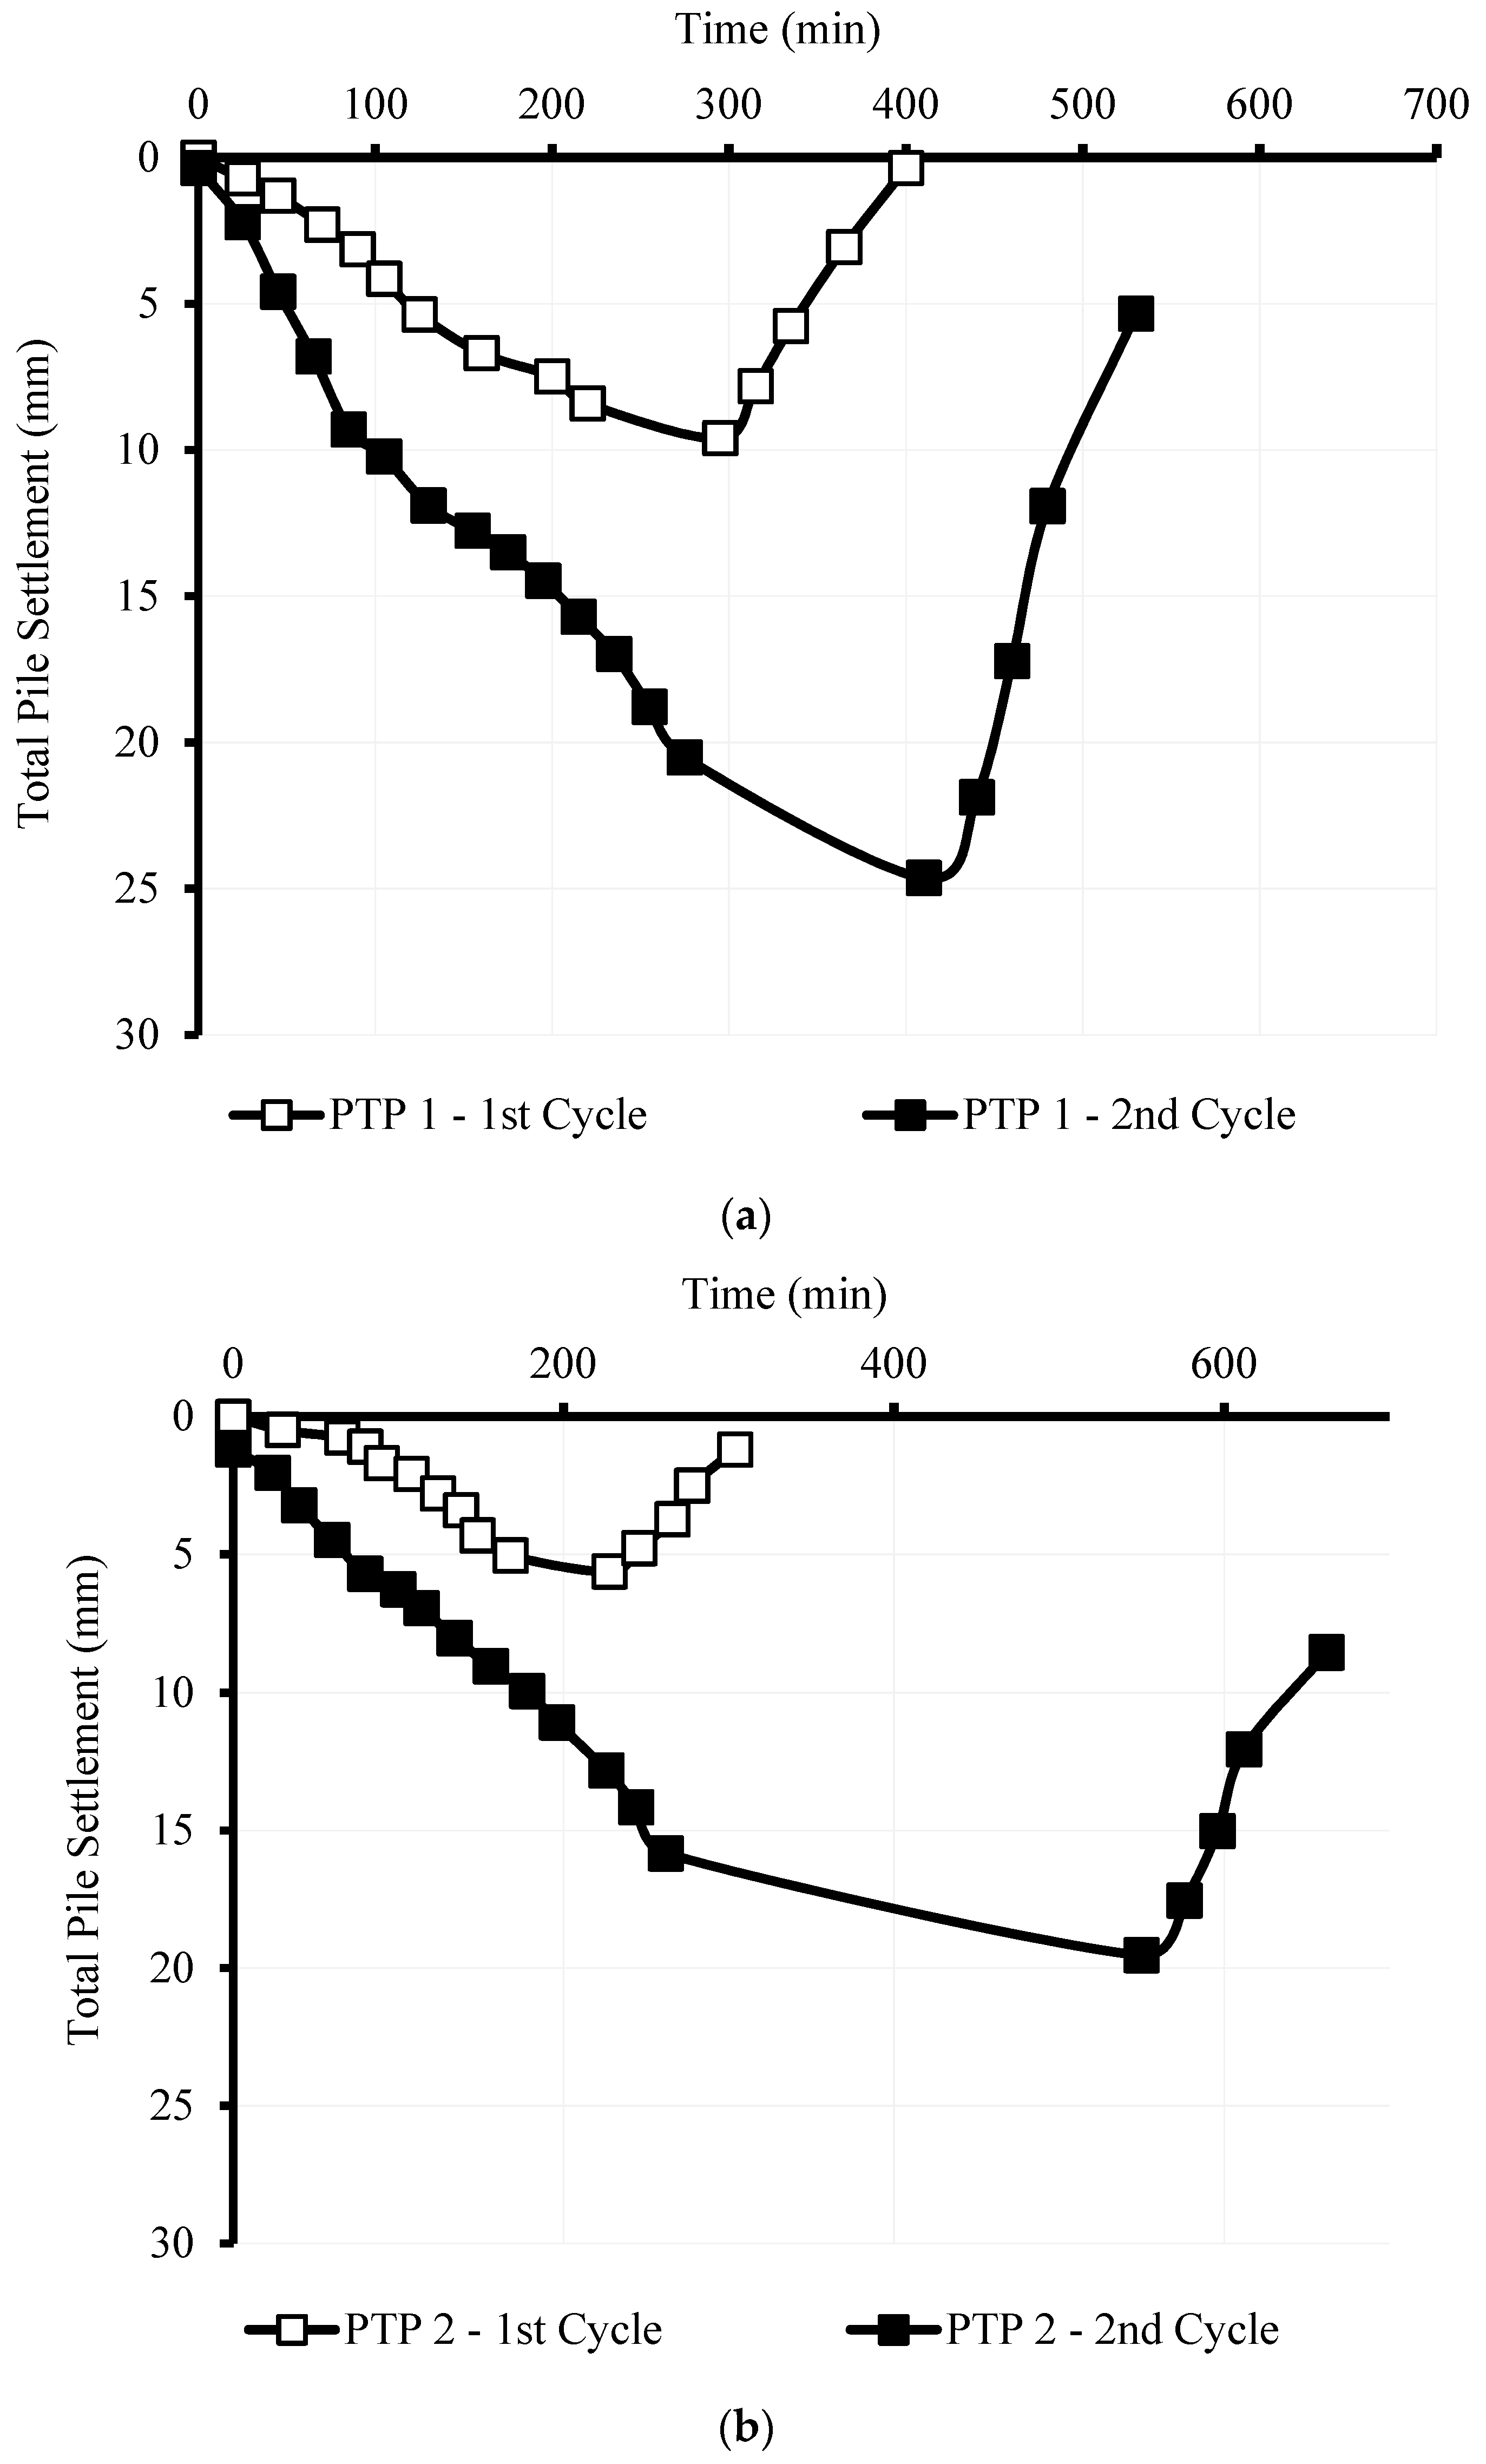
Distribution of concrete modulus has been measured from the stress–strain behavior of tested piles and using back analysis. In BP# 1, along with the pile, the E c value is almost constant at 25 kN/mm2, however, this value is between 30 and 45 kN/mm2 in BP# 2. This has indicated that the applied stress is the dominant factor in E c alteration because of the various soil reaction systems responding to the stresses released from the pile. The maximum change has been measured at the pile’s head where the maximum stresses have been recorded, in contrast, E c variation at the pile’s toe is negligible since the least stresses have been applied in the pile base. The stresses of the pile have been declined by the depth because the skin friction of the pile has carried a large portion of applied load in the pile. Maximum permanent (plastic) deformations of 24.63 mm and 19.54 mm have been measured in the pile head for BP# 1 & BP# 2 correspondent to applied stresses of 17305 kPa (p = 44306 kN) and 16430 kPa (p = 12905 kN). The pile top settlement has been rebounded to a residual value of 2.4 mm and 8.55 mm in BP# 1 & BP# 2 after unloading to zero.
The obtained result will be helpful for real-time assessment of bored pile during its service life. However, this should be noted that due to the heterogeneous characteristics of the soil, the measured Ec of the tested soil may vary. Variables such as concrete maturity, piling technology, soil parameters, and groundwater level can have a significant influence on the soil-pile interactions as well as concrete pile characteristics.

Author Contributions

Data collection and experimental works: H.M., B.K., H.N., Writing, discussion, analysis: H.M., A.S.A.R., and R.N., M.M.A.

Funding

This research has received funding from Ton Duc Thang University.

Conflicts of Interest

The authors declare no conflict of interest.

List of Abbreviations

CAPWAPcontrol and provisioning of wireless access points
D s shaft diameter
FEfinite element
FRPfiber-reinforced plastic
GIgalvanized iron
GSEglobal strain extensometer
HSDThigh strain dynamic testing
Llength
LVDTslinear variation displacement transducers
MARSmultivariate adaptive regression spline
MLTmaintained load test
PSEpile structure embankments
SPTstandard penetration test
SPT-Nstandard penetration test—number of blows
TBMtunnel boring machine
VWLCvibrating wire load cells
VWSGvibrating wire strain gauges

References

  1. Tomlinson, M.J.; Woodward, J. Pile Design and Construction Practice; Taylor & Francis: Boca Raton, FL, USA, 2003. [Google Scholar]
  2. Badrun, M. Prediction of Ultimate Bored Pile Capacity Using Global Strain Extensometer. Master’s Thesis, Faculty of Civil Engineering, Universiti Teknologi Malaysia, Skudai, Malaysia, 2011. [Google Scholar]
  3. Moayedi, H.; Hayati, S. Artificial intelligence design charts for predicting friction capacity of driven pile in clay. Neural Comput. Appl. 2018, 1–17. [Google Scholar] [CrossRef]
  4. Moayedi, H.; Nazir, R.; Mosallanezhad, M. Determination of reliable stress and strain distributions along bored piles. Soil Mech. Found. Eng. 2015, 51, 285–291. [Google Scholar] [CrossRef]
  5. Barr, L.; Wong, R.C.K. Shaft resistance of bored cast-in-place concrete piles in oil sand—Case study. Geomech. Eng. 2013, 5, 119–142. [Google Scholar] [CrossRef]
  6. Coduto, R. Foundation Design Principles And Practices; Prentice Hall: Englewood Cliffs, NJ, USA, 2001. [Google Scholar]
  7. Omer, J.R.; Delpak, R.; Robinson, R.B. An Empirical Method for Analysis of Load Transfer and Settlement of Single Piles. Geotech. Geol. Eng. 2010, 28, 483–501. [Google Scholar] [CrossRef]
  8. Fellenius, B.H.; Kim, S.R.; Chung, S.G. Long-term monitoring of strain in instrumented piles. J. Geotech. Geoenviron. Eng. 2009, 135, 1583–1595. [Google Scholar] [CrossRef]
  9. Moayedi, H.; Nazir, R.; Mosallanezhad, M.; Noor, R.B.M.; Khalilpour, M. Lateral deflection of piles in a multilayer soil medium. Case study: The Terengganu seaside platform. Measurement 2018, 123, 185–192. [Google Scholar] [CrossRef]
  10. Mosallanezhad, M.; Moayedi, H. Developing hybrid artificial neural network model for predicting uplift resistance of screw piles. Arab. J. Geosci. 2017, 10, 479. [Google Scholar] [CrossRef]
  11. Nazir, R.; Moayedi, H.; Mosallanezhad, M.; Tourtiz, A. Appraisal of reliable skin friction variation in a bored pile. Proc. Inst. Civ. Eng.-Geotech. Eng. 2015, 168, 75–86. [Google Scholar] [CrossRef]
  12. Nazir, R.; Moayedi, H.; Subramaniam, P.; Gue, S.-S. Application and Design of Transition Piled Embankment with Surcharged Prefabricated Vertical Drain Intersection over Soft Ground. Arab. J. Sci. Eng. 2018, 43, 1573–1582. [Google Scholar] [CrossRef]
  13. Niroumand, H.; Kassim, K.A.; Nazir, R.; Faizi, K.; Adhami, B.; Moayedi, H.; Loon, W. Slope stability and sheet pile and contiguous bored pile walls. Electron. J. Geotech. Eng. 2012, 17, 19–27. [Google Scholar]
  14. Brown, M.J.; Hyde, A.F.L.; Anderson, W.F. Analysis of a rapid load test on an instrumented bored pile in clay. Geotechnique 2006, 56, 627–638. [Google Scholar] [CrossRef] [Green Version]
  15. Brown, D.A.; O’Neill, M.W.; Hoit, M.; McVay, M.; El Naggar, M.H.; Chakraborty, S. Static and Dynamic Lateral Loading of Pile Groups; Transportation Research Board: Washington, DC, USA, 2001. [Google Scholar]
  16. Boulanger, R.W.; Curras, C.J.; Kutter, B.L.; Wilson, D.W.; Abghari, A. Seismic soil-pile-structure interaction experiments and analyses. J. Geotech. Geoenviron. Eng. 1999, 125, 750–759. [Google Scholar] [CrossRef]
  17. Gao, W.; Dimitrov, D.; Abdo, H. Tight independent set neighborhood union condition for fractional critical deleted graphs and ID deleted graphs. Discret. Contin. Dyn. Syst. Ser. 2018, 12, 711–721. [Google Scholar] [CrossRef]
  18. Moayedi, H.; Mosallanezhad, M.; Nazir, R. Evaluation of Maintained Load Test (MLT) and Pile Driving Analyzer (PDA) in Measuring Bearing Capacity of Driven Reinforced Concrete Piles. Soil Mech. Found. Eng. 2017, 54, 150–154. [Google Scholar] [CrossRef]
  19. Moayedi, H.; Nazir, R.; Ghareh, S.; Sobhanmanesh, A.; Tan, Y.C. Performance analysis of piled-raft foundation system of varying pile lengths in controlling angular distortion. Soil Mech. Found. Eng. 2018, 55, 265–269. [Google Scholar] [CrossRef]
  20. Gao, W.; Guirao, J.L.G.; Abdel-Aty, M.; Xi, W. An independent set degree condition for fractional critical deleted graphs. Discret. Contin. Dyn. Syst. Ser. 2019, 12, 877–886. [Google Scholar] [CrossRef] [Green Version]
  21. Hutchins, N.; Choi, K.S. Accurate measurements of local skin friction coefficient using hot-wire anemometry. Prog. Aerosp. Sci. 2002, 38, 421–446. [Google Scholar] [CrossRef]
  22. Ng, K.W.; Sritharan, S. A procedure for incorporating setup into load and resistance factor design of driven piles. Acta Geotech. 2016, 11, 347–358. [Google Scholar] [CrossRef]
  23. Hung, L.C.; Nguyen, T.D.; Lee, J.H.; Kim, S.R. Applicability of CPT-based methods in predicting toe bearing capacities of driven piles in sand. Acta Geotech. 2016, 11, 359–372. [Google Scholar] [CrossRef]
  24. Tafreshi, S.N.M.; Javadi, S.; Dawson, A.R. Influence of geocell reinforcement on uplift response of belled piles. Acta Geotech. 2014, 9, 513–528. [Google Scholar] [CrossRef] [Green Version]
  25. Mascarucci, Y.; Miliziano, S.; Mandolini, A. A numerical approach to estimate shaft friction of bored piles in sands. Acta Geotech. 2014, 9, 547–560. [Google Scholar] [CrossRef]
  26. Lee, C.; An, S.; Lee, W. Real-time monitoring of SPT donut hammer motion and SPT energy transfer ratio using digital line-scan camera and pile driving analyzer. Acta Geotech. 2014, 9, 959–968. [Google Scholar] [CrossRef]
  27. Ochiai, H.; Otani, J.; Matsui, K. Performance factor for bearing resistance of bored friction piles. Struct. Saf. 1994, 14, 103–130. [Google Scholar] [CrossRef]
  28. Poulos, H.G. Piled raft foundations: Design and applications. Geotechnique 2001, 51, 95–113. [Google Scholar] [CrossRef]
  29. Sego, D.C.; Biggar, K.W.; Wong, G. Enlarged base (belled) piles for use in ice or ice-rich permafrost. J. Cold Reg. Eng. 2003, 17, 68–88. [Google Scholar] [CrossRef]
  30. Shariatmadari, N.; Eslami, A.; Karimpour-Fard, M. Bearing capacity of driven piles in sands from SPT-applied to 60 case histories. Iran. J. Sci. Technol. Trans. B-Eng. 2008, 32, 125–140. [Google Scholar]
  31. Zhang, Q.Q.; Zhang, Z.M.; He, J.Y. A simplified approach for settlement analysis of single pile and pile groups considering interaction between identical piles in multilayered soils. Comput. Geotech. 2010, 37, 969–976. [Google Scholar] [CrossRef]
  32. Ruan, X.; Zuo, R.Y. Research on the Relationship between SPT and the ultimate vertical bearing capacity of jacked pile in Shenyang district. In Frontiers of Green Building, Materials and Civil Engineering, Pts 1-8; Sun, D., Sung, W.P., Chen, R., Eds.; Trans Tech Publications Ltd.: Stafa-Zurich, Switzerland, 2011; Volume 71–78, pp. 3308–3311. [Google Scholar]
  33. Samui, P. Multivariate adaptive regression spline applied to friction capacity of driven piles in clay. Geomech. Eng. 2011, 3, 285–290. [Google Scholar] [CrossRef]
  34. Samui, P. Determination of ultimate capacity of driven piles in cohesionless soil: A Multivariate Adaptive Regression Spline approach. Int. J. Numer. Anal. Methods Geomech. 2012, 36, 1434–1439. [Google Scholar] [CrossRef]
  35. Chae, D.; Cho, W.; Na, H.Y. Uplift Capacity of Belled Pile in Weathered Sandstones. Int. J. Offshore Polar Eng. 2012, 22, 297–305. [Google Scholar]
  36. Sakr, M. Comparison between high strain dynamic and static load tests of helical piles in cohesive soils. Soil Dyn. Earthq. Eng. 2013, 54, 20–30. [Google Scholar] [CrossRef]
  37. Zhang, Q.Q.; Zhang, Z.M.; Li, S.C. Investigation into Skin Friction of Bored Pile Including Influence of Soil Strength at Pile Base. Mar. Geores. Geotechnol. 2013, 31, 1–16. [Google Scholar] [CrossRef]
  38. Yao, W.J.; Chen, S.P. Elastic-plastic analytical solutions of deformation of uplift belled pile. Teh. Vjesn. 2014, 21, 1201–1211. [Google Scholar]
  39. Aksoy, H.S.; Gor, M.; Inal, E. A new design chart for estimating friction angle between soil and pile materials. Geomech. Eng. 2016, 10, 315–324. [Google Scholar] [CrossRef]
  40. Wang, C.D.; Zhou, S.H.; Wang, B.L.; Guo, P.J.; Su, H. Settlement behavior and controlling effectiveness of two types of rigid pile structure embankments in high-speed railways. Geomech. Eng. 2016, 11, 847–865. [Google Scholar] [CrossRef]
  41. Tosini, L.; Cividini, A.; Gioda, G. A numerical interpretation of load tests on bored piles. Comput. Geotech. 2010, 37, 425–430. [Google Scholar] [CrossRef]
  42. Zhang, R.K.; Shi, M.L.; Wang, J. Settlement Analysis of Single Large-Diameter and Super-Long Bored Piles in Cohesive Soils. Adv. Mater. Res. 2012, 594, 320–326. [Google Scholar] [CrossRef]
  43. Xu, M.J.; Ni, P.P.; Mei, G.X.; Zhao, Y.L. Load-settlement behaviour of bored piles with loose sediments at the pile tip: Experimental, numerical and analytical study. Comput. Geotech. 2018, 102, 92–101. [Google Scholar] [CrossRef]
  44. Zhou, J.J.; Gong, X.N.; Wang, K.H.; Zhang, R.H. Shaft capacity of the pre-bored grouted planted pile in dense sand. Acta Geotech. 2018, 13, 1227–1239. [Google Scholar] [CrossRef]
  45. Zhou, J.J.; Gong, X.N.; Zhang, R.H. Model tests comparing the behavior of pre-bored grouted planted piles and a wished-in-place concrete pile in dense sand. Soils Found. 2019, 59, 84–96. [Google Scholar] [CrossRef]
  46. Bojovic, D.; Basic, N.; Jankovic, K.; Senic, A. Assesment of concrete compressive strength using different maturity functions: case study. Gradevnski Mater. I Konstr. Build. Mater. Struct. 2018, 61, 55–65. [Google Scholar]
  47. Vazquez-Herrero, C.; Vilar, J.; Mendoza, C.J.; Meli, R.; Aire, C. Sustainable production of precast combined pile-cap and column elements via statistical analysis of self-compacting concrete kinetics. Constr. Build. Mater. 2018, 190, 326–341. [Google Scholar] [CrossRef]
  48. Zhang, W.G.; Goh, A.T.C.; Goh, K.H.; Chew, O.Y.S.; Zhou, D.; Zhang, R.H. Performance of braced excavation in residual soil with groundwater drawdown. Undergr. Space 2018, 3, 150–165. [Google Scholar] [CrossRef]
  49. Chisari, C.; Bedon, C.; Amadio, C. Dynamic and static identification of base-isolated bridges using Genetic Algorithms. Eng. Struct. 2015, 102, 80–92. [Google Scholar] [CrossRef]
Figure 1. Displacement and force of loaded bored pile–soil; (a) schematic representation, (b) forces on a pile element in “equilibrium., (c) force details in element with length of δ z .
Applsci 09 03060 g001
Figure 2. Schematic view of the maintained load test (MLT)
Applsci 09 03060 g002
Figure 3. Variation of the total applied static stress on pile versus time, (a) Bored pill (BP)# 1 and (b) BP# 2.
Applsci 09 03060 g003aApplsci 09 03060 g003b
Figure 4. Cross-section of BP# 1 (D = 1,800 mm) and BP# 2 (D = 1,000 mm).
Applsci 09 03060 g004
Figure 5. Various instrumental installments at different global strain extensometer sensors levels in BP# 1.
Applsci 09 03060 g005
Figure 6. Vibrating wire strain gauges and tell-tales’ extensometer arrangement in BP# 2.
Applsci 09 03060 g006
Figure 7. VWSG attached to the steel cage.
Applsci 09 03060 g007
Figure 8. The electrical lead wires from the sensors come to the top.
Applsci 09 03060 g008
Figure 9. global strain extensometer pipe for tell-tales extensometer is pre-installed at VWSG.
Applsci 09 03060 g009
Figure 10. Existing platform in full-scale maintenance of the pile load test.
Applsci 09 03060 g010
Figure 11. Stress distribution measured along BP# 1 in (a) 1st cycle and (b) 2nd cycle.
Applsci 09 03060 g011aApplsci 09 03060 g011b
Figure 12. Stress distribution measured along BP# 2 in (a) 1st cycle and (b) 2nd cycle.
Applsci 09 03060 g012aApplsci 09 03060 g012b
Figure 13. Distribution of average change in strain measured along BP# 1 in (a) 1st cycle and (b) 2nd cycle.
Applsci 09 03060 g013
Figure 14. Distribution of average change in strain measured along BP# 2 in (a) 1st cycle and (b) 2nd cycle.
Applsci 09 03060 g014
Figure 15. Distribution of back-calculated elastic modulus of concrete, E c ( kN / mm 2 ) for BP# 1; (a) 1st cycle and (b) 2nd cycle.
Applsci 09 03060 g015
Figure 16. Distribution of back-calculated elastic modulus of concrete, E c ( kN / mm 2 ) for BP# 2; (a) 1st cycle and (b) 2nd cycle.
Applsci 09 03060 g016
Figure 17. Average number of standard penetration test and the unit skin friction in BP# 1 and BP# 2.
Applsci 09 03060 g017
Figure 18. Different applied stresses versus total pile top settlement in (a) BP# 1 and (b) BP# 2.
Applsci 09 03060 g018
Figure 19. Different applied stress versus total pile base settlement in (a) BP# 1 and (b) BP# 2.
Applsci 09 03060 g019
Figure 20. Variation of the total pile settlement versus time during pile test in (a) BP# 1 and (b) BP# 2.
Applsci 09 03060 g020
Table 1. Instrumental bored pile load test summary.
Pile NoDiameter (mm)Working Load (kN)Pile Length (m)Pile Area (m2)Test Load (kN)Type of Instrument
BP# 1180022,20036.952.544744,400GSE
BP# 21000675032.560.785413,500Conventional
Table 2. Soil profile for tested bored pile after the standard penetration test (SPT).
Test Pile Soil StratumDepth (m)SPT-N Values *Average SPT-N
BP# 1L1Stiff Sandy Silt with little gravel0–83–1615.50
L2Very Stiff Sandy Silt with little gravel8–1016–5027.5
L3Hard Yellowish Sandy Silt with little gravel10–1750–111110
L4Hard Yellowish Sandy Silt with little gravel17–24111–150122
L5Fractured limestone24–36.95143–150150
BP# 2L1Sandy SILT0–124–3030
L2Sandy CLAY12–1719–39 39
L3SILT18–2354–125122
L4Weathered Sandstone25–31.65176–200195
* Note: SPT-N is the number of SPT driven into the ground (e.g., at the bottom of a borehole) by blows from a slide hammer with a mass of 63.5 kg.

