Article

An IoT-Based Non-Invasive Glucose Level Monitoring System Using Raspberry Pi

by
Antonio Alarcón-Paredes
1,
Victor Francisco-García
1,
Iris P. Guzmán-Guzmán
2,
Jessica Cantillo-Negrete
3,
René E. Cuevas-Valencia
1 and
Gustavo A. Alonso-Silverio
1,*
1
Facultad de Ingeniería, Universidad Autónoma de Guerrero, Chilpancingo 39087, Mexico
2
Facultad de Ciencias Químico–Biológicas, Universidad Autónoma de Guerrero, Chilpancingo 39087, Mexico
3
Division of Medical Engineering Research, Instituto Nacional de Rehabilitación “Luis Guillermo Ibarra Ibarra”, Mexico City 14389, Mexico
*
Author to whom correspondence should be addressed.
Appl. Sci. 2019, 9(15), 3046; https://doi.org/10.3390/app9153046
Submission received: 29 June 2019 / Revised: 18 July 2019 / Accepted: 26 July 2019 / Published: 28 July 2019

Abstract

:
Patients diagnosed with diabetes mellitus must monitor their blood glucose levels in order to control the glycaemia. Consequently, they must perform a capillary test at least three times per day and, besides that, a laboratory test once or twice per month. These standard methods pose difficulty for patients since they need to prick their finger in order to determine the glucose concentration, yielding discomfort and distress. In this paper, an Internet of Things (IoT)-based framework for non-invasive blood glucose monitoring is described. The system is based on Raspberry Pi Zero (RPi) energised with a power bank, using a visible laser beam and a Raspberry Pi Camera, all implemented in a glove. Data for the non-invasive monitoring is acquired by the RPi Zero taking a set of pictures of the user fingertip and computing their histograms. Generated data is processed by an artificial neural network (ANN) implemented on a Flask microservice using the Tensorflow libraries. In this paper, all measurements were performed in vivo and the obtained data was validated against laboratory blood tests by means of the mean absolute error (10.37%) and Clarke grid error (90.32% in zone A). Estimated glucose values can be harvested by an end device such as a smartphone for monitoring purposes.

Graphical Abstract

1. Introduction

The Internet of Things (IoT) is a paradigm in which different devices used on a day-to-day basis have the ability to communicate with other devices, whether or not they are of the same type, with the aim of providing services through the internet. These devices can be household objects (lamps or appliances), street objects, or embedded devices especially created for particular applications; they are all called “things”. Things not only acquire information from the environment and interact with the physical world, but also they can be equipped with identification, measurement, and process capabilities to provide context-aware services for achieving specific goals for information analytics, communications and final applications [1,2,3].
Since its inception, the IoT has been globally growing exponentially, bringing a broad spectrum of possible applications, from education [4,5], the energy industry [6,7], business decision making [8,9], smart cities [10,11,12], air quality monitoring [13,14,15], among others.
Despite the fact that the IoT has been extensively applied to almost every area in everyday life, it has also brought the opportunity to tackle problems in priority domains. Regarding this, the development and modernisation of health services constitute a major challenge for healthcare optimisation. In a broader context, IoT technologies can be used for obtaining a solid infrastructure for recording, transmitting and processing large volumes of heterogeneous medical data generated from different types of sources, sensors and medical devices thus strengthening health services: e-health, telemedicine, people care and patient monitoring, which can be used at home, in hospitals or at external centres. The enhanced quality, and thus the acceptance, of e-health services have evolved jointly with hospital modernisation [16,17,18,19].
One of the current applications of e-health in developed countries deals with the monitoring for both sick and healthy people in a range of disciplines: sports medicine, elderly health, chronic diseases monitoring, or disabled patients. This situation differs significantly in developing countries, in which the death rates are very high due to lack of monitoring and timely medical attention and treatments, where the majority of these deaths are preventable through quality care improvement. Due to the medical field is one of the areas with more potential for the use of IoT, there is an increasing interest in healthcare applications. Pervasive e-health applications use body sensor networks that may generate or record a vast amount of data that needs to be managed and stored for processing and future usage. To this end, there are many different electronic devices based on system-on-chip that permit the monitoring of a patient or a group of patients by sensing their biosignals information for being aware of their well-being [20,21,22].
According to the World Health Organization (WHO), the epidemic of diabetes mellitus (DM) in Mexico is catalogued as a national emergency. DM is a chronic non-communicable disease in which the body is unable to regulate blood glucose levels. There are two main types of diabetes: diabetes type-1 occurs when the pancreas is incapable to produce insulin, or produces only a scarce amount; insulin is essential to regulate the glucose concentration in blood and to convert glucose into energy. Diabetes type-2 takes place when the body cannot effectively use the insulin, and it is proliferating worldwide more rapidly than type-1 [23,24]. Standard methods for measuring the blood glucose concentration are invasive, since they require either to collect a blood sample for a laboratory test, or to prick the fingertip for a capillary test. A capillary test is often used for monitoring due to its ease of use. However, patients require pricking their finger in different moments of the day, yielding discomfort and distress, thus hindering a proper glycaemia control.
Facing this problem, minimally invasive glucometers have been developed. Some of the commercially available include the Gluco Track, a registered trade mark from Integrity Applications Ltd. Israel, which uses a combination of ultrasonic and thermal technology to measure glucose from the earlobe, but requires individual calibration [25]; and the FreeStyle Libre developed by Abbott Diabetes Care Inc. USA, to determine glucose levels in adults, but still have a high false positive rate for hypoglycaemia [26].
Non-invasive commercial monitors are still in development, such as the SugarBEAT by Nemaura Medical Inc. UK that performs the glucose measurement using a disposable skin-patch connected to its own transmitter. MediWise Ltd. United Kingdom releases the GlucoWise, which works by transmitting low power radio waves through the earlobe [26]. In addition, the smart contact lens developed by Google uses the tear fluid for measuring the glucose concentration [27].
The technologies used by non-invasive glucose monitoring systems addressed in previous works are mainly transdermal, thermal and optical. The transdermal glucose estimation is performed by sonophoresis, reverse iontophoresis or ultrasound [25,28]. The thermal approaches aim to estimate glucose concentrations by measuring the physiological response to thermal emissions, due to glucose having absorptive effects on the heat radiation that are directly related to its concentration [28,29]. In optical methods, a light beam is directed to human tissue and the energy absorption, reflection or scattering is used to estimate the glucose concentration [30]. Commonly, optical methods are preferred due to its simplicity and that small laser diodes can be used to construct portable and inexpensive devices. Besides, other technologies such as transdermal sensors need a thorough calibration process and are more susceptible to non-controlled environment [25,31,32]. However, there is a range of factors that affect the glucose estimation, such as sweating, skin roughness, ambient temperature or pressure. For this reason, the search for newly and more accurate non-invasive technologies, is still underway [28,31].
Scientific efforts have been directed to develop non-invasive glucose meters and systems, from which optical technologies have gained attention [30], near infrared (NIR) [33,34], Raman [35,36], and Fourier transform infrared (FTIR) [30] spectroscopy are among the most investigated. On a regular basis, the systems referring to the state-of-the-art share similar components: (i) an energy source by a light beam in certain wavelength, commonly interacting with (ii) a medium or region of interest in the body, (iii) a module with signal acquisition sensors, (iv) a microcontroller or signal processor, and (v) an element where the result will be displayed. However, the choice of both the characteristic of components (i)–(iv) and the physical principle on which the system is built, leads to very different results. Depending on the sensor used for this purpose, optical techniques analyse the medium (e.g., fingertip or ear lobe) based on the reflection, refraction, dispersion or absorption of the light beam provided by the energy source. Previous works have mainly considered the use of energy sources with wavelengths in the near infrared range.
In this paper, an IoT-based monitoring framework for non-invasive blood glucose monitoring is described. Data for the non-invasive monitoring is acquired taking a picture of the user’s fingertip using the camera of a Raspberry Pi Zero (RPi), and then data is processed by a neural network implemented using the Tensorflow libraries in a Flask microservice. The estimated glucose values can be harvested by an end device such as a smartphone for monitoring purposes, or by any other end device allowing the opportunity for different potential applications.

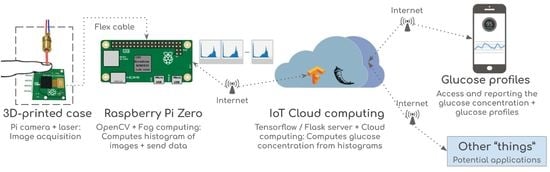
2. Proposed Internet of Things (IoT) Glucose Monitoring System
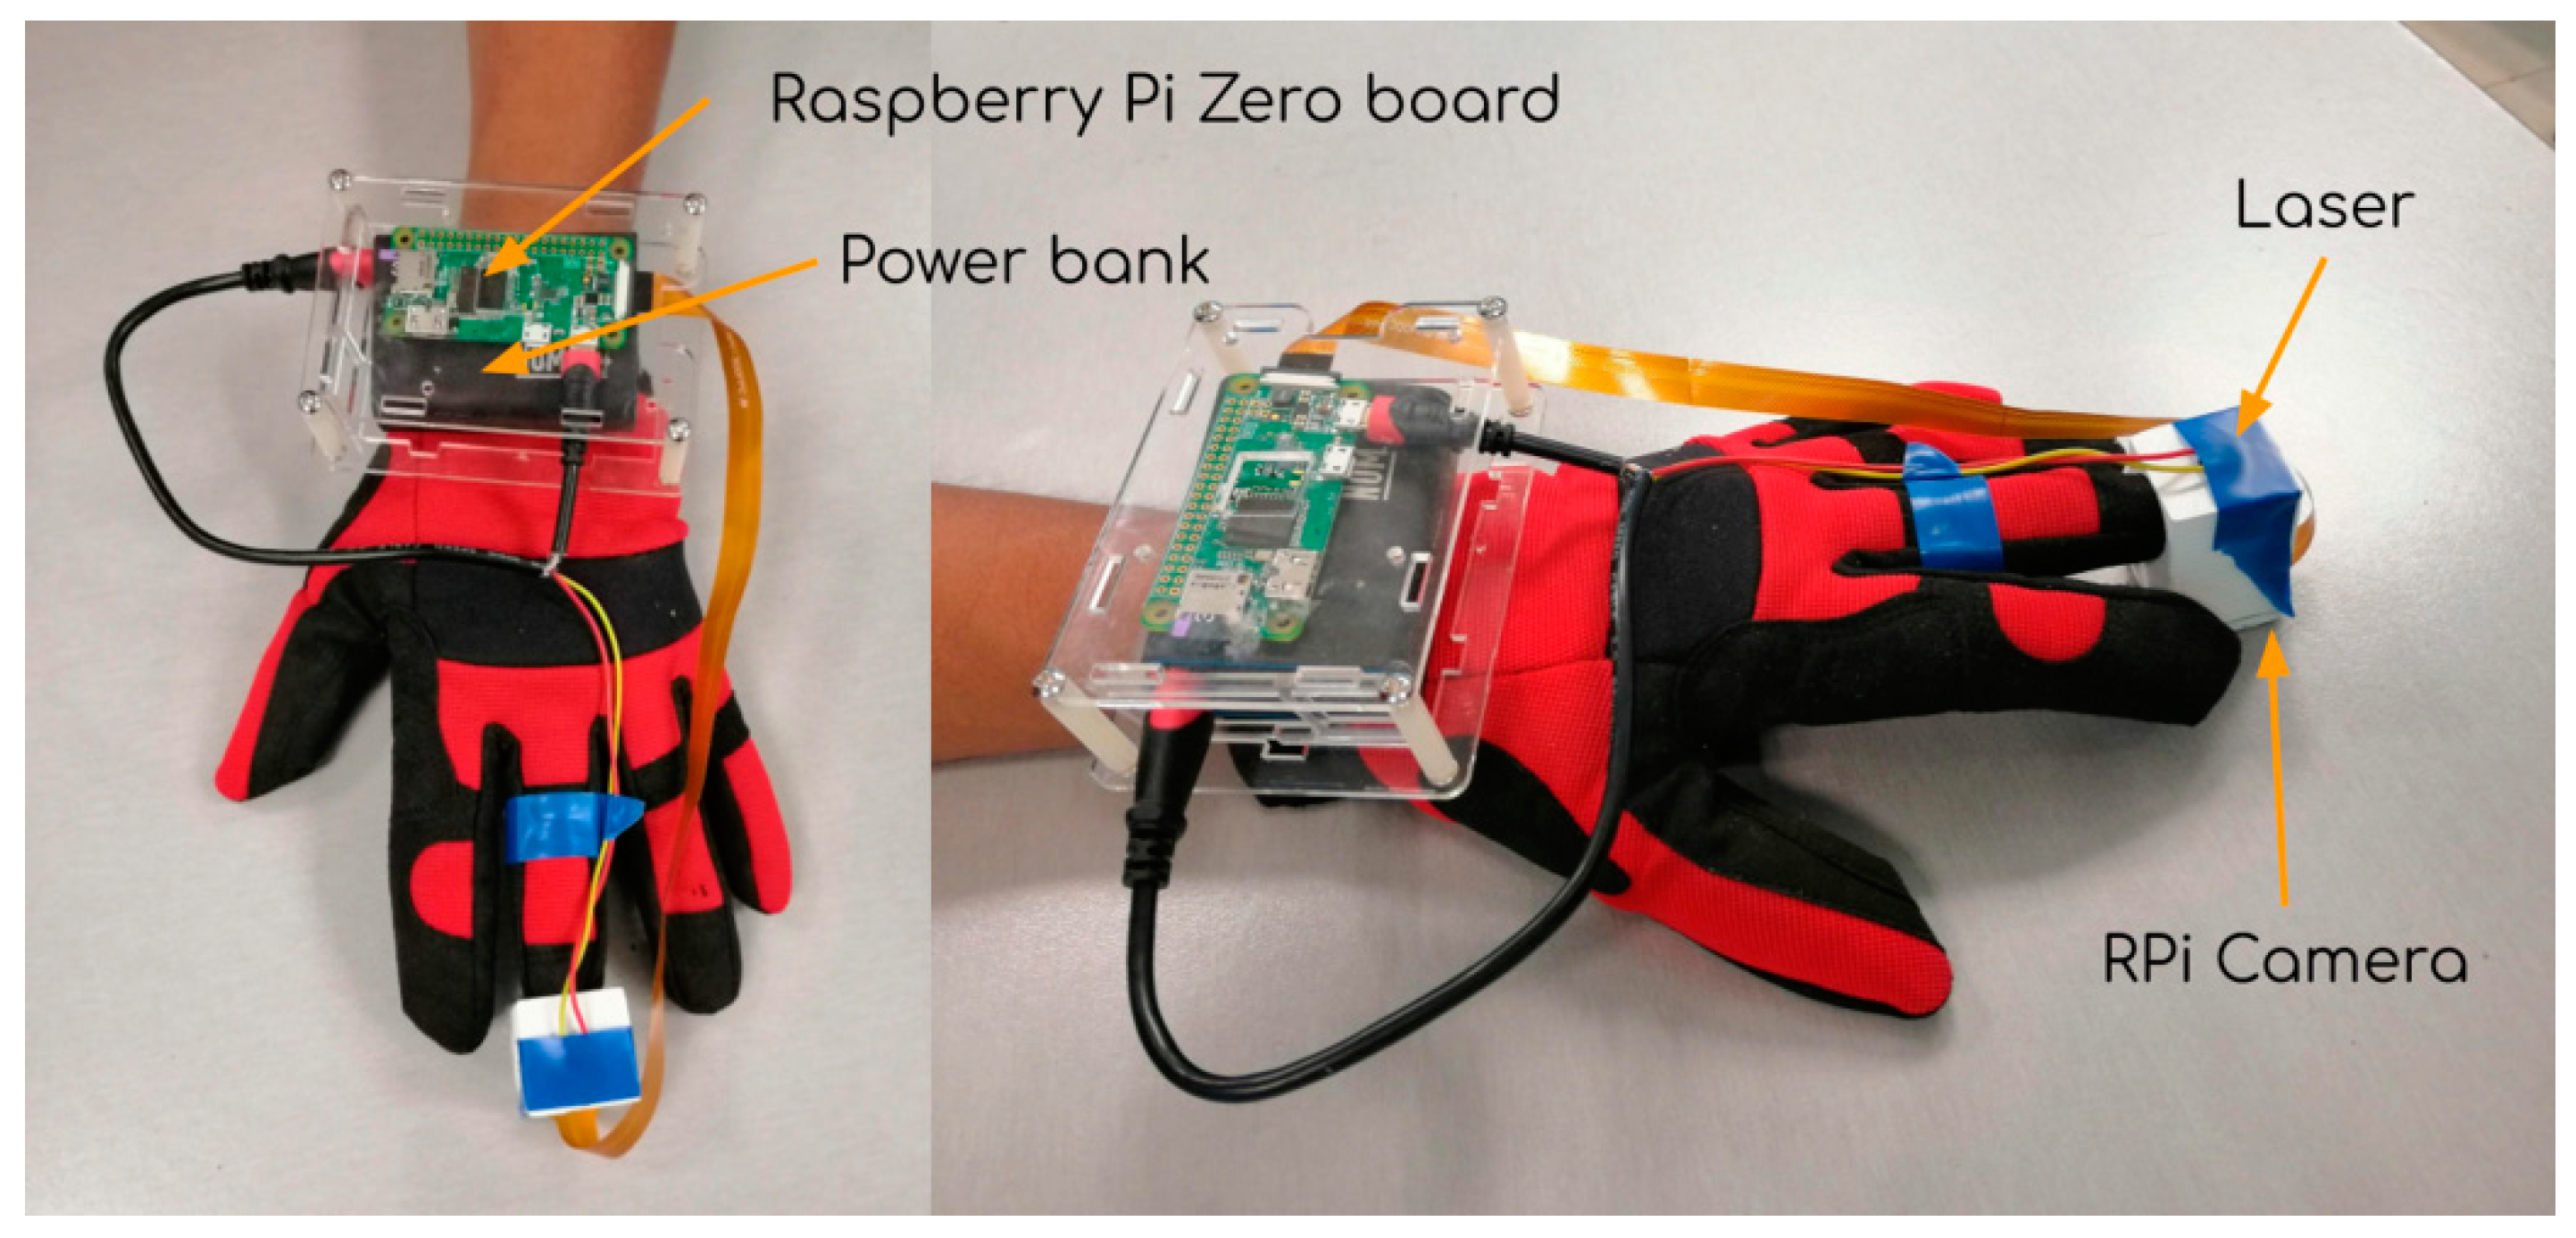
The glucose estimation method described in the present work consists of a non-invasive optical analysis in which a laser beam is pointed to the user’s fingertip, while for capturing the transmitted light response, an RPi camera was used.
Previous works use different body tissues (e.g., forearm, ear lobe, finger, cheek) for non-invasive glucose measurement. However, due to its high capillary density and its ease of implementation [31], the fingertip was selected as the most convenient for the present study. For this reason, the proposed system was instrumented on a glove, where the Raspberry Pi Zero (RPi) board was placed in an acrylic case attached to the carpal area, whereas a 3D-printed case housing the image acquisition setup was placed at the index fingertip.
The proposed system considers four stages, as depicted in Figure 1. Correspondingly, the materials and methods used to this aim are explained in detail below.

2.1. Materials

A Raspberry Pi Zero board was used for image acquisition, histogram calculation and for sending data through the internet. It is a platform based on a Broadcom BCM2835 system on a chip, including an ARM11 1GHz single-core CPU and 512 MB of RAM, with a micro SD slot card memory and CSI (camera serial interface) connector. It also includes connectivity with an 802.11 b/g/n wireless LAN (Local Area Network), and Bluetooth 4.1.
Consequently, a Raspberry Pi camera Rev 1.3 was used for taking the pictures. It is plugged directly to the CSI connector in the RPi, and is able to obtain images up to 2592 × 1944 pixels, having a 5 MP resolution with the Omnivision 5647 sensor in a fixed focus mode. The camera size is around 25 mm × 20 mm × 9 mm and weighs 3 g.
The laser used as energy source is a 650 nm visible-wavelength which operates at 5 V with output power of 5 mW. The beam light has a dot shape and estimated useful life of 2000 h. The decision of using a visible light rather than infrared (IR) or near-infrared (NIR) was made on the basis of previous studies demonstrating that lasers in a visible wavelength have a great capability of penetrating the skin of a human finger [37].
With the aim of energizing the RPi board and the laser, a power bank was used as power supply. It has a capacity of 10,000 mAh, 5 V input/output, size of 72.4 mm × 50 mm × 22.6 mm and has enough power to keep running the acquisition module for about 35 h.
In order to house the system, two cases were used: one, 3D-printed, embedding the laser and the camera used for light condition controlling, and other one for enclosing the RPi, both attached to the glove. This glove represents the main embodiment of the system in order to keep the laser-camera and the Raspberry Pi Zero board altogether.

2.2. Methods

The Beer–Lambert law [38] is an optic measure considering the relationship between the absorbance and the amount of a material. It permits to compute the amount of a material in a sample by using its absorbance rate, so the light absorption of a material is proportional to the quantity of the same material. The Beer–Lambert law expresses how the light is absorbed by matter: (a) the intensity of transmitted light decreases exponentially as concentration of the substance in the solution increases, and (b) the intensity of transmitted light decreases exponentially as the distance travelled through the substance increases [38,39]. This formulation was used as the main principle for measuring the glucose concentration in a blood sample by passing a laser-beam through the fingertip. A simplified model of this law is shown in Equation (1):
absorption = intensity   of   incident   light intensity   of   transmitted   light
The artificial neural network (ANN) used for estimating the blood glucose concentration was constructed and trained using Tensorflow [40], which is an open-source platform for deep learning and machine learning developed and maintained by Google. It allows the creation of a variety of neural network models applied to multidimensional data arrays, referred to as tensors. Some of its main features include that can run on multiple central processing units (CPUs) but also on GPUs (General purpose Graphical Processing Unit), and can be implemented with C++, Python and Java.
The ANN was implemented on a Flask server [41], a microframework for Python which allows the creation of web APIs (Application Programming Interfaces) for a variety of applications. Here, the Flask server is used to provide Python microservices to be consumed by the end device.

2.3. Data Acquisition

It contemplates the incorporation of two elements: the RPi camera and the 650 nm laser both embedded in a 3D-printed case and attached to the index fingertip of the glove, as told before. The laser-beam is fixed internally to the case, facing to the camera lens, with enough space in between for enclosing the fingertip of a person adequately.
This setup is intended for data acquisition but also to characterise how the incident laser-beam interacts with the finger. To this end, there are some things to take into consideration:
  • The laser-beam is used as the energy source to pass throughout the medium.
  • The finger is the medium through which the light will be transmitted.
  • The camera acts as the sensor responsible to capture the transmitted light and how it is scattered along the finger.
In this stage, fingertip images of size 640 × 480 px are taken, in time intervals of 8 s for allowing the camera to perform a precise focus. This process is carried out in a period of 2 min, thus acquiring a total of 14 images. Caused by the act of putting and removing the finger, the first and last images may not be captured properly, entailing errors in future stages. For this reason, the system only takes into consideration the central 12 images, discarding the first and last.
The camera configuration used in this proposal was set to night exposure mode, with camera exposure compensation of 25, ISO sensitivity of 800 and values for brightness and contrast of 70.

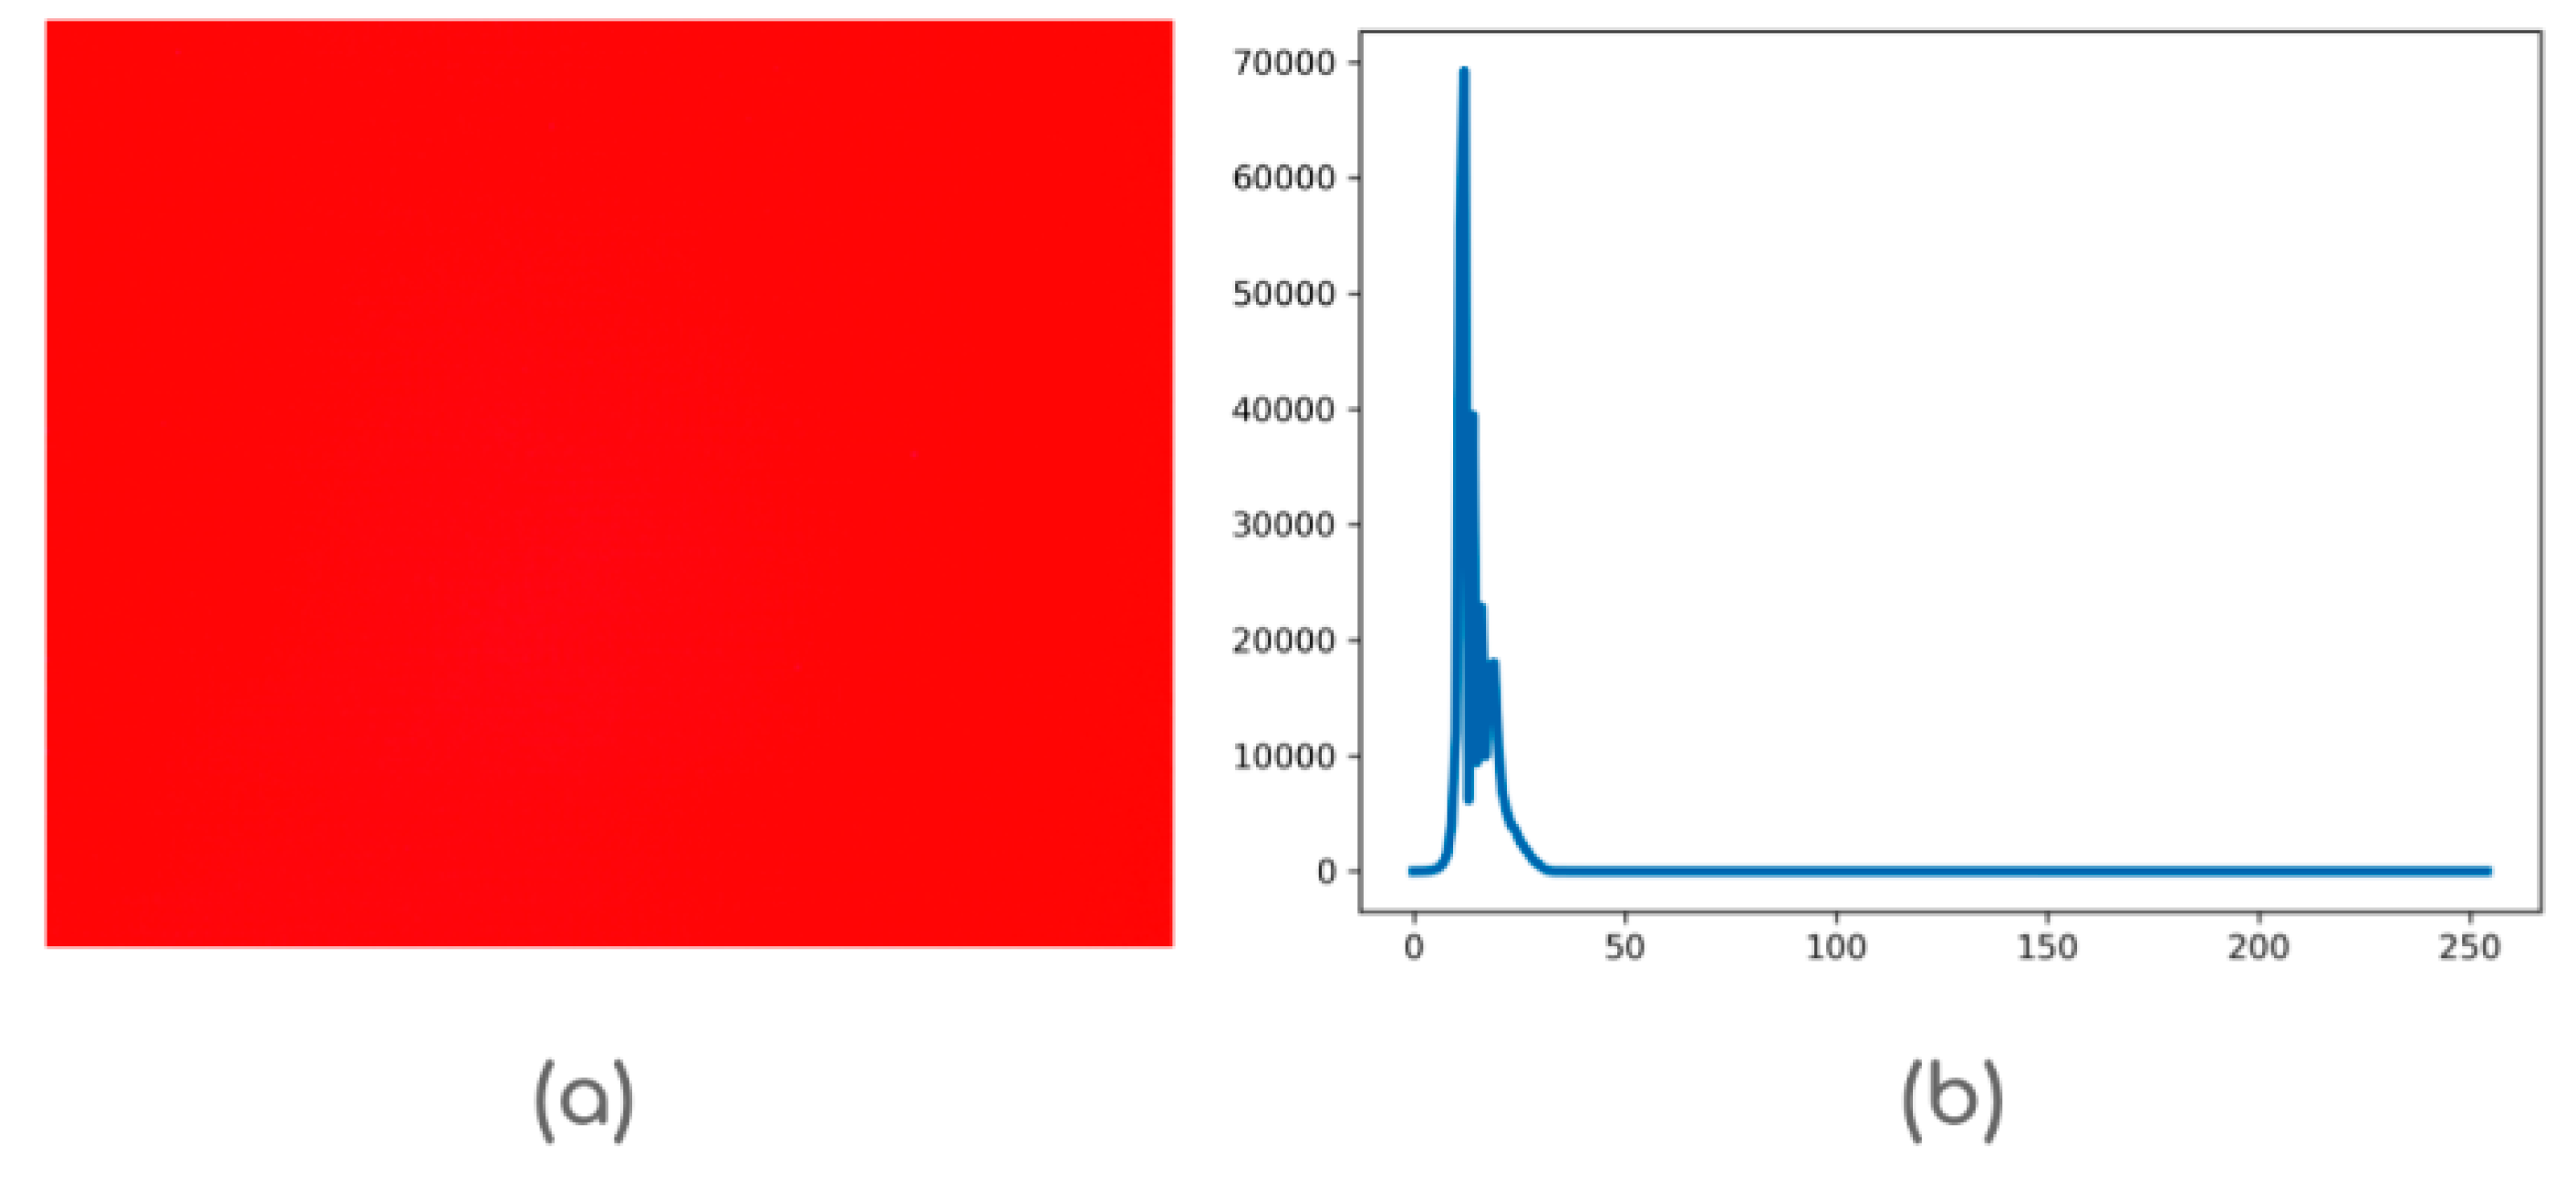
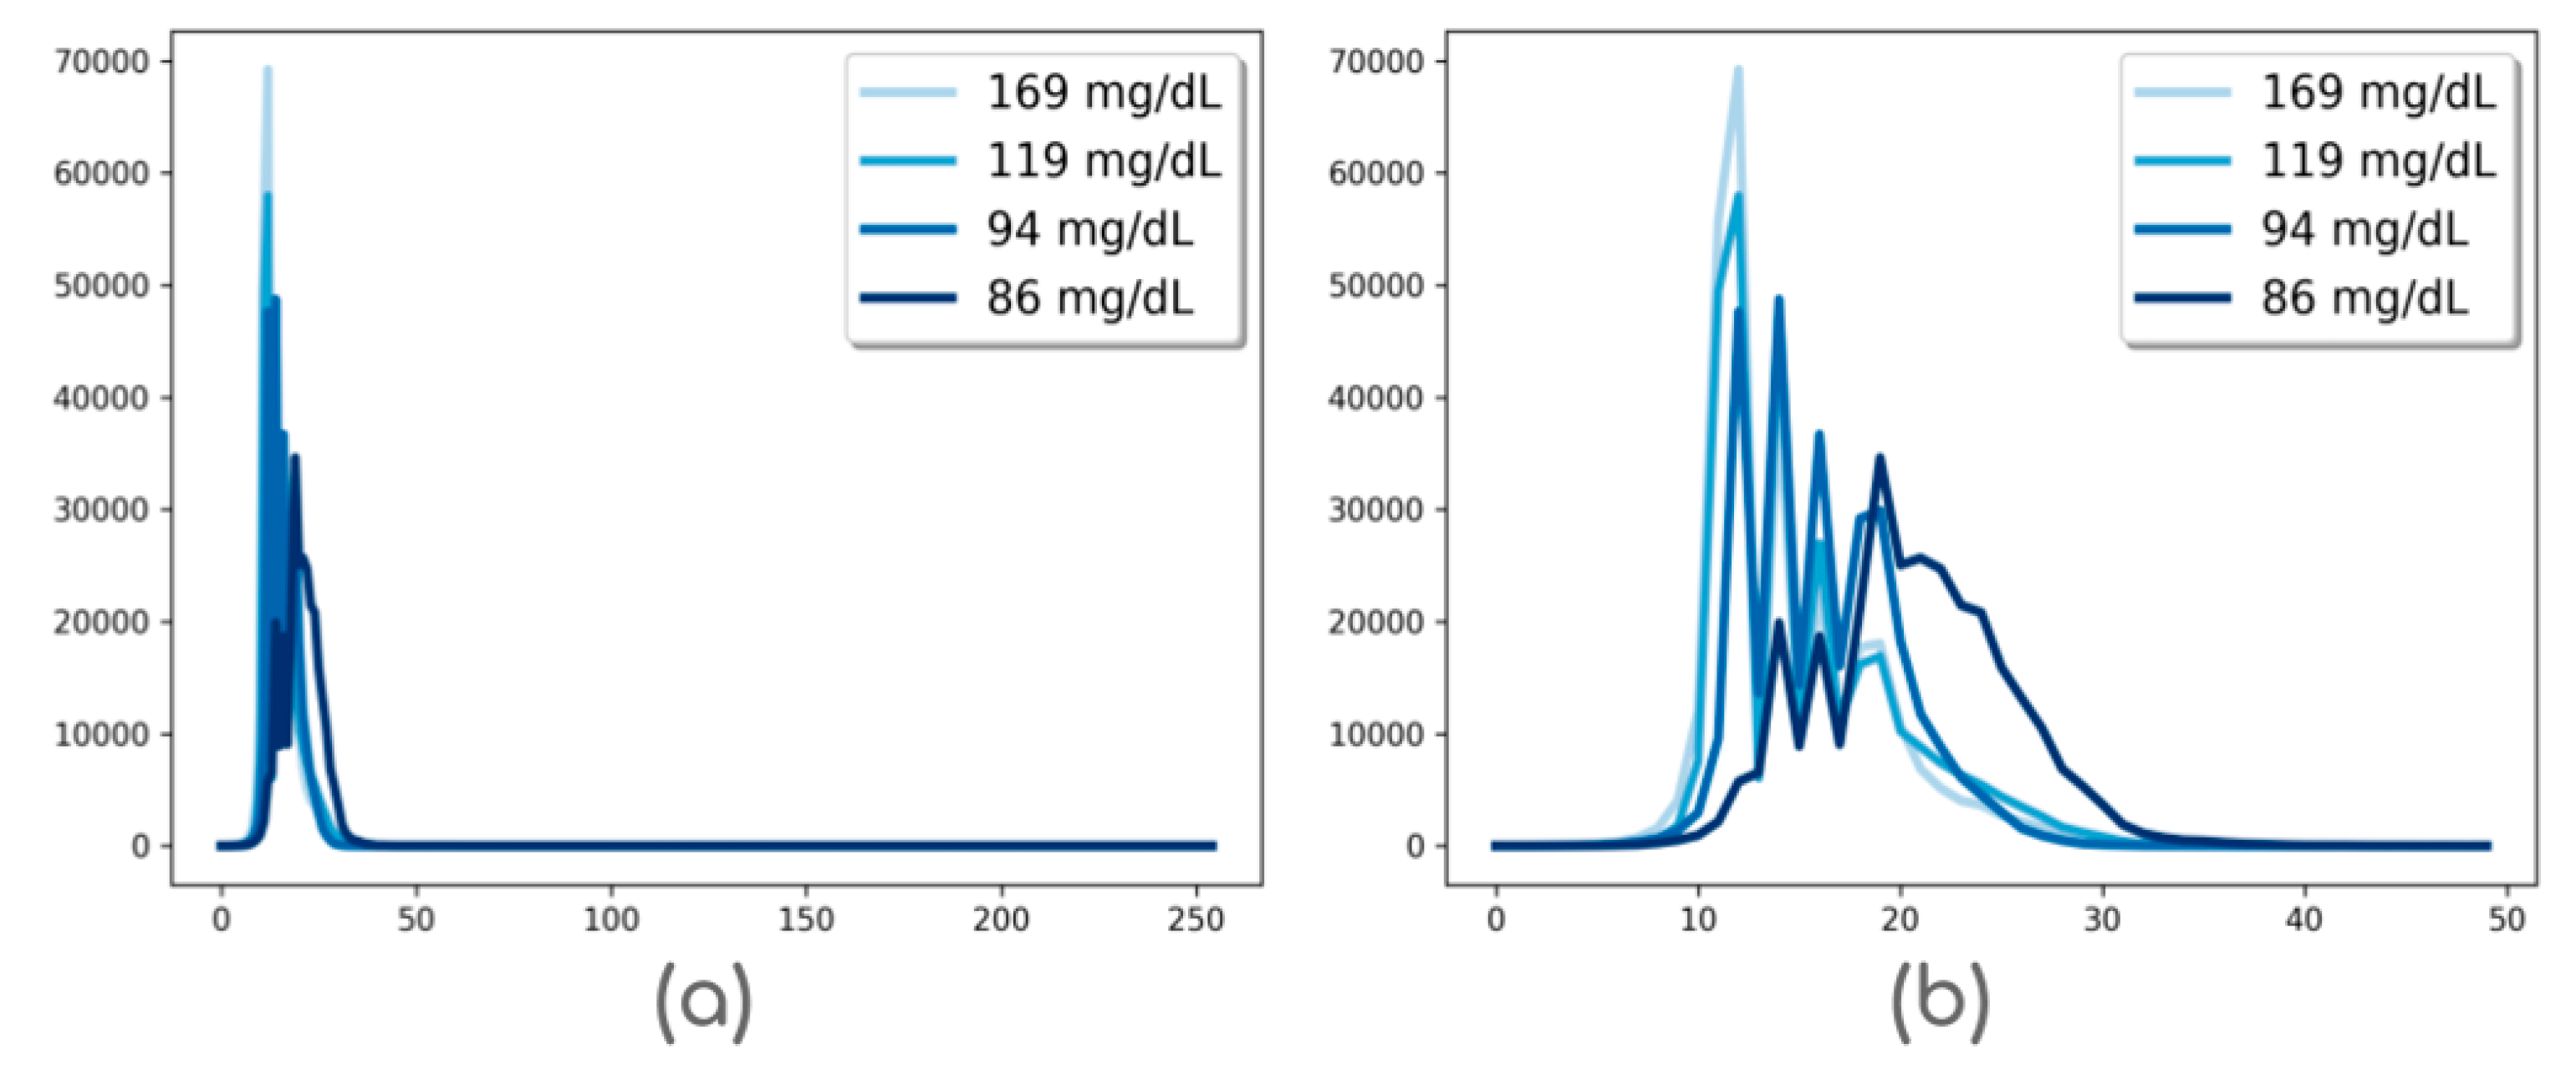
2.4. Histogram Calculation

In general, image histograms provide global information about its intensity values, and are useful for enhancing images. Histograms are also a measure of data distribution that allows, among other things, analysis of its dispersion in different ways.
In the context of the proposed work, the histogram is used as a descriptor of the acquired images that, at that time, represent the intensity values of the light that has been transmitted through the finger. Correspondingly, it is noticeable that by using the histogram as image descriptor, the analysis of light scattering in the finger is inherent.
Major variations on glucose levels can be found in the time interval between fasting and a couple of hours after having a meal. In a previous work [42], a set of experiments with the red, green and blue histograms of fingertip images of users with 8 h fasting and two hours after they had meal were carried out. The blue histograms reported statistically significant variations according to Mann-Whitney statistical test [43]. To this regard, the use of histograms of the blue channel was considered in this paper.
With the aim of performing an efficient data transmission, the histogram of the blue channel in the acquired images is computed directly on the RPi before broadcasting data to the IoT cloud computing stage. With this, instead of transmitting the whole image, i.e., more than three hundred thousand data, only 256 values are sent for each image, substantially reducing the data transmission latency.

2.5. IoT Cloud Computing

2.5.1. Model Selection

Before implementing the whole model, a model selection set of experiments were performed. In order to do this, an ANN was trained using the Tensorflow library in Python programming language. In this regard, experiments for model selection were carried out taking into account the following points:
  • Participants: A total of 514 healthy subjects, with age ranging from 18–44 years, and averaging 28 ± 5.2 years, were invited on a random basis to be part of this study. The training set is constituted by 514 histograms, each representing the average of the 12 histograms acquired for all subjects. Participants of this study were of different skin colour for increasing the variability of the sample, thus making the training data set representative of this region.
  • ANN structure: The ANN used in this work is composed of 256 input neurons—the histogram values—and 2 hidden layers, each one composed of 1024 neurons, whereas the output layer has only one neuron corresponding to the glucose concentration value. At the end of both hidden layers, a 0.20 dropout was considered. The activation functions used in this model were ReLU [44] in all cases.
  • ANN configuration: The ANN was trained using the ADAM method for error minimisation [45]. A total of 100 epochs with a 50 batch size were also considered.
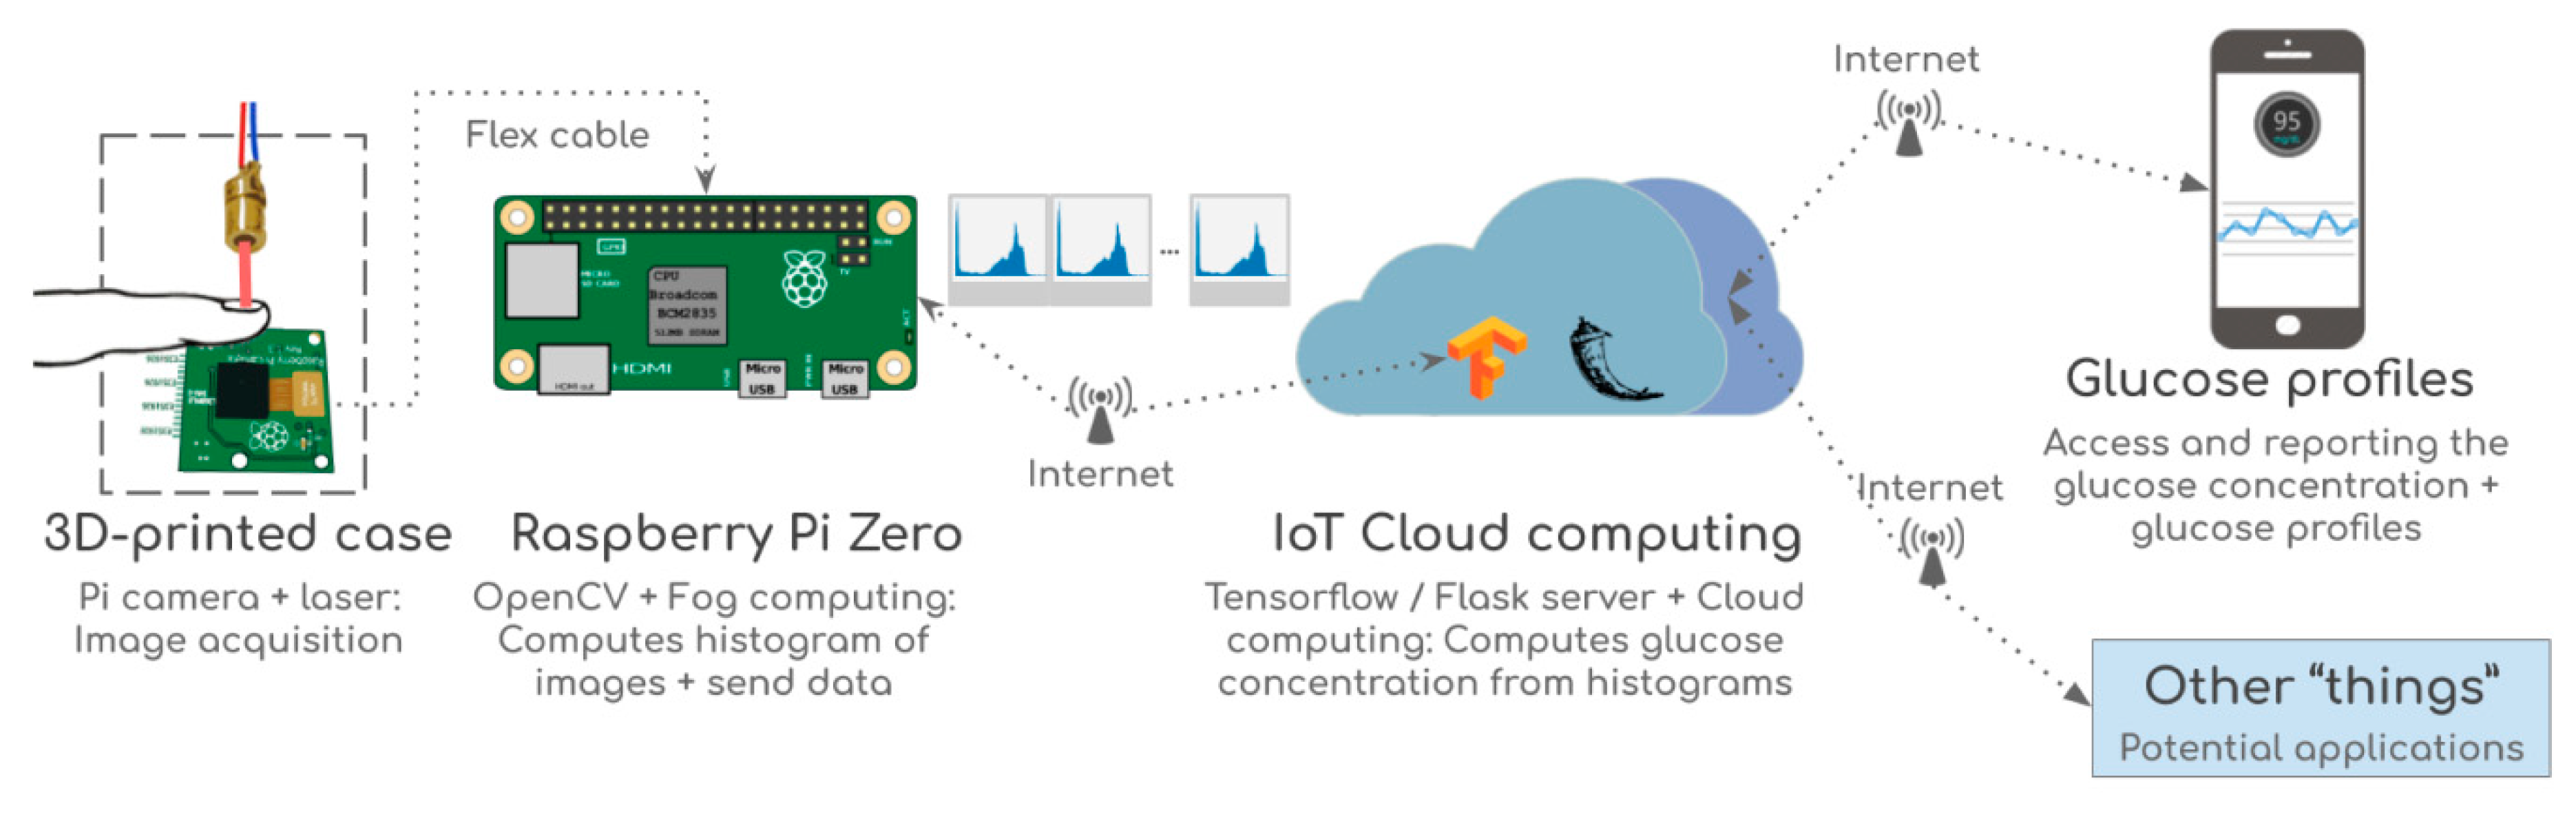
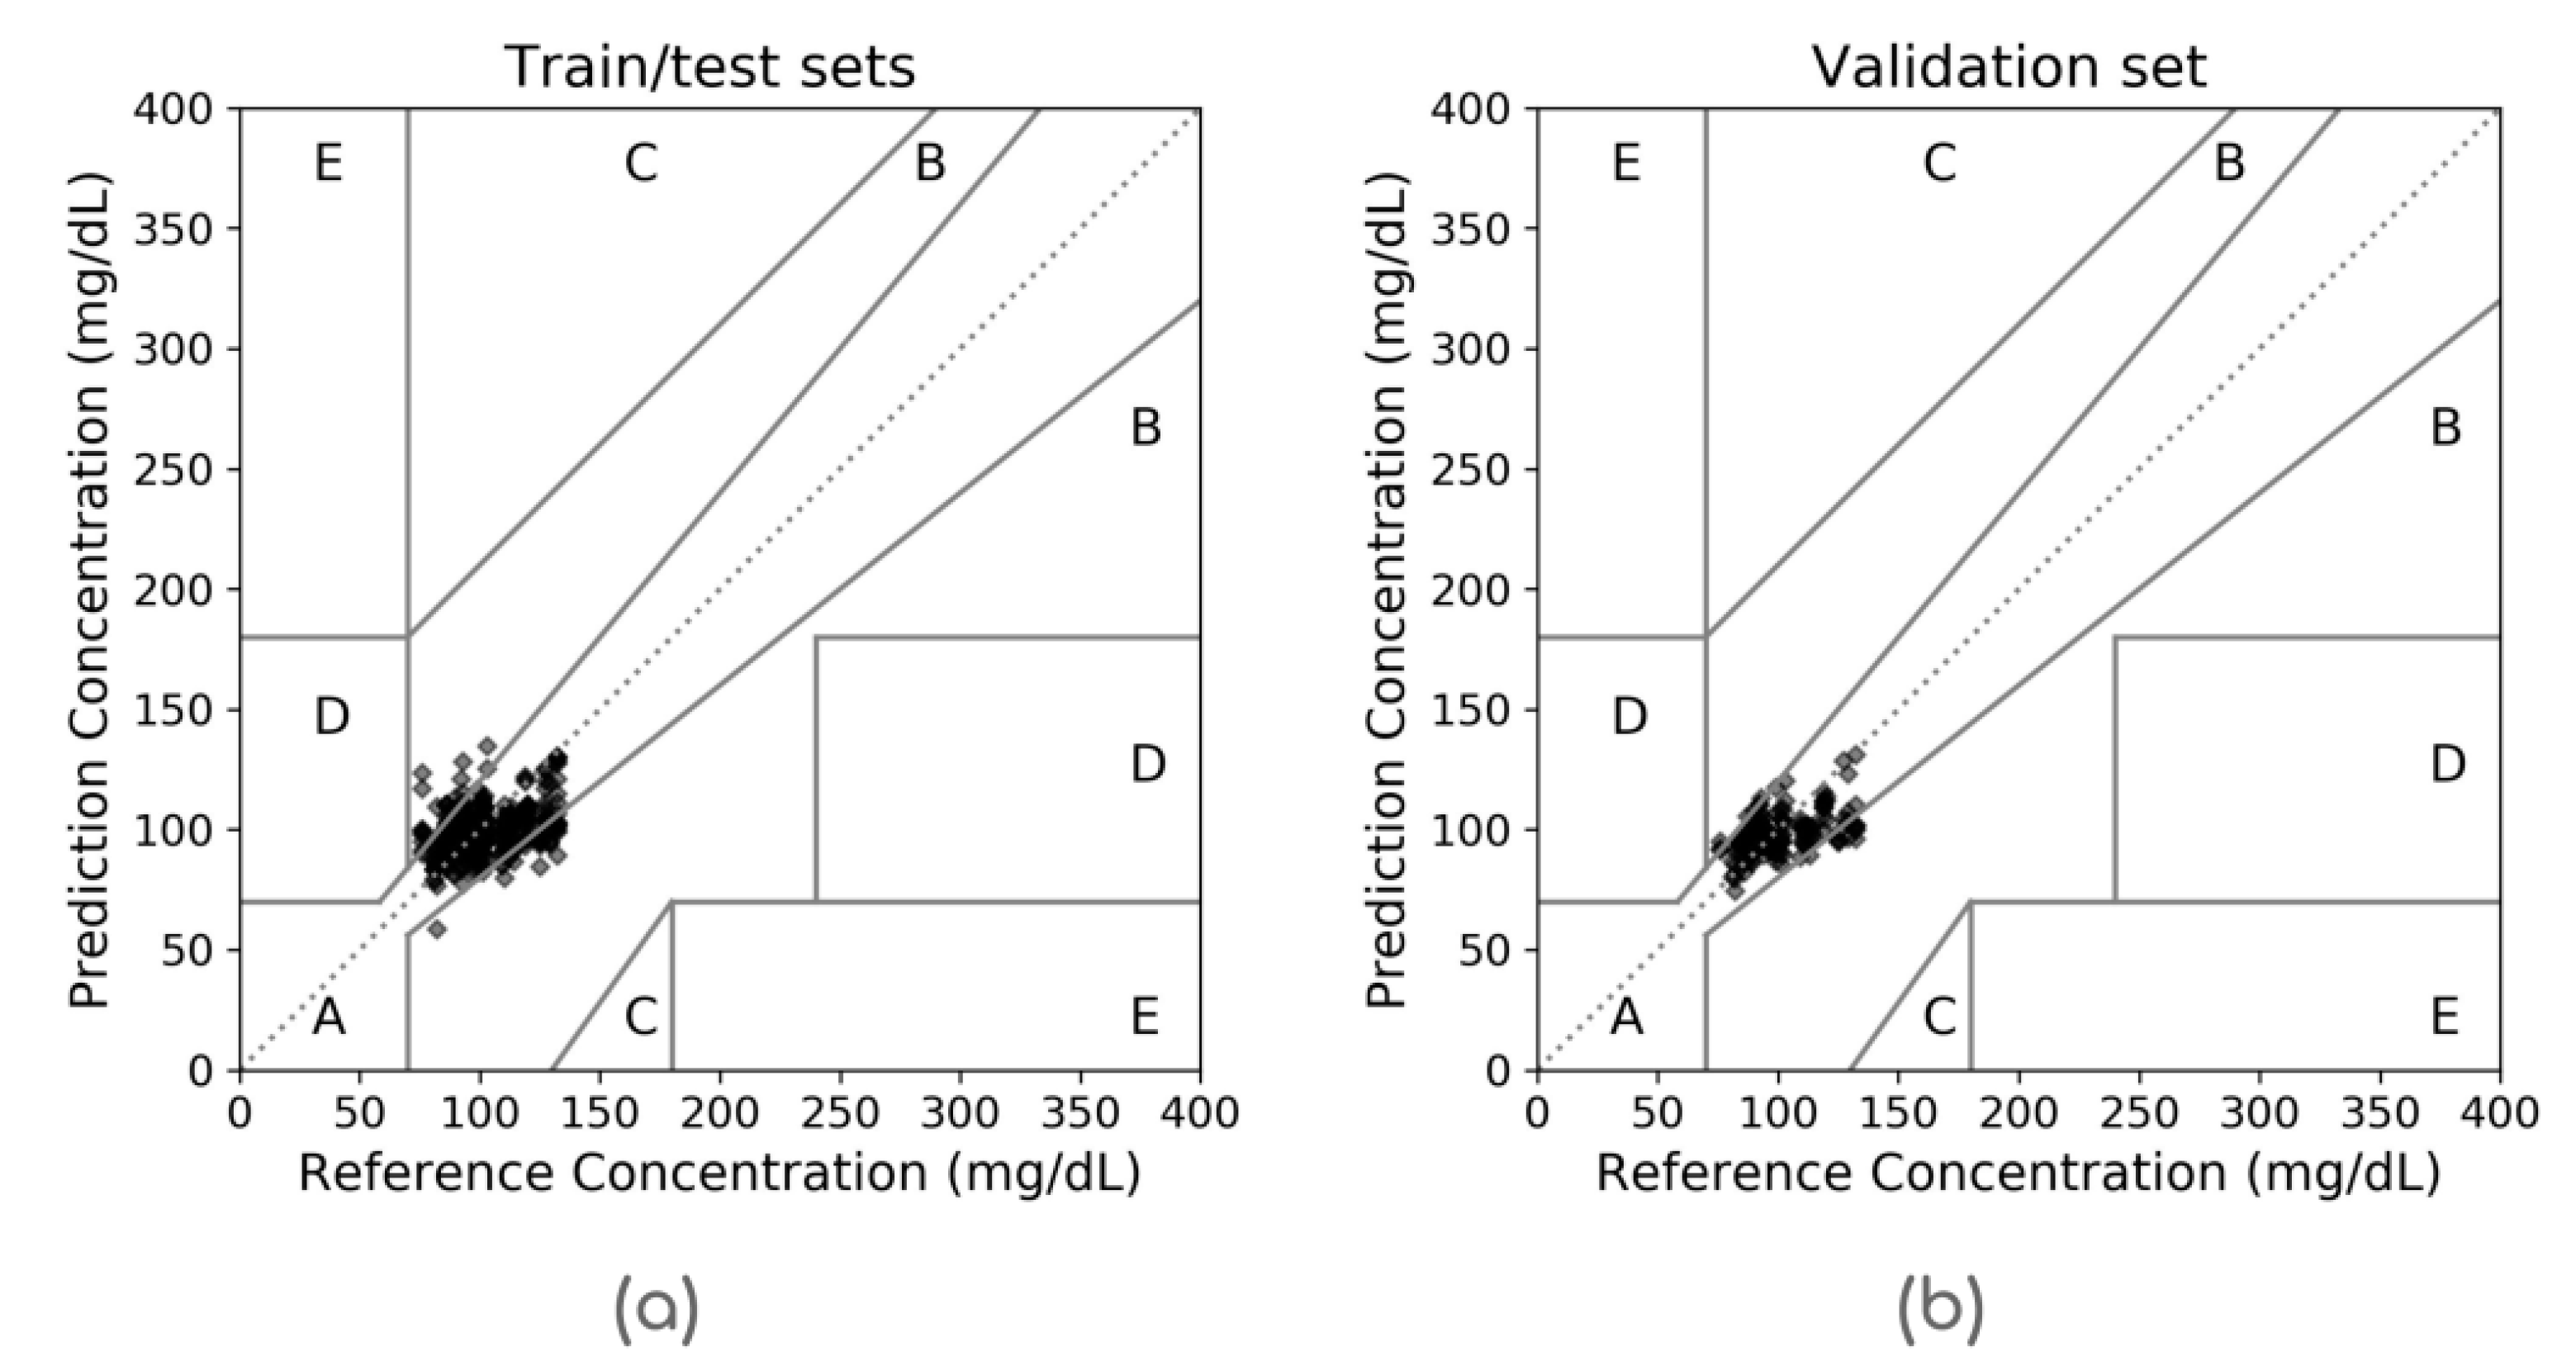
  • Evaluation metrics: With the aim to evaluate the model performance, the mean absolute error and the Clarke error grid analysis [46] were adopted. The mean absolute error (MAE) is computed as in Equation (2) where yi represents the reference glucose values, and y ^ i stands for the estimated values by the algorithm. In the Clarke error grid, the reference glucose concentrations versus the estimated values are plotted and divided into five zones, as shown in Figure 2. Zones A and B represent accurate or acceptable glucose results, respectively; zone C could lead to unnecessary treatments while zones D and E entail potentially dangerous mistreatment.
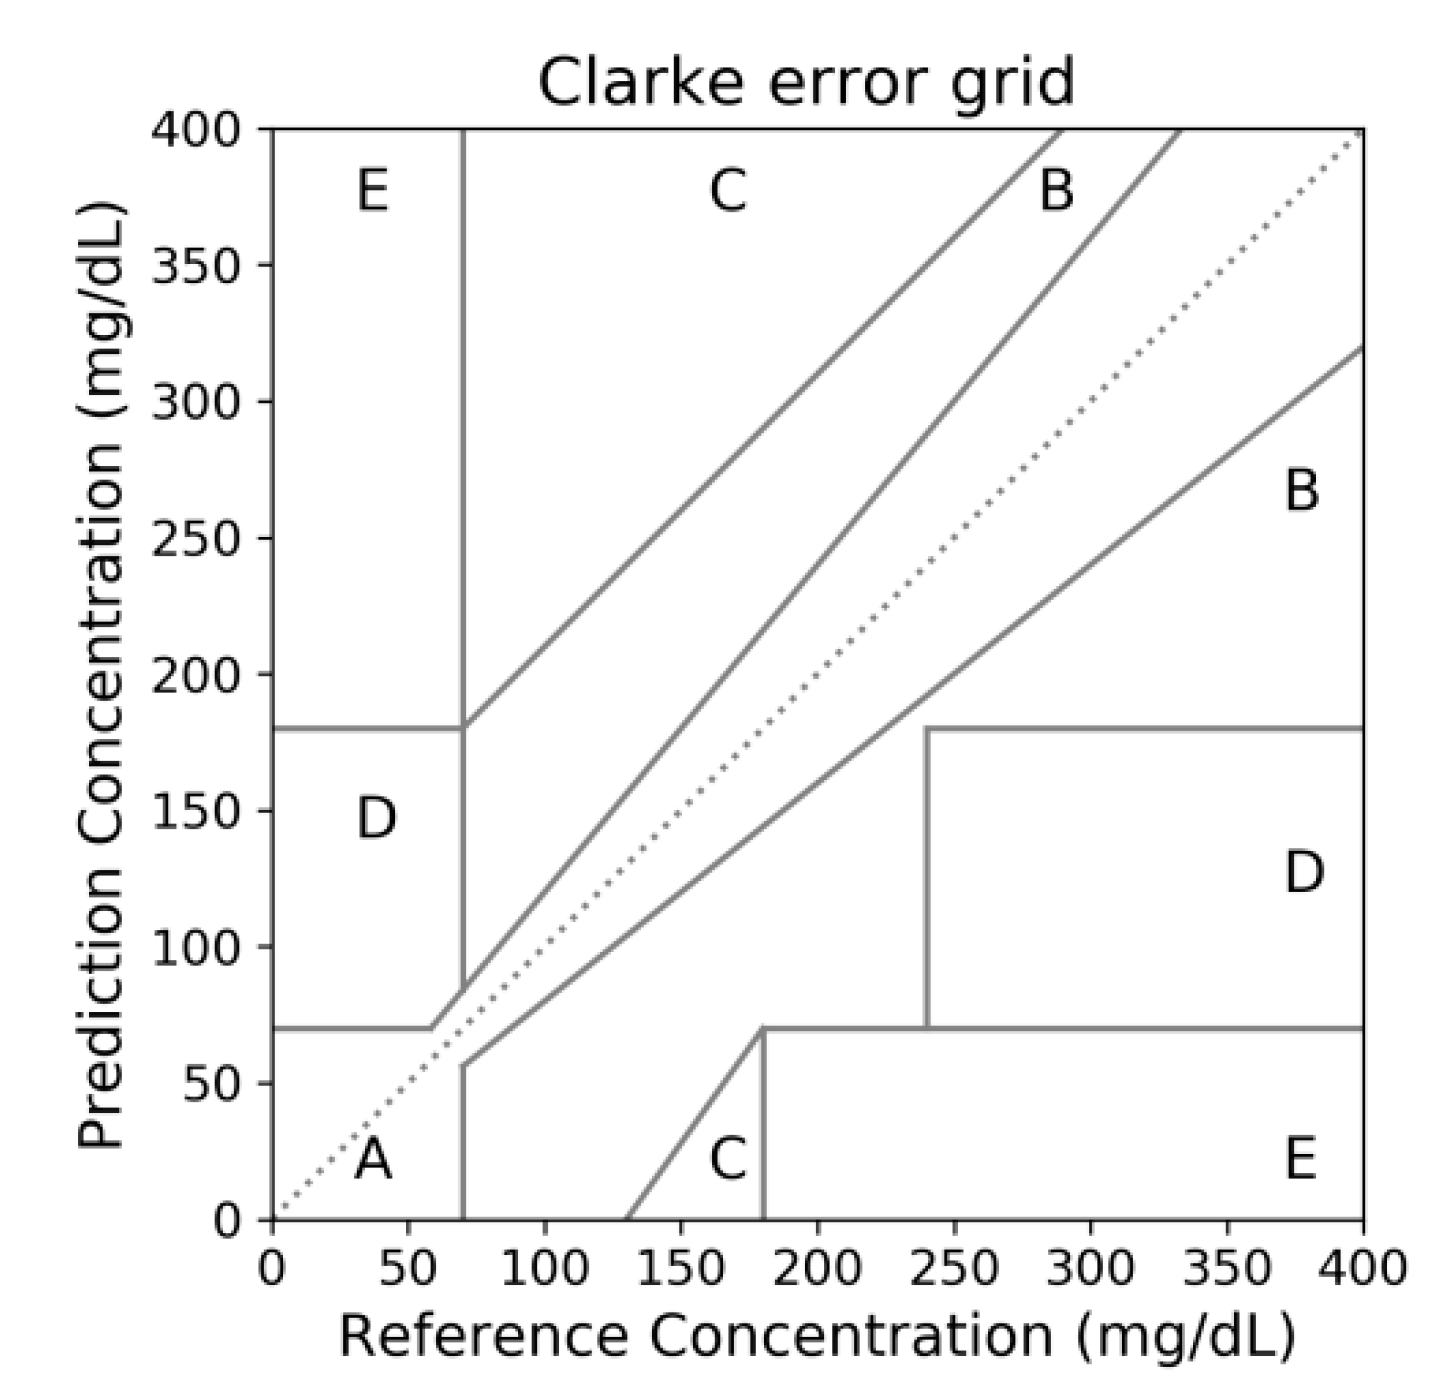
  • Cross-validation model: The whole input data set was divided into train/test (for model selection) and validation subsets. For this purpose a 10-fold cross-validation scheme was randomly applied to the 70% of the whole data set, representing the train/test subsets; the remaining 30% were taken as the validation subset, as illustrated in Figure 3. In the 10-fold cross-validation, data is randomly divided into 10 groups or folds of approximately equal number of observations. The first fold is used as a test subset whilst the remaining nine folds serve to train the classifier. This procedure is repeated ten times until every fold is treated as a test subset [47].
M A E = 1 n i = 1 n | y i y ^ i |

2.5.2. System Implementation

The whole system was implemented using a Flask server, which allows performing multiple functions or microservices, through a variety of API calls, and it is structured. This server is running on Windows operating system with 8 GB RAM, Core i7 processor, SSD 240 GB, Python 3.5, Flask 1.02 and MariaDB 10.1.35. Its structure is designed so that it contains the GET and POST interaction methods.
The API structure for the present monitoring system is shown in Table 1, and the main functions implemented on this system, are explained in detail below.
In the user glucose profile generation function (/signUp), the glucose profile of a user is stored for registered users. With the intention of registering new users in the database, a form with username, e-mail and password must be filled.
On the other hand, the glucose estimation function (/glucose/estimation) receives a parameter along with a JSON object with information such as the user ID, and the mean histogram obtained from the 12 fingertip images as computed by the RPi board. This also incorporates an artificial neural network model, trained previously as specified in the model selection section, giving as output the estimated glucose concentration value. Results obtained in this function, i.e., the estimated glucose value, the user ID, so as the current time and hour, are then saved on the database.
Finally, the share data to end device function (/glucose/query) is a function consisting in returning the current estimated glucose value. However, it also allows the retrieval of the glucose historical record of a user by an end device.
Please note that /glucose/estimation and /glucose/query are general purpose functions, so the integration of measurements from other sensors, e.g., ECG (/ecg/estimation and /ecg/query) or SpO2 (/spo2/estimation and /spo2/query) is straightforward, resulting in a flexible and scalable system.

2.6. Smart End Device

As stated above, the data calculated on the IoT server is shared to end devices by means of the query method in the share data to end device function. The end device comprises a mobile application that can be installed on Android devices such as smartphones or tablets. This device is used for visualising data from the glucose profiles estimated previously.

3. Results

In this section, results including the IoT system setup and the end device implementation, as well as the model selection and validation, are presented.

3.1. IoT Sensor Setup

The IoT sensor comprises the image acquisition stage along with the Raspberry Pi Zero board, implemented in the glove embodiment, as shown in the Figure 4.
In this stage, histograms from the blue channel of acquired images are obtained as stated before. An example of one fingertip image acquired with this system and its corresponding blue channel histogram are depicted in Figure 5. However, in this study, one of the principles for estimating the glucose level is that histograms of the fingertip images differ when users have different glucose concentrations; Figure 6 provides a visual comparative regarding this assumption.

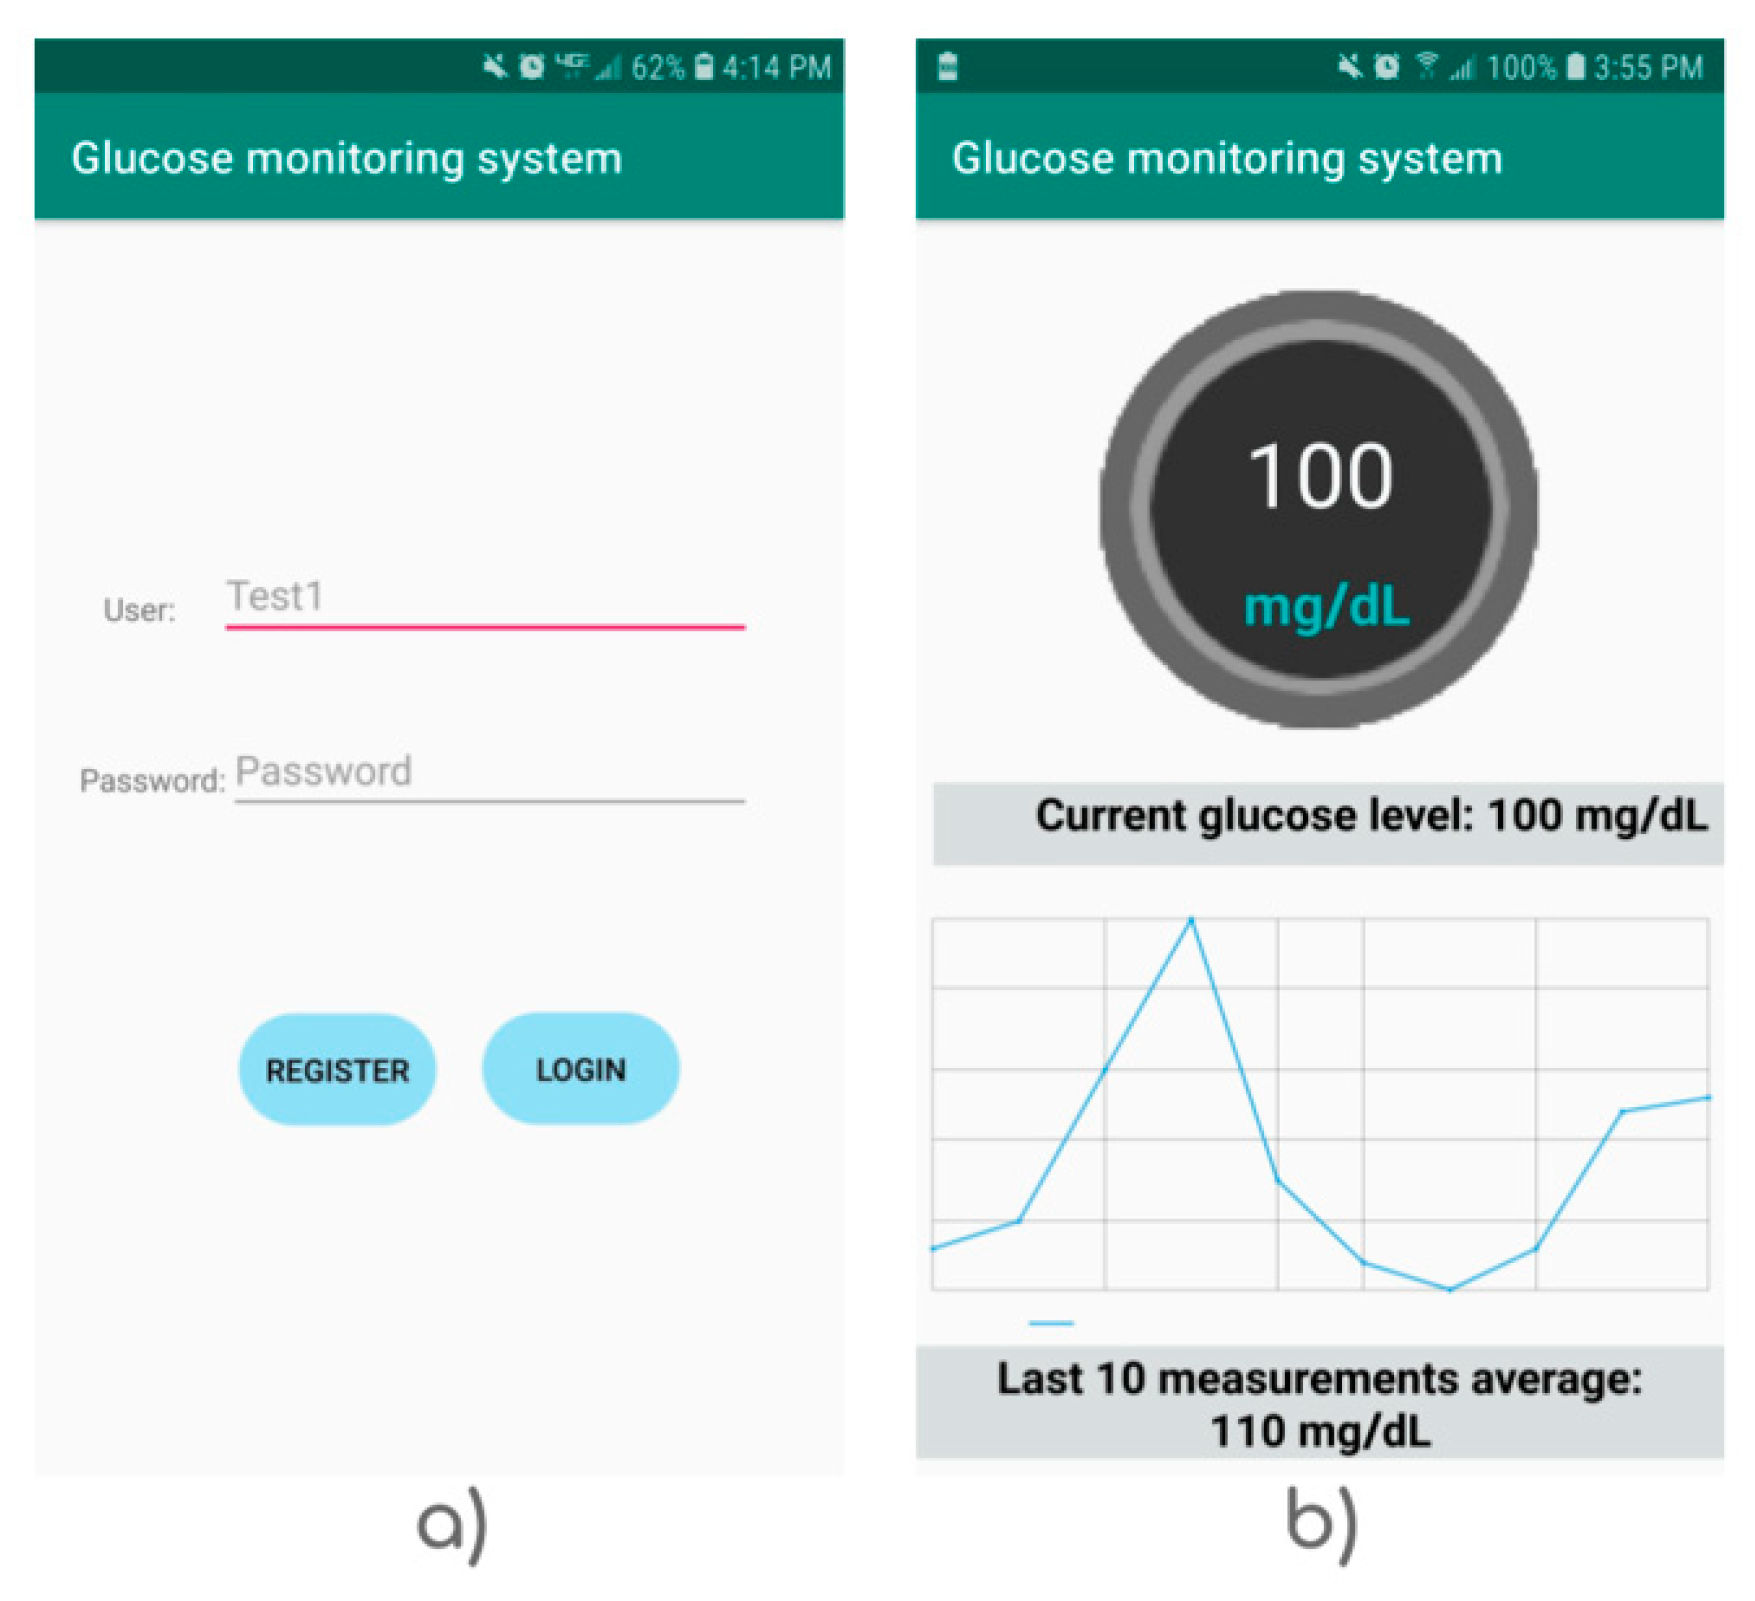
3.2. End Device Screens

The end device has three main activities, described as follows:
  • Activity 1: login and server connection. This function aims for establishing a connection to the Flask IoT server through the port 5000.
  • Activity 2: shows the current glucose value and graphs the last ten measurements for logged user. This is made by JPLOT, a .aar library to graph static (x, y) coordinate points, time series, among other; which is convenient for showing the results in our application.
  • Activity 3: show the glucose record profile estimated on previous days. The graph in this screen also displays two lines representing the limits for hypoglucaemia and hyperglucaemia correspondingly enclosing the healthy glucose values.
Please refer to Figure 7 to see an example of mobile application screens.

3.3. Model Selection and Validation

To obtain reliable results regarding the implementation of the ANN model, the input dataset was split into train/test (70%) and external validation (30%) subsets. In the first subset–the train/test split–a 10-fold cross validation scheme was performed. The ANN model was trained using the parameters and configuration determined in the model validation, considering the MAE and the Clarke grid error analysis as the evaluation metrics. For details of the latter, please refer to Section 2.5.1.
The dataset was first divided into train/test subsets to conduct the 10-fold cross-validation process, resulting in an 11.81 mg/dL mean absolute error, and a Clarke error grid zone percentage of A = 83.84%, B = 16.16%, and 0% for the rest of zones. The validation subset was then fed to the trained ANN. After this process the results were a 10.37 mg/dL mean absolute error, with a Clarke error grid zone percentage of A = 90.32% and B = 9.68%; none of the predicted glucose values fell on the C, D, E zones.
Results of the estimated glucose concentrations in comparison to the actual values can be seen in Figure 8 and Table 2, respectively.

4. Discussion

The presented results (Clark grid error = 90.32% in zone A, MAE = 10.37) suggests that our approach is competitive with those found in the literature: E. Monte-Moreno et al. [48] reported 87.7% of points in zone A, Y. Segman et al. [49] 81.2% for zone A, and I. Harman-Boehm et al. [50] reported a 96% of the points are in zones A and B, but only 57% are in zone A [50]. Despite the fact that non-invasive glucose meters have been presented previously, most of their applications are implemented locally, and the measurements are carried out in vitro or using a robust setup. Even with the promising results that IoT technology could bring, there are no new works that suggest the methodology for its implementation in a cloud device or devices of daily use. Our proposal was implemented and instrumented as an IoT system, in which all our measurements were carried out in vivo. The obtained data was validated by making comparisons with standard blood tests by means of the MAE and Clarke grid error.
The use of Raspberry Pi Zero has advantages: it has a powerful microprocessor running a special Linux distribution, with digital I/O as Arduino has, but with more communications modules.
The use of optical methodologies for quantifying glucose levels is currently one of the leading techniques conducting the major research in the field of non-invasive glucose estimation. In this regard, this work aimed to estimate the glucose level from histograms of pictures taken with the RPi Zero board by means of an intelligent algorithm based on an ANN. To this end, sensors for the final setup were embedded in a glove and are in charge of data acquisition, but also perform a pre-processing step by computing the histograms of acquired pictures, thus reducing the amount of data to be sent but leaving the whole neural network computing process to the server. As a result, a high scalability of the system is achieved, allowing other things to be attached, e.g., oximeter, ECG, temperature or blood pressure sensors could be added.
All the above was validated by the system functionality, but also, in terms of accuracy as stated in the results section. The glucose estimation readings recorded by the present approach could be particularly useful to provide further user health information, permitting the medical specialist to perform a better diagnostic.
Despite the variation of skin colour of participants not being studied in this work, it would be of great interest to take it into consideration for further research in which we propose to incorporate this new variable along with the histogram to feed the ANN.
One limitation of the present proposal is that the instrumentation can be considered bulky for use during daily activities. However, the size of the system can be improved by using smaller batteries and designing PCB (Printed Circuit Board) circuits for integrating the whole system. Furthermore, the incorporation of more sensors connected to the RPi Zero could turn the current system in a health care platform, for this reason, this work can serve as a starting point towards a full smart health care service.

Author Contributions

Conceptualization, A.A.-P., I.P.G.-G. and G.A.A.-S.; Data curation, V.F.-G. and I.P.G.-G.; Formal analysis, J.C.-N. and R.E.C.-V.; Investigation, V.F.-G., J.C.-N. and R.E.C.-V.; Methodology, J.C.-N. and G.A.A.-S.; Software, A.A.-P. and V.F.-G., V.A.A.-P., I.P.G.-G. and G.A.A.-S.; Writing—original draft, A.A.-P. and G.A.A.-S.; Writing—review and editing, V.F.-G., I.P.G.-G., J.C.-N. and R.E.C.-V.

Funding

This research received no external funding.

Acknowledgments

The authors want to acknowledge all the laboratory personnel and technicians for their outstanding support during this study.

Conflicts of Interest

The authors declare no conflict of interest.

References

  1. Hamidi, H. An approach to develop the smart health using Internet of Things and authentication based on biometric technology. Futur. Gener. Comput. Syst. 2019, 91, 434–449. [Google Scholar] [CrossRef]
  2. Gubbi, J.; Buyya, R.; Marusic, S.; Palaniswami, M. Internet of Things (IoT): A vision, architectural elements, and future directions. Futur. Gener. Comput. Syst. 2013, 29, 1645–1660. [Google Scholar] [CrossRef] [Green Version]
  3. Borgia, E. The Internet of Things vision: Key features, applications and open issues. Comput. Commun. 2014, 54, 1–31. [Google Scholar] [CrossRef]
  4. Huang, L.-S.; Su, J.-Y.; Pao, T.-L. A context aware smart classroom architecture for smart campuses. Appl. Sci. 2019, 9, 1837. [Google Scholar] [CrossRef]
  5. Kim, Y.; Moon, J.; Hwang, E. Constructing differentiated educational materials using semantic annotation for sustainable education in IoT environments. Sustainability 2018, 10, 1296. [Google Scholar] [CrossRef]
  6. Liu, Y.; Yang, C.; Jiang, L.; Xie, S.; Zhang, Y. Intelligent edge computing for IoT-Based energy management in smart cities. IEEE Netw. 2019, 33, 111–117. [Google Scholar] [CrossRef]
  7. Li, S.; Ni, Q.; Sun, Y.; Min, G.; Al-Rubaye, S. Energy-efficient resource allocation for industrial cyber-physical IoT systems in 5G era. IEEE Trans. Ind. Inform. 2018, 14, 2618–2628. [Google Scholar] [CrossRef]
  8. Garcia-de-Prado, A.; Ortiz, G.; Boubeta-Puig, J. COLLECT: COLLaborativE ConText-aware service oriented architecture for intelligent decision-making in the Internet of Things. Expert Syst. Appl. 2017, 85, 231–248. [Google Scholar] [CrossRef] [Green Version]
  9. Lee, I.; Lee, K. The Internet of Things (IoT): Applications, investments, and challenges for enterprises. Bus. Horiz. 2015, 58, 431–440. [Google Scholar] [CrossRef]
  10. Santos, P.M.; Rodrigues, J.G.P.; Cruz, S.B.; Lourenço, T.; d’Orey, P.M.; Luis, Y.; Rocha, C.; Sousa, S.; Crisóstomo, S.; Queirós, C. PortoLivingLab: An IoT-Based Sensing Platform for Smart Cities. IEEE Internet Things J. 2018, 5, 523–532. [Google Scholar] [CrossRef]
  11. Plageras, A.P.; Psannis, K.E.; Stergiou, C.; Wang, H.; Gupta, B.B. Efficient IoT-based sensor BIG Data collection—Processing and analysis in smart buildings. Futur. Gener. Comput. Syst. 2018, 82, 349–357. [Google Scholar] [CrossRef]
  12. Rathore, M.M.; Paul, A.; Hong, W.-H.; Seo, H.; Awan, I.; Saeed, S. Exploiting IoT and big data analytics: Defining Smart Digital City using real-time urban data. Sustain. Cities Soc. 2018, 40, 600–610. [Google Scholar] [CrossRef]
  13. Lai, X.; Yang, T.; Wang, Z.; Chen, P. IoT Implementation of kalman filter to improve accuracy of air quality monitoring and prediction. Appl. Sci. 2019, 9, 1831. [Google Scholar] [CrossRef]
  14. Benammar, M.; Abdaoui, A.; Ahmad, S.; Touati, F.; Kadri, A. A modular IoT platform for real-time indoor air quality monitoring. Sensors 2018, 18, 581. [Google Scholar] [CrossRef]
  15. Dhingra, S.; Madda, R.B.; Gandomi, A.H.; Patan, R.; Daneshmand, M. Internet of things mobile-air pollution monitoring system (IoT-Mobair). IEEE Int. Things J. 2019, 6, 5577–5584. [Google Scholar] [CrossRef]
  16. De l’Aulnoit, A.H.; Boudet, S.; Génin, M.; Gautier, P.-F.; Schiro, J.; de l’Aulnoit, D.H.; Beuscart, R. Development of a smart mobile data module for fetal monitoring in E-Healthcare. J. Med. Syst. 2018, 42, 83. [Google Scholar] [CrossRef]
  17. Abdellatif, A.A.; Emam, A.; Chiasserini, C.-F.; Mohamed, A.; Jaoua, A.; Ward, R. Edge-based compression and classification for smart healthcare systems: Concept, implementation and evaluation. Expert Syst. Appl. 2019, 117, 1–14. [Google Scholar] [CrossRef]
  18. Ferlie, E.B.; Shortell, S.M. Improving the quality of health care in the United Kingdom and the United States: A framework for change. Milbank Q. 2001, 79, 281–315. [Google Scholar] [CrossRef]
  19. Shen, H.; Ma, D.; Zhao, Y.; Sun, H.; Sun, S.; Ye, R.; Huang, L.; Lang, B.; Sun, Y. MIAPS: A web-based system for remotely accessing and presenting medical images. Comput. Methods Progr. Biomed. 2014, 113, 266–283. [Google Scholar] [CrossRef]
  20. Segura-Garcia, J.; Garcia-Pineda, M.; Tamarit-Tronch, M.; Cibrian, R.; Salvador-Palmer, R. Cost-Effective eHealth system based on a Multi-Sensor System-on-Chip platform and data fusion in cloud for sport activity monitoring. Electronics 2018, 7, 183. [Google Scholar] [CrossRef]
  21. Rohokale, V.M.; Prasad, N.R.; Prasad, R. A cooperative Internet of Things (IoT) for rural healthcare monitoring and control. In Proceedings of the 2011 2nd International Conference on Wireless Communication, Vehicular Technology, Information Theory and Aerospace & Electronic Systems Technology (Wireless VITAE), Chennai, India, 28 February–3 March 2011; IEEE: New York, NY, USA, 2011; pp. 1–6. [Google Scholar]
  22. Doukas, C.; Maglogiannis, I. Bringing IoT and cloud computing towards pervasive healthcare. In Proceedings of the 2012 Sixth International Conference on Innovative Mobile and Internet Services in Ubiquitous Computing, Palermo, Italy, 4–6 July 2012; IEEE: New York, NY, USA, 2012; pp. 922–926. [Google Scholar]
  23. WHO: World Health Organization Diabetes Factsheets. Available online: https://www.who.int/en/news-room/fact-sheets/detail/diabetes (accessed on 27 July 2019).
  24. Guariguata, L.; Whiting, D.; Weil, C.; Unwin, N. The International Diabetes Federation diabetes atlas methodology for estimating global and national prevalence of diabetes in adults. Diabetes Res. Clin. Pract. 2011, 94, 322–332. [Google Scholar] [CrossRef]
  25. Lin, T.; Gal, A.; Mayzel, Y.; Horman, K.; Bahartan, K. Non-invasive glucose monitoring: A review of challenges and recent advances. Curr. Trends Biomed. Eng. Biosci. 2017, 6, 1–8. [Google Scholar] [CrossRef]
  26. Talib, A.J.; Alkahtani, M.; Jiang, L.; Alghannam, F.; Brick, R.; Gomes, C.L.; Scully, M.O.; Sokolov, A.V.; Hemmer, P.R. Lanthanide ions doped in vanadium oxide for sensitive optical glucose detection. Opt. Mater. Express 2018, 8, 3277–3287. [Google Scholar] [CrossRef] [Green Version]
  27. Blum, Z.; Pankratov, D.; Shleev, S. Powering electronic contact lenses: Current achievements, challenges, and perspectives. Expert Rev. Ophthalmol. 2014, 9, 269–273. [Google Scholar] [CrossRef]
  28. Do Amaral, C.E.F.; Wolf, B. Current development in non-invasive glucose monitoring. Med. Eng. Phys. 2008, 30, 541–549. [Google Scholar] [CrossRef]
  29. Vashist, S.K. Non-invasive glucose monitoring technology in diabetes management: A review. Anal. Chim. Acta 2012, 750, 16–27. [Google Scholar] [CrossRef]
  30. So, C.-F.; Choi, K.-S.; Wong, T.K.S.; Chung, J.W.Y. Recent advances in noninvasive glucose monitoring. Med. Devices (Auckl. NZ) 2012, 5, 45. [Google Scholar]
  31. Yadav, J.; Rani, A.; Singh, V.; Murari, B.M. Prospects and limitations of non-invasive blood glucose monitoring using near-infrared spectroscopy. Biomed. Signal Process. Control 2015, 18, 214–227. [Google Scholar] [CrossRef]
  32. Waynant, R.W.; Ilev, I.K.; Gannot, I. Mid-Infrared laser applications in medicine and biology. Philos. Trans. R. Soc. A Math. Phys. Eng. Sci. 2001, 359, 635–644. [Google Scholar] [CrossRef]
  33. Tura, A.; Maran, A.; Pacini, G. Non-invasive glucose monitoring: Assessment of technologies and devices according to quantitative criteria. Diabetes Res. Clin. Pract. 2007, 77, 16–40. [Google Scholar] [CrossRef]
  34. Jeon, K.J.; Hwang, I.D.; Hahn, S.J.; Yoon, G. Comparison between transmittance and reflectance measurements in glucose determination using near infrared spectroscopy. J. Biomed. Opt. 2006, 11, 14022. [Google Scholar] [CrossRef]
  35. Chen, T.-L.; Lo, Y.-L.; Liao, C.-C.; Phan, Q.-H. Noninvasive measurement of glucose concentration on human fingertip by optical coherence tomography. J. Biomed. Opt. 2018, 23, 47001. [Google Scholar] [CrossRef]
  36. Shao, J.; Lin, M.; Li, Y.; Li, X.; Liu, J.; Liang, J.; Yao, H. In vivo blood glucose quantification using Raman spectroscopy. PLoS ONE 2012, 7, e48127. [Google Scholar] [CrossRef]
  37. Ali, H.; Bensaali, F.; Jaber, F. Novel approach to non-invasive blood glucose monitoring based on transmittance and refraction of visible laser light. IEEE Access 2017, 5, 9163–9174. [Google Scholar] [CrossRef]
  38. Kocsis, L.; Herman, P.; Eke, A. The modified Beer—Lambert law revisited. Phys. Med. Biol. 2006, 51, N91. [Google Scholar] [CrossRef]
  39. Francisco-García, V.; Guzmán-Guzmán, I.P.; Salgado-Rivera, R.; Alonso-Silverio, G.A.; Alarcón-Paredes, A. Non-invasive Glucose Level Estimation: A Comparison of Regression Models Using the MFCC as Feature Extractor. In Proceedings of the Mexican Conference on Pattern Recognition, Querétaro, México, 18 May 2019; Springer: Berlin, Germany, 2019; pp. 206–215. [Google Scholar]
  40. Abadi, M.; Agarwal, A.; Barham, P.; Brevdo, E.; Chen, Z.; Citro, C.; Corrado, G.S.; Davis, A.; Dean, J.; Devin, M. Tensorflow: Large-scale machine learning on heterogeneous distributed systems. arXiv 2016, arXiv:1603.04467. [Google Scholar]
  41. Pallets Projects Flask. Available online: https://flask.palletsprojects.com (accessed on 16 July 2019).
  42. Alarcón-Paredes, A.; Rebolledo-Nandi, Z.; Guzmán-Guzmán, I.P.; Yáñez-Márquez, C.; Alonso, G.A. A non-invasive glucose level estimation in a multi-sensing health care monitoring system. Technol. Heal. Care 2018, 26, 203–208. [Google Scholar] [CrossRef]
  43. Mann, H.B.; Whitney, D.R. On a test of whether one of two random variables is stochastically larger than the other. Ann. Math. Stat. 1947, 50–60. [Google Scholar] [CrossRef]
  44. Goodfellow, I.; Bengio, Y.; Courville, A. Deep Learning; MIT Press: Cambridge, MA, USA, 2016; ISBN 0262337371. [Google Scholar]
  45. Kingma, D.P.; Ba, J. Adam: A method for stochastic optimization. arXiv 2014, arXiv:1412.6980. [Google Scholar]
  46. Clarke, W.L. The original Clarke error grid analysis (EGA). Diabetes Technol. Ther. 2005, 7, 776–779. [Google Scholar] [CrossRef]
  47. James, G.; Witten, D.; Hastie, T.; Tibshirani, R. An Introduction to Statistical Learning; Springer: Berlin, Germany, 2013; Volume 6. [Google Scholar]
  48. Monte-Moreno, E. Non-invasive estimate of blood glucose and blood pressure from a photoplethysmograph by means of machine learning techniques. Artif. Intell. Med. 2011, 53, 127–138. [Google Scholar] [CrossRef]
  49. Segman, Y. Device and method for noninvasive glucose assessment. J. Diabetes Sci. Technol. 2018, 12, 1159–1168. [Google Scholar] [CrossRef]
  50. Harman-Boehm, I.; Gal, A.; Raykhman, A.M.; Naidis, E.; Mayzel, Y. Noninvasive glucose monitoring: Increasing accuracy by combination of multi-technology and multi-sensors. J. Diabetes Sci. Technol. 2010, 4, 583–595. [Google Scholar] [CrossRef]
Figure 1. Diagram of the proposed Internet of Things (IoT) system.
Applsci 09 03046 g001
Figure 2. Zones on the Clarke error grid analysis.
Applsci 09 03046 g002
Figure 3. Cross-validation division of data for system training and results validation.
Applsci 09 03046 g003
Figure 4. Final IoT sensor setup instrumentation.
Applsci 09 03046 g004
Figure 5. Example of a fingertip image (a) with its corresponding histogram (b).
Applsci 09 03046 g005
Figure 6. Histograms for images of users with different glucose levels (a) and a closer view (b).
Applsci 09 03046 g006
Figure 7. Example of mobile application screens (a) for login and (b) current glucose level.
Applsci 09 03046 g007
Figure 8. Clarke grid error results over (a) 10-fold cross-validation on the train/test sets, and (b) the external validation set.
Applsci 09 03046 g008
Table 1. API structure for the proposed system.
EndpointMethodActivity
/signUpPOSTCreates a new user
/glucose/estimationPOSTRequests the histograms and estimates the glucose level
/glucose/queryGETRequests a query to the database and delivers the ten most up-to-date values
Table 2. MAE 1 and Clarke grid error region on train/test and validation subsets.
Train/Test SubsetValidation Subset
MAE11.8110.37
Clarke grid error zone (%)
(A-B-C-D-E)
(83.84-16.16-0-0-0)(90.32-9.68-0-0-0)
1 MAE: mean absolute error.

