Article

Lock-In Thermography and Ultrasonic Testing of Impacted Basalt Fibers Reinforced Thermoplastic Matrix Composites

by
Simone Boccardi
1,2,
Natalino Daniele Boffa
1,
Giovanni Maria Carlomagno
1,
Giuseppe Del Core
2,
Carosena Meola
1,*,
Ernesto Monaco
1,
Pietro Russo
3 and
Giorgio Simeoli
3
1
Department of Industrial Engineering—Aerospace Division, University of Naples Federico II, Via Claudio, 21, 80125 Napoli, Italy
2
Department of Science and Technology, University of Naples Parthenope, Centro Direzionale, Isola C4, 80143 Napoli, Italy
3
Institute for Polymers, Composites and Biomaterials, National Council of Research, 80078 (NA) Pozzuoli, Italy
*
Author to whom correspondence should be addressed.
Appl. Sci. 2019, 9(15), 3025; https://doi.org/10.3390/app9153025
Submission received: 27 June 2019 / Revised: 22 July 2019 / Accepted: 25 July 2019 / Published: 26 July 2019
(This article belongs to the Special Issue Nondestructive Testing in Composite Materials)

Abstract

:

Featured Application

The term “new material” may raise enthusiasm as well as skepticism at the same time. The acceptance of new material is generally linked to its characteristics with respect to the commonly used materials such as better performance, the solution to an open question, non- or less-polluting, cheaper, easy to handle, etc. Of course, these characteristics must be certified; therefore, the production should be accompanied by effective testing techniques and procedures. The scope of this work is to contribute to assessing the effectiveness of non-destructive testing through the examination of both lock-in thermography and ultrasonic testing techniques applied to basalt-based composites.

Abstract

Basalt fibers are receiving increasing consideration because they seem to be adequate as reinforcement of composites and to comply with the environmental safeguard rules. However, many factors affect the performance of composite material, demanding specific testing; one may be performance assessment under impact tests. The attention of the present work is focused on the detection of impact damage in basalt-based composites with two non-destructive testing techniques: lock-in thermography (LT) and ultrasonic testing (UT). Two different types of materials are considered which both include basalt fibers as reinforcement but two different matrices: Polyamide and polypropylene. Polypropylene is used either pure or modified with the addition of a coupling agent; the latter improves the fiber/matrix interface strength, giving in practice, a material of different characteristics. Specimens are first subjected to low-velocity impact tests and then non-destructively examined with the two above mentioned techniques. The obtained results are analyzed and compared to highlight the advantages and limitations of the two techniques to detect impact damage in basalt-based composites. Both techniques seem effective for the inspection of polyamide/basalt composite; in particular, there is a general agreement between results. Conversely, UT seems not suitable for the inspection of polypropylene/basalt composites because of their superficial porosity, while lock-in thermography is effective also for this type of composite material.

1. Introduction

The development of new materials is an increasingly topical issue of great interest to both the academic and the industrial communities. This is because of many reasons. Amongst them, the performance of a product depends mostly on the material which it is made of, and a demand for materials of superior characteristics. Another important question is the environmental safeguard, which requires the development of more environmentally friendly materials. Therefore, the attention is ever more shifting from petrochemical resources to more natural (e.g., vegetables) substances. The hope is to be able to get eco-friendly composite materials which include both the matrix and reinforcement of natural derivation and which perform better, or at least similar to the most common composites of petrochemical derivation. This seems not completely achievable yet; what is instead possible is to reduce the problems of waste disposal. In this context, thermoplastic matrix-based composites (TC), thanks to their potential recyclability after their life-cycle, offer some advantages over their thermoset counterparts [1]. Another step forward may be to use natural fibers as reinforcement of thermoplastic matrices. A convenient reinforcement may be basalt.
Basalt is available in nature in volcanic rocks and can be reduced in fibers, which are well suited to be used as reinforcement of both thermoset and thermoplastic matrices to create different types of composite materials [2].
Based on the investigation till now carried out [3,4], the obtained composites seem to have good features, which make them comparable, or superior, to the most commonly used composites. The basalt-based composites could be adequate for the construction of some aircraft parts and of unmanned aerial vehicles like drones, which are ever more applied in different sectors such as surveillance and remote inspection. However, such adequacy should be ascertained since many factors affect the performance of a composite material. This one must be subjected to many tests prior to its introduction in the market for the construction of any goods. Amongst them, it is generally important to assess the material resistance to an impact load. The latter can be inadvertently induced during either manufacturing, through the impact of falling objects, or in service, and can cause barely visible damage. Therefore, the availability of effective non-destructive testing (NDT) techniques is fundamental to get information on the damage induced especially by low energy impact.
Today, many different NDT techniques are available, but none can be considered as superior and very effective; in fact, every technique has its inherent limitations. A good practice is to choose the most adequate technique to the specific application but, frequently, an effective routine may be to use more than one technique in the light of a data integration/fusion approach.
The attention of the present work is focused on the detection of low energy impact damage in basalt-based composites with two techniques: lock-in thermography (LT) and ultrasonic testing (UT). Both techniques were already used successfully to detect the impact damage of carbon-based composites [5] and now are considered again for the inspection of basalt-based composites. Basalt fibers are used as reinforcement of a polyamide matrix and of a polypropylene (PP) one, which is used either pure, or modified with the addition of a coupling agent; the latter improves the fiber/matrix interface strength, giving in practice, a material of different characteristics. Therefore, three different materials are inspected. Specimens are first subjected to low velocity/energy impact tests and then non-destructively examined with the two above mentioned techniques. The obtained results are compared to highlight the advantages and limitations of the two techniques within the inspection of basalt-based composites. In addition to the Introduction, this work is organized into several sections. Section 2, titled Materials and Methods, includes a description of the used materials and specimens and how they are impacted as well as of the two non-destructive techniques: lock-in thermography and ultrasonic testing. Section 3 reports Results separately in Section 3.1 for polyamide matrix-based specimen and in Section 3.2 for polypropylene matrix-based specimens. Section 4 titled: Data Discussion and Concluding Remarks will close the paper.

2. Materials and Methods

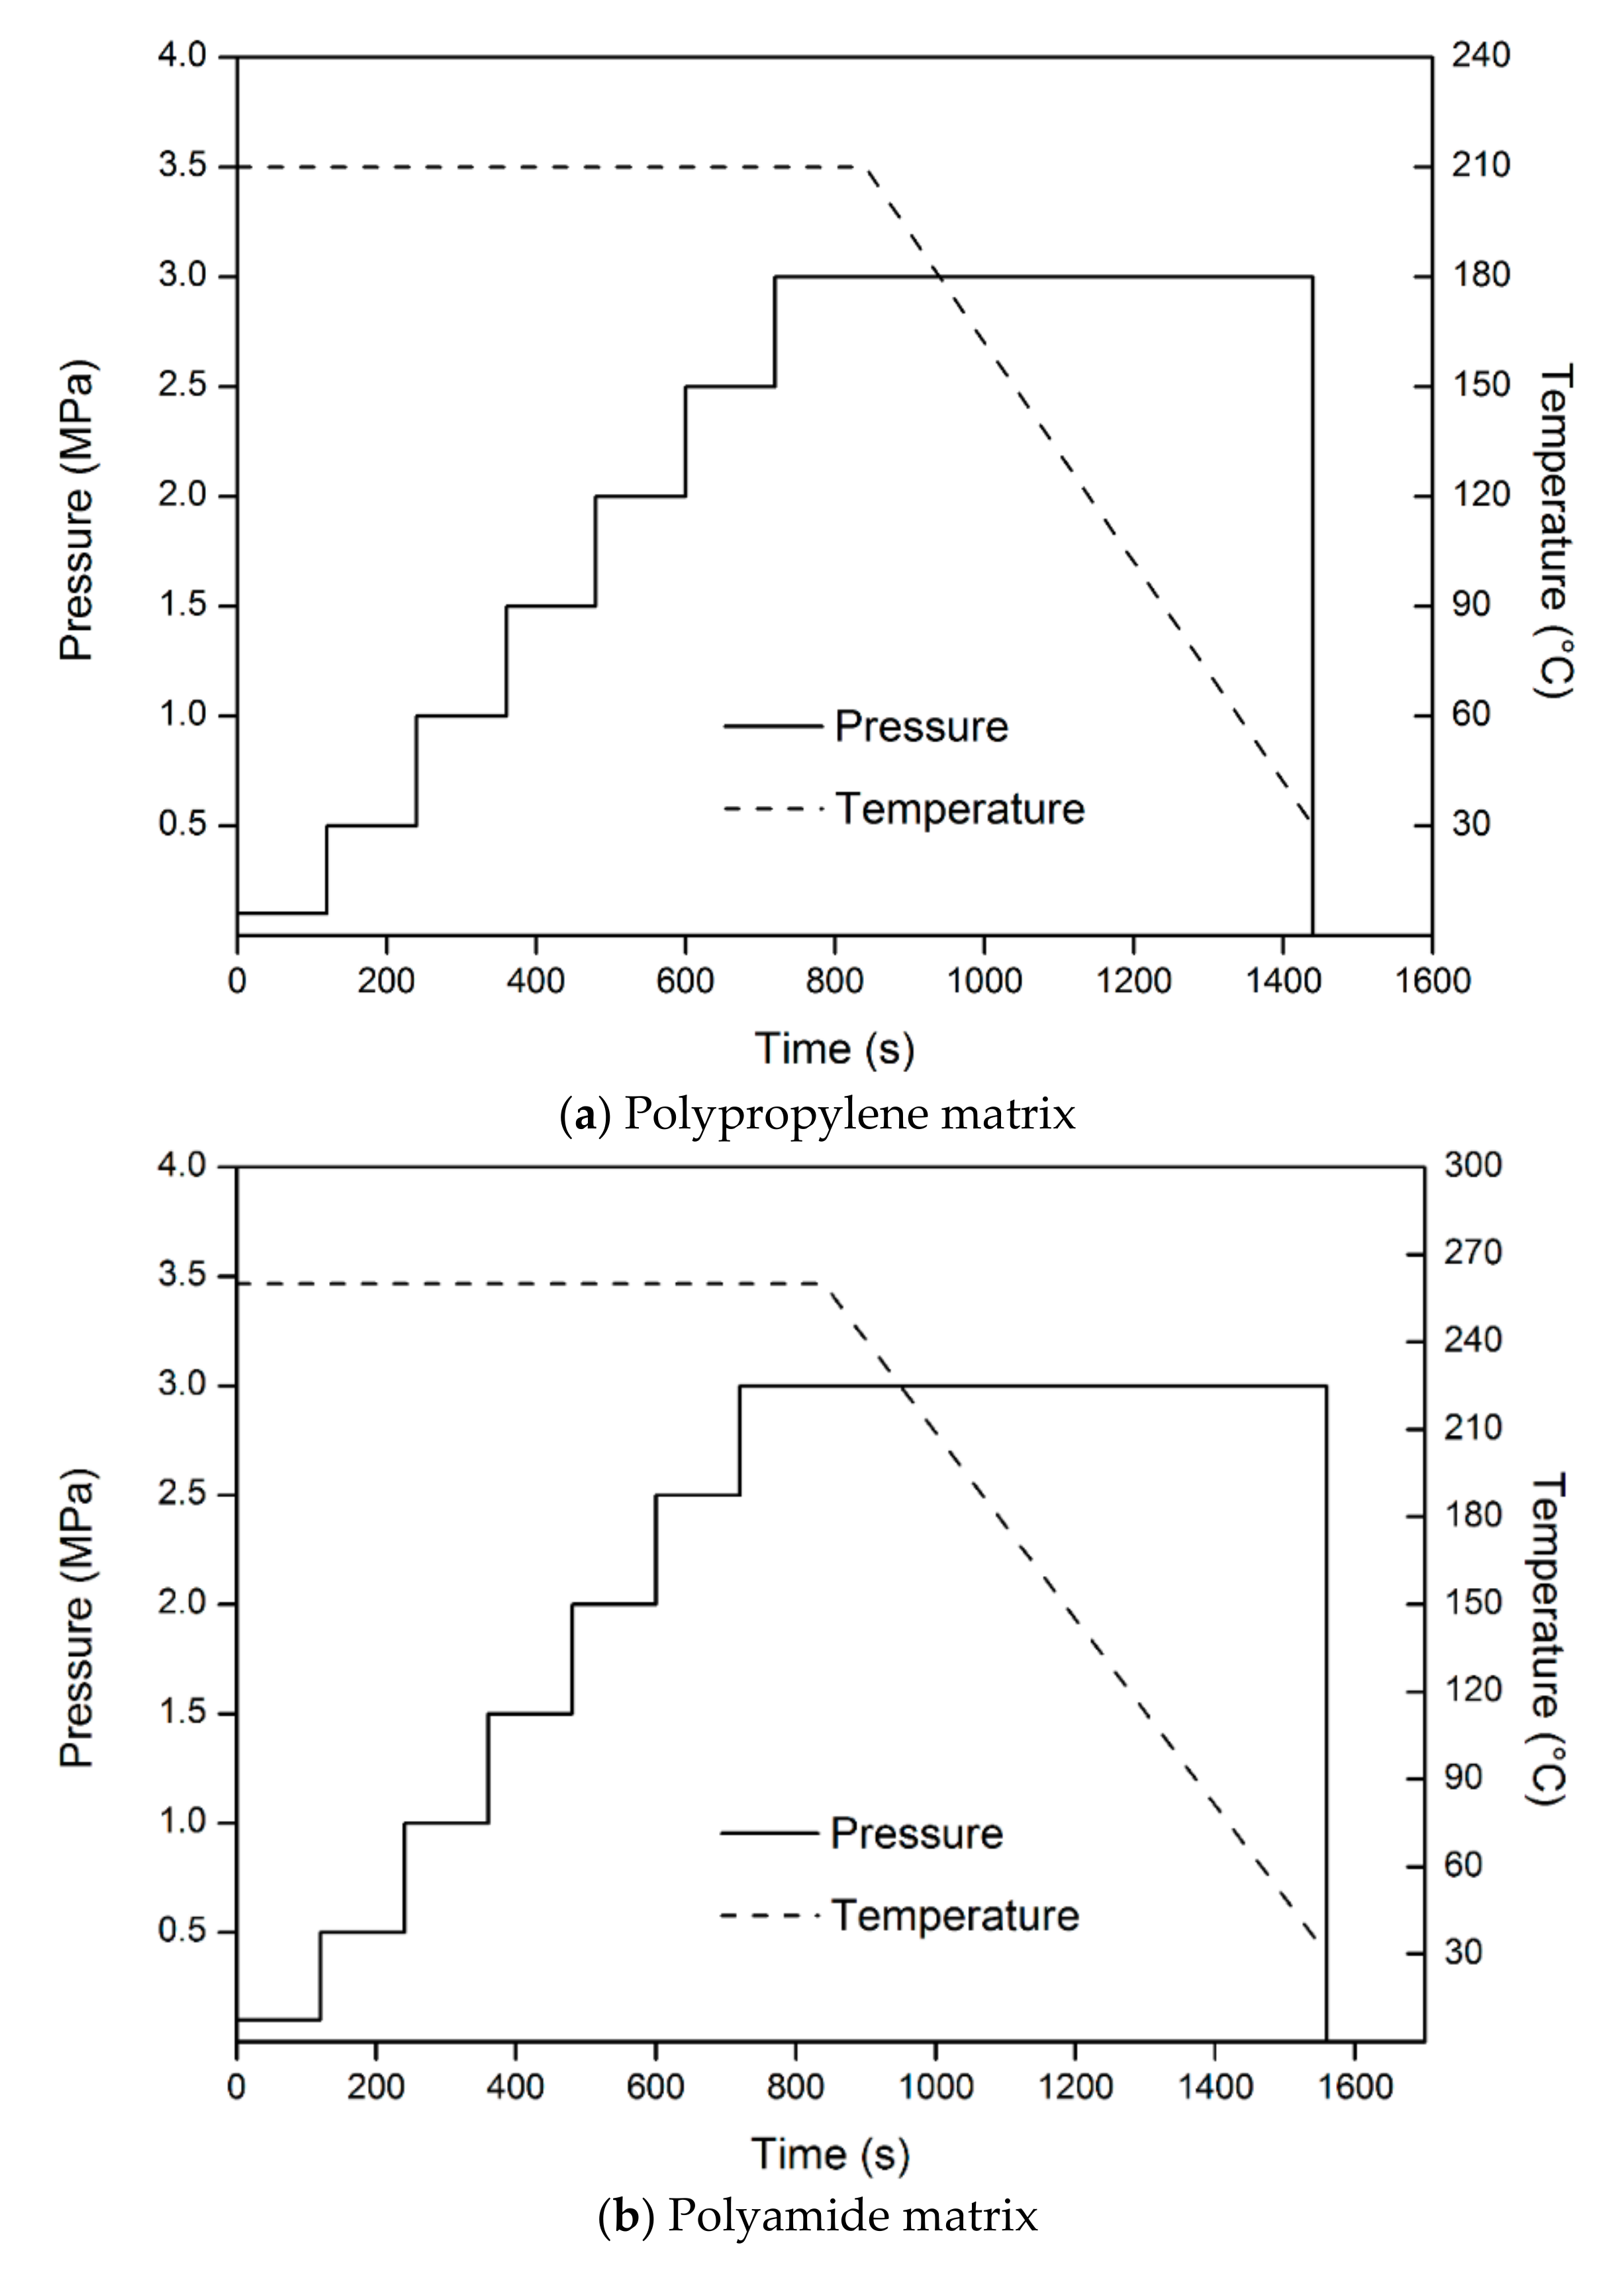
2.1. Description of Specimens

A woven basalt fibers fabric, plain weave type, with a specific mass of 210 g/m2, from Incotelogy, GmbH is used as reinforcement of two types of matrix: Polypropylene and polyamide. The first is polypropylene, Hyosung Topilene PP J640 (MFI@230 °C, 2.16 kg: 10 g/10 min; Songhan Plastic Technology Co., Ltd., Shanghai, China), which is used pure, or modified by adding 2% in weight of Polybond 3000 (PP-g-MA, MFI@190 °C, 2.16 kg: 405 g/10 min; 1.2% in weight of maleic anhydride, by Chemtura, Philadelphia, PA, USA). The other is polyamide (PA6) Lanxess Durethan B30S-000000 (MFI@260 °C, 5 kg: 102 g/10 min). Then, three types of specimens, named: PPB, PC2B, and PA6B are prepared with a pure PP (PPB), a modified one (PC2B), and a polyamide (PA6B) matrix. For the last, the neat interface without any coupling agent has been chosen even if there is mention in the literature of the enhancement introduced by silane coupling [6].
Each specimen includes 18 balanced basalt fabric layers 0°/90° symmetrically arranged with respect to the middle plane of the laminate ([(0/90)9]s configuration), with a basalt fiber content of 50% by volume (the actual relative percentages of fiber and matrix evaluated according to ASTM D 3171-04, Test Method II). The percentage of 50% has been chosen as an optimal value through preliminary tests. Laminates are obtained by alternating layers of matrix films (PP, PC2, PA6) with basalt fibers fabric by the hand lay-up film-stacking technique and compacted with the aid of a compression molding machine (model P400E, Collin GmbH, Germany) under pre-optimized molding conditions (Figure 1). Each specimen is 300 mm × 300 mm with a target thickness of 3 mm.
Some specific details of investigated specimens in terms of code, thickness, and composition are summarized in Table 1.

2.2. Impact Tests

Impact tests are carried out with a modified Charpy pendulum with a hemispherical shaped hammer nose, 12.7 mm in diameter. Each specimen is placed inside a special fixture which includes two large plates, each having a window 12.5 cm × 7.5 cm to allow for the contact with the hammer from one side and likely optical view by an infrared imaging device from the other one [7]. The impact energy varied between 5 and 15 J and is set by suitably adjusting the falling height of the Charpy arm. The choice of the impact energy was to induce mostly barely visible damage to different levels without perforation.

2.3. Non-Destructive Evaluation

After impact two non-destructive testing techniques are used: lock-in thermography and ultrasonic testing.

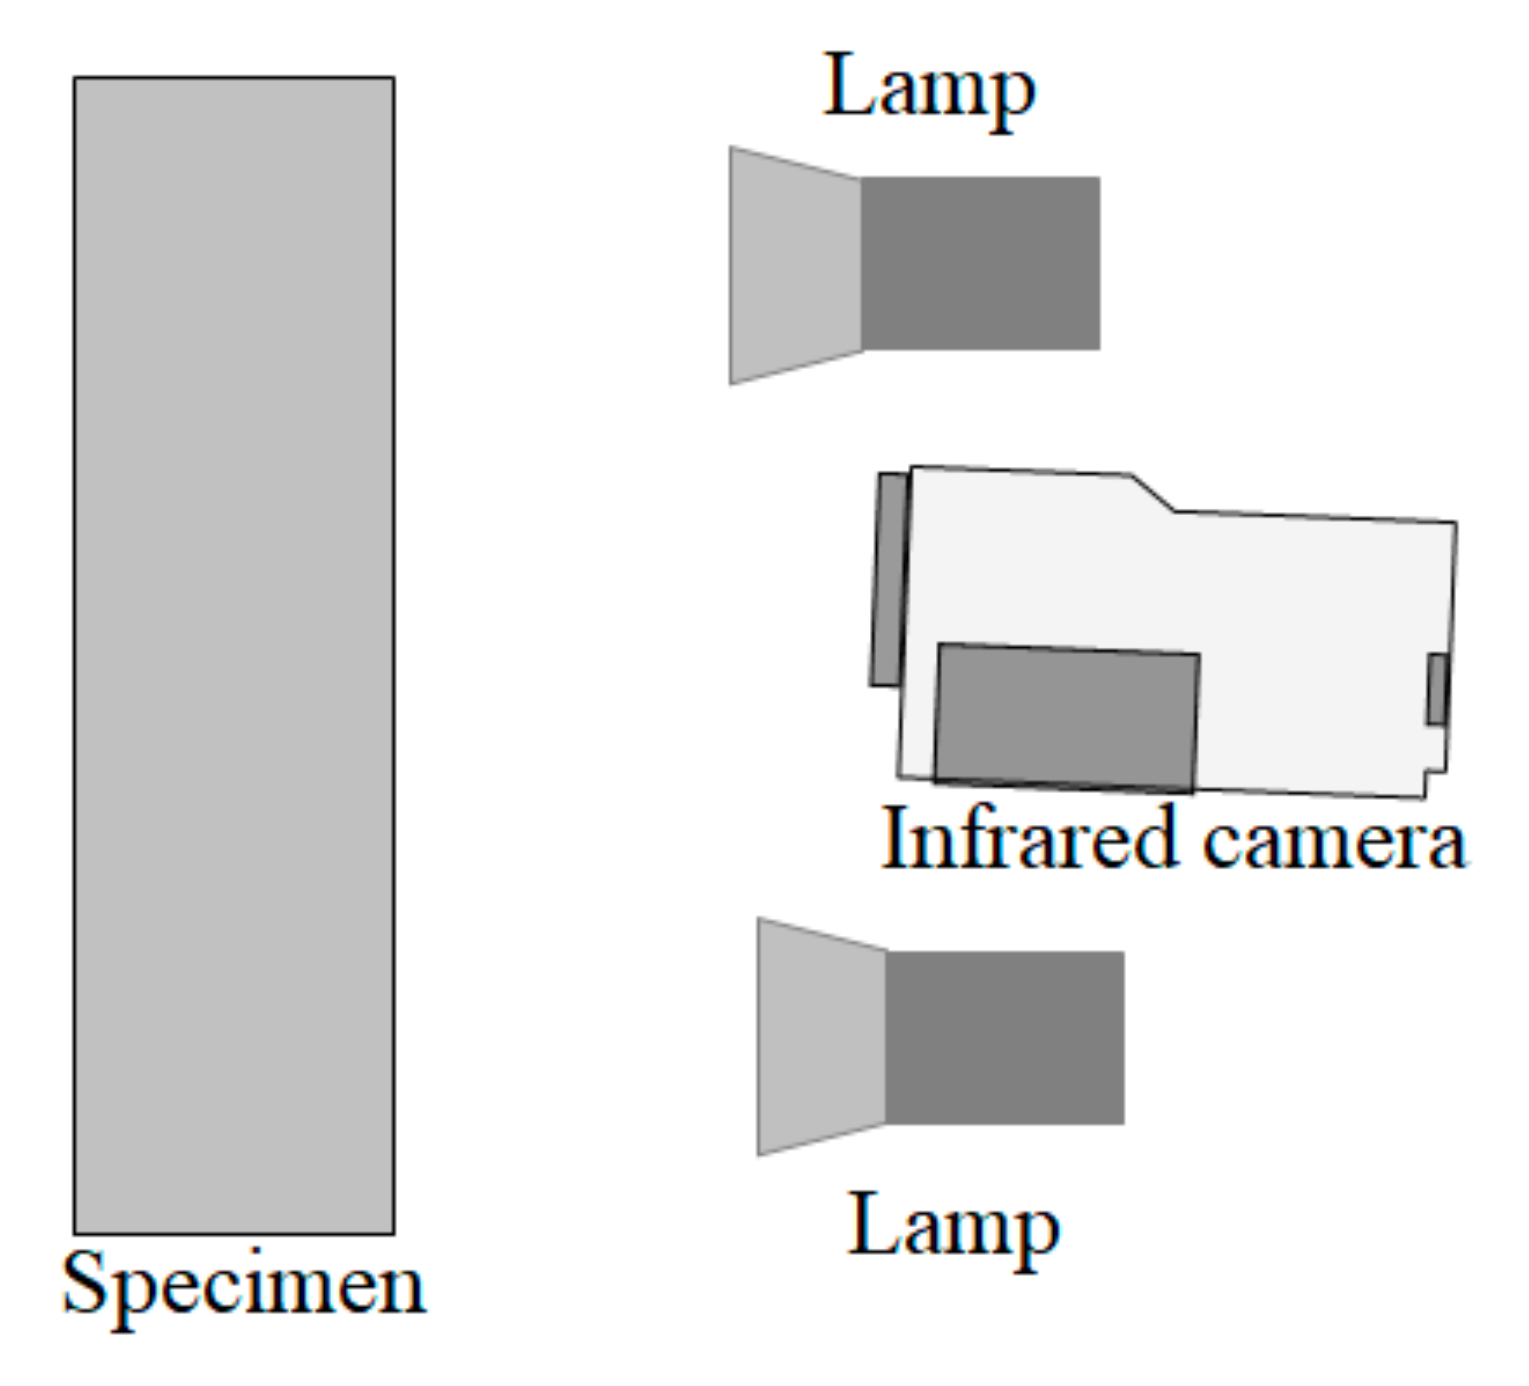
2.3.1. Lock-In Thermography

The test setup includes the impacted specimen, the infrared camera, and two halogen lamps (1 kW each) for thermal stimulation of the specimen [8]. The used infrared camera is the SC6000 (Flir systems), which is equipped with a QWIP detector, working in the 8–9 µm infrared band, NEDT <35 mK, spatial resolution 640 × 512 pixels full-frame, pixel size 25 µm × 25 µm and with a windowing option linked to frequency frame rate and temperature range. The camera is equipped with the lock-in module that drives the halogen lamps to generate a sinusoidal thermal wave of selectable frequency f and with the IRLock-In© software for data analysis.
Lock-in thermography is a well-known technology and will not be herein described in detail; only a sketch of the test setup (Figure 2) and some basics are recalled for easy reading. The thermal wave, delivered to the specimen surface, propagates inside the material and gets reflected when it reaches parts where the heat propagation parameters change (in-homogeneities). The reflected wave interacts with the surface wave producing an oscillating interference pattern, which can be measured in terms of either temperature amplitude, or phase angle φ, and represented as an amplitude, or phase, image, respectively. The basic link of the thermal diffusion length μ to the heating frequency f and to the mean material thermal diffusivity coefficient α is via the relationship:
μ =   α π f .
The depth range for the amplitude image is given by μ, while the maximum depth p, which can be reached for the phase image, corresponds to 1.8 μ [9,10,11,12]. In general, it is preferable to reduce data in terms of phase image because of its insensitivity to either non-uniform heating or local variations of emissivity over the monitored surface. The material thickness, which can be inspected, depends on the wave period (the longer the period, the deeper the penetration) and on the material thermal diffusivity.
As stated in Equation (1), to check the material conditions at a given depth, both the knowledge of the thermal diffusivity and the correct choice of the heating frequency are fundamental parameters. The thermal diffusivity can be evaluated with either the lock-in technique itself or with flash thermography.

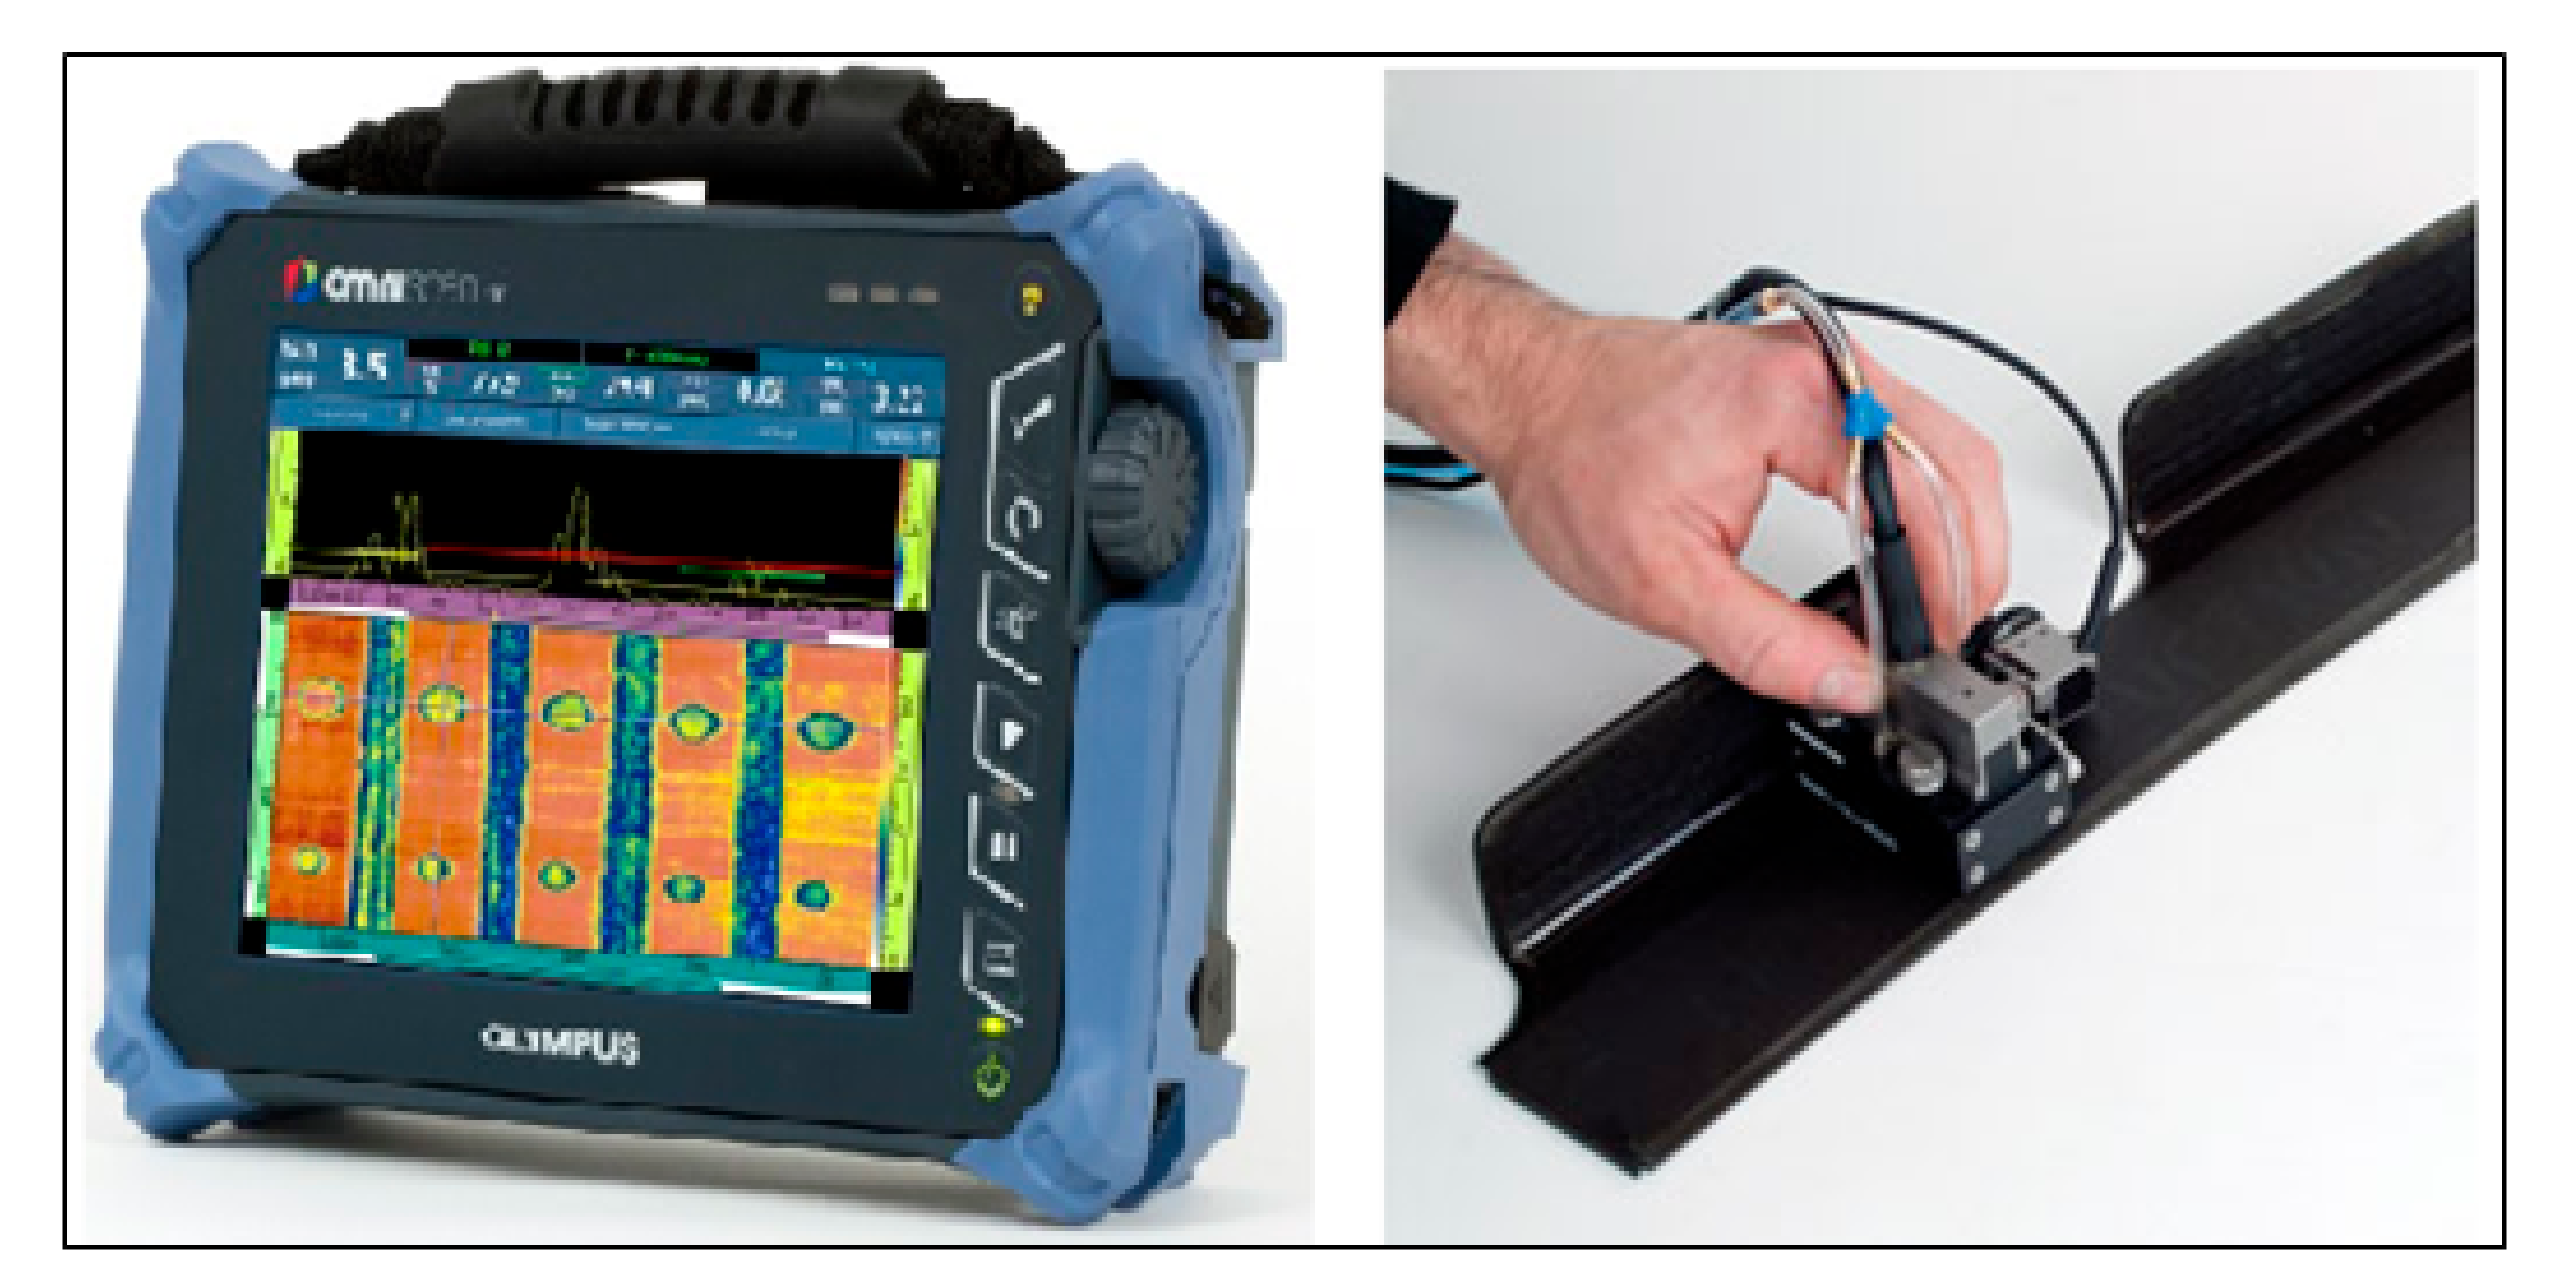
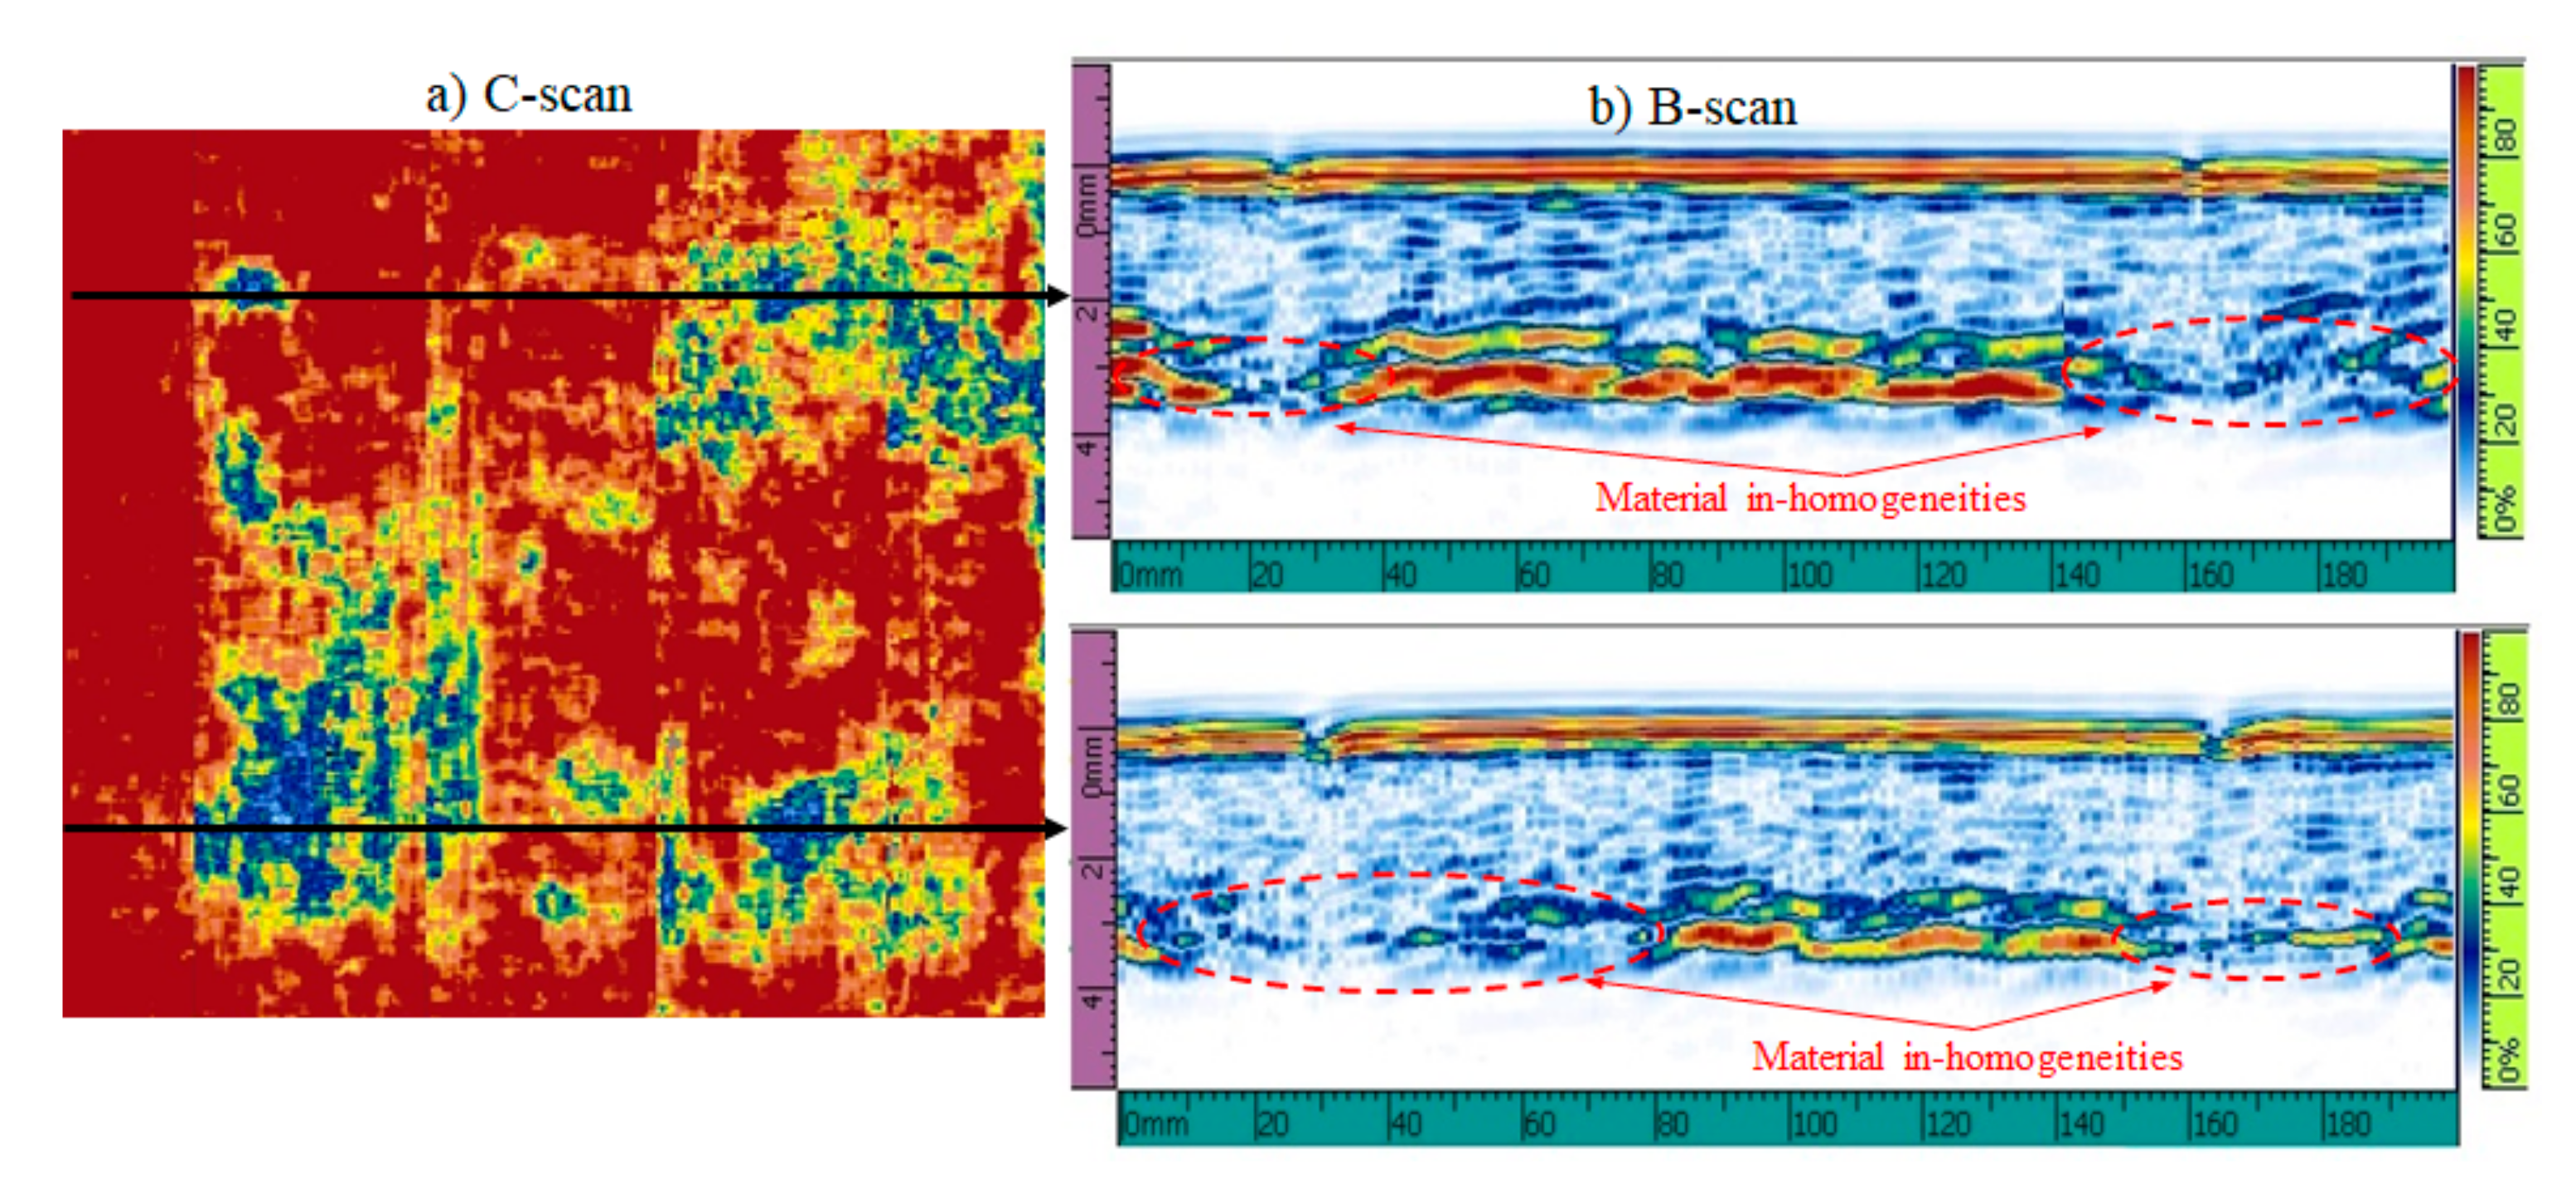
2.3.2. Ultrasonic Testing

Ultrasonic non-destructive inspection is performed with an ultrasonic flaw detector Olympus OmniScan SX with phased array unit (Figure 3). The Omniscan detector is equipped with a phased array 16:64PR probe and with an ultrasonic (UT) conventional channel allowing for pulse-echo (PE), pitch-catch, or time-of-flight diffraction (TOFD) methods of inspection [13]. To perform the inspection the phased array probe elements are pulsed simultaneously, or with a time lag, in order to promote ultrasonic beamforming that is the constructive interference of multiple-beam components into a single wavefront traveling in the desired direction. Correspondingly, in the acquiring mode, the receiver is able to combine the signals (echoes) coming from multiple elements (reflectors) into a single representation. Exploiting the phasing technology that allows beam shaping and steering, it is possible to generate a wide variety of ultrasonic beam profiles with a single probe assembly, and, at the same time, to dynamically set the beam steering to perform electronic scans.
Phased array ultrasonic instruments, whose operating principle relies on the physics that governs sound wave propagation, apply high-frequency sound waves to either detect buried anomalies or measure the thickness of a testing article [14]. The capability to produce multiple transducer paths within one probe represents a great advantage in defects detection and visualization [15]. Phased array imaging allows seeing relative point by point changes and multidirectional defect responses, which help in flaw detection, discrimination, and sizing [16].
In particular, the ultrasonic device records two parameters of the reflected echo: The amplitude and the echo time of flight with respect to a zero point (pulse transit time). The echo time of flight, in turn, is correlated with the depth or distance of the reflector, exploiting the sound velocity knowledge of the tested material and the simple relationship:
Distance = velocity × time.
The fundamental presentation of ultrasonic waveform data is the A-scan graph, in which amplitude and transit time of the echo are plotted on a grid where the vertical axis represents the amplitude and the horizontal axis represents the time of flight.
A different plotting way is in the form of B-scan, which visualizes the depth of reflectors (a defect/damage) with respect to their position along the scanning axis. The inspected test article thickness is plotted as a function of time or position while the probe is moved along the upper part surface to provide material depth profile. The correlation of echoes data with the transducer positions allows a through-thickness representation of the material and to link track data with the specific inspected areas.
The probe position tracking is performed by the use of an electromechanical encoder, a small wheel connected to the probe, that enables the position and orientation of the probe along the scanning axis to be recorded with the echoes amplitude data (A-scan) allowing the 2D reconstructions. A useful 2D presentation option is the C-scan graph, in which the data are displayed in a top or planar view of the test piece, something similar to an x-ray image, where color represents the signal amplitude or the reflector depth at each point of the inspected test piece.
In the present work, tests are performed by means of an encoded 5 MHz, phased array transducer with 64 active elements arranged in a linear array with a pitch of 1 mm and a straight wedge. The system calibration is performed by considering the specimen thickness as a reference, so no calibration blocks are used.

3. Results

Results are presented as phase images for LT and as C-scan and B-scan images, amplitude top and sectional views respectively, for ultrasonic testing (UT); data are compared to highlight the advantages and limitations of the two techniques. As the first and most important observation, the comparison between LT and UT is done only for the PA6B specimen. This is because, from preliminary tests, the surface of both PPB and PC2B specimens are found to be permeable to the ultrasonic coupling medium (water, or gel); this has made the C-scan inspection impossible to perform in consequence of the background noise amplification due to the liquid ingress effect, which blinds the ultrasonic device. Therefore, these two specimens are inspected only with LT.

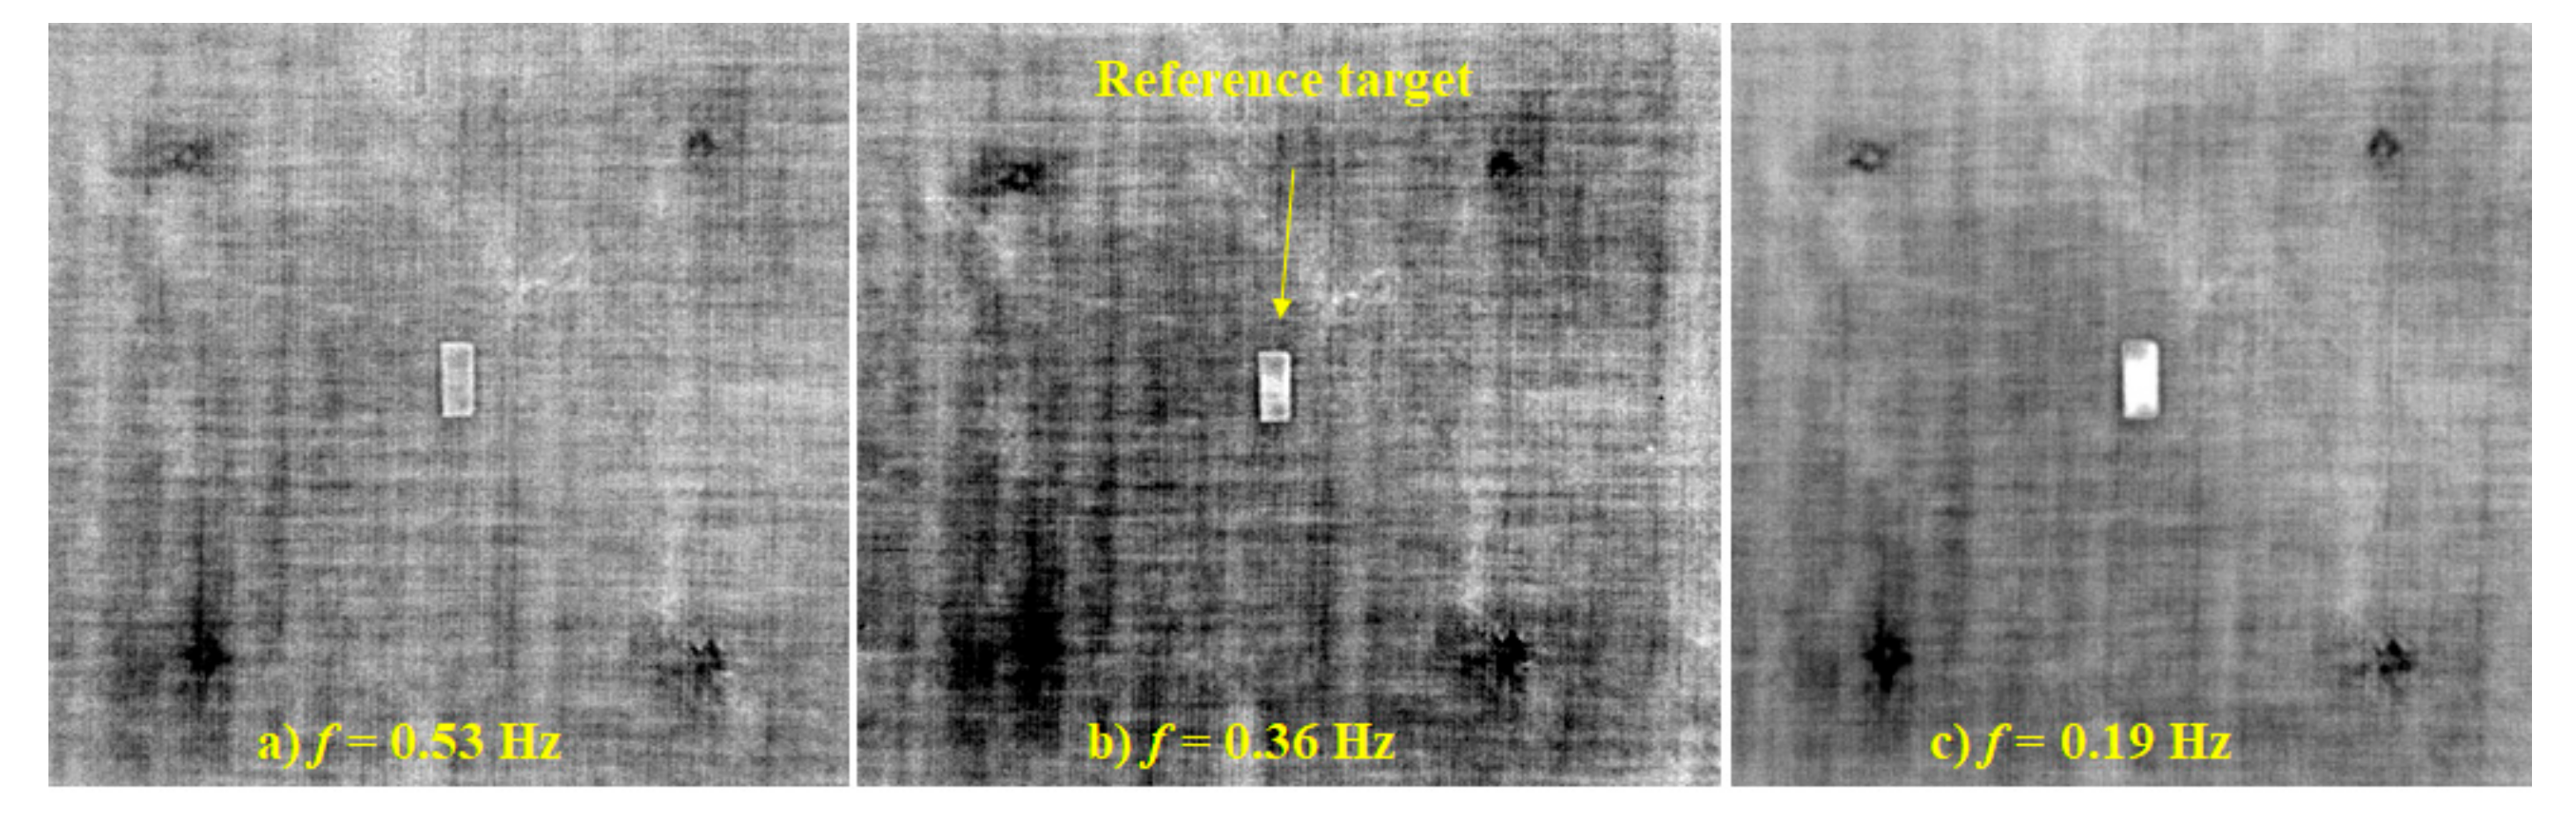
3.1. Polyamide Matrix-Based Specimen

Firstly, a photo of the PA6 specimen taken after impact is reported in Figure 4. As indicated, the specimen was subjected to four impacts with energies: 5, 9, and 15 J and with two impacts at the same E = 9 J. The location of each impact is also recognizable from the light local surface discoloration.
Three phase images taken from the impacted side (shown in Figure 4) are reported in Figure 5; a reference target of 19 mm × 8 mm, clearly visible on each image, allows for fast estimation of the damage size. From these phase images it is possible to see that:
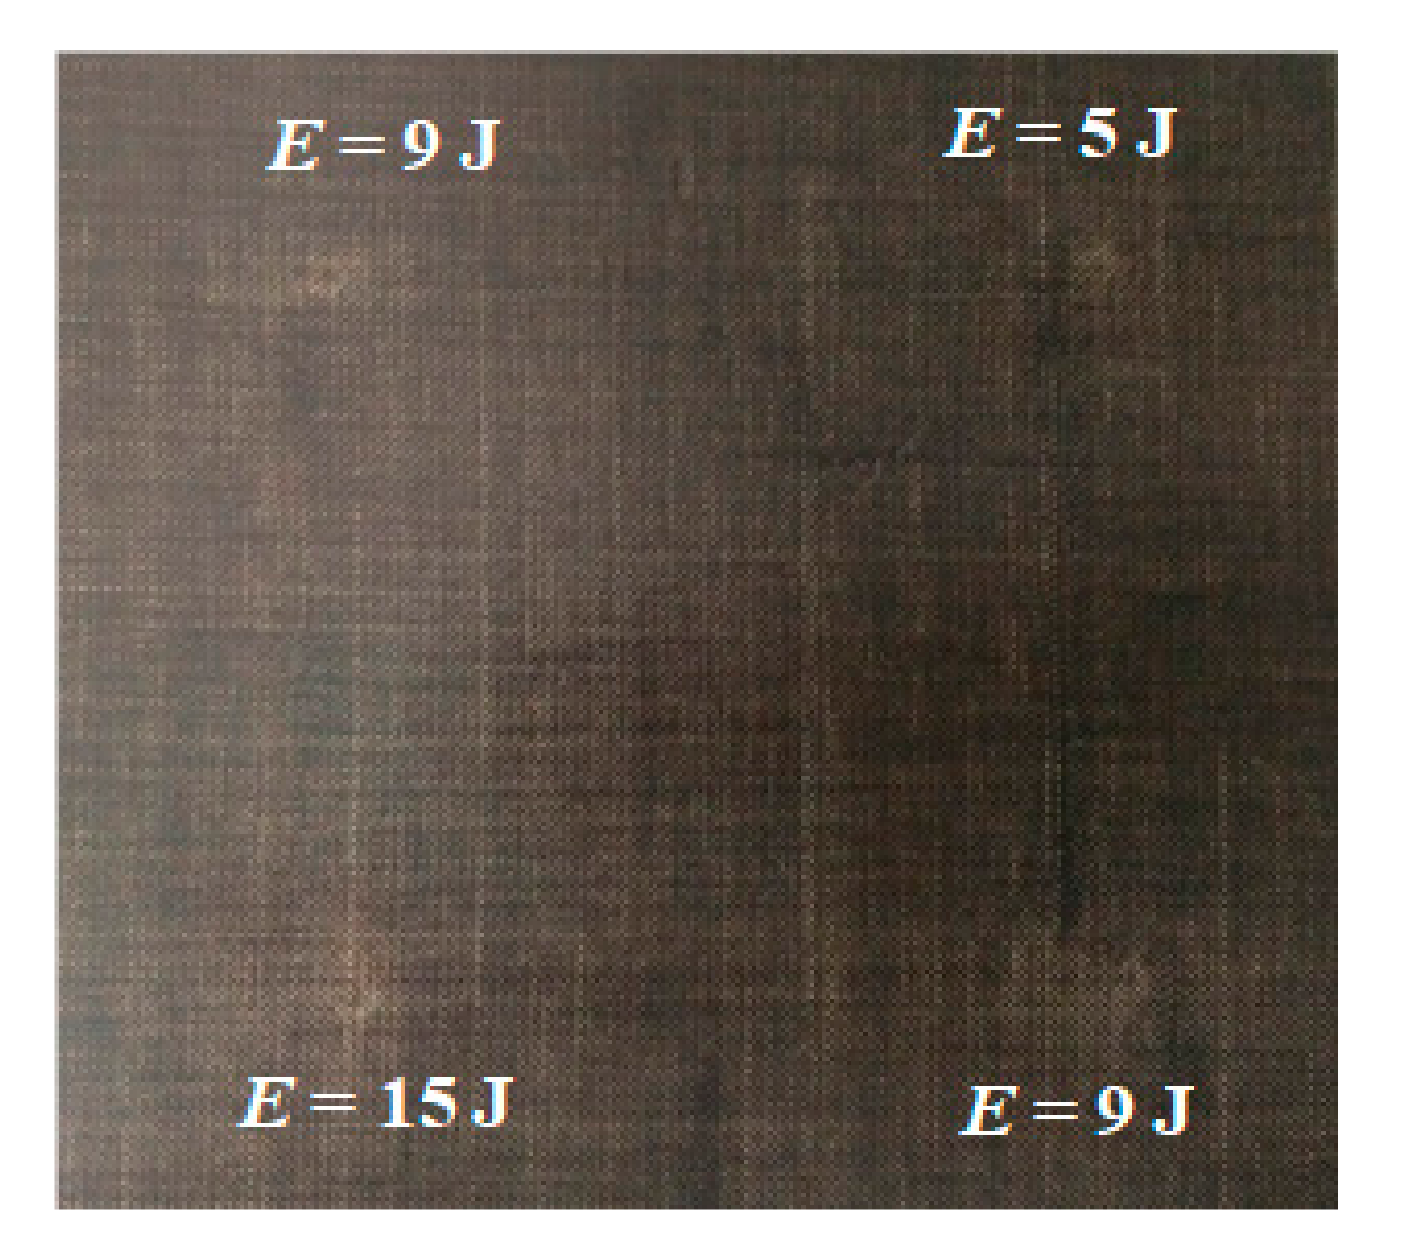
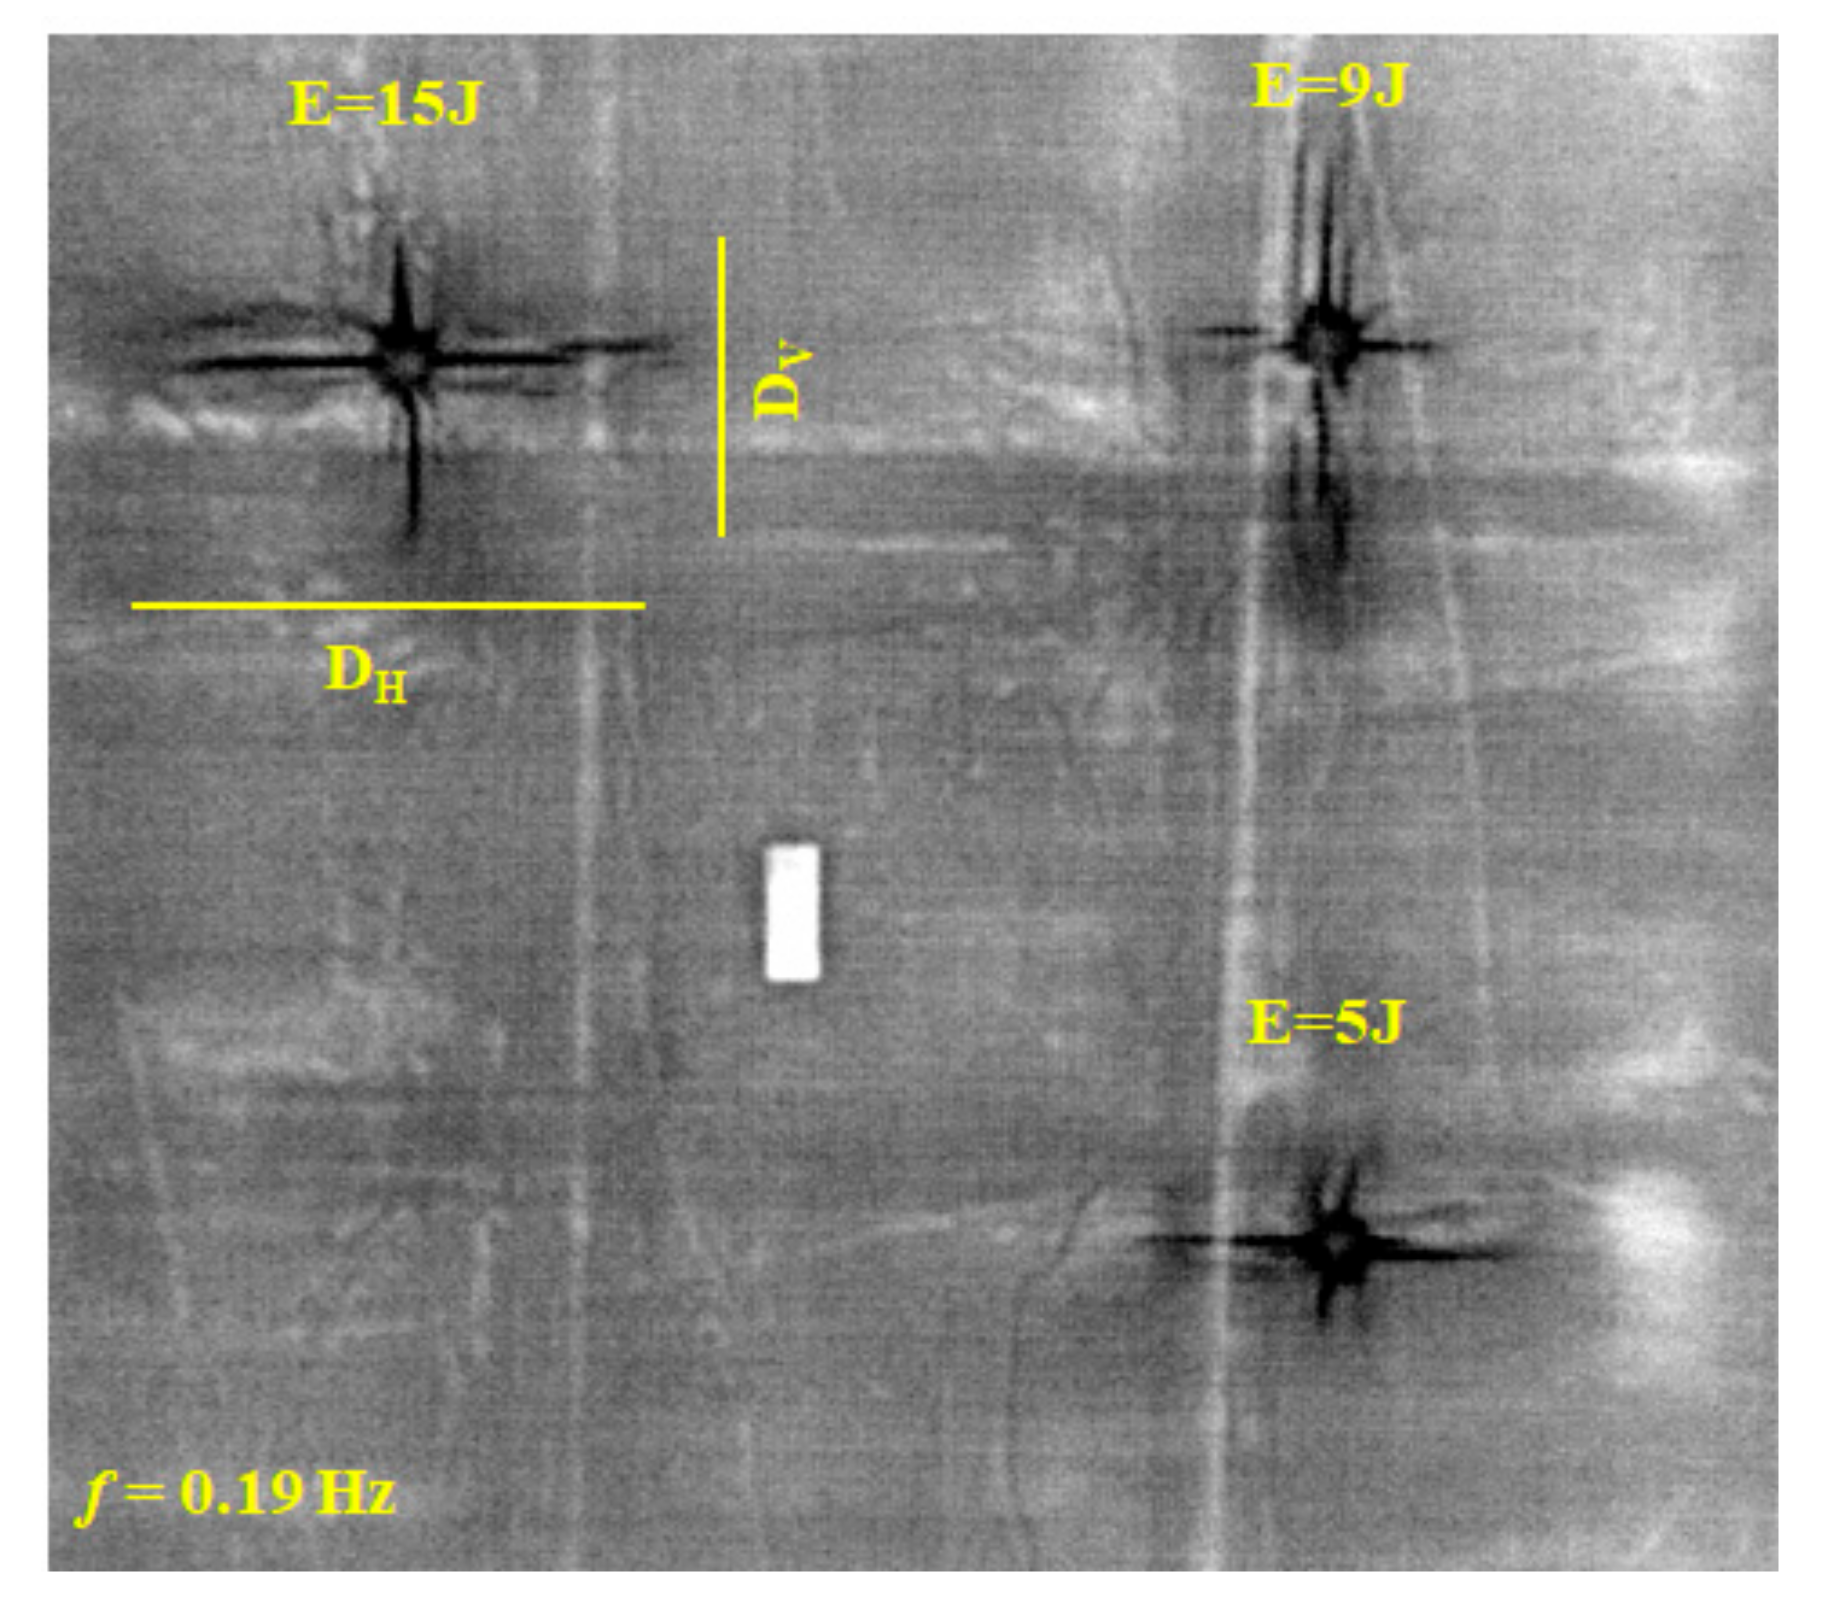
  • There are dark stains in correspondence of the four impacts.
  • The size of dark stains increases with the impact energy.
  • Going in-depth, the stains first expand by decreasing f from 0.53 Hz (Figure 5a) to 0.36 Hz (Figure 5b), and after contracting to their initial size to a further reduction of f to 0.19 Hz (Figure 5c).
In particular, the dark zone centered at the impact point of E = 15 J (Figure 5a) assumes for f = 0.36 Hz (Figure 5b) a well H shaped configuration being representative of the delamination evolution along the vertical fiber’s direction. Such a vertical displacement may be explicable owing to the fact that, during the impact, the specimen was positioned inside the lodge with the vertical direction of the fibers (as shown in Figure 5b) along the longer side of the lodge’s window (12.5 cm × 7.5 cm). In addition, it is possible to see threadlike structures resembling cracks in the matrix which are most pronounced around the impact point of 9 J on the bottom (Figure 5b). However, apart from the clearly visible impact coupled stains, there are other dark zones mostly present on the phase image taken at f = 0.36 Hz (Figure 5b), which are distributed away from the impact points and which may indicate that material in-homogeneities likely occurred during the manufacturing process. All of these dark structures fade going more in-depth; they remain clearly evident for f = 0.19 Hz (Figure 5c) mostly around the impact points.
What is observed in Figure 5b is practically confirmed by the C-scan image of Figure 6a. In fact, the black color of Figure 5b is replaced by the dark blue color of Figure 6a to highlight the indentation of each impact and the most important damage.
In particular, it is confirmed the presence of delamination along the direction of the vertical fibers and it is also confirmed the presence of material in-homogeneity around impacts at 15 J, 9 J (on the right bottom), and 5 J and far away from the impact points. In addition, the dark structures around the impact at 5 J of Figure 5 are better depicted as blue-green structures in Figure 6. The comparison between Figure 5 and Figure 6 helps to classify such structures as material in-homogeneities rather than impact-induced damage. As already evidenced, such in-homogeneities display their best contrast for f = 0.36 Hz (Figure 5b) meaning that they are mostly located in the second half of the specimen thickness towards the bottom. It is worth noting that around the impact points in-homogeneities are present for lower f (Figure 5c) and so extend to the entire thickness. This set of evidence, probably exacerbated by impact effects, are confirmed in the ultrasonic B-scan sections (Figure 6b), where it is possible to see wide porosity areas through the stratification close to the opposite surface of the impacted side.

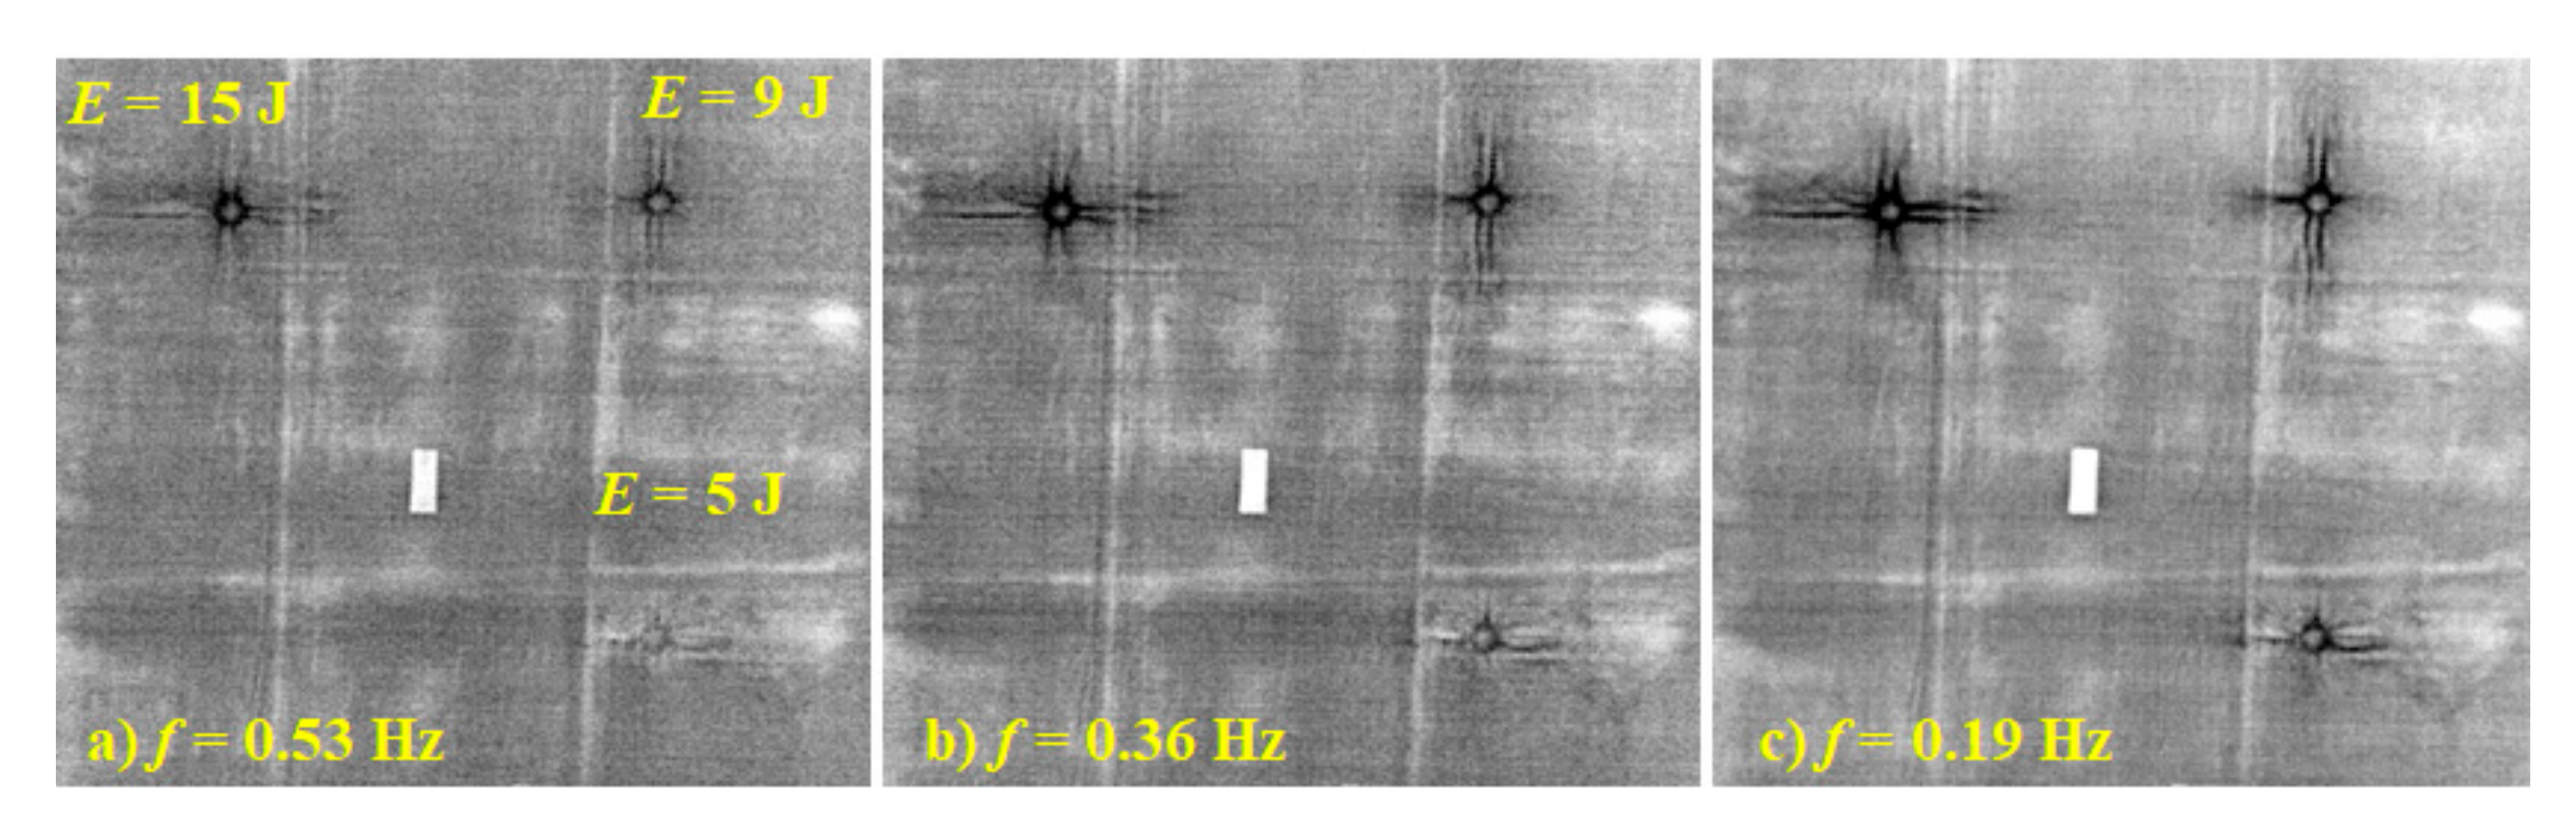
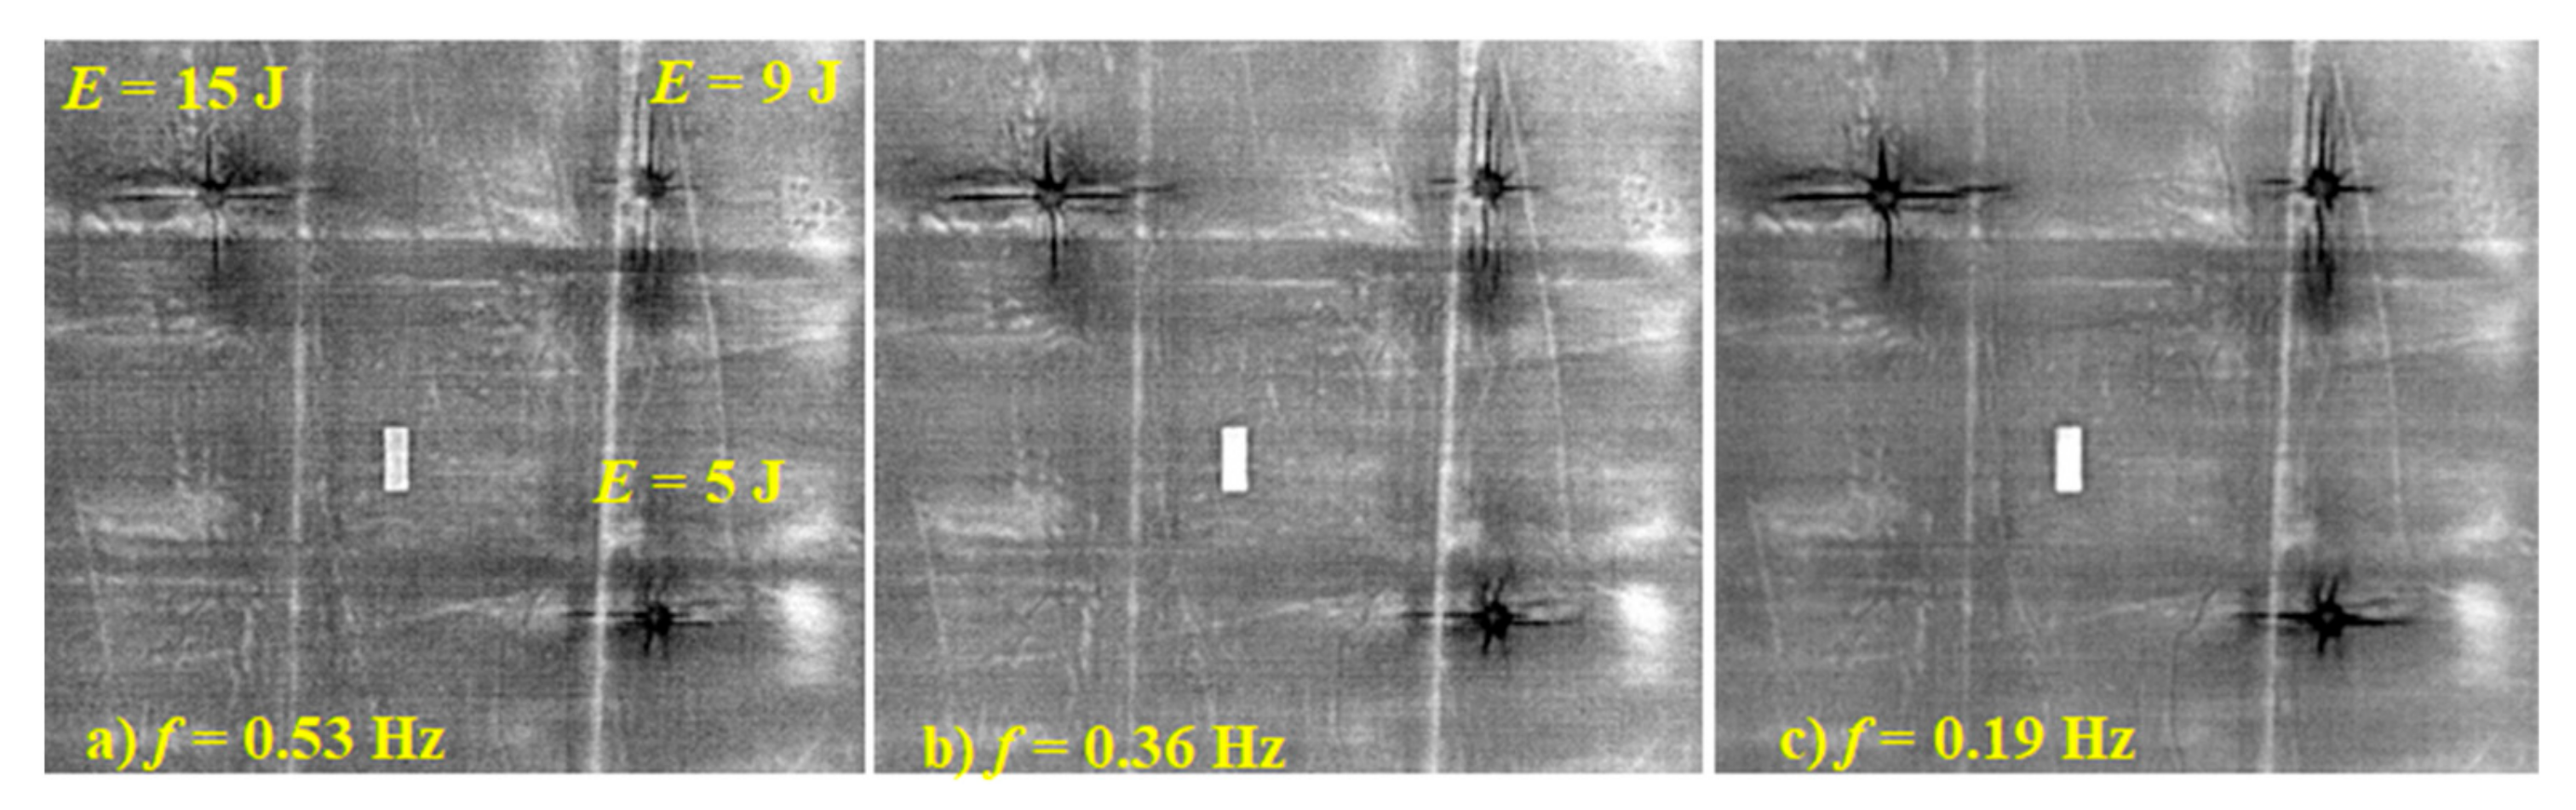
3.2. Polypropylene Matrix-Based Specimens

The Figure 7 and Figure 8 show phase images, taken from the impacted side, of the two specimens PPB (Figure 7) and PC2B (Figure 8), which were subjected to three impacts at 5 J, 9 J, and 15 J as indicated on the first image (a) of both Figure 8 and Figure 9. Figure 9 shows a comparison between phase images taken at f = 0.19 Hz from the rear side (opposite to impact) of the three specimens PA6B (Figure 9a), PPB (Figure 9b), and PC2B (Figure 9c).
As a general observation, the occurred damage appears in the form of a cross-shaped structure with a central ring. The cross’s branches indicate the main deformation directions while the ring may be assumed to coincide with the imprint of the impactor. The cross is more accentuated for the highest impact energy of 15 J and achieves its best contrast at f = 0.19 Hz (Figure 7c Figure 8c). As a main difference between the two specimens, the cross is depicted by fan-like branches in the PPB specimen (Figure 7) and by almost straight lines in the PC2B one (Figure 8). Such a difference is a symptom of different behavior of the two materials under the impact. It is worth noting that the superimposed layers of the PPB specimen are not fully rigidly connected at their interface but are free to somehow mutually slide. Instead, the stronger bond entailed by the grafting agent in the PC2B specimen prevents slipping effects of layers and allows for bending and deformation through the entire thickness. This may entail wrinkling in the layers furthest from the impact point as shown in Figure 9c.

3.3. Measurement of Damage Extension

The extension of the occurred impact damage is evaluated by considering its elongation along horizontal (DH) and vertical (DV) directions as represented in Figure 10. These values are extracted from the phase images through a correspondence pixels/mm by considering the reference target.
DH and DV values are supplied only for PPB (Table 2) and PC2B (Table 3) specimens for which the most important damage develops along well-defined directions.
Instead, as already shown and described, the PA6B specimen displays patchy damage which cannot be simplified with its displacement in the two directions only; therefore, no measurements are reported for this specimen. Coming back to Table 2 and Table 3 it is possible to see the tendency towards longer cuts on the PC2B specimen. This is reliable because improving the interface bond makes the material more brittle and prone to fractures.

4. Data Discussion and Concluding Remarks

The obtained results lend themselves to several considerations:
  • The investigated materials are susceptible to defects formation during manufacturing. These defects may include non-uniform distribution of matrix and may be ascribed to non-uniform distribution of temperature and application of pressure during the compression cycle. This is likely to occur because of the compression performed in a press.
  • Both lock-in thermography and ultrasonic testing can discover either impact damage, or manufacturing defects in PA6 matrix-based specimens with a general data agreement. This is well documented by a comparison between Figure 3 and Figure 4.
  • Polypropylene/basalt specimens being hydrophilic get soaked with the coupling gel and cannot be inspected with gel-based UT. Instead, lock-in thermography, acting in a remote way without any contact, is well suited and effective to detect both manufacturing defects and impact damage, also in polypropylene-based specimens.
  • Specimens involving PA6 as a matrix display better mechanical properties and react to impact with less extensive damage with respect to specimens involving polypropylene as a matrix. This because both polyamide and basalt fibers have polar chemical structure, which enables proper interface adhesion even in the absence of a coupling agent. Instead, the a-polar nature of polypropylene requires the addition of coupling agents and/or any prior treatment of fibers to assure good interfacial adhesion.
  • The presence of the coupling (compatibilizing) agent has no significant effects on the extension of the impact damage with regards to the branches length on the superficial layer but mostly affects the deformation way of the underlying layers. More specifically, a stronger interface adhesion entails a crumple effect with stretching of the bottom layer. This effect is evident looking at the phase images taken from the rear of specimens PA6B (Figure 9a) and PC2B (Figure 9c) in comparison with the phase image of the specimen PPB (Figure 9b), which appear almost flat.
On the whole, and by taking into account the points listed above, it seems preferable to build composites by embedding basalt fibers inside a polyamide matrix since the obtained composites seem to possess better characteristics and can be inspected with both LT and UT techniques. However, in some specific applications, polypropylene-based composites may be preferable relying on the use of infrared thermography for non-destructive evaluation. It is also worth noting that by means of specific measures it is possible to improve manufacturing and guarantee surface waterproofing allowing testing with liquid-coupled probes. Of course, the choice of materials involves many other factors such as: performance, suitability, green aptitude, easy inspection, costs, etc., leading to a compromise.

Author Contributions

Conceptualization: All authors; specimens preparation: G.S.; impact tests: N.D.B. and E.M.; investigation with LT: S.B., and C.M.; software and data reduction: S.B.; investigation with UT: N.D.B., E.M.; data analysis and discussion: C.M., S.B., N.D.B., and G.S.; writing—original draft preparation: C.M.; revision: G.M.C.; all authors revised and approved the final version.

Funding

This research received no external funding.

Conflicts of Interest

The authors declare no conflict of interest.

References

  1. Collier, M.C.; Baird, D.G. Separation of a thermotropic liquid crystalline polymer from polypropylene composites. Polym. Compos. 1999, 20, 423–435. [Google Scholar] [CrossRef]
  2. Fiore, V.; Scalici, T.; Di Bella, G.; Valenza, A. A review on basalt fibre and its composites. Compos. Part B Eng. 2015, 74, 74–94. [Google Scholar] [CrossRef]
  3. Lopresto, V.; Leone, C.; De Iorio, I. Mechanical characterisation of basalt fibre reinforced plastic. Compos. Part B Eng. 2011, 42, 717–723. [Google Scholar] [CrossRef]
  4. Sarasini, F.; Tirillò, J.; Valente, M.; Valente, T.; Cioffi, S.; Iannace, L. Sorrentino, Effect of basalt fiber hybridization on the impact behavior under low impact velocity of glass/basalt woven fabric/epoxy resin composites. Compos. Part A Appl. Sci. Manuf. 2013, 47, 109–123. [Google Scholar] [CrossRef]
  5. Meola, C.; Boccardi, S.; Carlomagno, G.M.; Boffa, N.D.; Monaco, E.; Ricci, F. Nondestructive evaluation of carbon fibre reinforced composites with infrared thermography and ultrasonics. Compos. Struct. 2015, 134, 845–853. [Google Scholar] [CrossRef]
  6. Vikas, G.; Sudheer, M. A Review on Properties of Basalt Fiber Reinforced Polymer Composites. Am. J. Mater. Sci. 2017, 7, 156–165. [Google Scholar]
  7. Boccardi, S.; Boffa, N.D.; Carlomagno, G.M.; Del Core, G.; Meola, C.; Russo, P.; Simeoli, G. Inline monitoring of basalt-based composites under impact tests. Compos. Struct. 2019, 210, 152–158. [Google Scholar] [CrossRef]
  8. Meola, C.; Boccardi, S.; Carlomagno, G.M. Infrared Thermography in the Evaluation of Aerospace Composite Materials; Woodhead Publishing Print Book: Sawston, UK, 2016; 180p, ISBN 9781782421719. [Google Scholar]
  9. Busse, G. Optoacoustic phase angle measurement for probing a metal. Appl. Phys. Lett. 1979, 35, 759–760. [Google Scholar] [CrossRef]
  10. Letho, A.; Jaarinen, J.; Tiusanen, T.; Jokinen, M.; Luukkala, M. Magnitude and phase in thermal wave imaging. Electron. Lett. 1981, 17, 364–365. [Google Scholar]
  11. Beaudoin, J.-L.; Merienne, E.; Danjoux, R.; Egee, M. Numerical system for infrared scanners and application to the subsurface control of materials by photothermal radiometry. Proc. SPIE 1985, 590, 287–292. [Google Scholar]
  12. Busse, G.; Wu, D.; Karpen, W. Thermal wave imaging with phase sensitive modulated thermography. J. Appl. Phys. 1992, 71, 3962–3965. [Google Scholar] [CrossRef]
  13. Advances in Phased Array Ultrasonic Technology Applications; Manual; Olympus Scientific Solutions Americas (OSSA): Waltham, MA, USA, 2007.
  14. Ensminger, D.; Bond, L.J. Ultrasonics: Fundamentals, Technologies, and Applications, 3rd ed.; CRC Press: Boca Raton, FL, USA, 2011. [Google Scholar]
  15. Taheri, H.; Hassen, A.A. Nondestructive Ultrasonic Inspection of Composite Materials: A Comparative Advantage of Phased Array Ultrasonic. Appl. Sci. 2019, 9, 1628. [Google Scholar] [CrossRef]
  16. Drinkwater, B.W.; Wilcox, P.D. Ultrasonic arrays for non-destructive evaluation: A review. NDT&E Int. 2006, 39, 525–541. [Google Scholar]
Figure 1. Molding compression pressure and temperature against time for polypropylene (PP) based (a) and polyamide (PA6B) based (b) matrices.
Applsci 09 03025 g001
Figure 2. Scheme of the lock-in thermography setup.
Applsci 09 03025 g002
Figure 3. Some details of the ultrasonic (UT) testing setup.
Applsci 09 03025 g003
Figure 4. Photo of the polypropylene added with 2% maleic anhydride (PA6B) specimen with indicated energy and location of the impacts.
Applsci 09 03025 g004
Figure 5. Phase images taken on the impacted side of the PA6B specimen at three heating frequencies; (a) f = 0.53 Hz; (b) f = 0.36 Hz; (c) f = 0.19 Hz (see Figure 2 for impact energies location).
Applsci 09 03025 g005
Figure 6. C-scan (a) and B-scan (b) images taken on the impacted side of the PA6B specimen (see Figure 4 for impact energies location).
Applsci 09 03025 g006
Figure 7. Phase images taken on the impacted side of the pure polypropylene (PPB) specimen at three heating frequencies; (a) f = 0.53 Hz; (b) f = 0.36 Hz; (c) f = 0.19 Hz.
Applsci 09 03025 g007
Figure 8. Phase images taken on the impacted side of the PC2B specimen at three heating frequencies; (a) f = 0.53 Hz; (b) f = 0.36 Hz; (c) f = 0.19 Hz.
Applsci 09 03025 g008
Figure 9. Phase images taken at f = 0.19 Hz on the rear side of the three specimens; (a) PA6B; (b) PPB; (c) PC2B.
Applsci 09 03025 g009
Figure 10. Indication of DH and DV over a phase image.
Applsci 09 03025 g010
Table 1. Some specimens details.
CodeMatrixThickness (mm)
PA6BPolyamide3.0
PPBPure polypropylene3.0
PC2BPolypropylene added with 2% maleic anhydride3.0
Table 2. Values of DH and DV for the PPB specimen through LT testing.
E (J)DH (mm)DV (mm)
540.0 24.0
946.054.0
1575.442.0
Table 3. Values of DH and DV for the PC2B specimen through LT testing.
E (J)DH (mm)DV (mm)
558.024.0
938.074.6
1575.444.0

