1. Introduction
Energy transitions are gaining momentum with the digitalization of power systems and the use of smart grid technologies, which enable various possibilities to efficiently integrate renewable energy sources within the residential sector. In 2011, the European Commission acknowledged the importance of promoting smart grids and smart metering throughout the EU in their communication “Smart Grids: from innovation to deployment” [
1]. Various benefits were highlighted: empowering consumers to directly control and manage consumption patterns [
2,
3], enabling time-dependent electricity prices, providing more cost-efficient energy use, enhancing security of the grid [
4,
5] enabling integration of renewable energy [
6] and electric vehicles (EV) [
7], boosting future competitiveness and technological leadership, and providing a platform for the development of innovative energy services from individual users and through aggregator companies [
8,
9,
10].
The translation of these theoretical benefits towards practical applications has led to the implementation of many smart grid pilots within the EU [
11]. According to the records of the European Joint Research Center (JRC), a total of 527 smart grid pilots have been implemented in Europe, mostly categorized as Demonstration projects and Research and Development (R&D) projects. The total budget for these projects is 360 billion euro, with almost two third of the funds attributed to demonstration projects [
12]. Another important parameter is the density of the investments. Namely, the Netherlands is cited as a high density spot in many reports [
11,
13]. The Dutch government has put emphasis on the importance of smart grid pilots [
14,
15,
16] and integration of renewable energies [
17,
18]. Thanks to these policies, many differently configured energy systems have been implemented and tested in several residential smart grid pilots and demonstration projects, which are further elaborated in
Section 2. In a conventional power grid, electricity consumption patterns of residential households(HH.) depend on geography, socio-economic factors of the households, and especially the number of residents per household, which we refer to as household size [
19,
20]. In a residential smart grid, the net electricity that is imported from the grid (called import in this paper) is not equal anymore to the consumption, and varies depending on additional local power production by distributed energy resources (DER) coupled with home energy management software (HEMS) [
21]. This mainly entails rooftop photovoltaic (PV) systems [
22], but also other DER as micro-combined heat and power (µ-CHP) [
23]. Out of 84 projects executed in the Netherlands, 31 residential smart grid demonstration pilots involved more than 15 households per pilot and are well documented [
24]. However, little information is available about the functioning of these new energy systems and their overall performances in combination with each other, as most studies tend to focus only on one aspect of electric load, which still contains a significant amount of valuable knowledge [
25]. Therefore, this study analyzes four datasets in further detail, focusing on seven key performance indicators: (1) monthly electricity consumption and production; (2) annually imported and exported electricity; (3) residual load; (4) peak of imported and exported electricity; (5) simultaneity in import and feed-in; (6) and self-sufficiency and (7) self-consumption.
These key performance indicators (KPI) are related to the performance of energy technologies [
26] and to the end-users (prosumers) in residential smart grid pilots [
27,
28]. These key energy performance indicators can be used to determine and quantify various aspects, namely, seasonal effects, extreme conditions during peak times and necessary import capacity and the degree of integration of renewable energy sources [
26,
29,
30]. The annually imported electricity gives an indication of energy efficiency and provides insight into how much electricity must be generated. Residual load is the load that the grid operators observe, so grid load is important for matters, such as voltage fluctuations and the sizing of connections, cables, and transformers, related to the design of grids. Therefore, residual load is employed as an important parameter in EU reports, such as [
31]. The same holds for peak import and export of electricity, which are, respectively, the maximum (positive) and minimum (negative, i.e., electricity feed-in) values of the residual load. These are essential metrics for dimensioning at the household level. Cables and transformers are not dimensioned by summing all the maximum import and export values of individual households, but by the aggregated values of multiple households. Therefore, on an aggregated level (e.g., a cable and a transformer), the simultaneity of both electricity import and PV feed-in are essential metrics [
32]. Next, self-sufficiency quantifies how well a household can rely on its renewable energy production and independently operate from the local grid, and self-consumption figures are relevant for sizing distributed energy systems with respect to household demand [
33,
34,
35].
The aforementioned indicators are often studied individually, whereas this study presents a more comprehensive overview. Adding to this novelty, normally only one data set is studied [
36], while this study compares multiple data sets, increasing the robustness of the results. Furthermore, in this research, a distinction is made between the aforementioned indicators at a household level [
35] and a community level. The reliability of the grid depends significantly on the aggregated level instead of the individual level [
31,
37,
38].
In this paper, we analyze and compare the monitored time series of energy data from three different residential smart grid pilot projects and one set of smart meter data, namely, the Power Matching City (22) in Groningen [
39,
40,
41], the Jouw Energie Moment (117) in Breda [
42], and the Rendement voor Iedereen (79) in Amersfoort [
43]. Further, Zonnedael (70), an open access dataset of smart meter data provided by a Dutch distributed system operator (DSO) [
44], is used as a reference and for comparison purposes. A total of 287 households were analyzed in this study. In
Section 2, the pilots, the employed technologies, the data format, and the processing methods are described. In
Section 3, the results are presented, and the pilots are compared according to seven predefined key performance indicators (KPIs). The paper is concluded with a discussion and recommendations for future studies.
2. Pilot Descriptions, Data and Processing Methods
In this section, the input for the data analysis of residential smart grid pilots and the analytical methods which are the basis of our algorithms in MatLab
© are elucidated. In
Section 2.1, we provide information about the smart grid pilots, and in
Section 2.2, we present the types of data that were analyzed. In
Section 2.3, we elaborate on the methods used for the data analysis.
2.1. Pilot Descriptions
Prior to the data analysis, in this section, we provide brief descriptions for the investigated pilots and the technologies employed within these pilots. Next to the pilots’ descriptions, we provide an overview of the data that were used as that input for our analysis.
Power Matching City (PMC): Phase 1 (2007–2011) of this pilot [
40] consisted of 25 households in the city of Groningen equipped with distributed generators. These generators entail µ-CHP and PV panels. Furthermore, controllable loads were deployed, such as hybrid heat pumps (HP), and smart appliances, such as dishwashers and washing machines. Specific software to match demand and production was developed, i.e., the “PowerMatcher” [
45]. In the second phase of the project (2012–2015), more households were incorporated, summing up to a total of 40, and a variable tariff scheme for electricity supply was implemented. For our study, data of 22 households were available. These households had with an average of 3.1 residents per household, with a living area of 150–199 m
2 per household. Typically these numbers are both above the Dutch average [
23].
Jouw Energie Moment (JEM): This smart grid pilot project also consisted of two phases. The first phase, ‘JEM 1.0’, was carried out from 2012 to 2015 [
42]. It included 382 residential households in newly constructed buildings in Breda (Easy Street/Meulenspie) and Zwolle (MuziekWijk). All the participants received a smart meter connected to an energy management system (EMS, display in home), indicating dynamic prices, renewable output from rooftop PV, and (for the most part) smart washing machines. In the group of houses in Meulenspie-Breda (39 households), a heat pump was present. A second neighborhood in Breda, in which electricity consumption was monitored, was Easy Street (131 households). As data from Zwolle were not available to us, the number of households was limited to 170 (only Breda). The second phase started in 2017, with higher PV capacity and storage technologies installed. However, this will be the subject of future analyses; it is inappropriate to compare with the two other pilots, as the time period is significantly different [
46].
Rendement voor Iedereen (R4I): The Smart Grid: Rendement voor Iedereen (Profit for all) project ran from 2012 to 2014 in two central cities in the Netherlands: Utrecht and Amersfoort. The goal was to develop business cases focused on future smart grids and accompanying energy services. In both cities, smart meters were installed in 100 households that were equipped with solar panels. These meters measured grid power interaction at an unusual high time resolution of 10 s. For the Co-evolution of Smart Energy Products and Services (CESEPS) project, data were collected and analyzed from the Amersfoort pilot [
43].
Zonnedael: A smart meter dataset was made available that contained consumption and production values of 70 households in an anonymized neighborhood called Zonnedael in the Netherlands for the year 2013, at a 15 min resolution [
44]. It contains a number of PV systems. However, the majority of the households are conventional end users, and no specific energy efficient technologies are included in these households. The dataset is taken as a reference because the energy demand patterns of the households in this dataset resemble those of average Dutch households for that year.
In total, energy data of 287 households have been collected for our analysis.
2.2. Data Properties
In this section the properties of the datasets and their pre-processing are described. Pre-processing was necessary to ensure a certain data quality and monitoring fraction.
Table 1 summarizes the main features and properties of the data. This data consist of time series electrical power, PV production, and household characteristics. For PMC and Zonnedael, the electricity and gas consumption (time series as well as cumulative consumption and production values for PMC) were included. The collected data were registered by smart meters, which were continuously measuring the instantaneous power to average it to energy values over the time resolution (
Table 1). The accuracy of all values are the worst case ±2.5%, up to 0.5%, and even lower depending on which meter is chosen, as mentioned in the IEA standards on electrical meters [
47]. The differences in the energy systems used in pilots are highlighted. The lowest time resolution was 15 min for JEM, so all other time resolutions are harmonized by using the mean values of 15 min. This leads to a significant effect on the load duration curves and peak analysis but has negligible impact on monthly and annual values.
This analysis is effectuated as a part of CESEPS project [
48], and non-disclosure agreements have been signed to access the data (except for Zonnedael). In the EU, the number of starting smart grid pilots and the total investments reached their peaks in 2012, and the number of running projects was the highest in 2013 [
11,
13]. Therefore, 2013 has been chosen as the year for which data were available for JEM, R4I, and Zonnedael. Nonetheless, for PMC we could only access data for the year 2012. For R4I, data were collected from November 2013 to October 2014. Furthermore, data were not available for all households. From a data availability diagnosis, we took only the data for which the monitoring fraction was higher than 90%. The analysis presented in this paper is based on 21 households for PMC, 79 households for R4I, 117 households for JEM, 26 for Meulenspie, and 91 for Easy Street.
2.3. Analysis Indicators and Equations
Each performance indicator will be briefly introduced, and the formulas applied in the analysis will be shown in the section on analysis methods.
For monthly values of energy in kWh, we separately took the sum of the consumption values and production values during the month in question, as shown in Equations (1)–(4):
where
t is the discrete time at 15 min resolution,
n is the number of households of the pilot (as cited in
Table 1),
is the consumption of the household
i (kWh),
is the total consumption of the household
i for the month (kWh),
EC_m is the average household consumption value of the pilot for the month in question (kWh), and
m_0 and
m_end are the beginning and the end of the month, respectively. At same time step interval,
is the production of the household
i (kWh),
is the total production of the household
i, and
ER_m is the average household production value of the pilot for the month in question.
For grid operators, besides monthly values, the load duration curve based on residual load, the peak imported electricity, and the PV feed-in and simultaneity are also important parameters. These define the capacity that is needed for household connections, cables, and/or transformer substations. The renewable generated electricity subtracted from the electricity consumption provides the hourly residual load, as shown in Equation (5). This gives an indication of the imported and exported electricity to and from the grid and helps to analyze the impacts of new technologies on the grid.
where
Presidual is the residual load,
Pc is the momentary total electricity consumption in kW, and
PRE is the momentary total renewable electricity production in kW. The residual load quantifies the import electricity that the pilot community needs from the grid or the export of renewable generated electricity that the pilot community feeds into the grid. To visualize the residual load throughout the year, a load duration curve is commonly used. This is a curve showing the sorted values of electricity totals, with electricity expressed in power on the y-axis, and its occurrence percentage sorted by power on the x-axis.
Yearly import and export are analyzed according Equations (6) and (7), respectively:
where
y_0 and
y_end are the beginning and the end of the year,
is the import, and
is the export of the household
i of the pilot in question.
The Self-Consumption Ratio (SCR), as expressed in Equation (8), is the ratio of consumed renewable energy over the sum of all renewable electricity generated on site. Equation (9) formulates the Self-Sufficiency Ratio (SSR), which is the ratio of consumed renewable electricity generated on site over the sum of electricity consumption. The SCR and SSR are calculated according to Equations (8) and (9), respectively:
where
EC_RE is the on-site renewable electricity consumption and
ERE_tot is the total electricity generated by renewable sources and
EC_tot is the total electricity consumption. For this paper, the time period is a year.
The peak load is defined as the maximum electricity import of each household from the grid considering one year of data. Similarly, peak feed-in is the maximum export of each household to the grid. The degree of loads occurring simultaneously is crucial, as individual loads are aggregated on distribution lines and the transformer station. To evaluate the effectiveness of the installed energy systems, it is important to examine the peak load values in smart grid pilots in the Netherlands. In
Table 2, we summarize the different residential connections in the Netherlands, regarding their power limits, availability for new connections, and applications.
The limit values significantly vary depending on the type of household connection. Exceeding the concerned limit value could have consequences, such as an outage within the household. The connections can always be upgraded for the old and small households if PV or appliances were to be added.
3. Results
In this section, the predefined KPIs analysis’ results are presented. The monthly variations underline the difference between technologies. After that, annual energy balance indicators are described, namely, annually imported electricity, the residual load, peak import and export, self-consumption, and self-sufficiency.
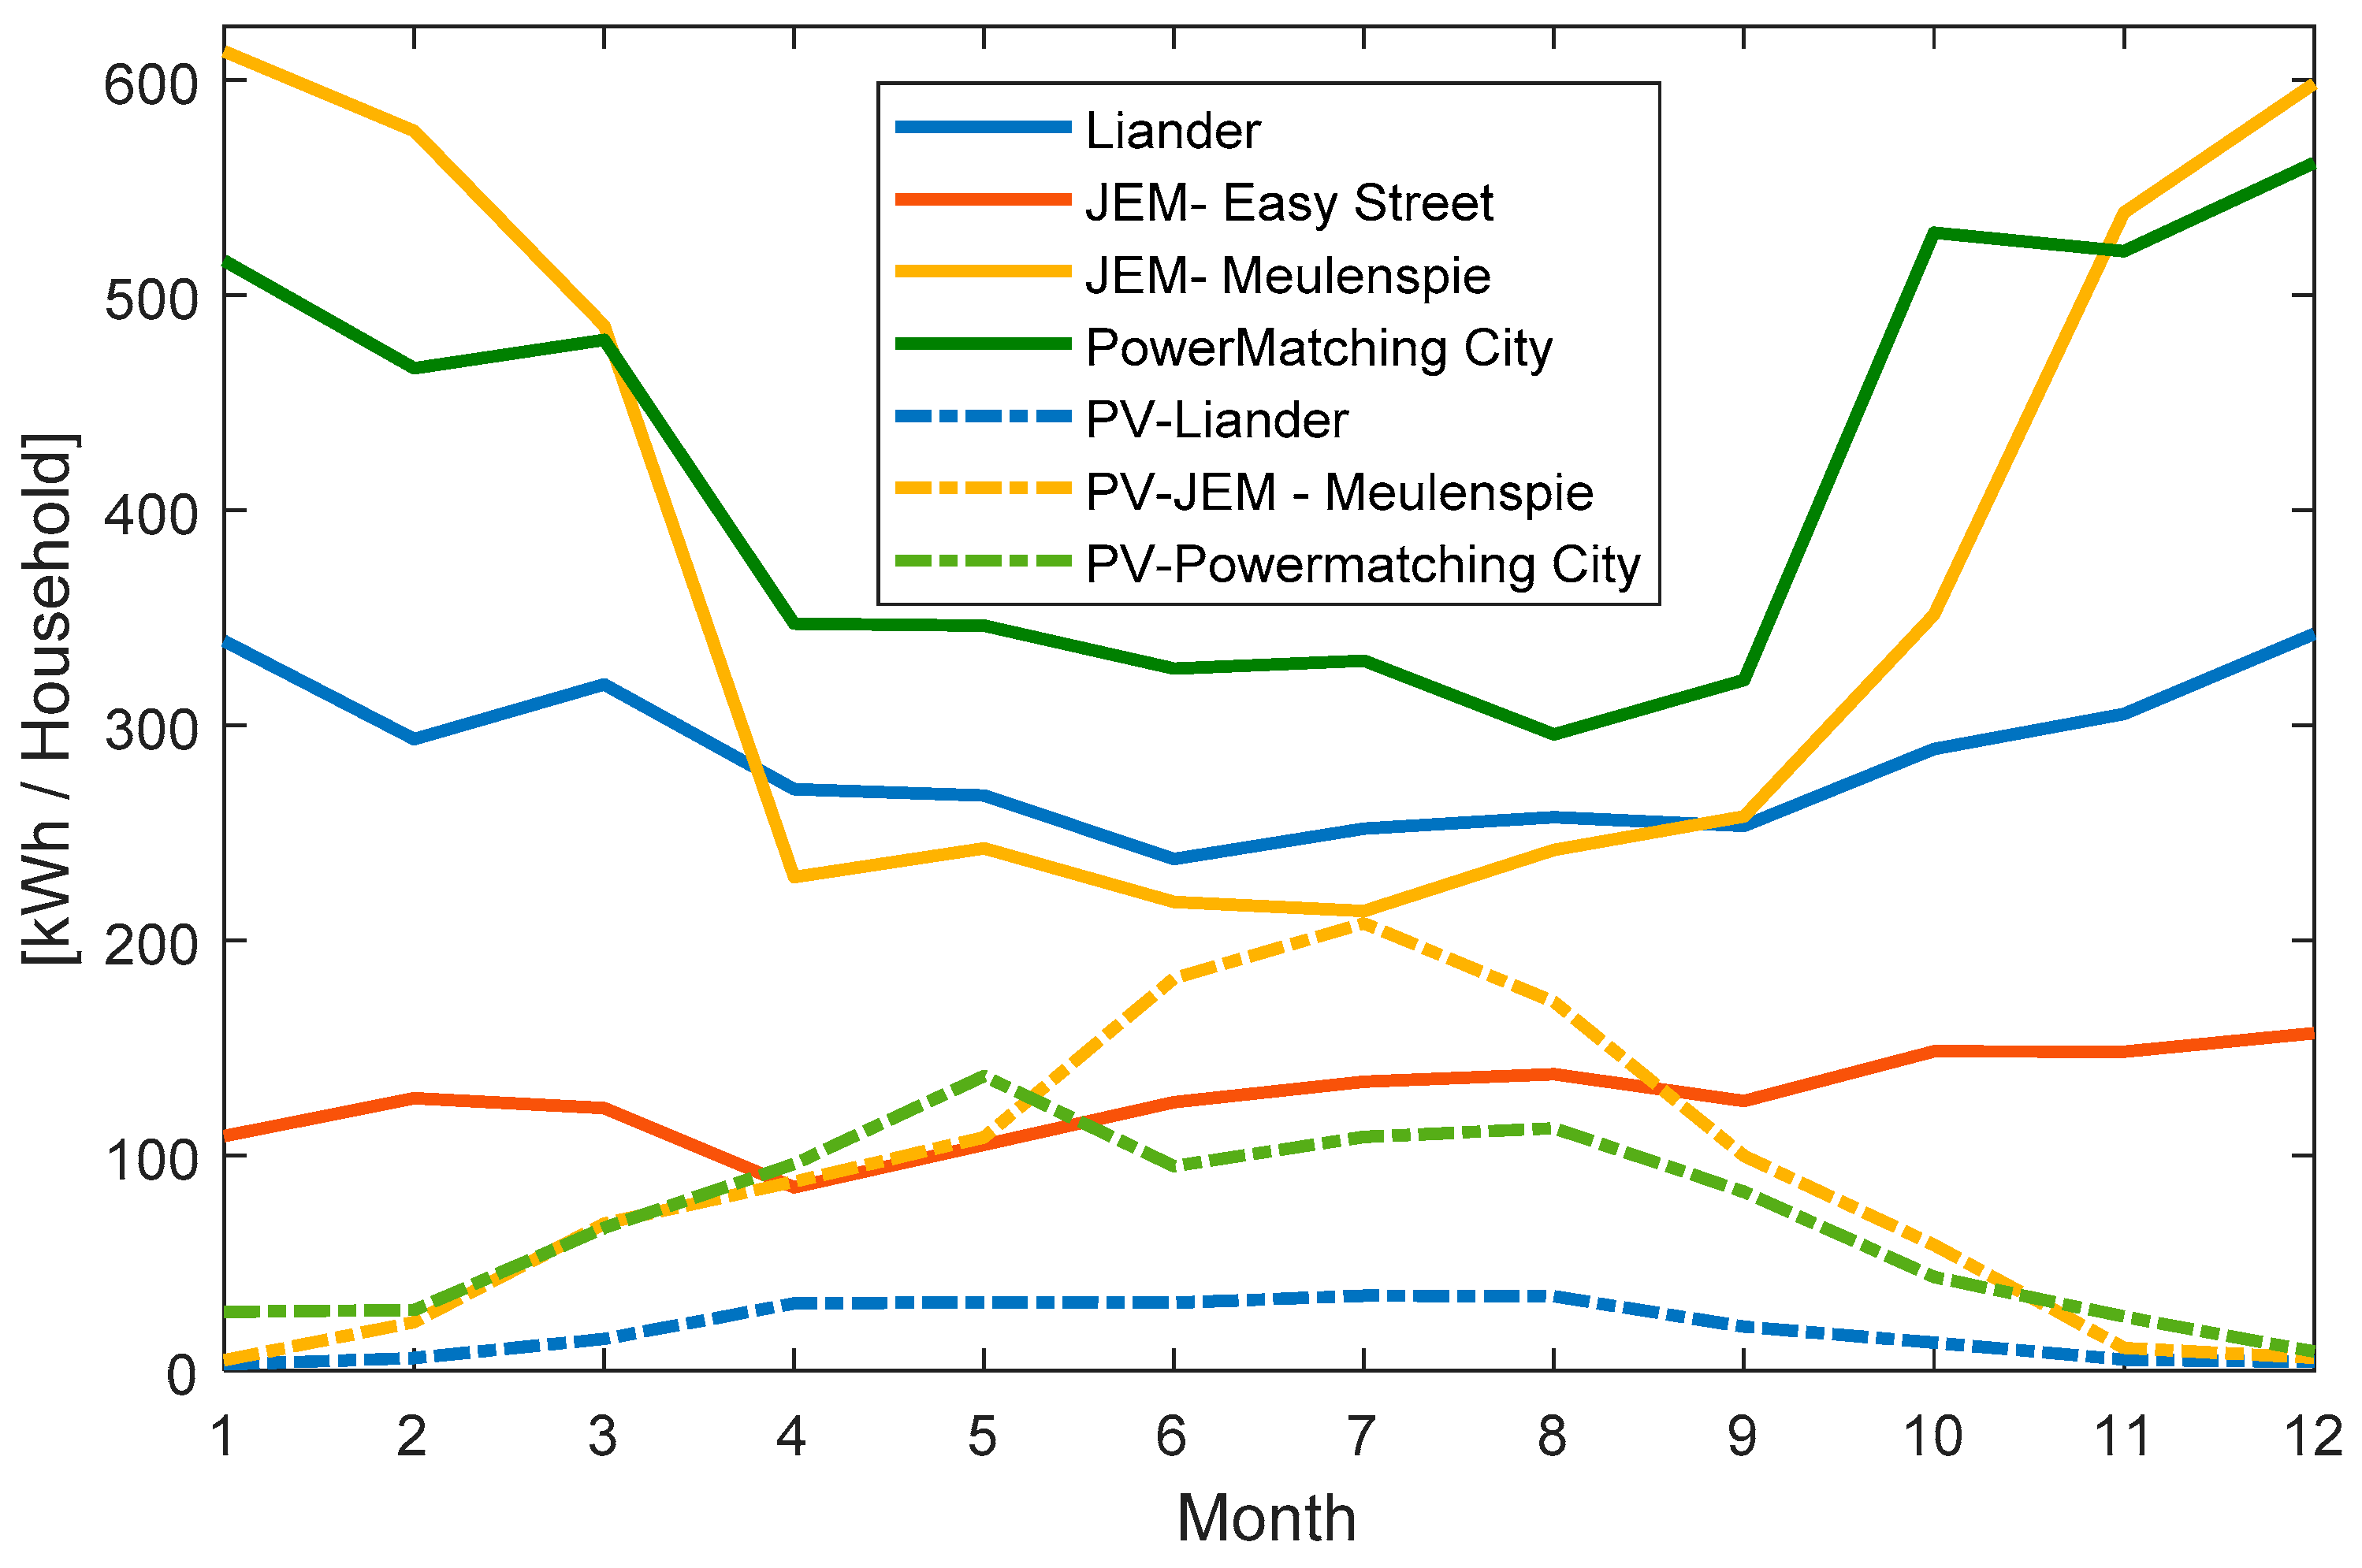
3.1. Monthly Electricity Consumption
Figure 1 shows that PV electricity generation is high during summer months for all pilots. For the month of July, the PV generation even matches the total consumption in the JEM-Meulenspie pilot. PV generation is the least for Zonnedael, as only a few households were equipped with PV. Next to the PV system size, the location and the year play a significant role in the electricity produced by PV systems. PMC PV output indicates that the month of May 2012 was relatively sunny. The JEM-Meulenspie PV output shows that, for 2013, the highest solar energy production occurred in July. This result is in line with the weather station data. May 2012 was the month with the highest solar irradiation measured in the weather station that is closest to PMC, i.e., Eelde, with 15.5% of the total irradiation of that year (on a horizontal plane) [
51]. An additional effect is the somewhat lower ambient temperatures in May, which resulted in fewer losses compared to higher temperatures. In 2013, July was by far the month with the highest solar irradiation in the weather station closest to Meulenspie, i.e., Gilze-Rijen, with 16.6% of the total irradiation in that year [
51].
The consumption patterns are relatively constant for Zonnedael as well as JEM-Easy Street. As mostly students volunteered to participate in the pilot, the lowest consumption occurred at JEM Easy Street. This is clearly related to household size.
Seasonal variations are observed in both JEM-Meulenspie and PMC. In those two pilots, large electricity consumption differences are observed between the winter and summer months due to the heat pumps, which demanded higher amounts of imported electricity during cold periods. The electrical heating resulted in evident variation of consumption patterns. Therefore, for the predefined KPIs, we have analyzed the demand patterns by separating the groups with conventional heating systems from those with hybrid/electric heating systems. Pilots that contain heat pumps are treated separately from those that did not because of their distinct results in power demand.
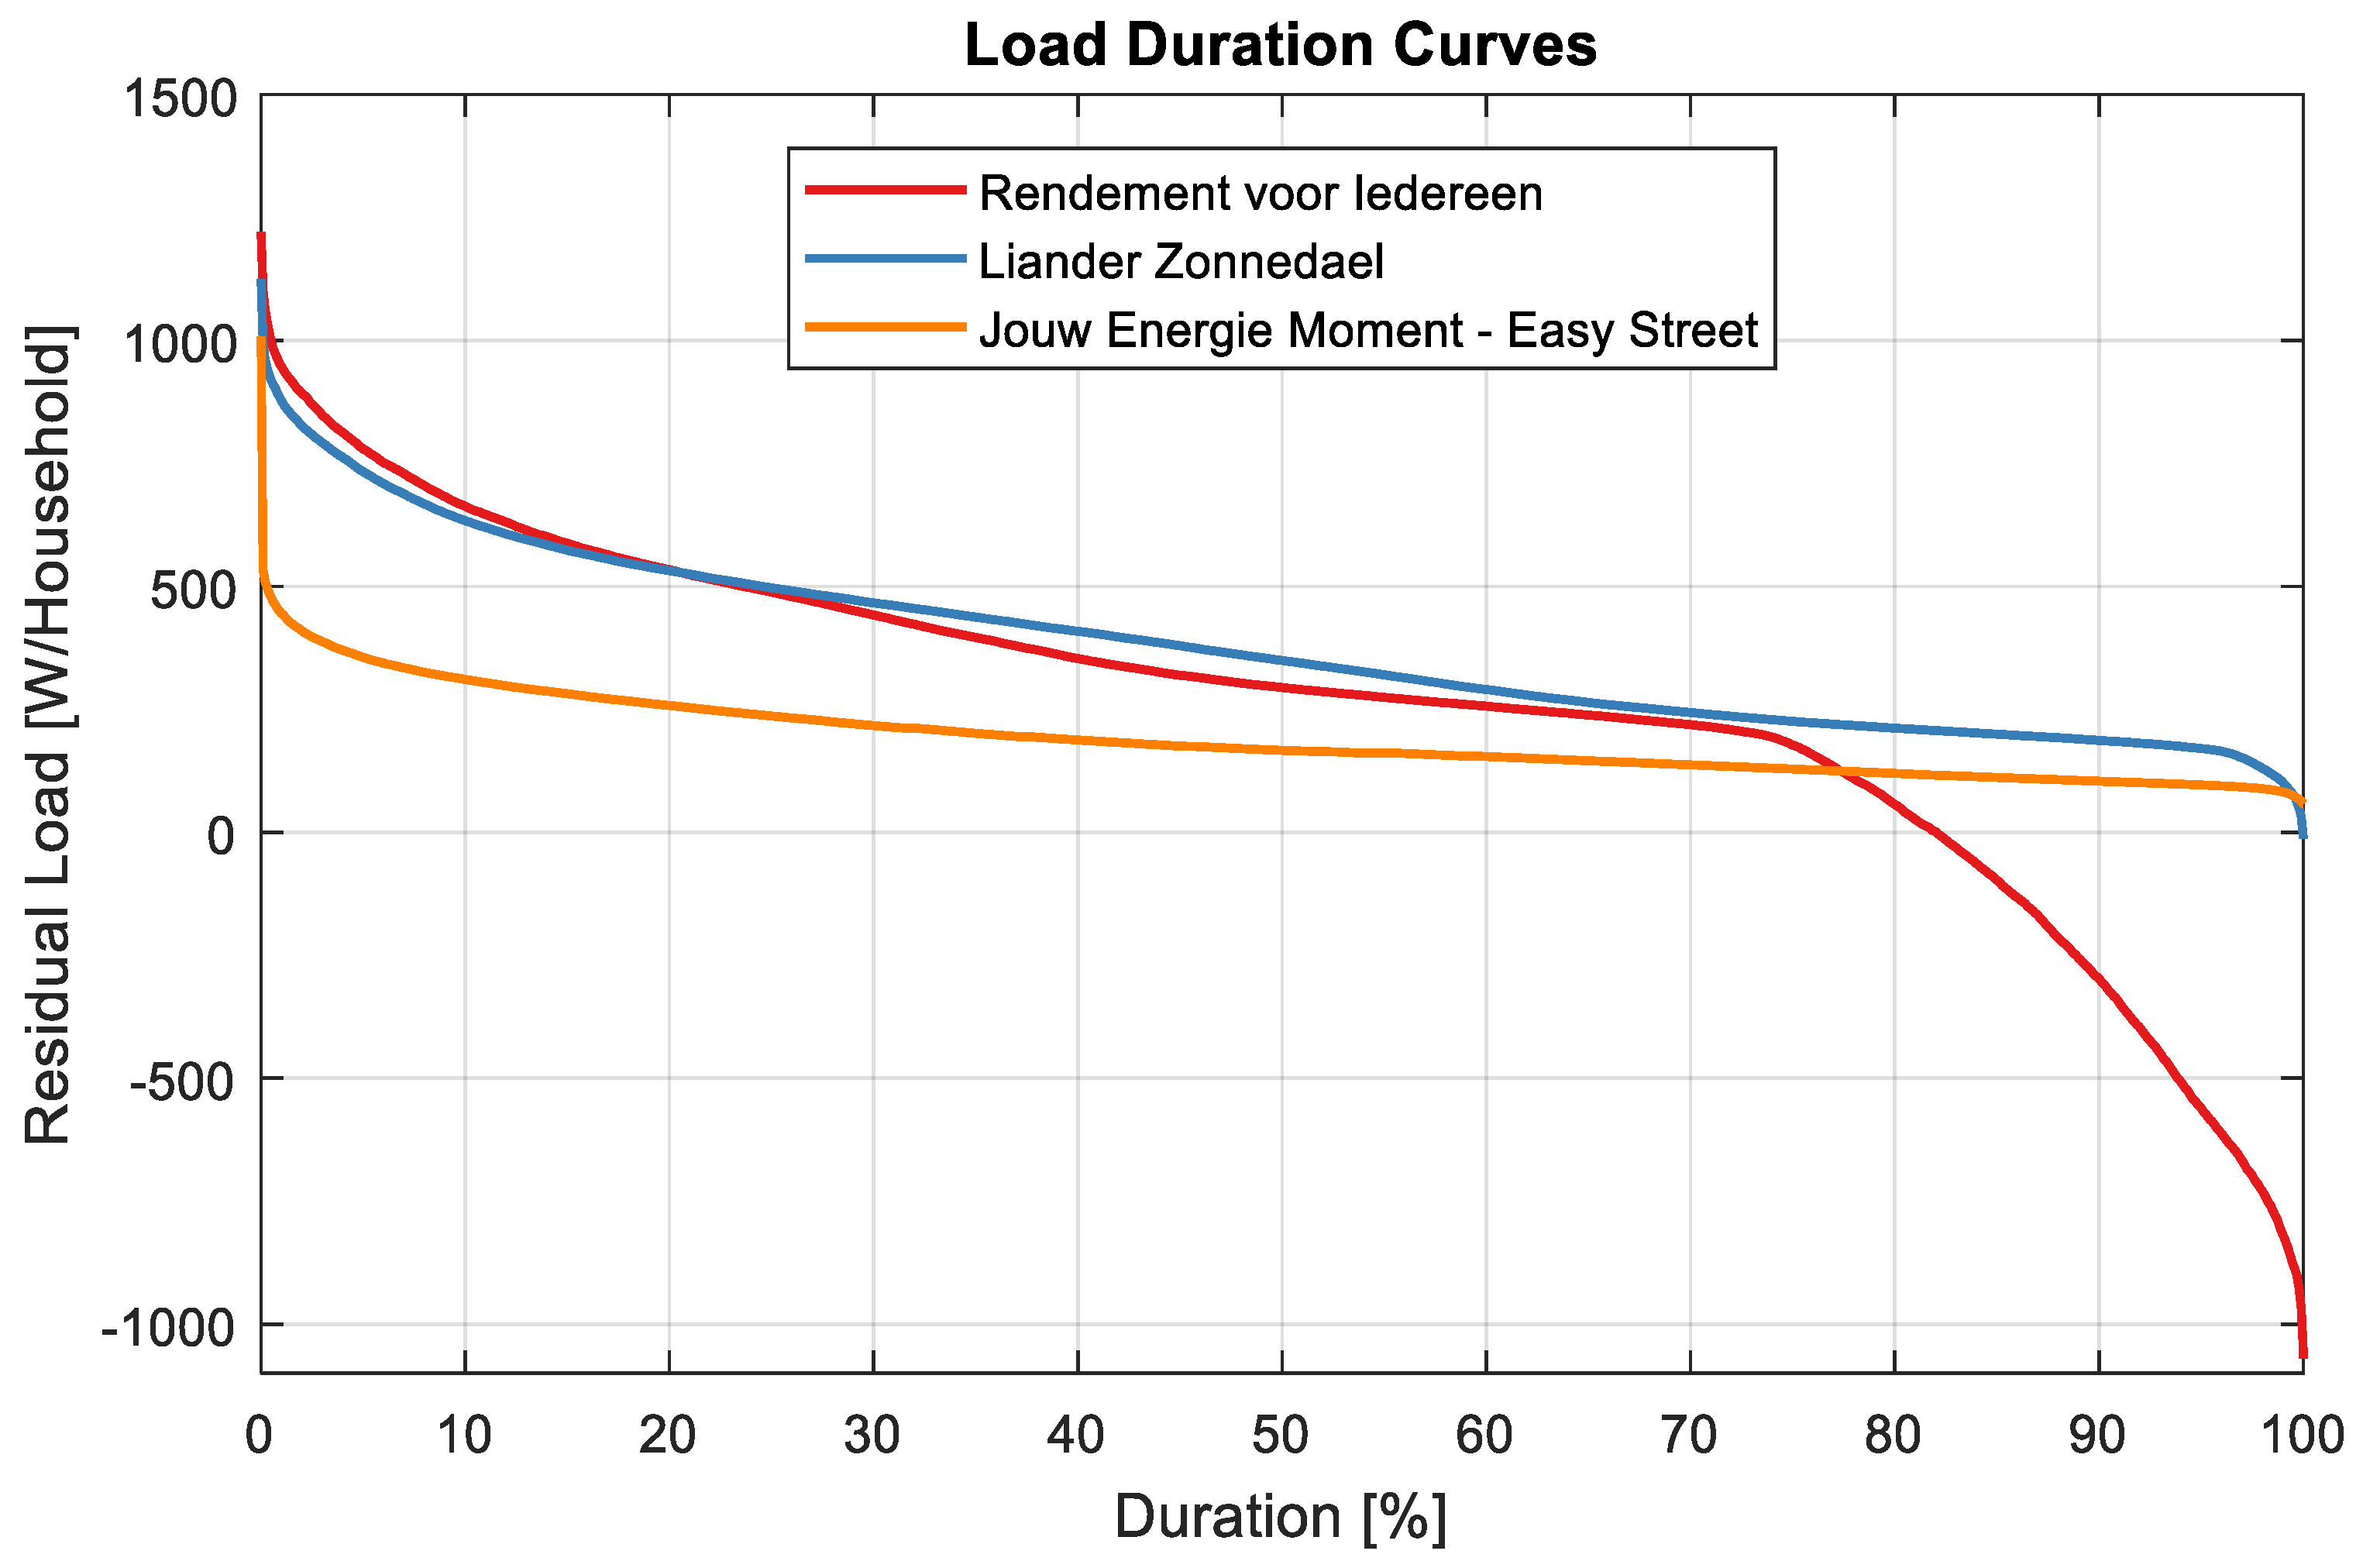
3.2. Load Duration Curves
Figure 2 shows the aggregated load duration curves, normalized by the number of households, of the smart grid pilots without heat pumps, (i.e., Rendement voor Iedereen and JEM-Easy Street) and the Liander Zonnedael open access dataset t.
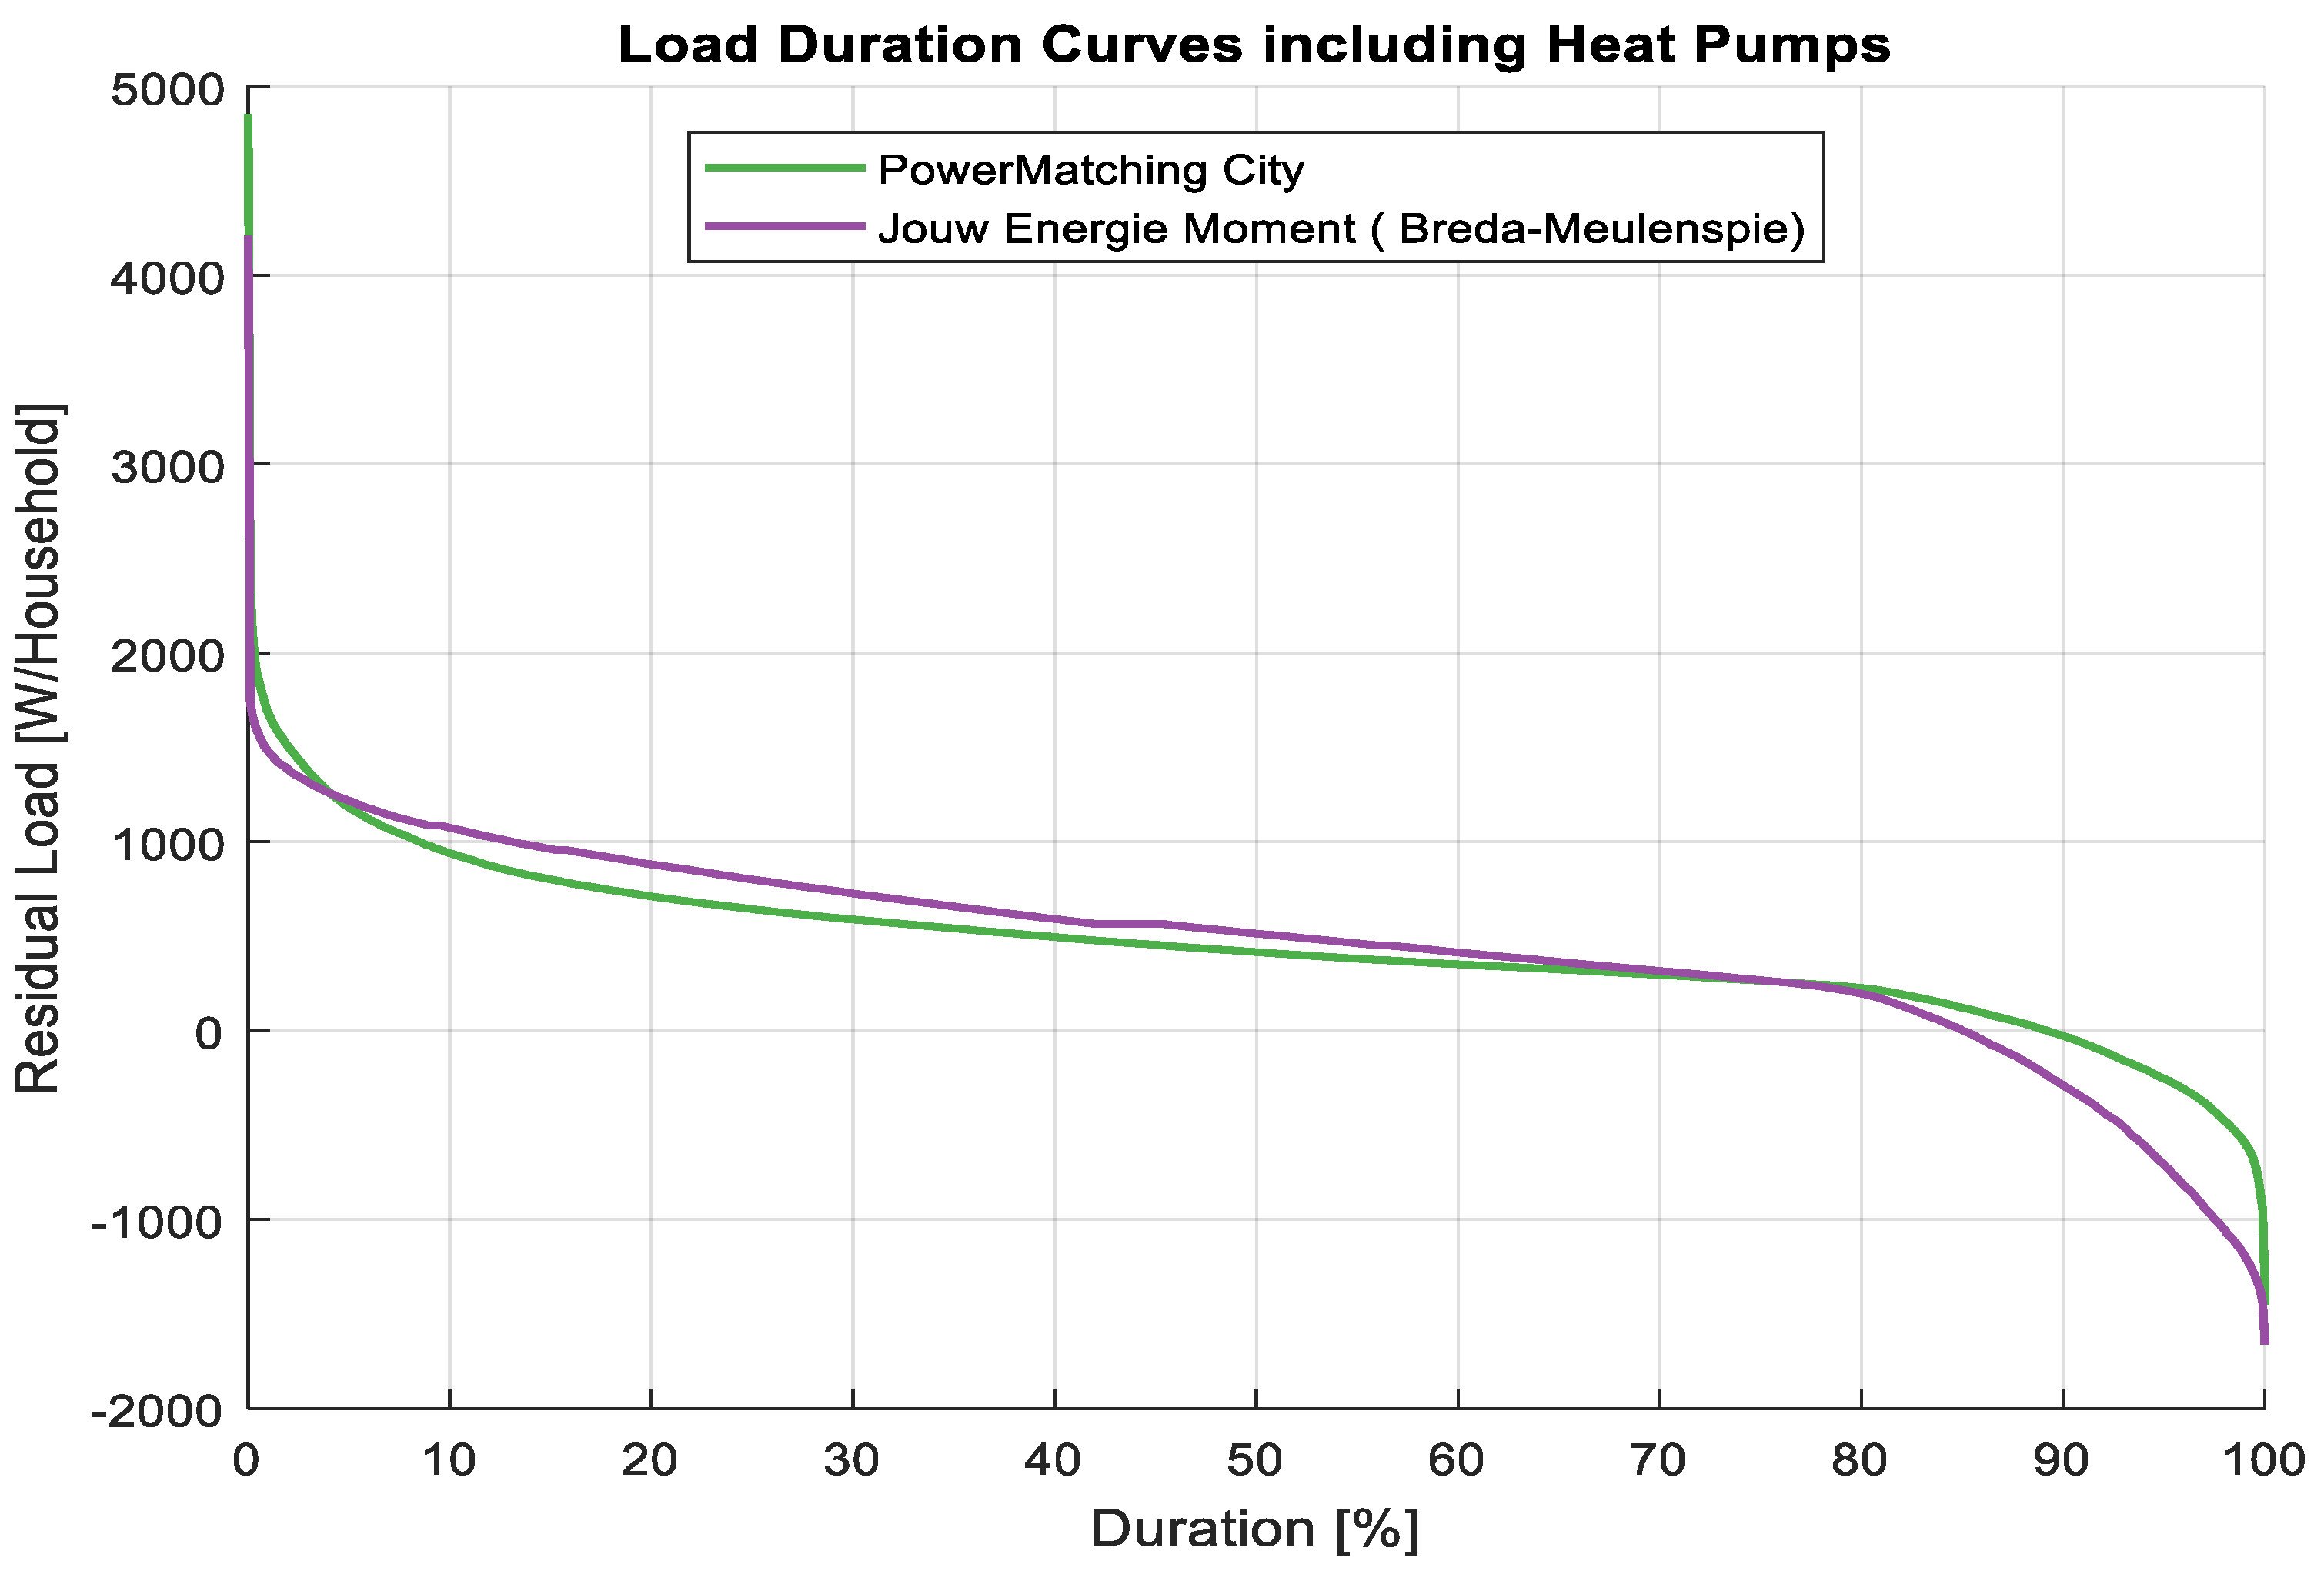
Figure 3 presents the same for the pilots that included heat pumps (i.e., PMC and JEM-Breda-Meulenspie). For the positive y-axis values, the area between the curve and the x-axis is the electrical energy used per household. The negative y-axis values represent electricity fed into the grid from the PV systems. Only JEM-Easy Street had a lower electricity consumption compared to Zonnedael. From this data, it seems that this pilot effectively achieved its goals of having a low slope of load duration (except for the first 1%), as users were asked to steer on prices, and high prices reflect peak load hours. Nevertheless, the household size is by far the most important parameter to consider: Easy Street in Breda contains apartments inhabited by students, who evidently have a lower energy consumption in general. R4I had a slightly higher consumption for 20% of the time, but, for the remainder of the time, it exhibited a lower consumption than Zonnedael, which can be largely attributed to PV electricity generation in R4I. The peak demand was similar for both data sets.
PMC was characterized by the highest consumption of all smart grid pilots and the highest peak demand, which went up to 5 kW per household (see
Figure 3). This is due to the fact that the pilot had a large number of residents per household, a large household area (150–199 m
2) and included heat pumps for space heating. With respect to PV production, R4I had the highest feed-in values of all the pilots, due to the fact that it had the highest share of households with a PV system installed (61 out of the 79 households). This notion is further confirmed by
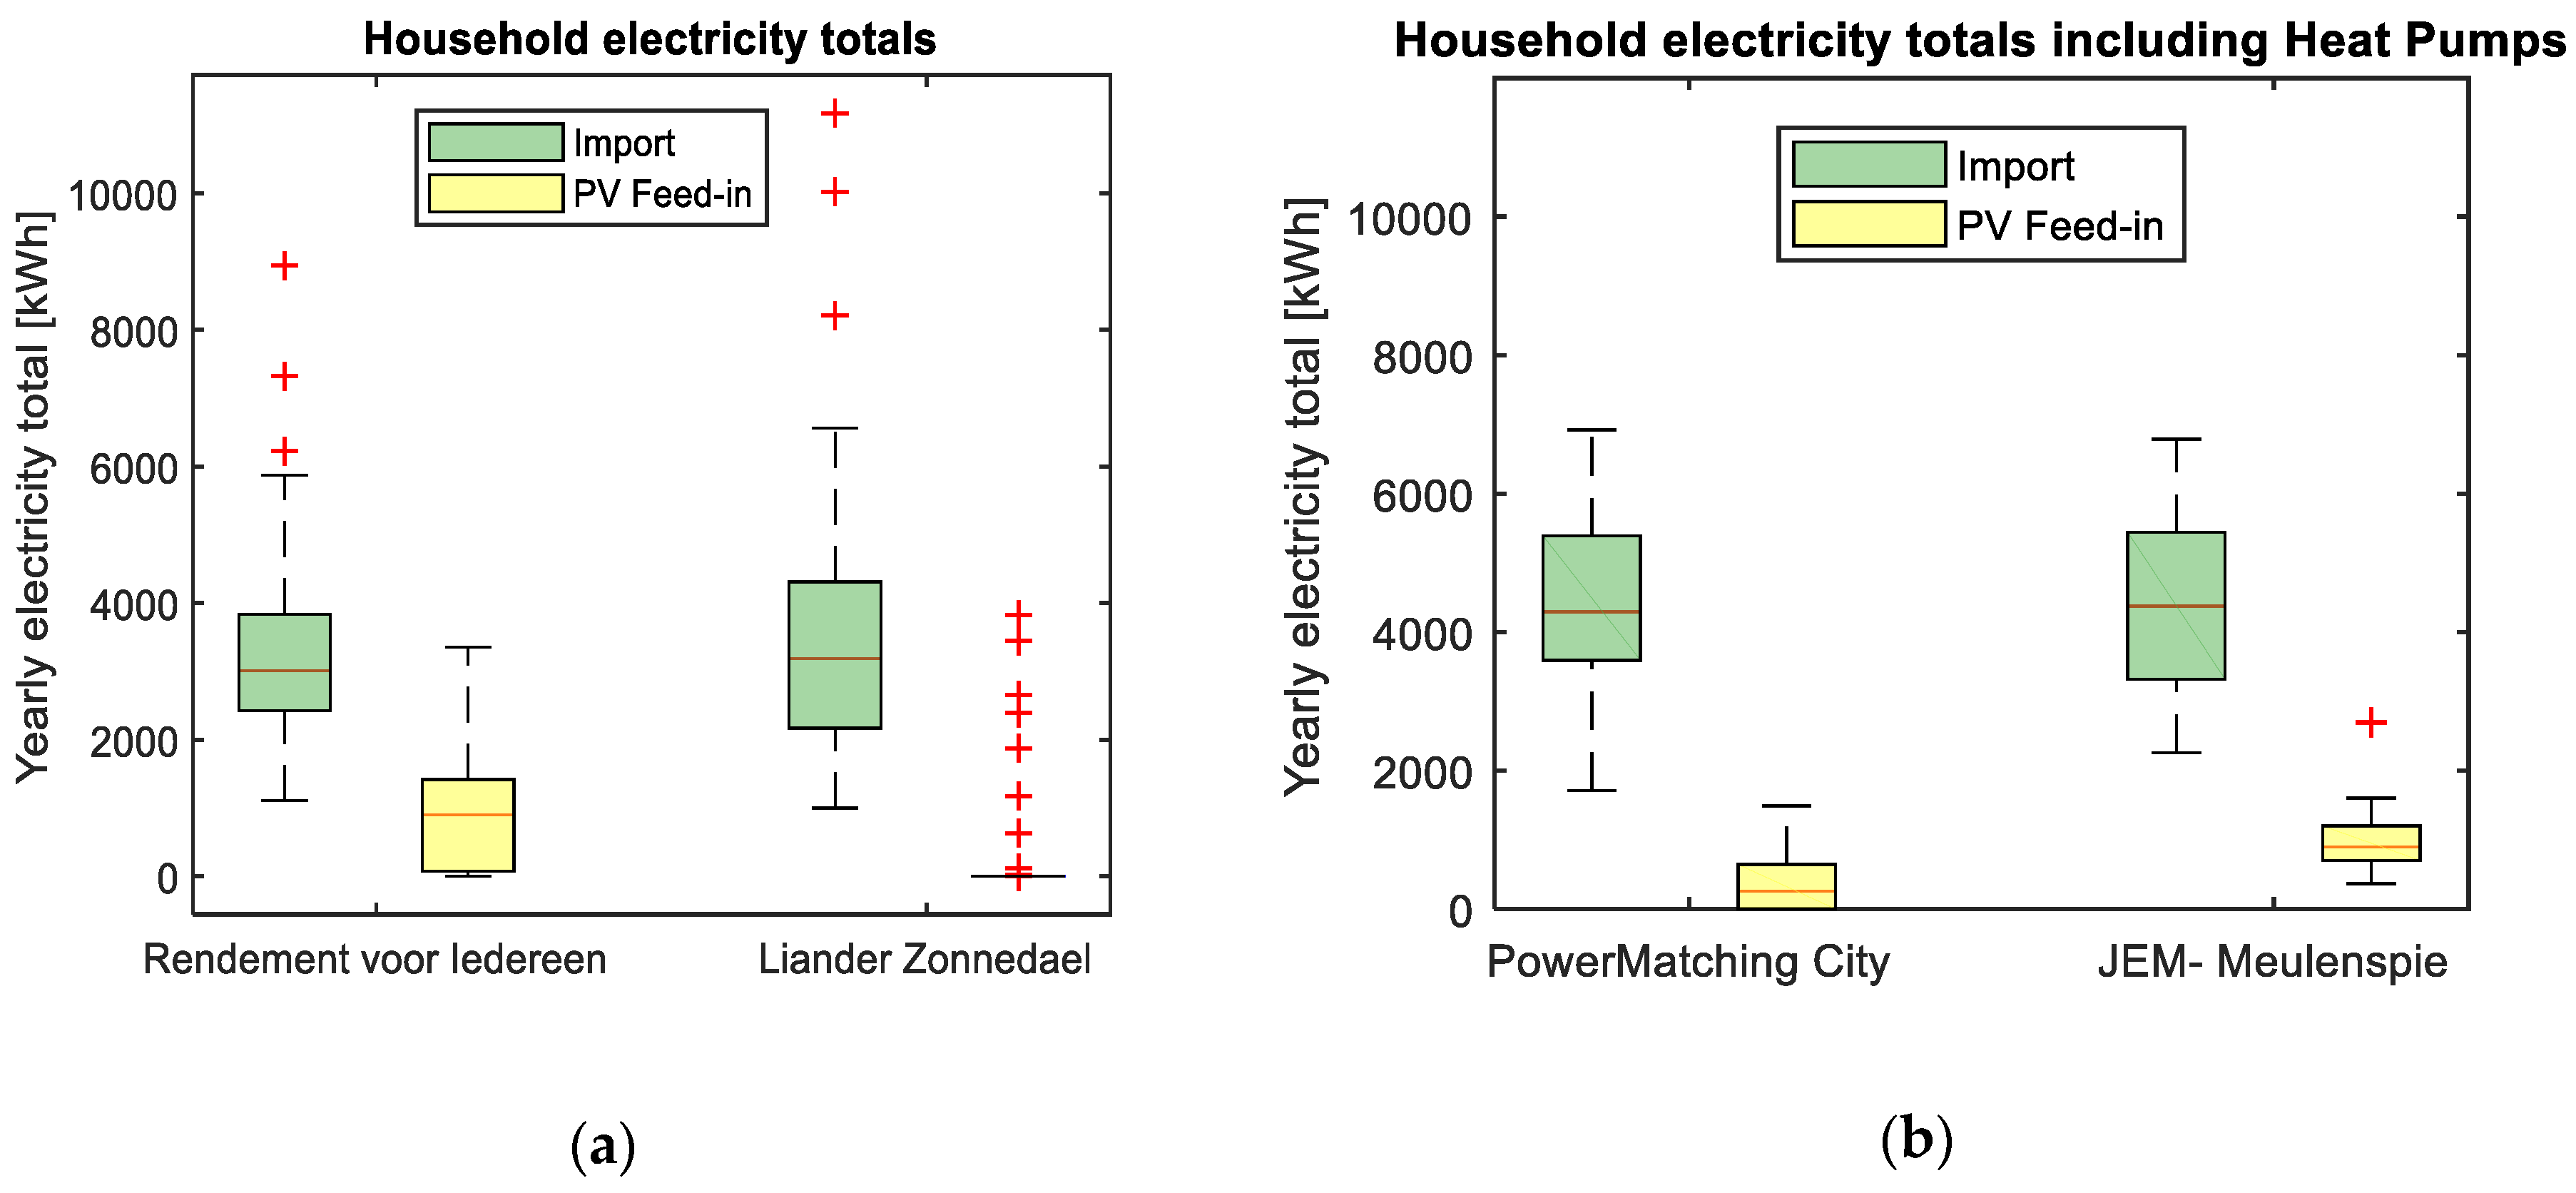
Figure 4, where the boxplots of the yearly household energy demand from the grid and PV power fed in the grid are plotted for all the four datasets.
3.3. Annualy Imported and Exported Electricity
Figure 4 shows the boxplots of annual imported and exported electricity for all households. For this graph, PMC µ-CHP production is not considered. Most households in R4I have a slightly lower imported electricity than Liander Zonnedael. The average in R4I is 3.01 MWh and in Zonnedael 3.2 MWh. Given that R4I has many PV systems installed, and PV-generated electricity that is directly consumed on-site (i.e., self-consumption), is excluded from the residual load, we can conclude that electricity demand in R4I is probably somewhat above the Dutch average of 3.3 MWh, whereas that of Zonnedael is in line with the average. JEM Easy street is excluded as it has neither heat pumps nor PV.
Figure 4b shows that for the two pilots including heat pumps, JEM, the import is 1 MWh above the Dutch average. These households show a large difference between electricity import and PV feed-in, which means that they are not able to supply their electricity demand with their PV systems.
We observe large differences between the households, both in terms of imported electricity and the amount of PV energy fed into the grid. The upper quartiles show a spread of around 2 MWh. Since most households in the Zonnedael dataset are not equipped with PV systems, all households that do have PV systems are considered outliers for the PV electricity feed-in. Both in imported electricity and the PV energy fed into the grid, we observe large differences between the households, indicated by the maximum and minimum whiskers in the boxplot. This result shows that even households within these small communities are not very similar. This might imply that households with high electricity import may have much potential for energy efficiency measures, whereas households with a low PV feed-in have much potential to increase PV electricity generation. However, a more detailed case-by-case analysis at the household level is required to confirm this.
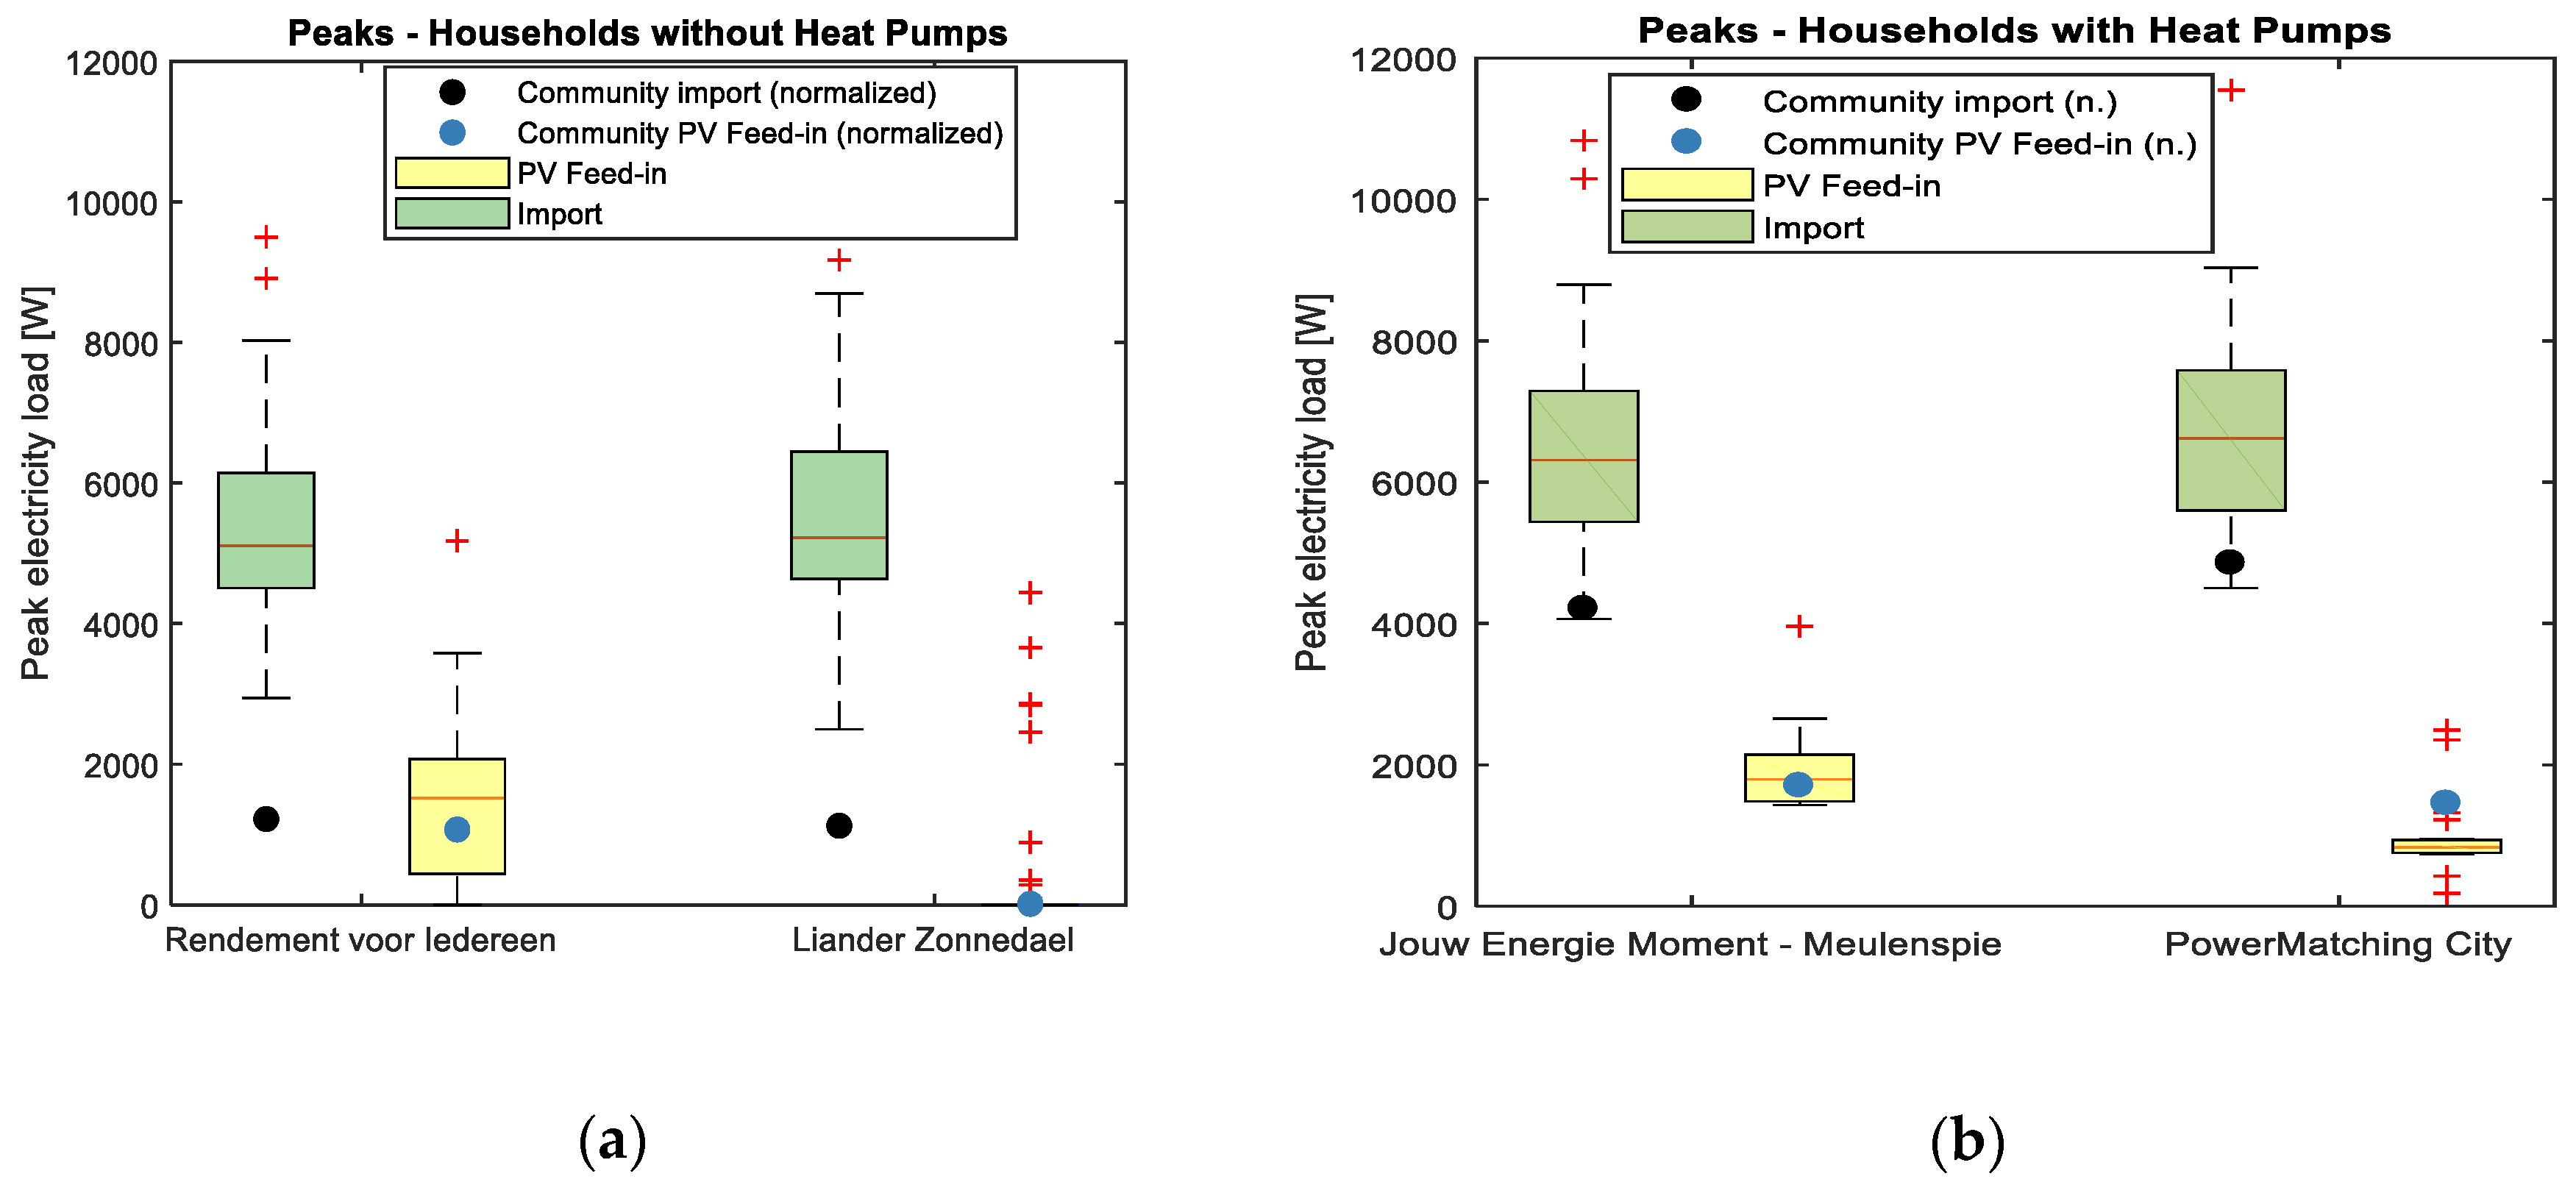
3.4. Peak Load, Feed-in and Simultaneity
Figure 5 shows the distribution of the power peaks measured for individual households at a time resolution of 15 min and of the normalized peak for the whole community. The latter is the aggregated peak divided by the number of households. JEM-Easy street was not plotted, as few peaks appeared, and PV generation data were absent. Between the pilots analyzed, the peak imported electricity ranged between ~2 kW and ~9 kW for all pilots, with four outliers present above 9 kW.
By looking at an aggregated level, we see an important discrepancy between the households with and without heat pumps. The average peak per household is only around 1 kW for pilots without heat pumps, which is in line with how transformers are generally dimensioned [
52]. If we define the simultaneity of electricity as the ratio between the normalized aggregated peak and the average individual peaks, then we observe a very low import simultaneity in the R4I pilot of only 23.0%. This is beneficial from a system perspective, as this low import simultaneity decreases the total capacity requirement. The same holds for Zonnedael, with a simultaneity of 20.5%. However, the simultaneity in the pilots with heat pumps is much higher: 65.1% for JEM and 70.5% for PMC. This can be explained by the fact that heat pumps’ electricity demands are strongly correlated with outside temperatures, which are the same for all households within a community. While, on average, the electricity demand of households with heat pumps is just around 200 Watts higher than that of households without heat pumps, the community peak exceeds 3 kW on top of the baseline. This causes a stress in the LV grid and its transformers. Therefore, it is important to take this into account when designing future LV grids with a high penetration of heat pumps.
Not surprisingly, the simultaneity of the PV feed-in is also very high: 74.9% for the R4I pilot and 89.5% for JEM (very similar to Zonnedael 88.9%). This calculation was not applicable for PMC, where the virtual PV was controlled by the DSO and distributed to households with PowerMatcher influence, since we noticed that not all households received the same amount of electricity. It is important to mention that, in the investigated pilots, these results show a low potential to cause grid issues: all aggregated feed-in peaks are lower than the aggregated import peaks. Furthermore, feed-in peaks are not as crucial as import peaks, as it is easier to curtail feed-in [
32].
From the investigated connections, only four households may present a possible risk for overloading (i.e., those with a 1 × 40 A connection). We do note, however, that this connection is applied only for small houses on special request. For the standard house connection, there were no households who exceeded those levels.
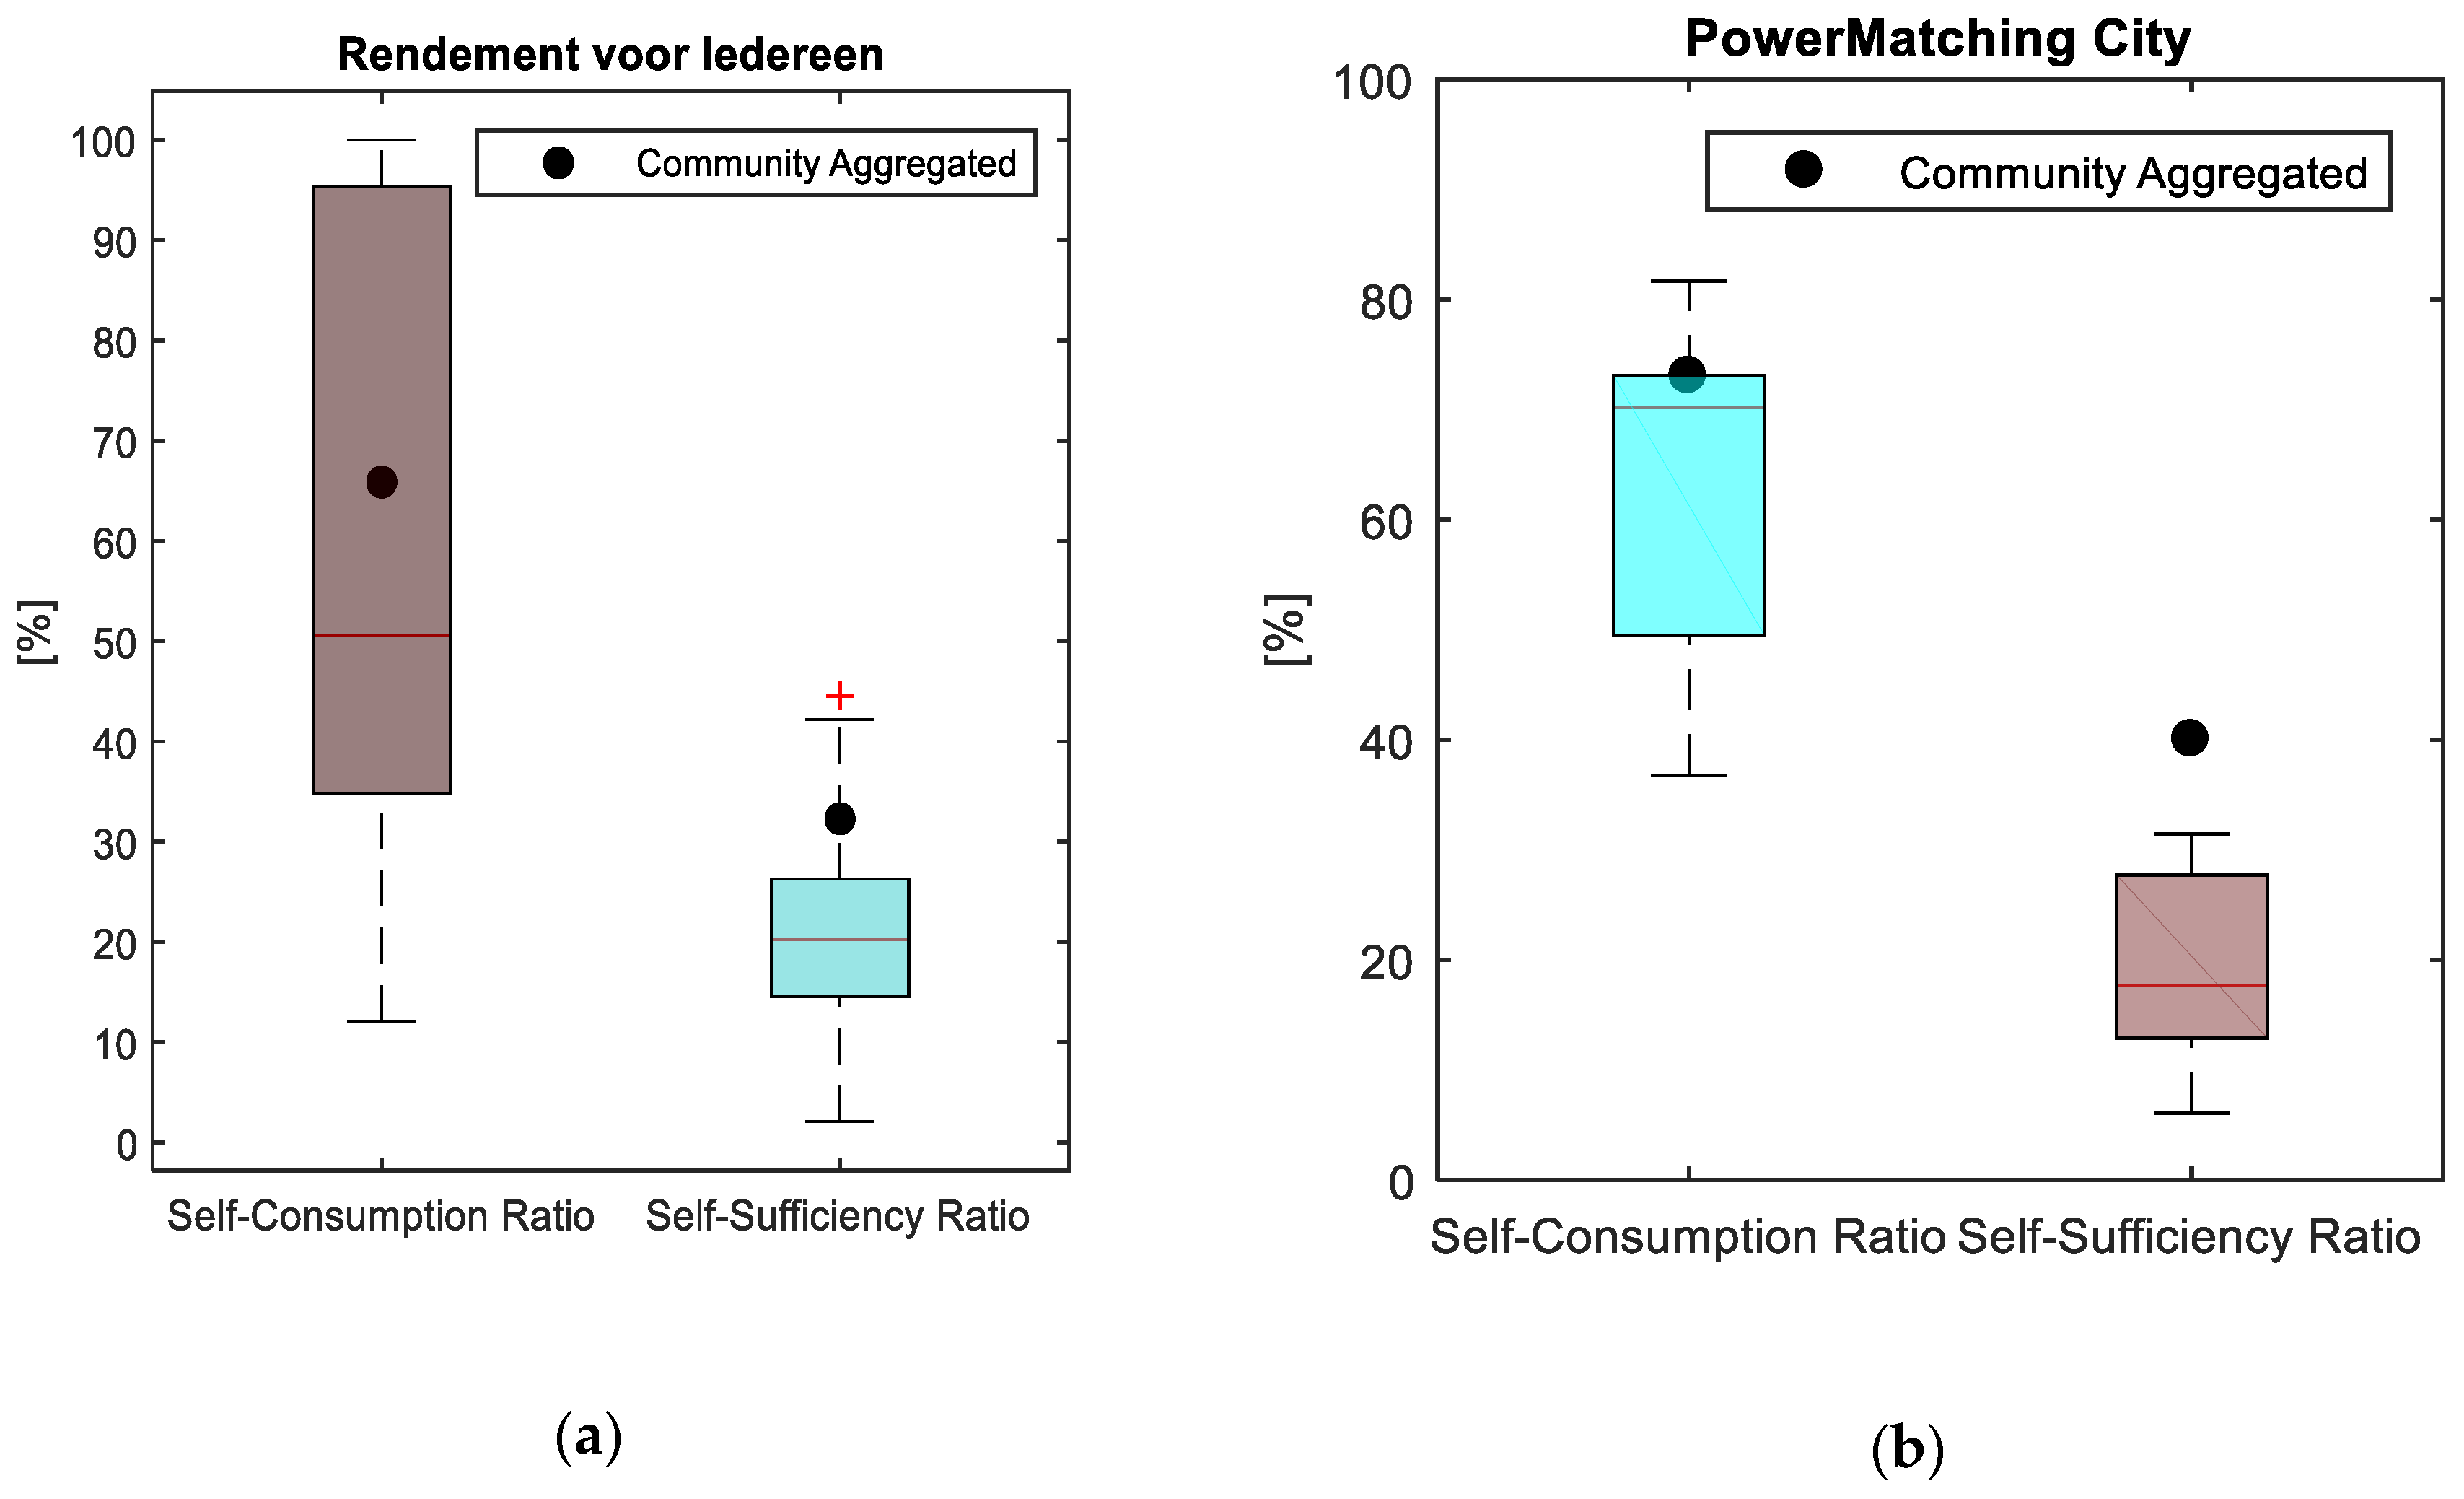
3.5. Self-Consumption and Self-Sufficiency
With our limited amount of data, we could only calculate self-consumption and self-sufficiency ratios for R4I and PMC for 2012, which is shown in
Figure 6 for all households. Again, we observe a large difference between the households, with a median SCR of around 50% for the R4I pilot and 70% for PMC. The general picture shows relatively high SCRs. This can be explained by the relatively small PV system sizes in these pilots. With fewer PV electricity generated, larger parts of the generated electricity can be directly consumed. Another notion is that the aggregated values are much higher (5–20%). This means that substantial parts of the PV electricity fed-in by households are used within the community. This is of importance, as this electricity is not exported to the MV-grid, thereby decreasing the overall stress on the electricity system.
3.6. Summary of Results
Table 3 summarizes the main results presented in the previous sections. Much of the data was available for only a small number of households, leading to low statistical power. Therefore, it is difficult to draw generic conclusions, especially considering variable household sizes, differences in the technologies deployed, and other socio-economic factors. Nevertheless, the boxplots results give insight into the various scenarios that occurred within the smart grid pilots, and the average results provide an insight into the technologies’ impact.
4. Discussion
From our results, it can be concluded that simultaneity in electricity generation or load is much higher for energy technologies that are being deployed more and more frequently in the context of energy transition, namely PV systems [
53] and heat pumps. This should be an important focus point for DSOs. The power flows found in this study could be hazardous if PV systems and heat pumps were to be installed in all Dutch households, as current grids in the Netherlands are not equipped to transport the reported power flows. Various options exist to address this challenge. For PV, one option is to curtail electricity generation during hours with high solar irradiation. This only leads to limited losses in the total energy yield [
32]. A second option is to store the surplus of PV-generated electricity in storage, where stationary storage and EVs are options. In the latter case, smart solar charging holds much potential. Heat pumps present an even larger challenge, as controlling these loads could have an impact on the comfort levels of households. One option is to provide incentives to households to increase the range of temperatures that households would tolerate. Also, electricity could be supplied by stationary or electric vehicle storage. Lastly, thermal storage could be an attractive option. Future analyses must determine which option, or which combination of options, is most suitable. Further, we will quantitatively discuss the main findings by categories.
Regarding the consumption patterns of our sample, the yearly exported electricity values are quite modest, considering the fact that not everyone in a neighborhood owns a PV system, Furthermore, results show that most PV generated electricity is consumed locally without resulting into transmission losses. This holds true even for communities with a high penetration of PV systems. R4I had an average PV system size per household of 1.7 kWp, but SSR at the community level was still 60–70%. Yearly imported values have a diverse range considering the size of the samples. For creating insight into various consumption patterns, pilots usually try to include various household sizes to sample different fractions of the population. For instance, this is not the case in JEM-Easy street, which ends up having outstandingly low consumption, which is not representative for an average household in the Netherlands. However, other groups or pilots had more diverse household sizes. For example, JEM-Meulenspie and PMC included heat pumps, which made the annual electricity consumption vary between 2 to 8 MWh, while the electricity consumption without heat pumps (in R4I) varied between 1 to 6 MWh in their annual imported electricity (
Figure 4). Caution should be taken while scaling up these results. The socio-economical properties, household sizes and surfaces, types of households, technologies employed, and geographical attributes should be similar within a region, to get as representative a result as possible.
Considering the load duration curves and peak PV feed-in values, an increased delivery of electricity to the grid can also have similar consequences for power grid failures. With respect to the solar PV fed into the grid, R4I showed the largest values (
Figure 5). The second largest delivery of renewable power to the grid was realized in JEM-Meulenspie. PMC had a virtual PV system for 18 households, with power delivered, controlled, and distributed by an energy algorithm, which made the distribution narrower. The physical PV rooftop installations are the outliers. That is most probably why the community aggregated normalized in feed peaks is more than the average at that particular moment. In Zonnedael there are few households with PV systems, but these are considered outliers.
Concerning outliers, for the households without heat pumps, even the highest outliers are safe in the sense that they do not pose a risk for outages given their relatively low values. Within the sample of 47 households with heat pumps, only three households show a peak over 10 kW. These households most likely have a large connection, whereas the new standard connection allows their safe operation even in extreme scenarios. In the case of the use of heat pumps, it is recommended to integrate an energy management system for managing activation time, taking into account neighborhood consumption. As the electricity demand of heat pumps is highly dependent on the ambient temperature, these systems could exhibit a high simultaneity in demand, and if not well managed, this simultaneity might result in peak demand at the same time, and in a high load of transformers in some extreme scenarios, even though such circumstances did not occur during the investigated time period.
5. Conclusions
In this paper, we have analyzed energy data from 287 households from five different locations to determine seven key performance indicators: monthly electricity consumption (range of pilots averages on household level: 100–600 kWh) and production (idem: 4–200 kWh), annually imported (idem: 3.1–4.5 MWh) and exported (idem: 0.2–1 MWh) electricity, residual load, peak of imported (idem: 4.8–6.8 kW) and exported (idem: 0.3–2.2 kW) electricity, import simultaneity (idem: 20–70.5%) and feed-in simultaneity (idem: 75–89%), self-sufficiency (idem: 18–20%), and (7) self-consumption (idem: 50–70%).
Our results not only identified the average household of the pilots, diagnosed the extrema as the households with outlier characteristics and peak loads, but also distinguished the community values. On community level, SCRs and SSRs are noticeably higher, showing that households are able to supply part of the electricity need of their neighbors. Local use of PV-generated electricity decreases the stress on the LV/MV transformer and accompanying transmission losses. Apart from the load curves shown in this paper, it was found that the electrification of heating systems in buildings which use heat pumps, leads to an increase of their annual electricity consumption and peak loads of approximately 30%, compared to average Dutch households without heat pumps. Further it the investigated households showed a low self-sufficiency of around 20%, mainly because of their use of relatively small PV systems. Therefore, they could not be classified as energy neutral. To increase the self-sufficiency of households, further investigations are required to optimize smart grid systems. It becomes apparent that households shifting to electric heating (heat pumps) will face a significant increase in electricity consumption compared to the Dutch average. This is quite relevant for the Netherlands, as all newly built buildings are not allowed to be connected to the gas network anymore due to the Climate Agreement (klimaatakkoord). The integration of heat pumps will also have implications for network operators in terms of increased costs for reinforcing the grid to accommodate increasing demand. Especially attributed to the high simultaneity of consumption of heat pumps due to correlation with ambient temperature. Relatively low self-sufficiency ratios and high self-consumption ratios have been obtained in the pilots, since the installed PV capacity was rather small. Self-sufficiency is expected to increase with the current trend of installing larger solar installations on roof tops. In perspective, integration and size of the battery will be part of a future work, by using better monitoring and more households’ data to increase statistical significance.

 ,
, 


