Article

Impedance Modeling Based Method for Sub/Supsynchronous Oscillation Analysis of D-PMSG Wind Farm

1
School of Electrical Engineering, Xi’an Jiaotong University, Xi’an 710049, Shaanxi, China
2
Xi’an Thermal Power Research Institute Co., Ltd., Xi’an 710054, Shaanxi, China
*
Author to whom correspondence should be addressed.
Appl. Sci. 2019, 9(14), 2831; https://doi.org/10.3390/app9142831
Submission received: 30 June 2019 / Revised: 9 July 2019 / Accepted: 10 July 2019 / Published: 16 July 2019

Abstract

:
Subsynchronous oscillation (SSO) is a critical issue for the direct-drive permanent magnet synchronous generator (D-PMSG) based wind farm integrated to a weak onshore AC grid. To analyze the mechanism of the SSO phenomenon of D-PMSG based wind farm, widely used impedance-based stability analysis method is utilized in this paper. First, the impedance model based on the harmonic linearization theory of grid-connected D-PMSG is proposed, and the mechanism of sub/supsynchronous currents coupling is analyzed quantitatively for the first time. Then, based on the impedance model and relative stability criterion, the influence of wind farm operating parameters and grid impedance on stability is discussed. Simulations are carried out to verify the correctness of theoretical analysis.

1. Introduction

Recently, renewable energy generation has been developing rapidly all around the world due to the depletion of traditional energy and serious environmental pollution. Wind and solar energy with the benefits of cleanness, short construction cycle, and low running cost, have become the promising energy source. For practical power grids, the doubly fed induction generator (DFIG) and the direct-drive wind generator (direct drive permanent magnet synchronous generator (D-PMSG)) are the most applied generators for wind turbines due to the advantages of variable speed-based operation and independent control of active and reactive power [1]. Compared to DFIG, D-PMSG uses full power converters and has lower maintenance cost. The back-to-back pulse width modulation (PWM) converter isolates the generator from the grid, which improves the low voltage ride through ability. Because of this, D-PMSG based wind farms get a wide range of applications.
Due to the reverse distribution of the energy and power load in China, the renewable energy, mainly based on the large-scale of wind and solar power, long-distance high voltage direct current (HVDC) transmission system and series compensation transmission lines are widely utilized in nowadays power grid. However, previous researches pointed out that subsynchronous oscillation (SSO) is a potential problem in this series-compensated and HVDC transmission system [2,3]. On the other hand, with the increase of the wind energy, the short circuit ratio (SCR) at the point of common coupling (PCC) will decrease since the wind farm cannot provide enough support to the power grid, which will worsen the stability of power grid.
The SSO of grid-connected wind farm has been detected worldwide, for instance, in the wind farms of USA (Texas, 2009), China (GU yuan, Hebei Province, 2011) [4,5]. The above events are all due to the series compensation or HVDC transmission, which has already been analyzed and classified as subsynchronous resonance (SSR), subsynchronous control interaction (SSCI) [6,7,8]. Theoretical research and simulation studies have been conducted to investigate the mechanism and characteristics of these phenomena. Various countermeasures have also been proposed to solve the SSR problem [9,10,11].
A new type of sub/supsynchronous oscillation which had no relation with series compensation was detected the D-PMSG based full-converter wind farm in Xinjiang, China, in July 2015 [12,13]. The continuous oscillation of power grid initiated shafting torsional vibration of synchronous generators outside 200 km, which finally resulted in the decrease of HVDC power. The analysis of the accident shows that the operating adjustments of HVDC have no relation with this type of SSO. Besides, since the natural torsional frequency of shafting vibration in direct drive permanent magnet synchronous generator is very low (1–10 Hz), and the generator and power system are isolated by back-to-back PWM converter, subsynchronous torsional interactions (SSTI) will not occur in D-PMSG based wind farm.

1.1. Related Works

Plenty of researches have been carried out to study on the mechanism of the SSO of the grid-connected D-PMSG farm. But yet the cause of this new type of SSO is not clear.
Time-domain simulation, eigenvalue analysis, and impedance-based stability analysis are the mostly used methods in the analysis of SSO. It is intuitive to observe the SSO phenomenon by using time-domain simulation. However, it has difficulties in figuring out the interactions between the wind farm and power system. Eigenvalue analysis has the advantages in the mechanism analysis of SSO but this method needs plenty of information of power system and it is not realistic to apply in the large-scale system. Impedance-based stability analysis is a newly developed method in the analysis of SSO. In this method, D-PMSGs are considered to provide a capacitive impedance for the system which will lead to SSO. This method is not limited by the system scale and can be used in the black-box systems, which have flexible application scenario.
Progress has been made in the study of impedance-based stability analysis. Existing approaches to analyzing such instability problems focus on small-signal impedance modeling [14]. As mentioned above, since the DC link capacitor between two converters isolates the machine side converter (MSC) and the grid side converter (GSC), the interactions between the GSC and the power grid are mainly concerned. Impedance-based stability analysis separates the inverter-grid system into two independent parts and calculates their impedance respectively. The inverter-grid system will remain stable if the ratio between the grid impedance and the inverter output impedance satisfies the Nyquist stability criterion.
There are two methods to construct this impedance model: (1) transform the converter model into the dq reference frame, and use small-signal linearization; (2) use harmonic linearization method and directly model the three-phase positive- and negative-sequence impedance in the phase domain [15,16]. The first method could easily obtain the impedance model for the dq-domain control system. However, several limitations were discussed: not suitable for unbalanced grid; the dq impedance is coupled and it is hard to measure in practical systems. The harmonic linearization method overcomes these disadvantages by modeling three-phase voltage source inverter (VSC) impedance directly in the phase domain. Despite the complex derivation, this method is widely used to investigate the impedance characteristic of grid-connected full converter wind farm. The work in References [17,18] analyzed the interaction between D-PMSGs and grid by experimentally measuring the impedance, but the mathematical expression was not proposed. Reference [19] built the impedance model of grid-connected VSC and it was further developed in Reference [20] to describe impedance characteristics of LCL-type converter, but the stability analysis was not mentioned in both articles. References [21,22] modeled the D-PMSG impedance and analyzed the system stability with or without outer-loop control, but the frequency coupling was not considered. The coupling phenomenon introduced by phase locked loop (PLL) was discussed in References [23,24,25] and derived the coupled impedance model of grid-connected converter. However, this model was too complicated and the relationship of sub/supsynchronous currents was not analyzed either.

1.2. Main Contribution

Most existing literature assumed that the PCC voltage perturbation at fp will only bring the same frequency error components in Park’s transformation. Moreover, the output current harmonic component at coupled frequency 2f1fp was neglected. However, these assumptions are obviously incorrect according to time-domain simulation results.
Based on the existing researches, this paper constructs the impedance model of grid-connected D-PMSG by using harmonic linearization small-signal modeling method. By reasonable simplification, the outer-loop control of converter is not considered [26], and the converter model is treated as voltage-controlled voltage source. It is worth mentioning that the frequency coupling of PLL and the relationship between sub/supsynchronous coupling currents are analyzed quantitatively. The simplified PWM converter and related theoretical analysis were all verified by simulation then. Furthermore, based on the correct impedance model and relative stability criterion, the impedance sensitivity of wind farm operation parameters and the influence on system stability are discussed. Finally, a time-domain simulation of SSO appearance when SCR decreases is carried out, which is theoretically explained.

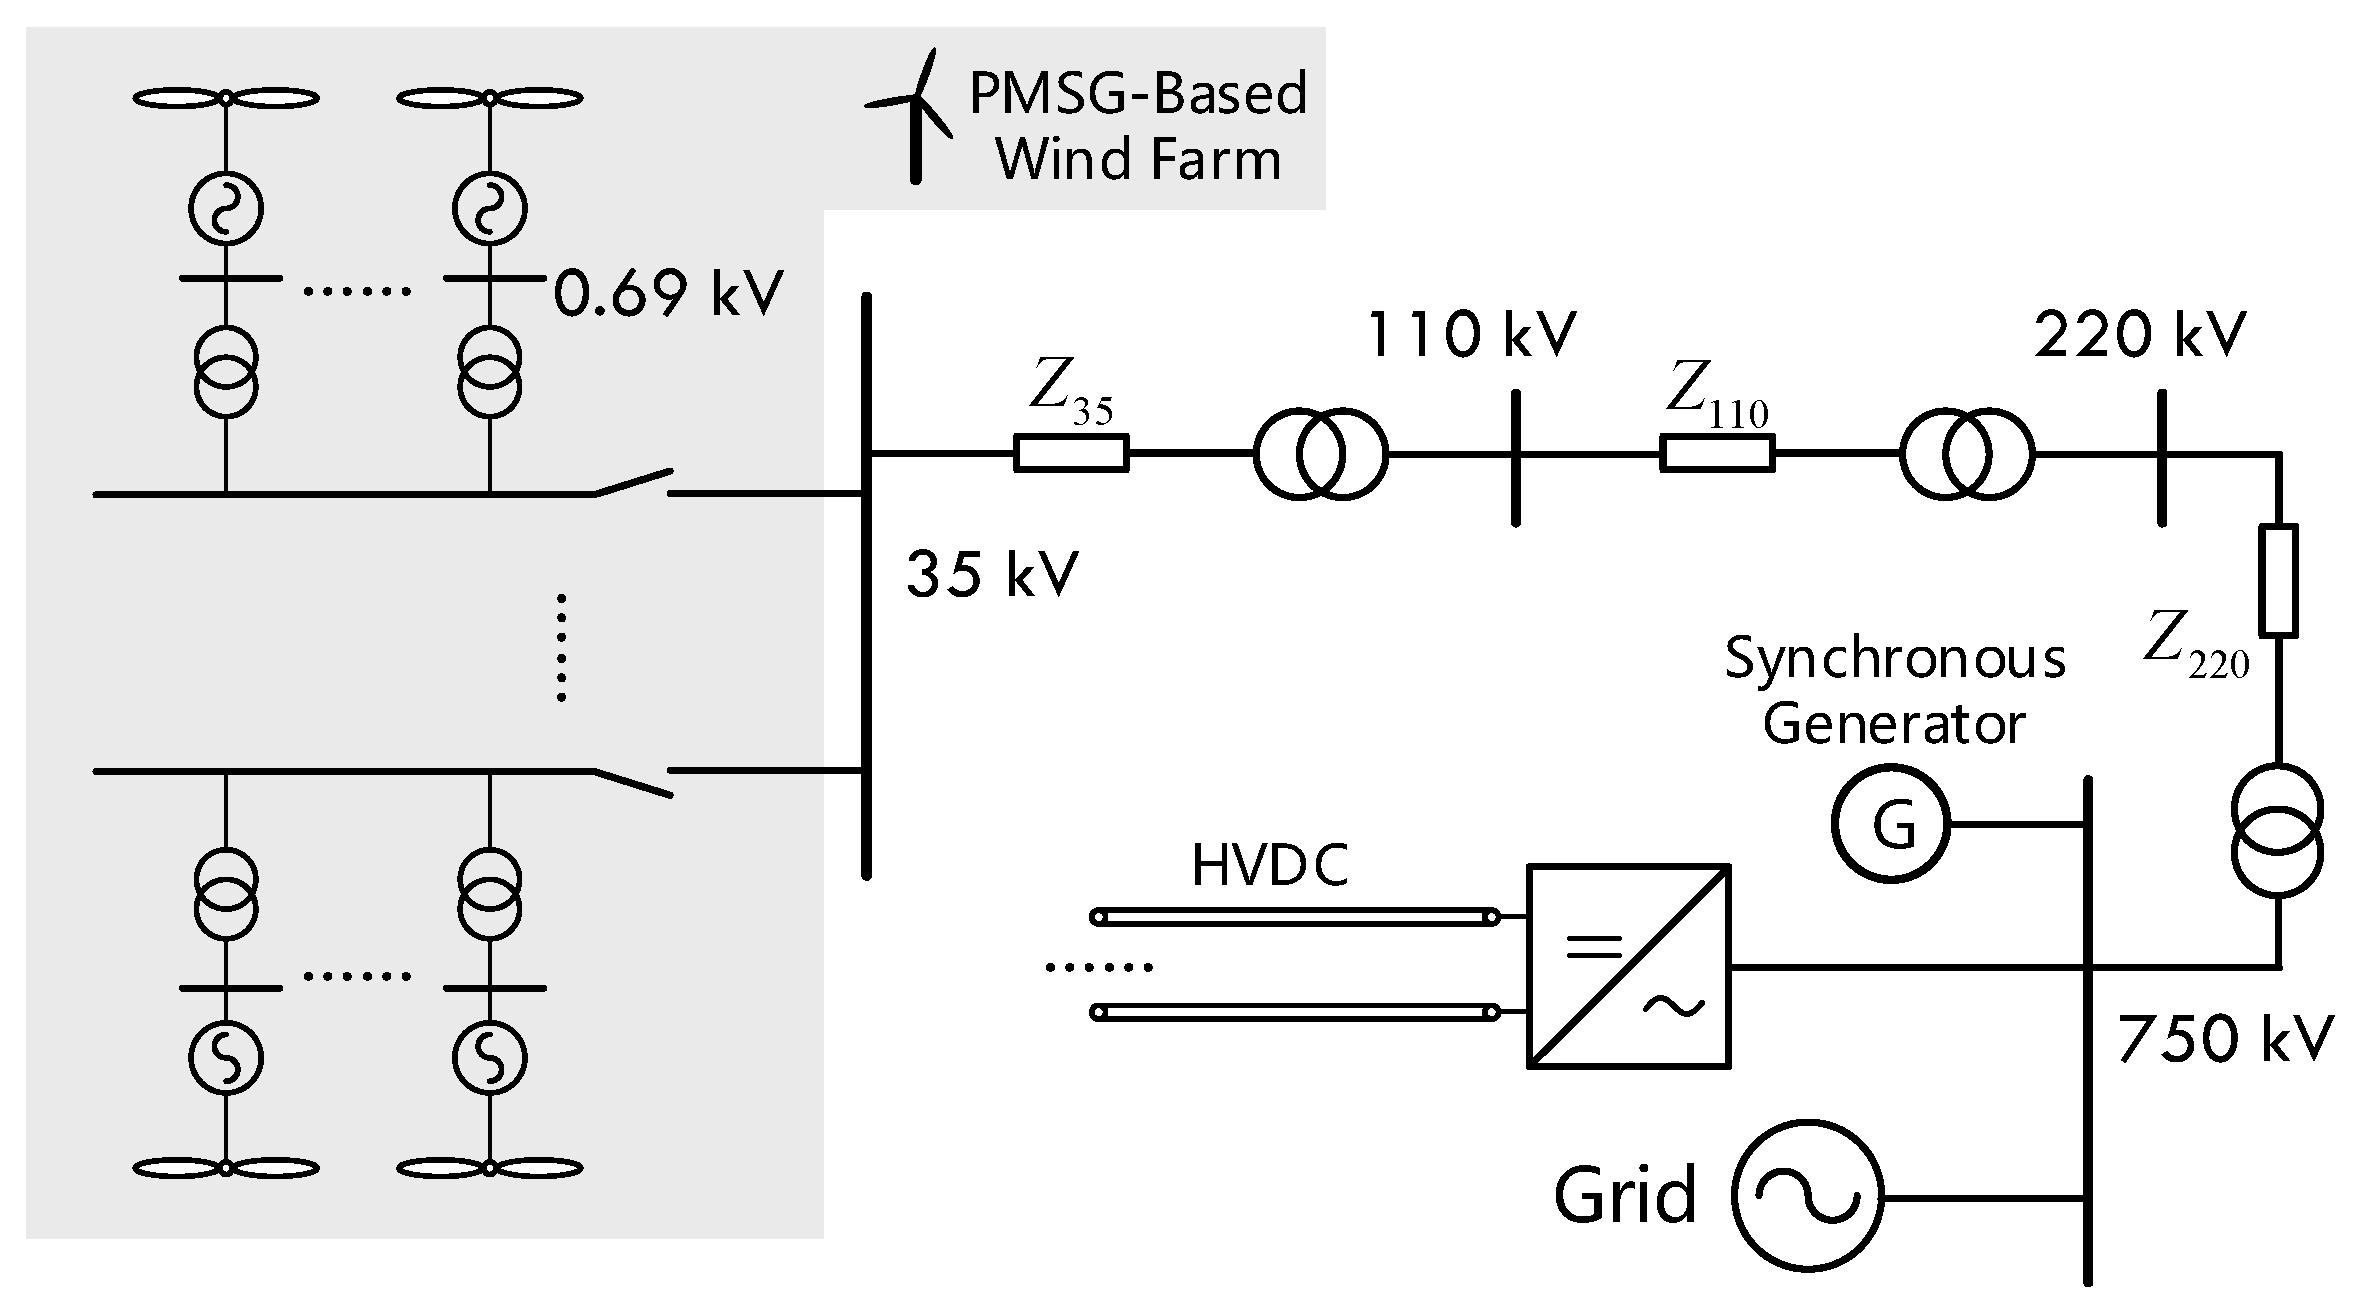
2. Impedance Characteristics Analysis of D-PMSG

This section constructs the impedance model of grid-connected D-PMSG based wind farm. The structure diagram of the wind farm integrated in weak AC grid is presented first. Secondly, two assumptions are adopted to simplify the D-PMSG to a grid-connected converter. Then, the small-signal model of PLL considering frequency coupling is proposed, which is a key step to apply the harmonic linearization in different reference frame. Based on the PLL model, harmonic components in current control loop could be further obtained. Another simplification is about the PWM converter model. Finally, the impedance of D-PMSG is calculated and the relationship between coupled currents is analyzed.

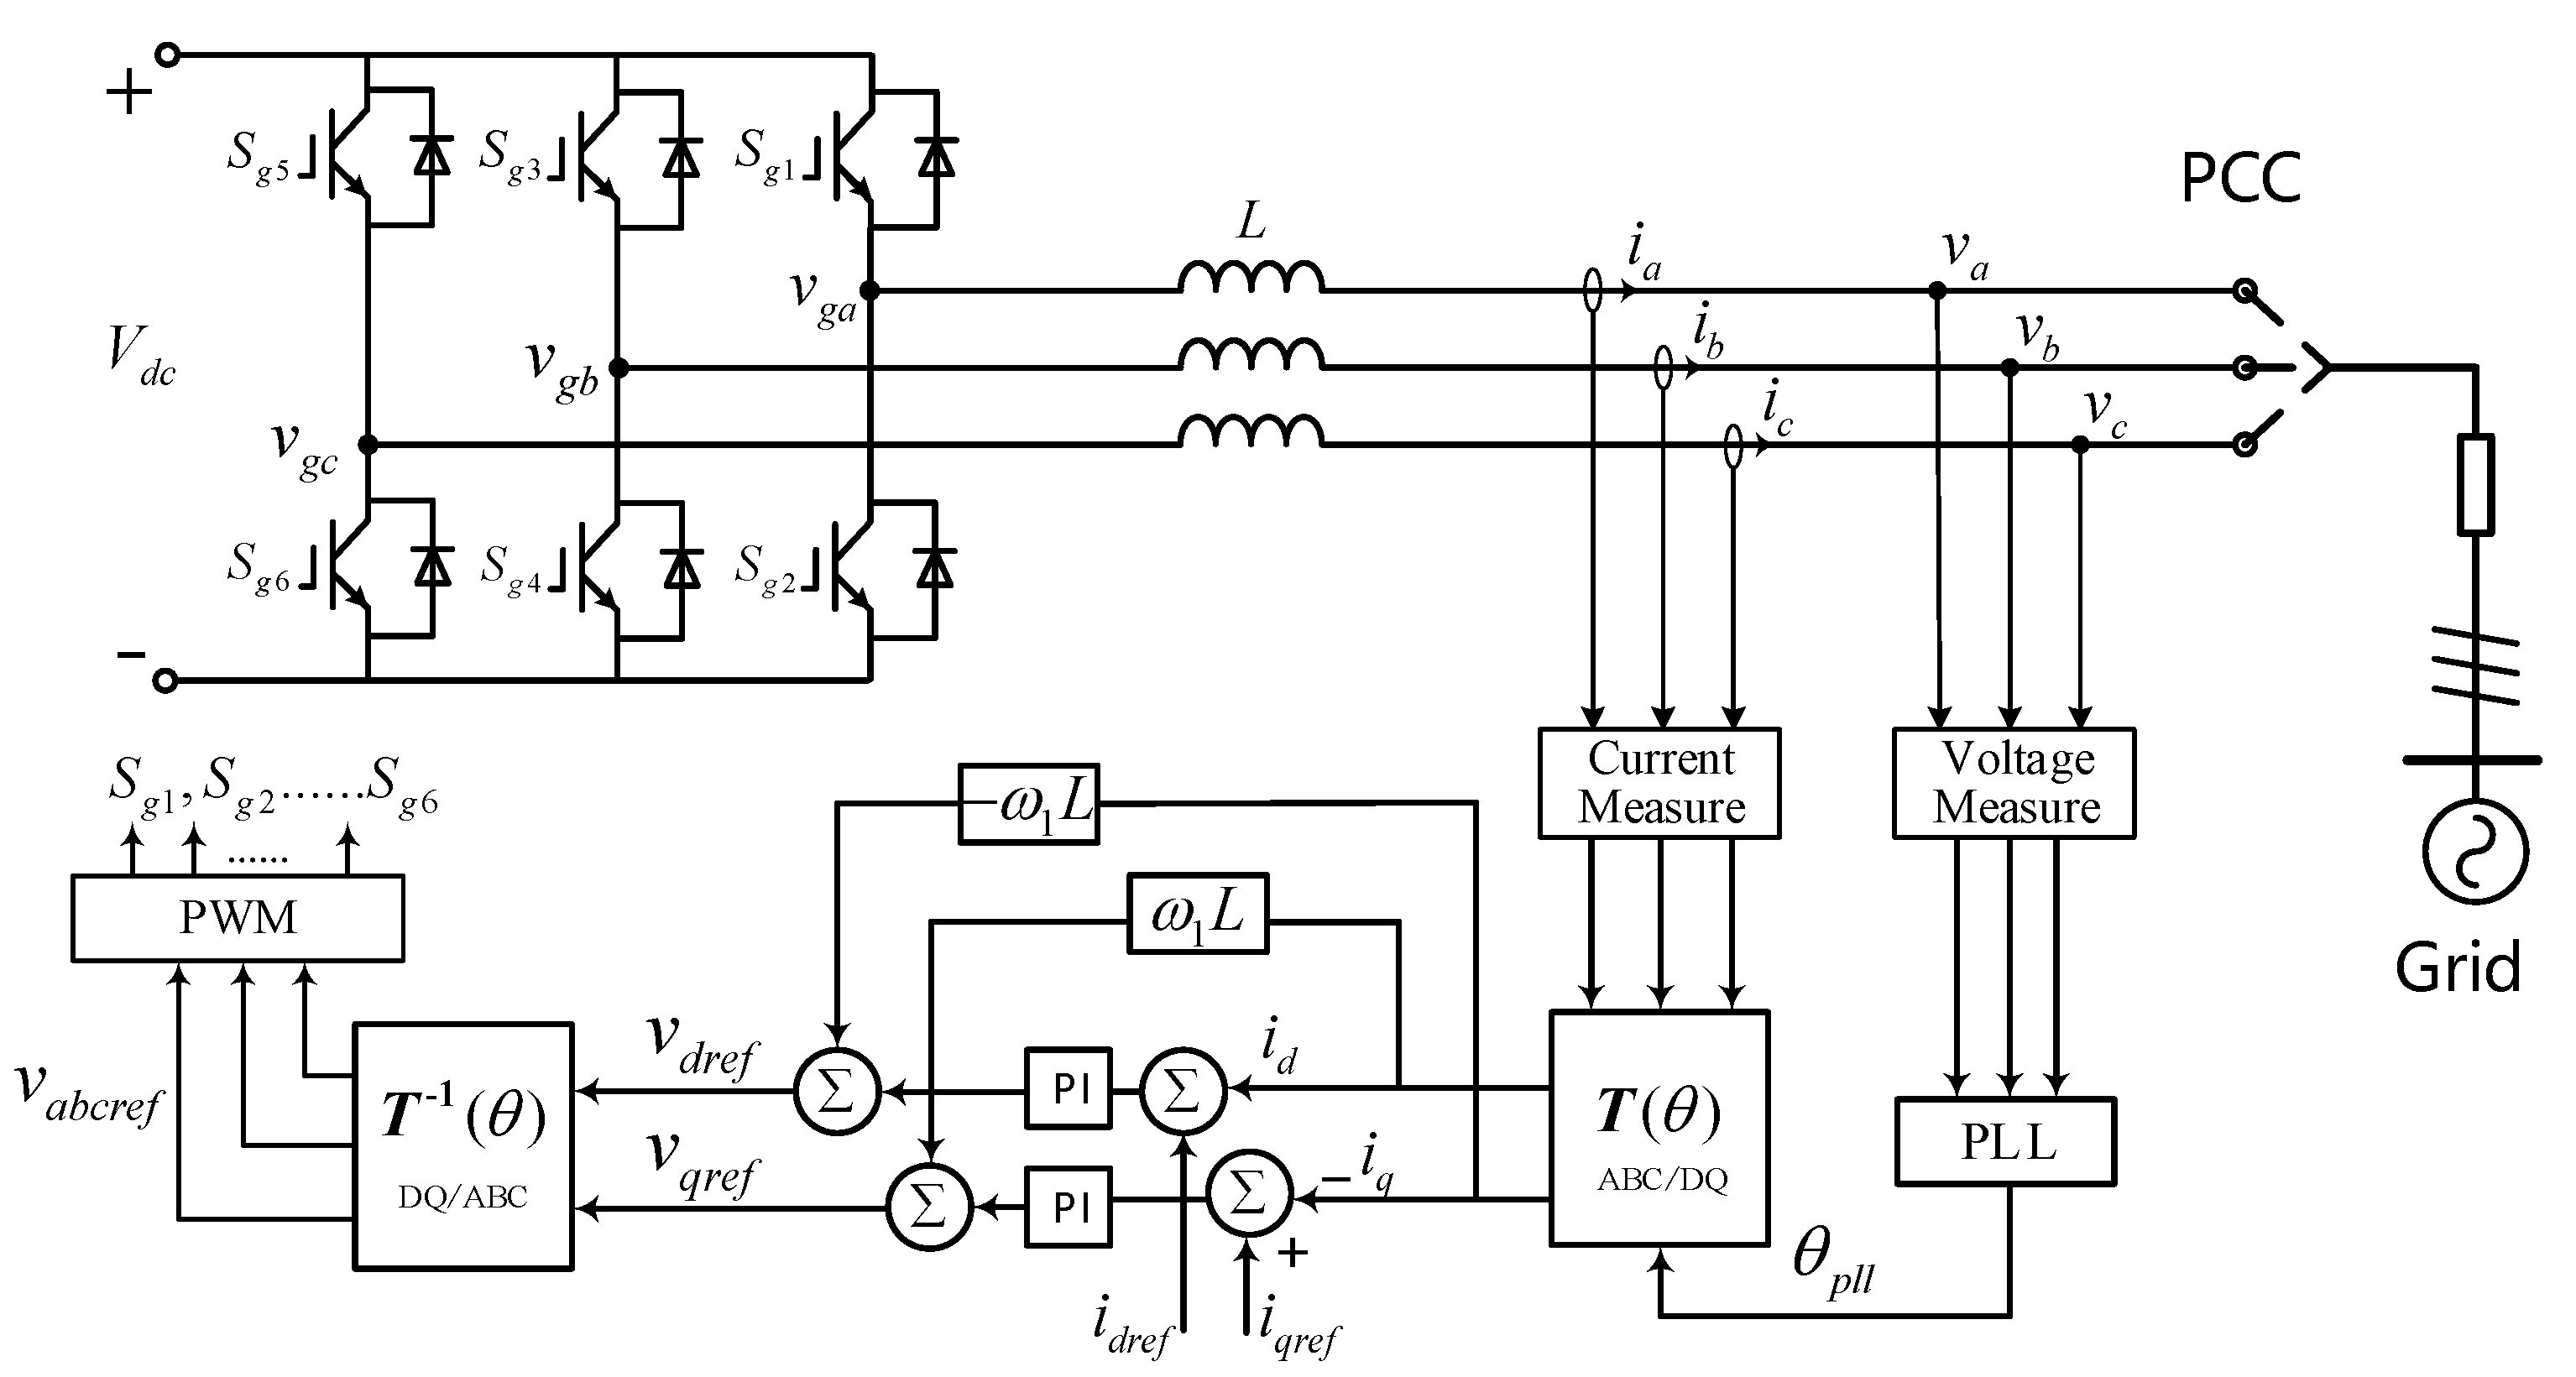
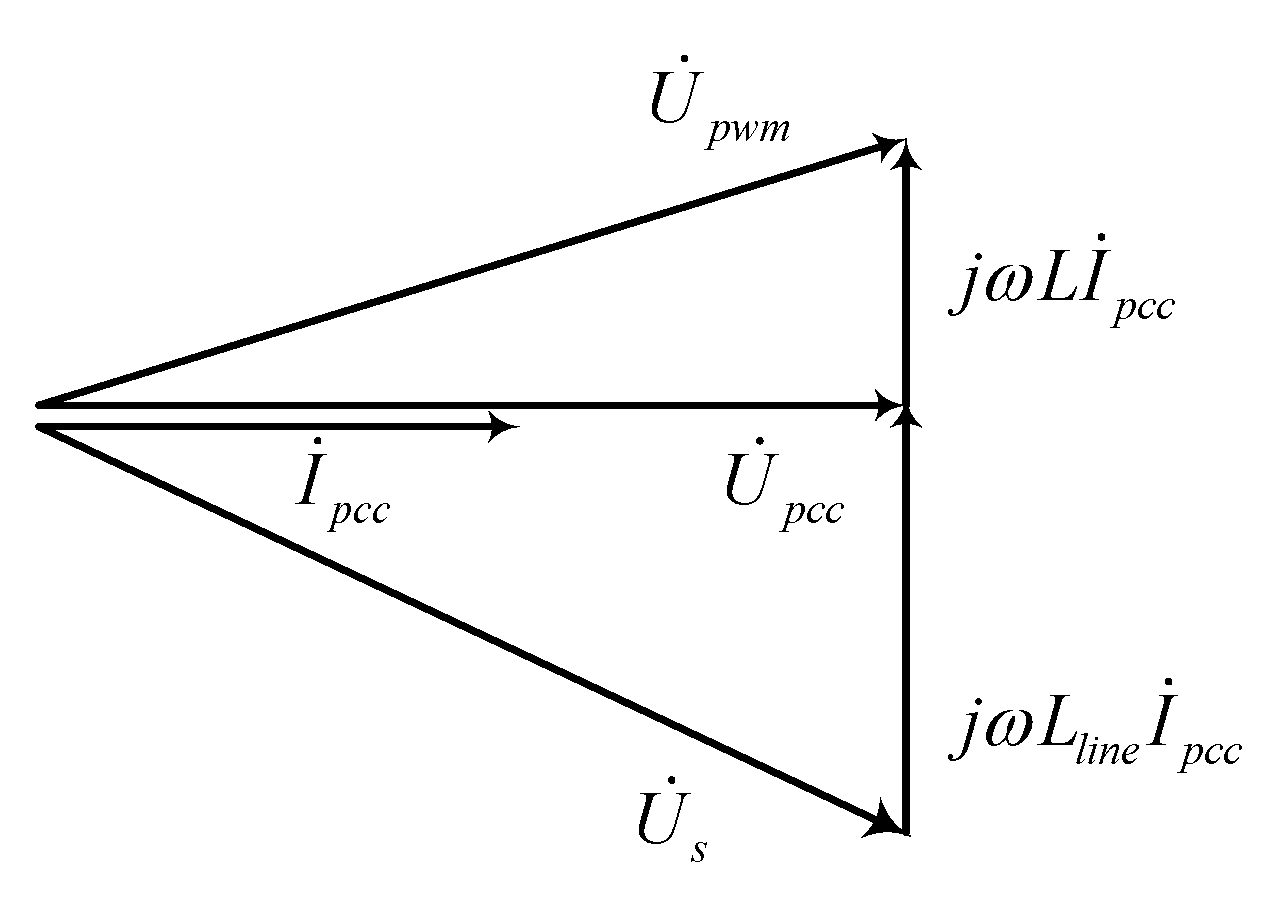
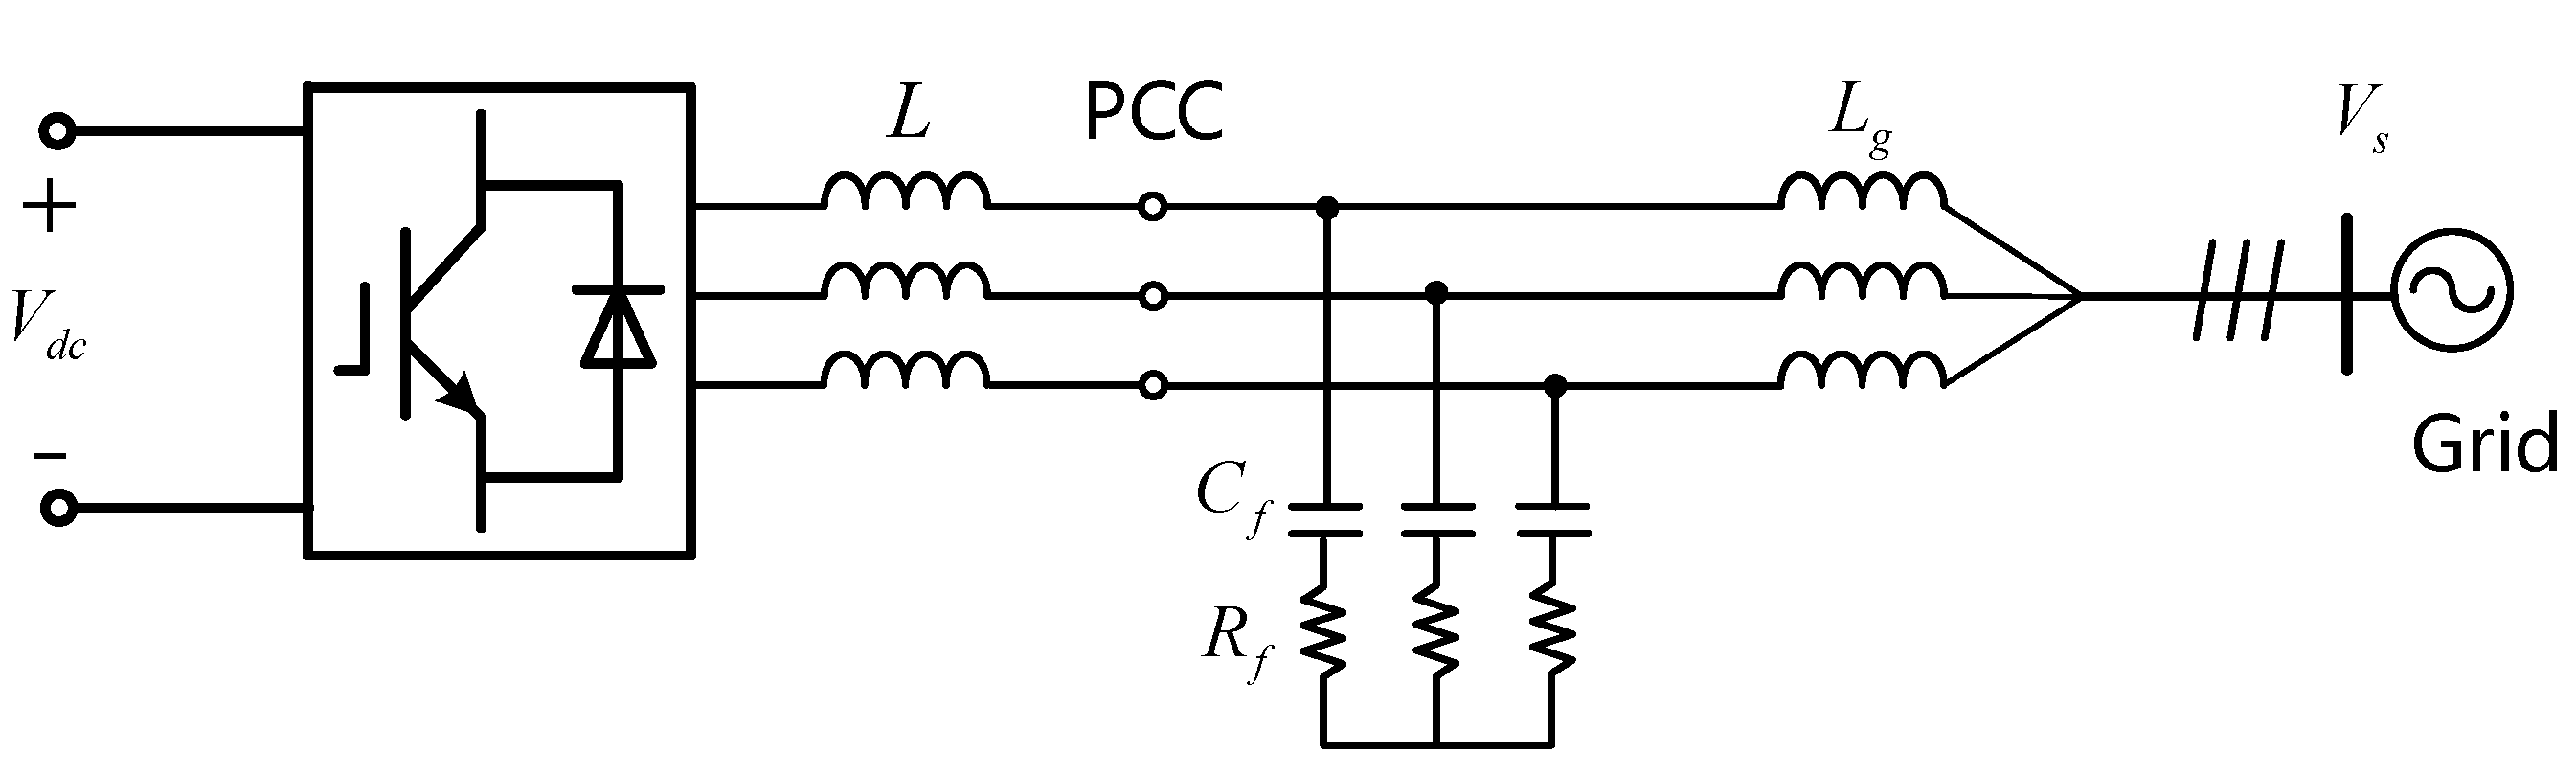
2.1. Simplified Model of D-PMSG

The structure diagram of D-PMSGs integrated in a weak AC grid is shown in Figure 1. The wind farm in Xinjiang consists of hundreds of 1.5 MW D-PMSGs. Every unit is radially connected to 35 kV bus through a 0.69/35 kV transformer. Then, the electric power is collected at the 35-kV substation and next transmitted along higher voltage level transmission lines, to the 750-kV power grid 200 km away. The thermal synchronous power units are also connected to the common bus. Extra power is transmitted along HVDC to Eastern China. Since the transmission line has a long-distance and multi-stage transformers boost the voltage, the grid side equivalent impedance is as large as 0.4 pu [21]. The SCR is 2.5 (<3) and the grid wind farm integrate into belongs to weak AC grid [27].
As shown in Figure 2, grid-connected D-PMSG unit consists of wind turbine, permanent magnet synchronous generator, machine side converter (MSC), and grid side converter (GSC). The MSC controls the rotor speed to track the maximum wind power. The GSC is controlled to maintain the DC-link voltage and the output power factor.
It is well understood that the small signal disturbance from the GSC cannot transmit to the MSC since the DC capacitor decouples the interactions between two converters. Therefore, the generator and the MSC is usually simplified as controlled current source when applying the small signal stability analysis. On the other hand, the outer loops of VSC control, DC voltage control, and reactive power control are proved not to take part in the dynamics under frequency band of SSO, 10~100 Hz approximately [26]. Consequently, the impedance model constructed in this paper mainly concerns the influence of GSC control parameters, operating condition. The structure diagram of simplified grid-connected D-PMSG system is shown in Figure 3. For the reasons above, Vdc is assumed constant in this study and the active and reactive current references (Idref and Iqref) are assumed constant.
Phase voltages are denoted as va, vb, and vc, while phase currents as ia, ib, and ic. In d-q axis, recall the current as id, iq. The ABC/dq transformation reference angle θpll is the output of PLL, whose function is obtaining the phase angle of AC voltage. The block diagram of PLL is depicted in Figure 4, where HPLL(s) is the PLL regulator which uses a PI controller and an integrator. Current errors are adjusted by the current controller and added with feedforward compensation. The results vdref, vqref are the dq-domain voltage references, which are transformed to varef, vbref, and vcref for PWM.

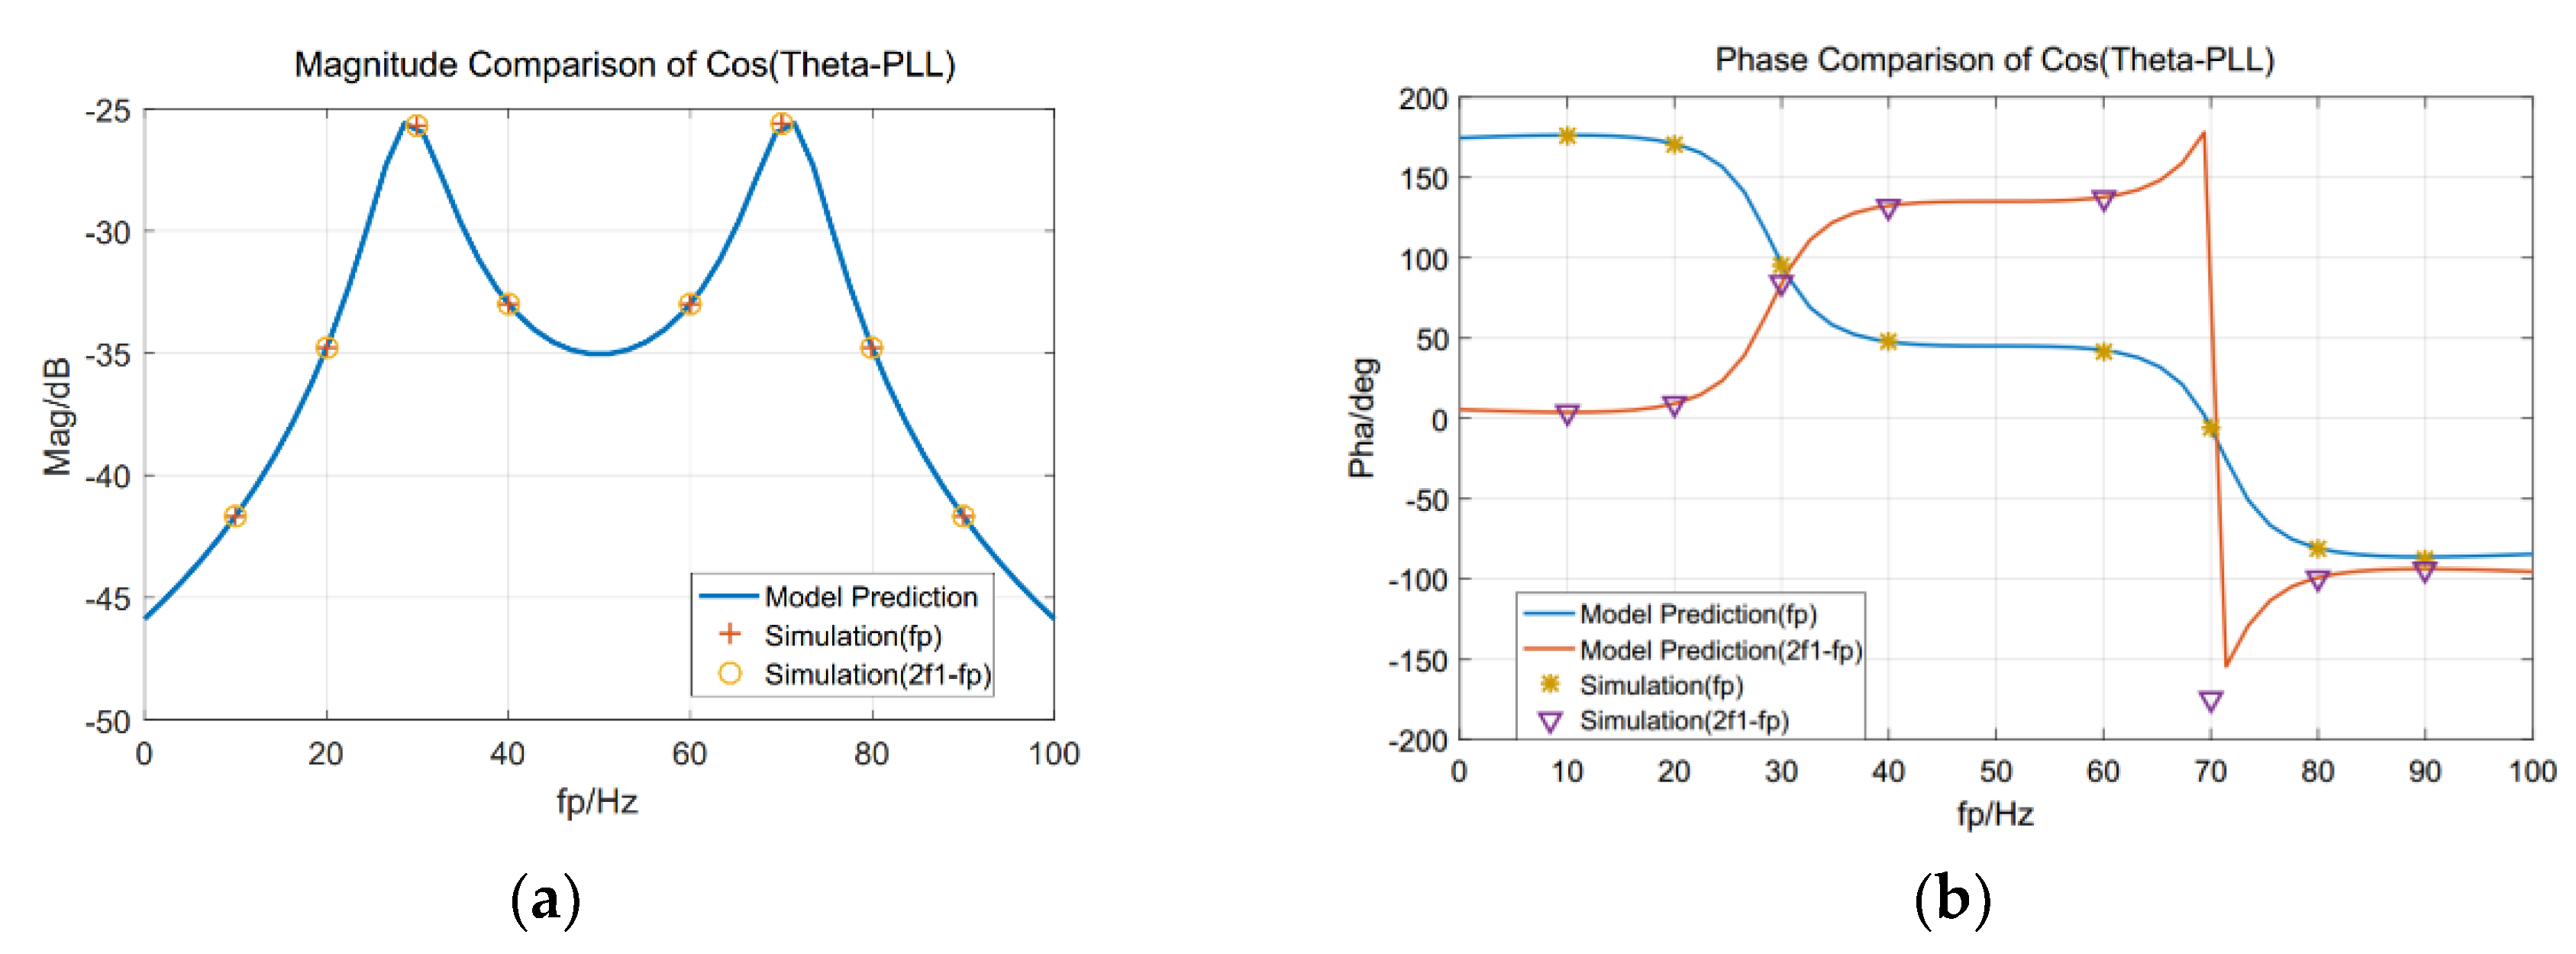
2.2. Small-Signal Modeling of the PLL

As described in Figure 4, phase voltages are transformed to dq-domain voltage vd and vq by Park’s transformation. When there is a harmonic frequency fp component in PCC voltage, the output angle θpll will be θ1 + Δθ. The Park’s transformation could be broken into two parts as follows:
T ( θ p l l ) = 2 3 [ cos θ p l l cos ( θ p l l 2 π / 3 ) cos ( θ p l l + 2 π / 3 ) sin θ p l l sin ( θ p l l 2 π / 3 ) sin ( θ p l l + 2 π / 3 ) ] = [ cos Δ θ sin Δ θ sin Δ θ cos Δ θ ] T ( θ 1 ( t ) )
where T(θ1) is the Park’s transformation when θpll = θ1 = ω1t.
In the time domain, the phase voltage with a small-signal perturbation can be written as:
v a ( t ) = V 1 cos ω 1 t + V p cos ( ω p t + φ u p )
where V1 corresponds to the magnitude of the fundamental voltage at frequency f1, Vp, with ϕup correspond to the magnitude and phase of the positive-sequence perturbation at frequency fp.
Similar to phasor analysis, in the frequency domain, the voltage (1) could be written as:
V a [ f ] = { V 1 , f = f 1   V p , f = f p
where V1 = V1, Vp = Vp* eup correspond to the fundamental and disturbance voltage in frequency domain.
For linearization, apply T(θ1) to (3), and define Vdv[f], Vqv[f] as frequency domain d and q outputs:
V d v [ f ] = { V 1 ,   dc   V p , f = f p f 1
V q v [ f ] = j V p , f = f p f 1
According to (1), considering Δθ, vq is easily found to be:
v q ( t ) Δ θ ( t ) v d v ( t ) + v q v ( t )
For voltage perturbation at fp, remove terms in Δθ(t) proportional to second and higher orders by the harmonic linearization principle, then Δθ(t) is given by
Δ θ [ f ] = G p ( s ) V p , f = f p f 1
Applying convolution to (4), (5), and (7), and neglecting terms in vq proportional to the second order, the result of (6) in frequency domain is as follows:
V q [ f ] = G p ( s ) V 1 V p j V p , f = f p f 1
Note that Δθ = Hpll(s) Vq, then Gp(s) can be solved from (8):
G p ( s ) = [ j H p l l ( s ) ] / [ 1 + V 1 H p l l ( s ) ] , f = f p f 1
To get the frequency errors of Park’s transformation, the final step is to obtain the response of cos(θpll(t)). Since cos(θpll(t)) = cos(θ1(t) + Δθ(t)) = cosω1t – sin(ω1t) Δθ(t), apply convolution again:
cos θ p l l [ f p ] = 1 2 H p l l ( s j 2 π f 1 ) 1 + V 1 H p l l ( s j 2 π f 1 ) V p = T p ( s ) V p cos θ p l l [ 2 f 1 f p ] = T p ( s ) V ˜ p
From above we can find that a voltage perturbation at fp will result in both fp and 2f1fp errors in Park’s transformation, which gives a primary explanation of why sub/supsynchronous components usually exist together.
A simulation experiment was conducted to verify the correctness of (10). Appendix A gives the setup parameters of the experiment. The voltages at PCC are V1 = 566 V, Vp = Vp eup = 20∙ejπ/4. The response of cos(θpll(t)) is depicted in Figure 5, compared with theoretical calculated results.

2.3. Impedance Modeling of D-PMSG

2.3.1. Harmonic Components in Control Loop

It is easily to get from Figure 3 that the modulating signals, current, and PCC voltage satisfy:
L d d t [ i a i b i c ] = [ v g a v g b v g c ] [ v a v b v c ]
In order to solve (11) for impedance in the frequency domain, the sequence components in the modulating signals should be found as functions of the voltage and current perturbations. In the previous section, we have initially reached a conclusion that sub/supsynchronous always appear together. Therefore, for the voltage of (2), the current can be assumed as:
i a ( t ) = I 1 cos ( ω 1 t + φ i 1 ) + I p cos ( ω p t + φ i p ) + I p 2 cos ( ( 2 ω 1 ω p ) t + φ i p 2 )
where the annotations similar to (2). Other phase currents can be inferred.
Recall that currents id and iq are outputs of a dq-domain transformation, which in the frequency domain involves a convolution of the frequency components in the phase currents, with the frequency components in Park’s transformation. Currents in frequency domain can be defined as (3), and frequency components of Park’s transformation are described in (10). Table 1 shows the possible combinations to consider in the convolution, it is worth noting that second and higher orders small signals are neglected. The dc components are not listed here, because id and iq would be exactly equal to Idref and Iqref at the stable operating point.
Combine the frequency components in Table 1 noting that Id [fp − f1] is the conjugate of Id [f1fp]:
I d [ f p f 1 ] = 2 j T p ( j 2 π f p ) V p I 1 sin φ i 1 + I p + I ˜ p 2 I q [ f p f 1 ] = + 2 j T p ( j 2 π f p ) V p I 1 cos φ i 1 j I p + j I ˜ p 2
Figure 3 depicts a dq-domain current controller, according to its diagram, the dq reference voltages are given by:
{ V d r e f = H i ( s ) ( I d r e f I d ) ω 1 L I q V q r e f = H i ( s ) ( I q r e f I q ) + ω 1 L I d , H i ( s ) = K p i + K i i / s
It is easy to find that the dq reference voltages have dc and (fpf1) components. Moreover, (14) can be further described as:
V d r e f [ d c ] = V 1 ω 1 L I 1 sin φ i 1 V q r e f [ d c ] = ω 1 L I 1 cos φ i 1
V d r e f [ f p f 1 ] = H i ( s ) I d [ f p f 1 ] ω 1 L I q [ f p f 1 ] V q r e f [ f p f 1 ] = H i ( s ) I q [ f p f 1 ] + ω 1 L I d [ f p f 1 ]
These signals are convoluted with inverse Park’s transformation to generate their phase-domain counterparts. Counting equations (10) and (13~16) together, the harmonics of phase-domain voltage references are as followings:
V a r e f [ f p ] = H i ( s j ω 1 ) I 1 T p ( s ) e j φ i 1 V p + V 1 T p ( s ) V p          + [ j ω 1 L H i ( s j ω 1 ) ] I p
V a r e f [ 2 f 1 f p ] = H i ( s j ω 1 ) I 1 T p ( s ) e j φ i 1 V ˜ p V 1 T p ( s ) V ˜ p            + [ j ω 1 L H i ( s j ω 1 ) ] I p 2

2.3.2. Simplified Model of the Converter

The converter depicted in Figure 3 uses pulse width modulation techniques. The amplitude of output phase voltage could reach as large as Vdc/2, correspond modulation factor is 1. Therefore, to get good control performance, it is necessary to take account in this characteristic when designing both system setup parameters and control strategies.
On one hand, in the design of the grid-connected converter parameters under the unit power factor control, it is worth mentioning that the output voltage, current, PCC voltage, and power grid voltage meet the relationship shown in Figure 6.
From the following figure, we can conclude that usually Upwm < Us since the soothing inductance usually smaller than line inductance Lline. As a result, it will be praised if the dc side voltage Vdc is set to be twice as large as Vsa, at least.
On the other hand, modulation factor in PWM should not be larger than 1 the carrier usually uses (−1, 1) triangular wave. Therefore, in control strategy design, the three-phase voltage reference should be divided by Vdc/2, amplitude limiter should be added respectively.
If the grid-connected GSC of D-PMSG system satisfied the two conditions above, the VSC could be supposed as a voltage-controlled voltage source, and vga, vgb, and vgc would follow varef, vbref, and vcref. To verify the correctness of the assumption, a simulation experiment was conducted. The structure diagram of experimental circuit is shown in Figure 3. The converter side parameters are listed in Appendix A. The grid side parameters used in this simulation are as follows: Vsa = 650 V, no resistance, and Lline increases from 0.3 mH to 0.46 mH at 3 s. The converter output voltage compared with reference voltage is depicted in Figure 7.
So, in this paper, the switching dynamics process of converter will not be detailed described. The simplified converter model is proposed and verified in this section, which satisfies:
{ v g a ( t ) = v a r e f ( t ) v g b ( t ) = v b r e f ( t ) v g c ( t ) = v c r e f ( t )

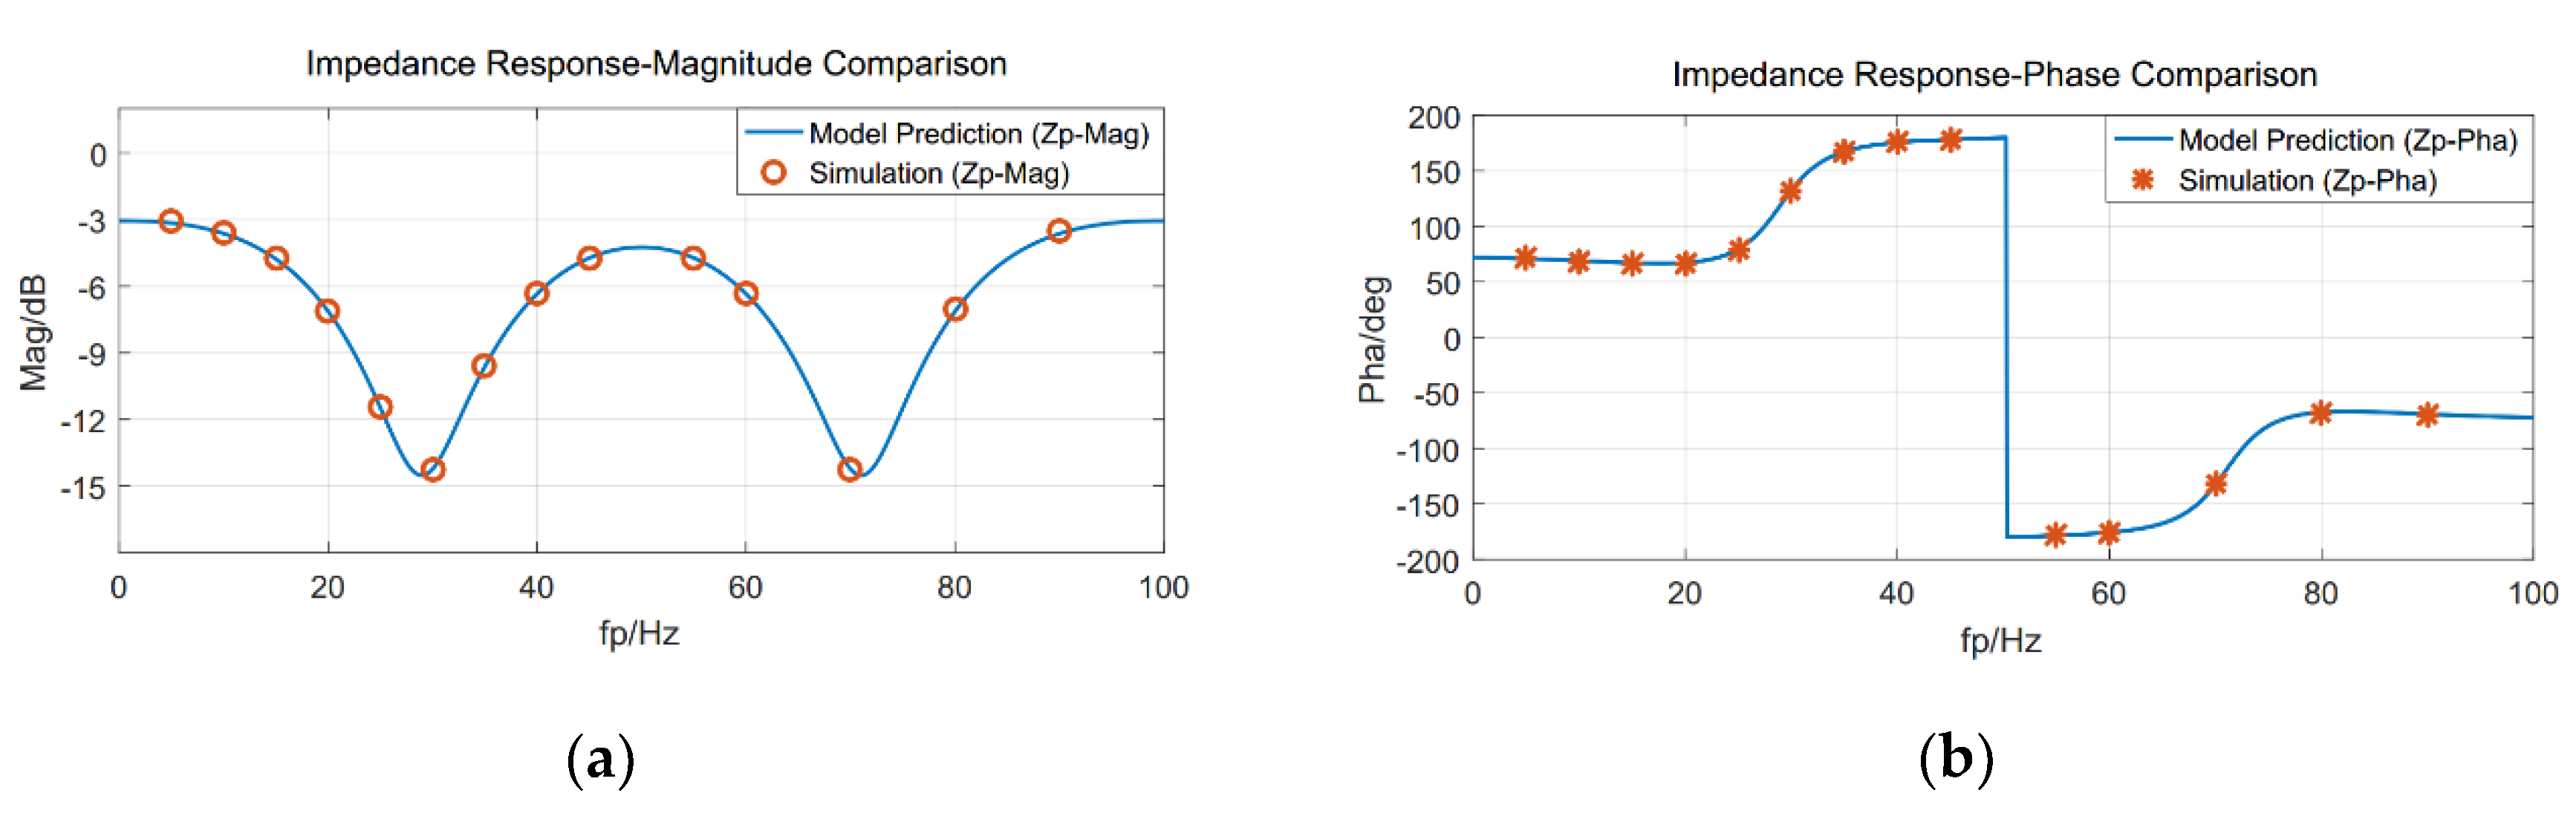
2.3.3. Impedance Analysis of D-PMSG

Transforming (11) to frequency domain, at the voltage perturbation frequency fp:
s L I a ( f p ) = V g a [ f p ] V a [ f p ]
Positive-sequence impedance is defined as:
Z p ( s ) = V p ( s ) / I p ( s )
Introducing (17), frequency-domain version of (19) and (20) in (21), the positive-sequence impedance of the grid-connected D-PMSG can be easily obtained:
Z p ( s ) = j ω 1 L s L H i ( s j ω 1 ) H i ( s j ω 1 ) I 1 T p ( s ) e j φ i 1 + V 1 T p ( s ) 1
Of course, the impedance characteristics have also been verified by simulation. Directly apply voltage va(t) = 565.3cos(2πf1t) + 20cos(2πfpt + π/4), fp =(0, 100 Hz) at PCC, and the other set up parameters remained the same as Appendix A. Voltage and current signals collected and analyzed by FFT tools, the calculated simulation results compared with impedance prediction are shown in Figure 8. From the phase characteristics we can find that the D-PMSG’s equivalent inductance XPMSG is positive at subsynchronous frequency while negative (capacitive) at supsynchronous frequency.

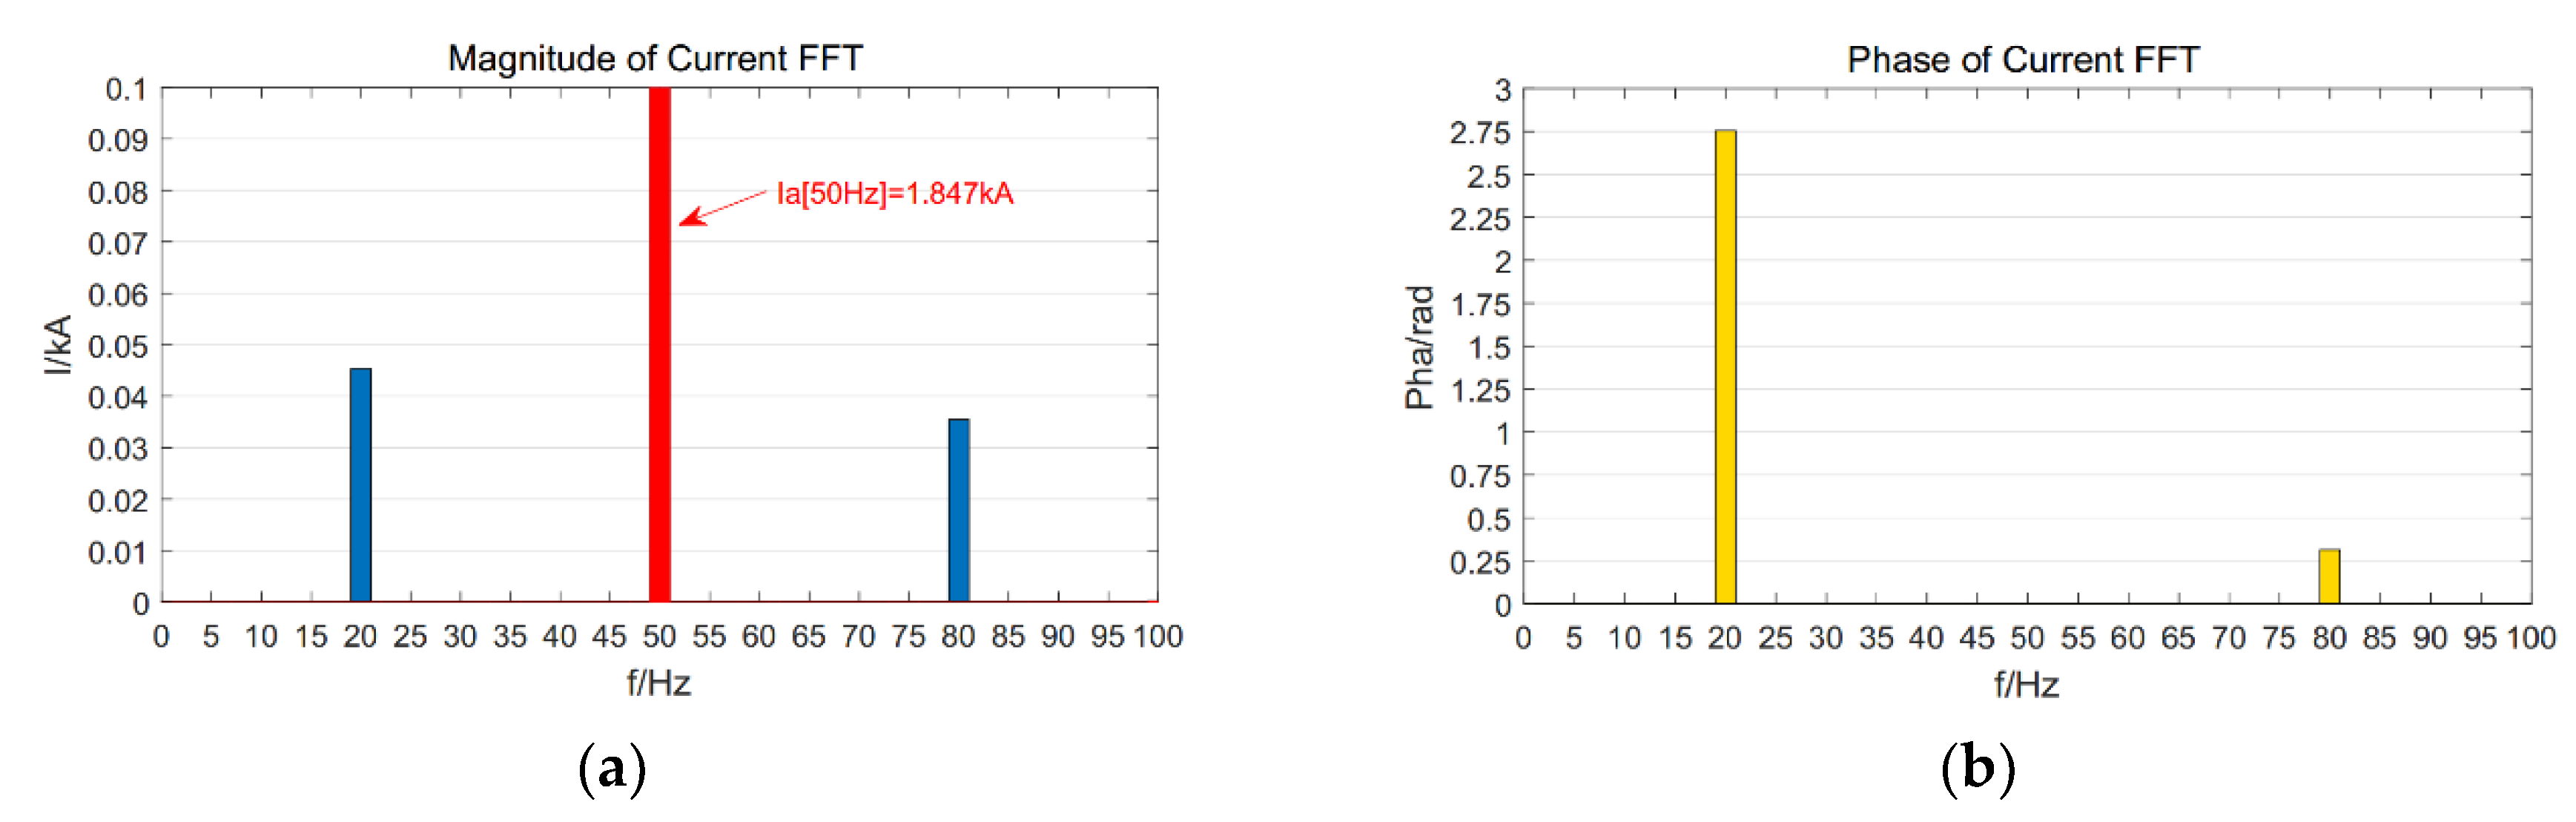
2.3.4. Frequency Coupling of the Sub/Supsynchronous Currents

Furthermore, the relationship between sub/supsynchronous currents could be analyzed. Since there is no (2f1 − fp) harmonic voltage at PCC, phase-domain voltage reference at (2f1 − fp) satisfies:
V a r e f [ 2 f 1 f p ] = V g a [ 2 f 1 f p ] = j ( 2 ω 1 ω p ) L I a [ 2 f 1 f p ]
Introducing (18) into (23), and eliminating Vp by (22), the current response is given by:
I p 2 [ 2 f 1 f p ] = H i ( j ω 1 j ω p ) I 1 T p ( s ) e j φ i 1 + V 1 T p ( s ) 1 [ H i ( j ω 1 j ω p ) I 1 T p ( s ) e j φ i 1 + V 1 T p ( s ) ] I ˜ p
For the system parameters setup in 2.2 section, it can be calculated that Ip2 = 0.7754∙ej3.063(Ip). In the simulation experiment conducted in 2.2, the comparison of sub/supsynchronous FFT results is shown in the following Figure 9. It is worth mentioning that for clearly observing, phases of the insignificant frequency components except for 20, 50, and 80 Hz are neglected. The simulation results in Figure 9 verified the correctness of (24) at 20 Hz. By changing the frequency of voltage perturbation, the correctness at (0, 100 Hz) could be validated, too.

3. Impedance-Based Stability Analysis of SSO

The impedance-based stability analysis was widely used and developed in recent years. It was firstly proposed to analyze the stability of inverter-grid system in Reference [19]. Under the assumption that the inverter is controlled as a current source parallel with an output impedance, it will remain stable with a nonideal grid if the ratio of the grid impedance to the inverter output impedance satisfies the Nyquist criterion. It was developed by proposing a simplified method based on aggregated RLC circuit model to intuitively explain and quantitatively evaluate this type of SSO [5]. This method has a clear physical meaning and is easy to carry out as follows: at the resonant frequency fr decided by negative XPMSG and positive XGrid, if the total resistance RPMSG + RGrid is negative, the grid-connected D-PMSG system will be unstable. This paper chose this method to analyze grid-connected D-PMSG stability, and simulation is conducted to verify the correctness.

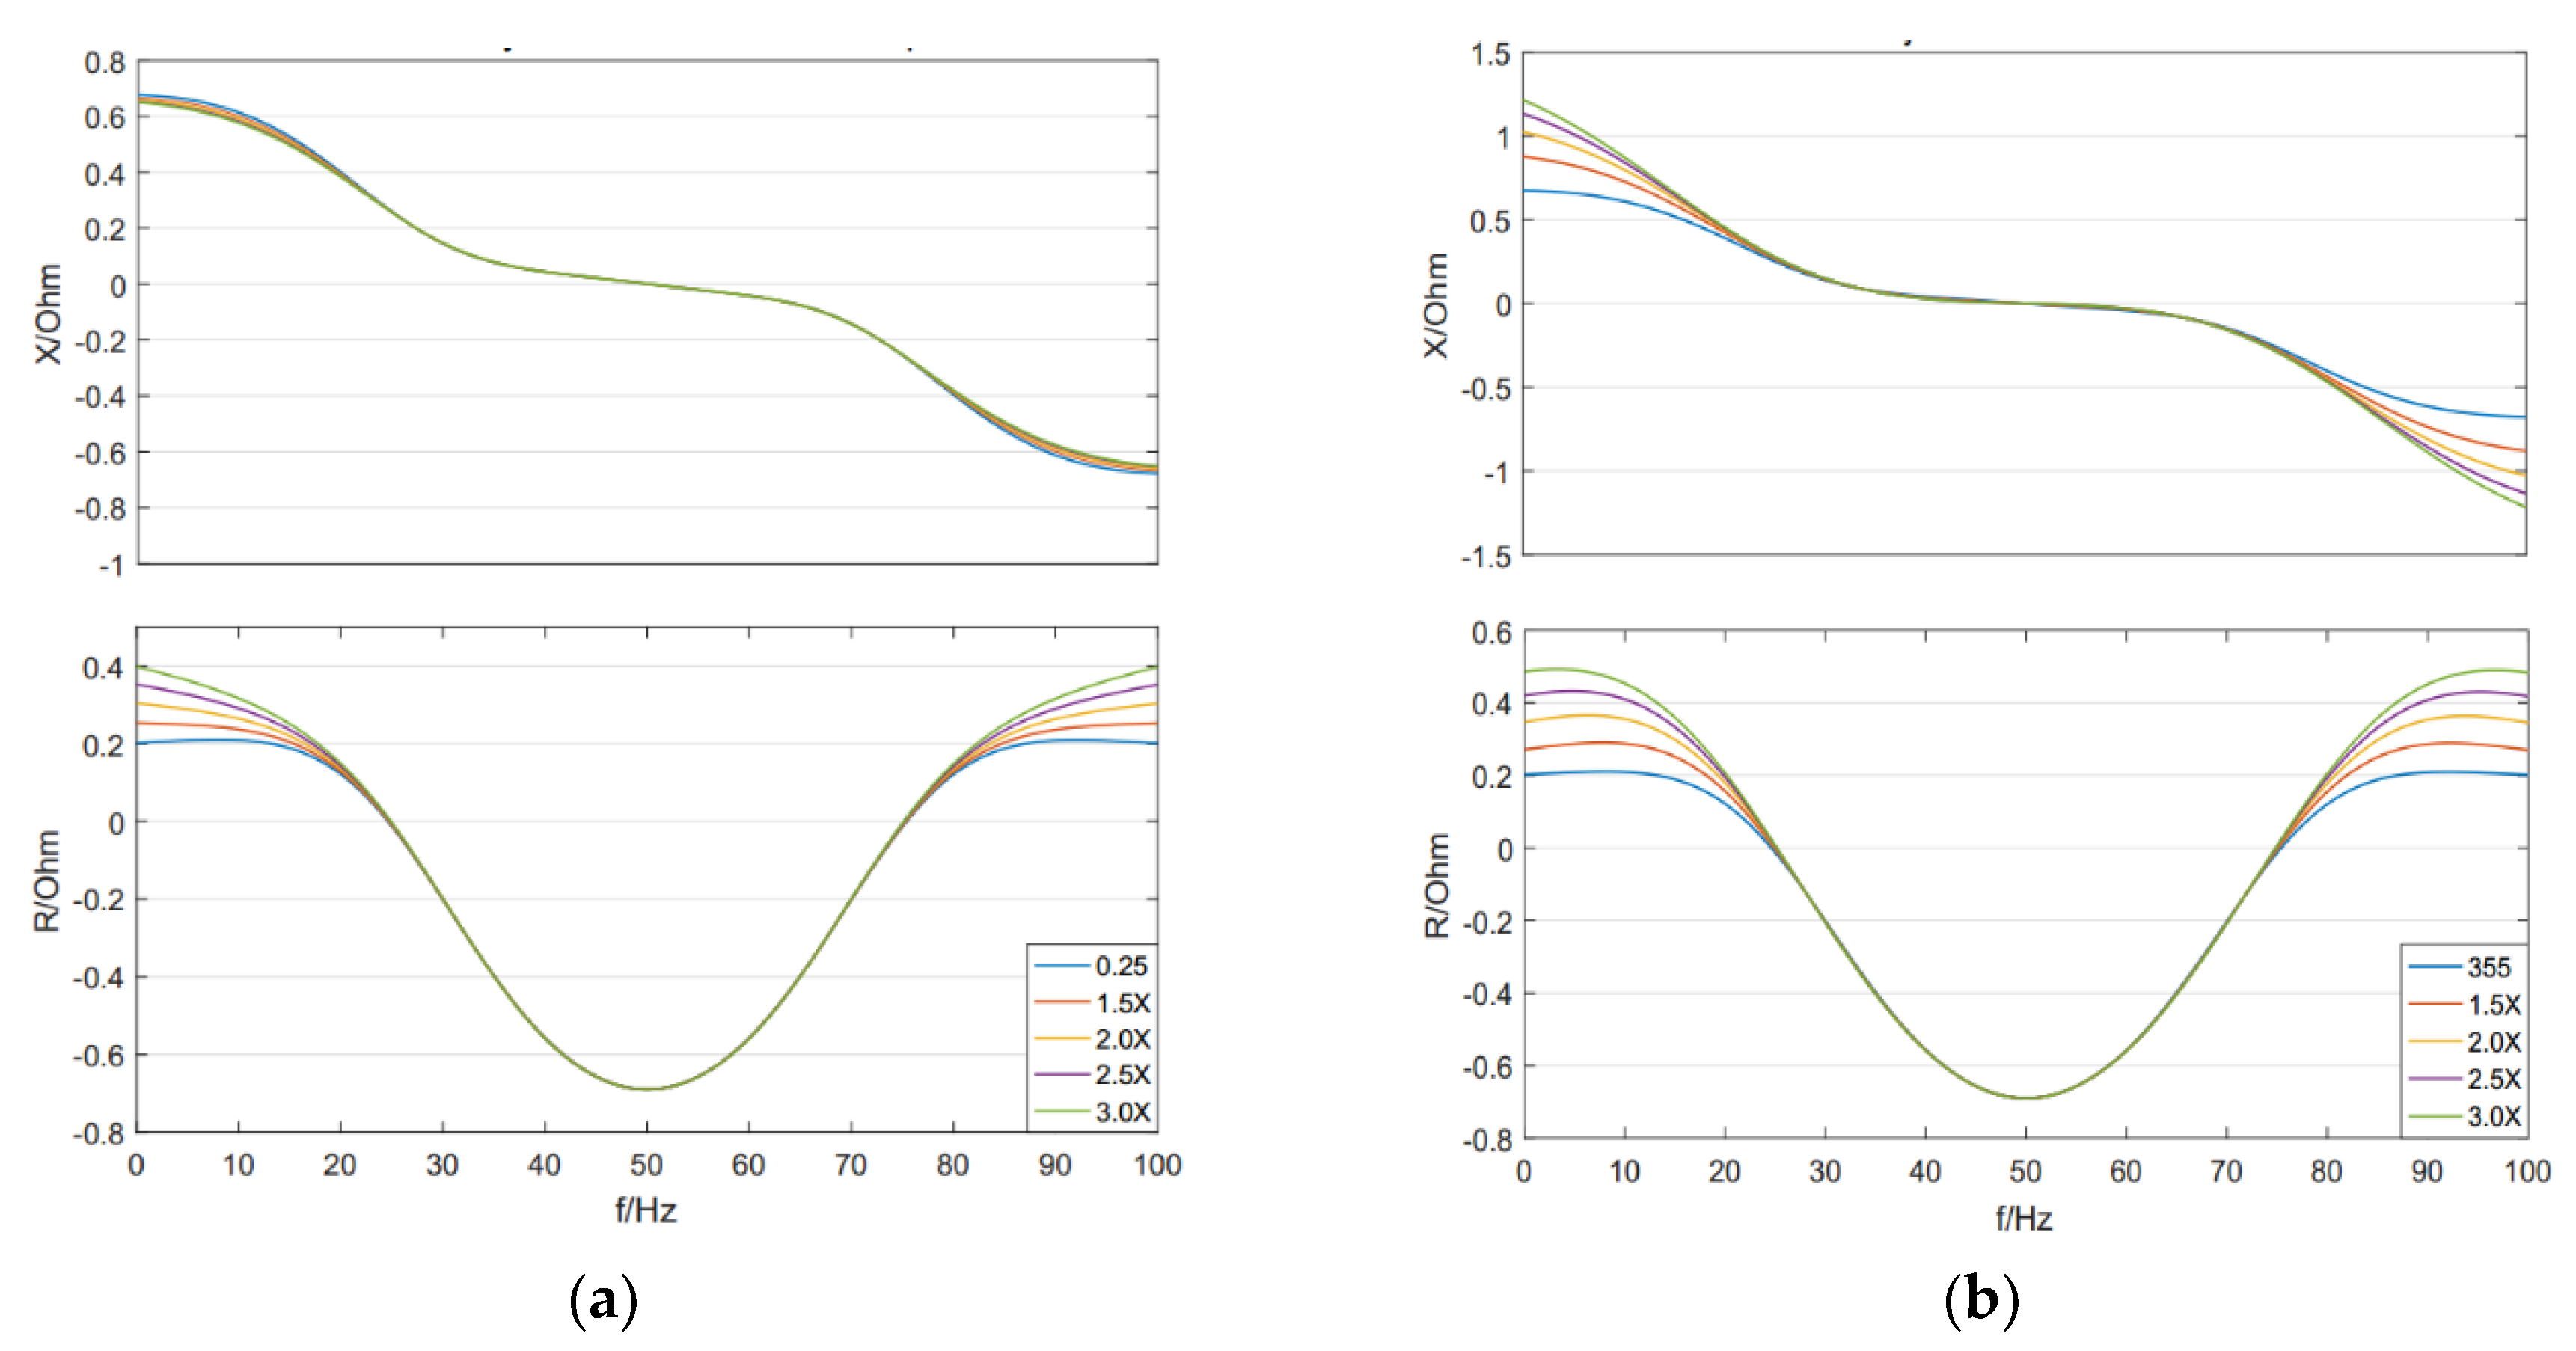
3.1. Impedance Sensitivity Analysis

Based on the correct and effective impedance model, influence of control and circuit parameters can be further discussed. The impedance dynamics effects on SSO stability would be explained, too. It can be inferred from (22) that the impedance characteristics are mainly influenced by initial operating conditions which are decided by power flow, also affected by control parameters of PLL and dq-current controller.

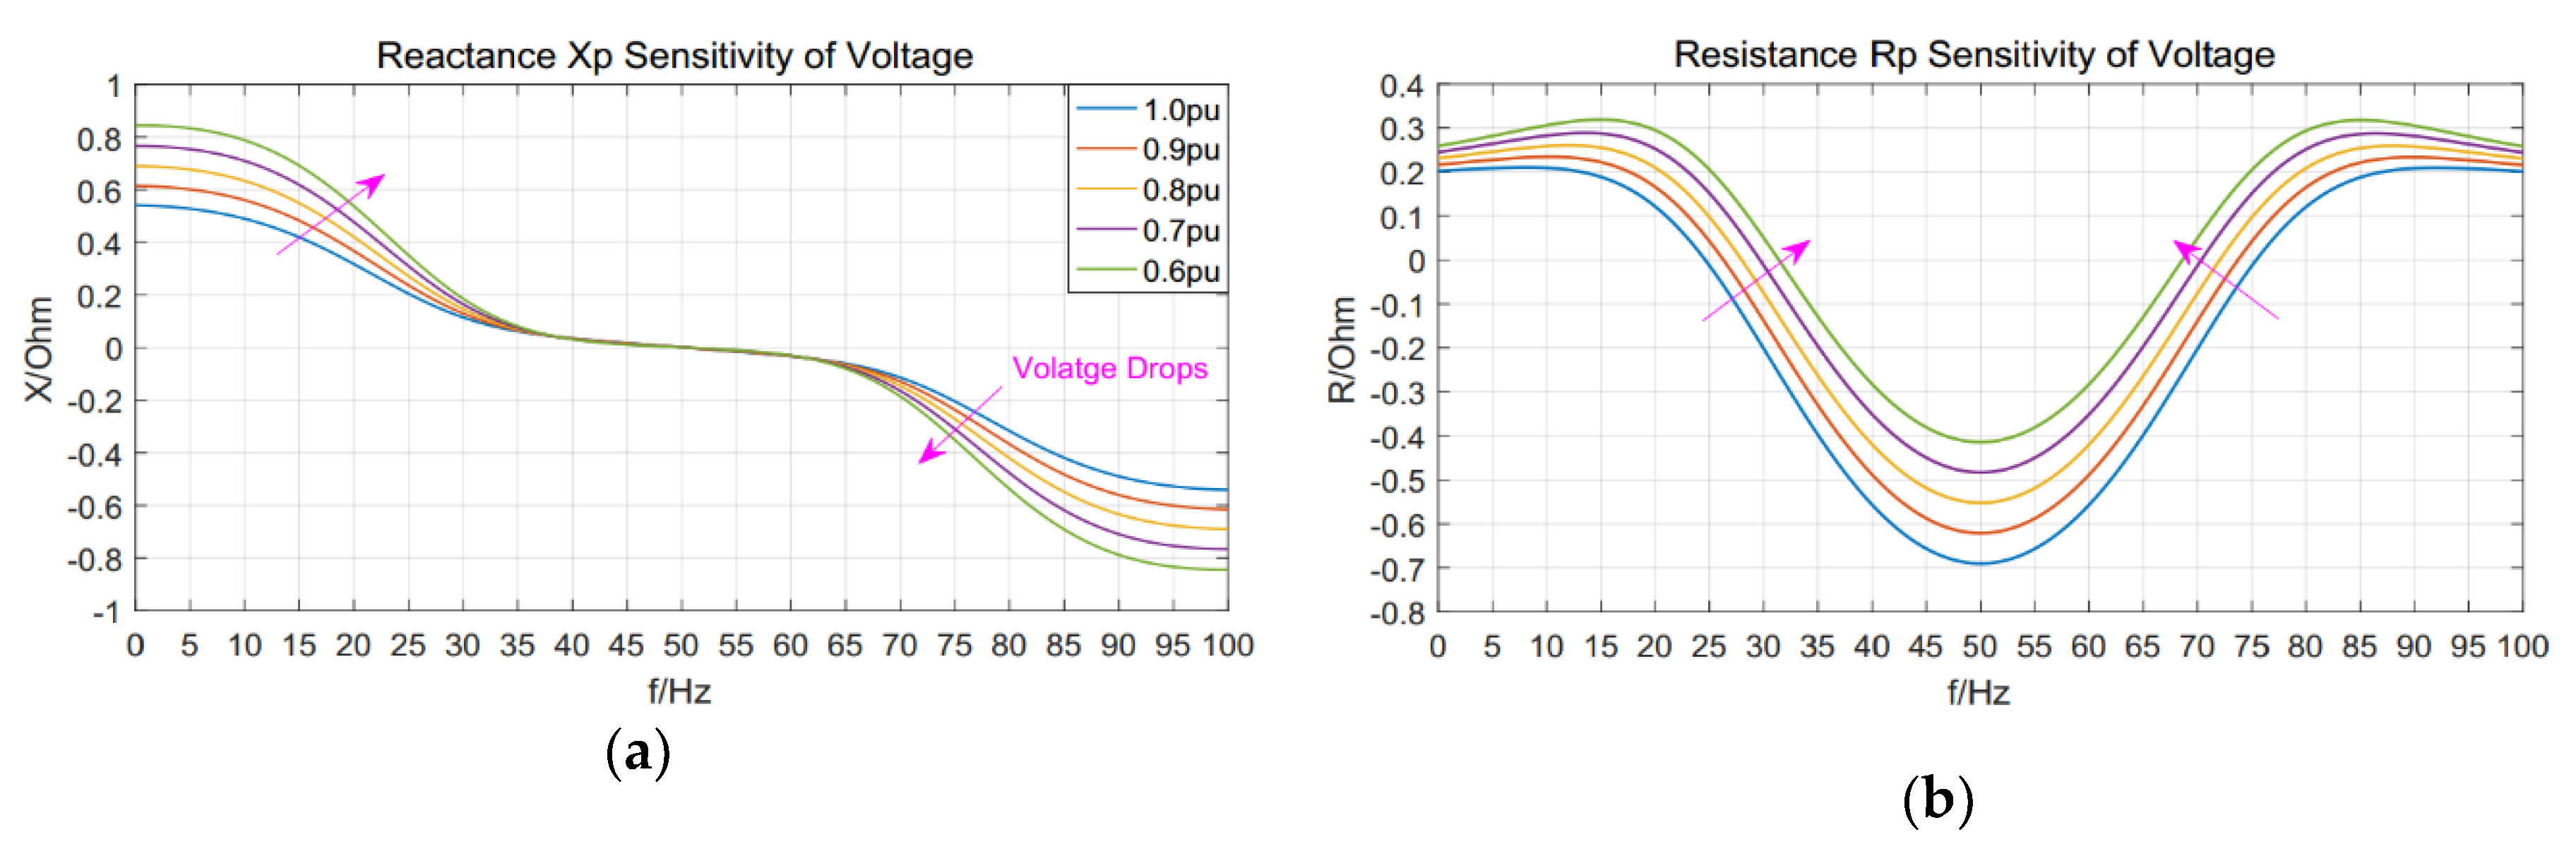
3.1.1. Impedance Sensitivity of Voltage Drops

When the fundamental voltage drops from 1.0 pu (636.4 V) to 0.6 pu while the other parameters in (22) keep the same as Appendix A, the impedance characteristics dynamics is shown in Figure 10. The reactance XPMSG and resistance RPMSG are listed below separately. It can be concluded that the XPMSG changes from inductive to capacitive, crossing zero at 50 Hz. RPMSG are negative around 50 Hz. To be noticed that XPMSG gets larger along with voltage drops lower, while the resistance curve moves to the positive direction. Larger XPMSG means lower resonant frequency but larger RPMSG brings bigger total resistance, which means the influence on stability depends on which one is dominant.

3.2.2. Impedance Sensitivity of Current Drops

Voltage remaining no changed at 1.0 pu, the impedance characteristics dynamics when the current reference Idref drops from 1.0 pu (1847 A) to 0.6 pu is shown in Figure 11. It is worth noting that the output fundamental current equals to Idref under the control strategy. XPMSG gets lager and RPMSG decreases while the output current drops. It can be inferred that this system will be more unstable.

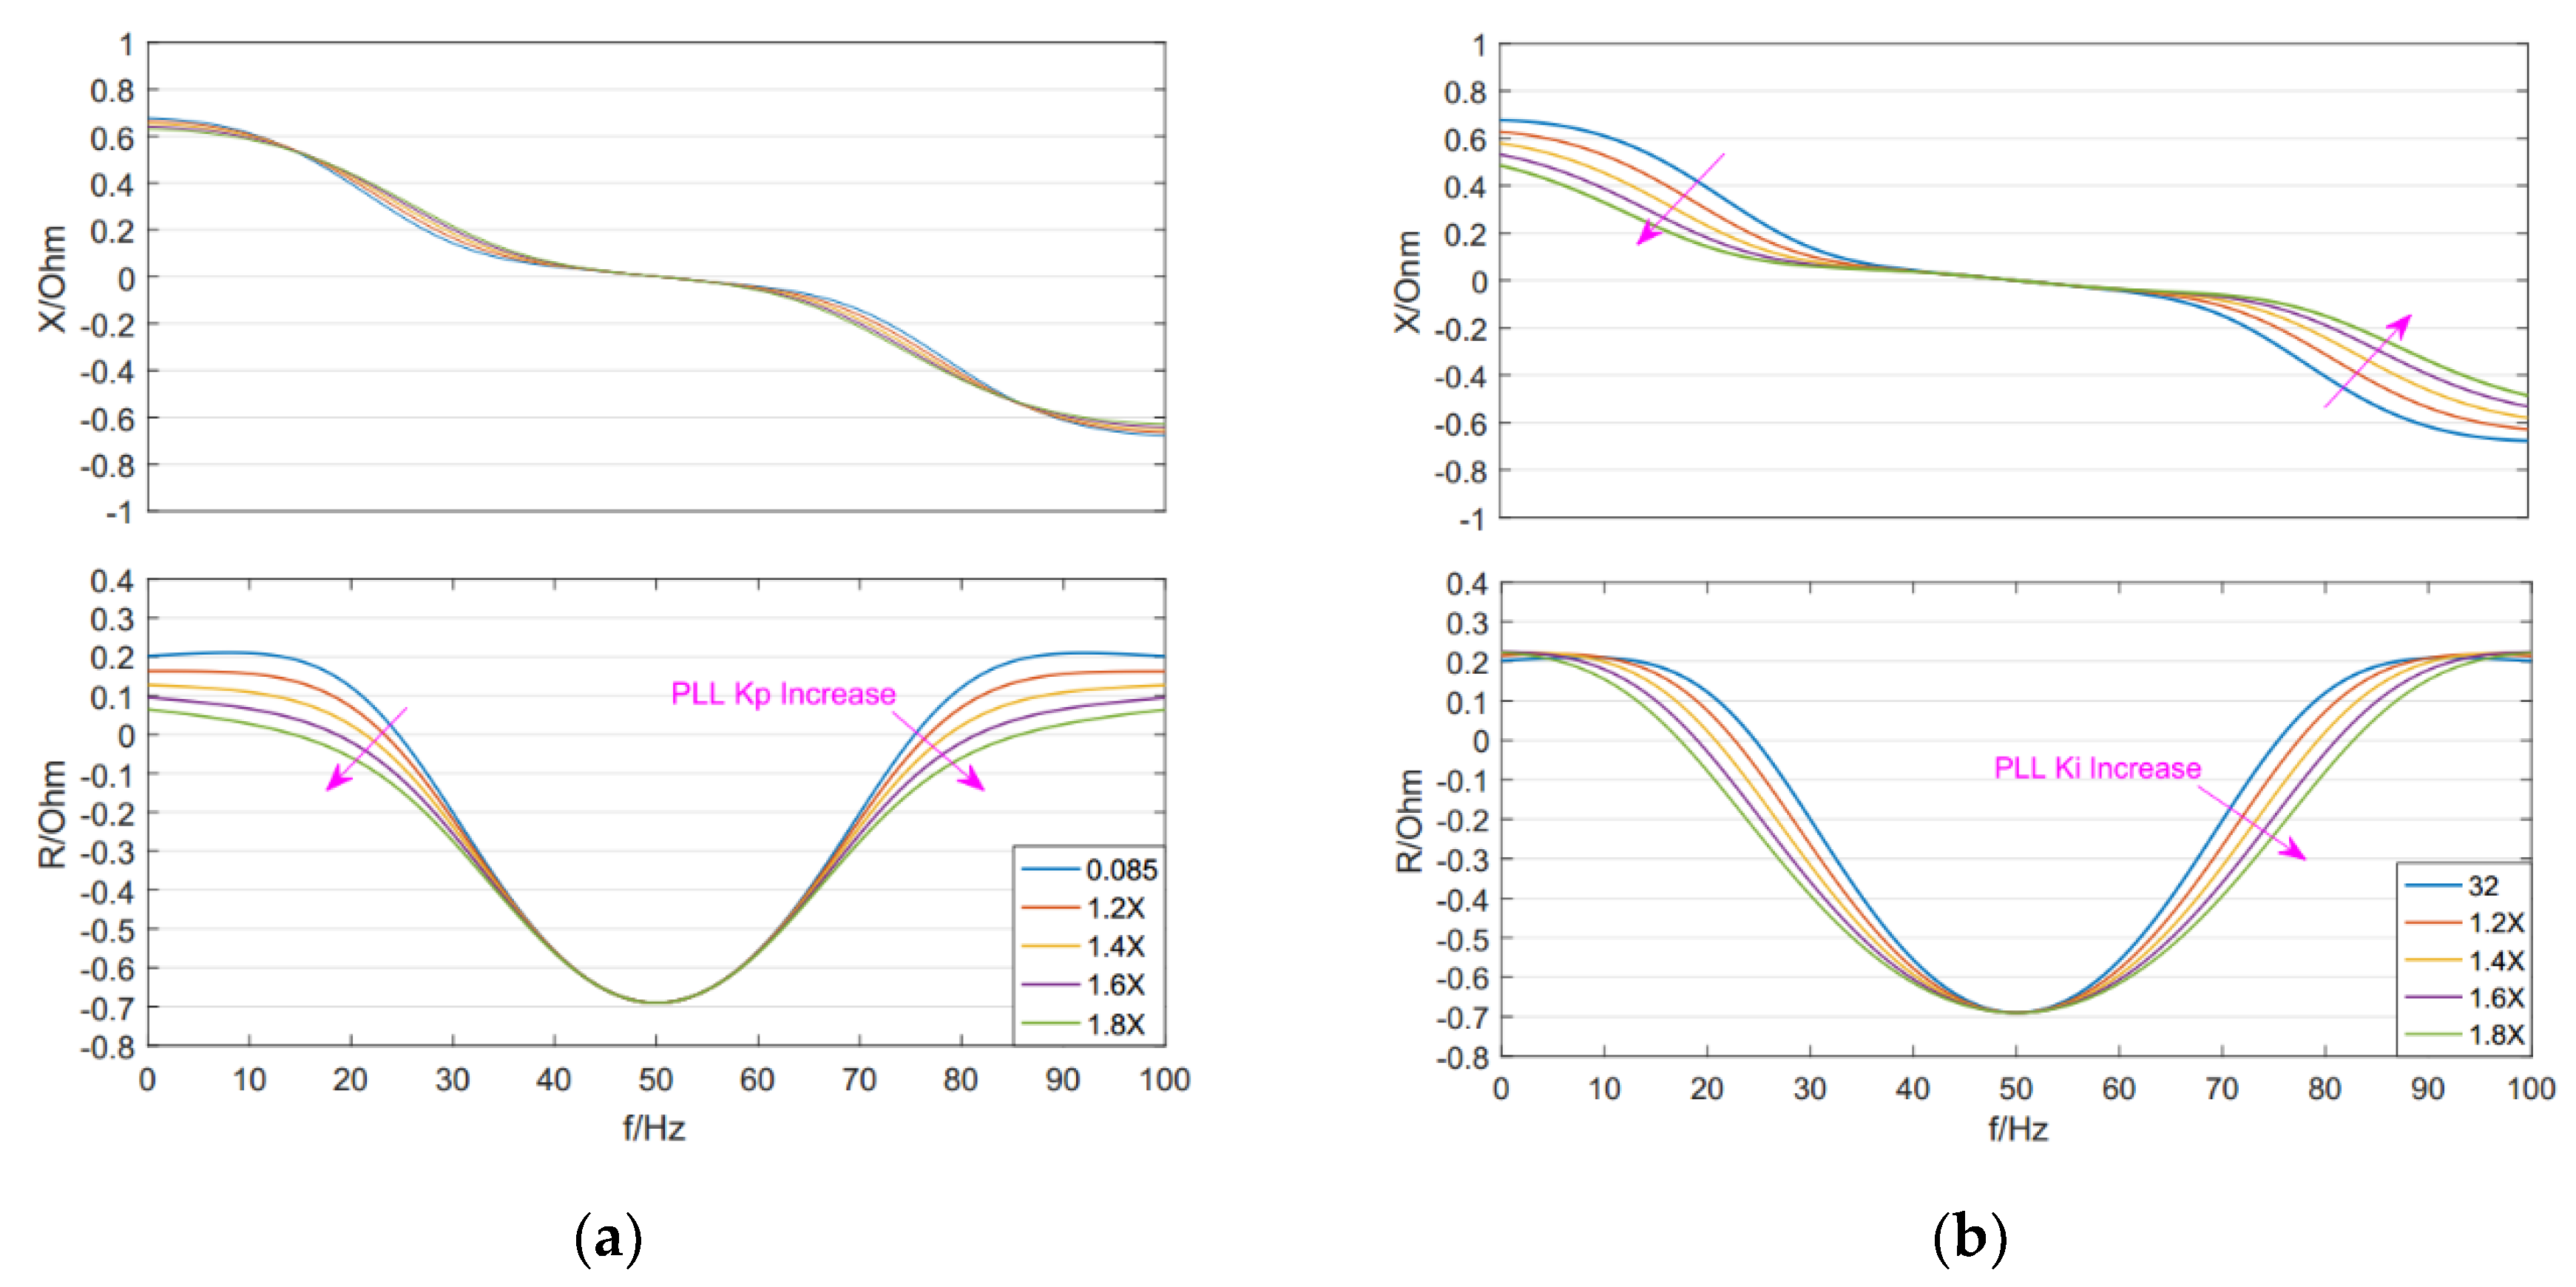
3.3.3. Impedance Sensitivity of PLL Parameters

Both voltage and current reference set at 1.0 pu increase the Kp and Ki and capture the impedance curve dynamics. The results are shown in Figure 12. From (a) we can know that when Kp increases alone, XPMSG curve changes lightly while the equivalent RPMSG curve becomes “wider”, which means the frequency range of negative resistance is larger. Thus, larger Kp is not conducive to system stability. Whereas, the variation of Ki does not have obvious impact on stability.

3.3.4. Impedance Sensitivity of Current Controller Parameters

Similarly, the impedance curve dynamics while increasing the current controller parameters Kpi and Kii are shown in Figure 13. It can be concluded that adjustments of Kpi and Kii hardly affect the stability because the zero crossing frequency of resistance is nearly not changed.

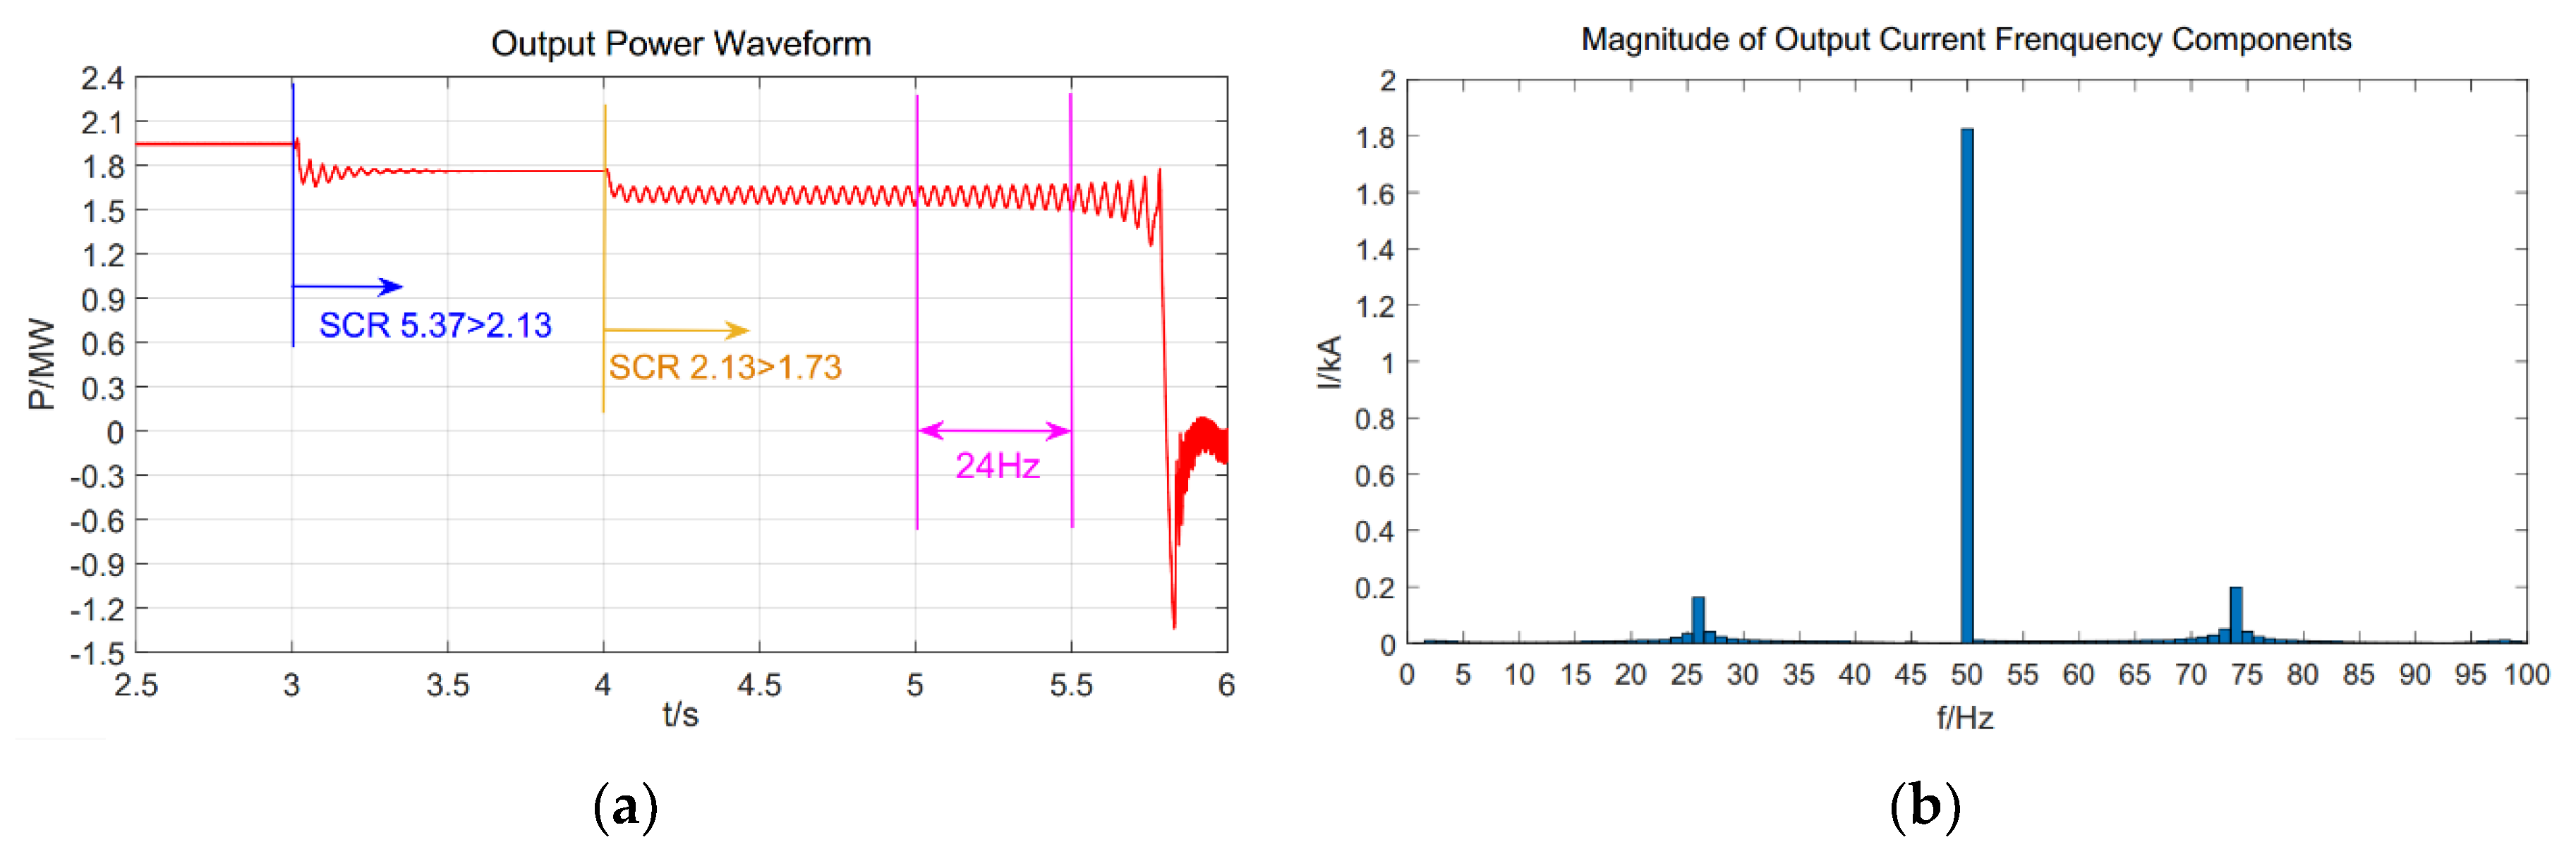
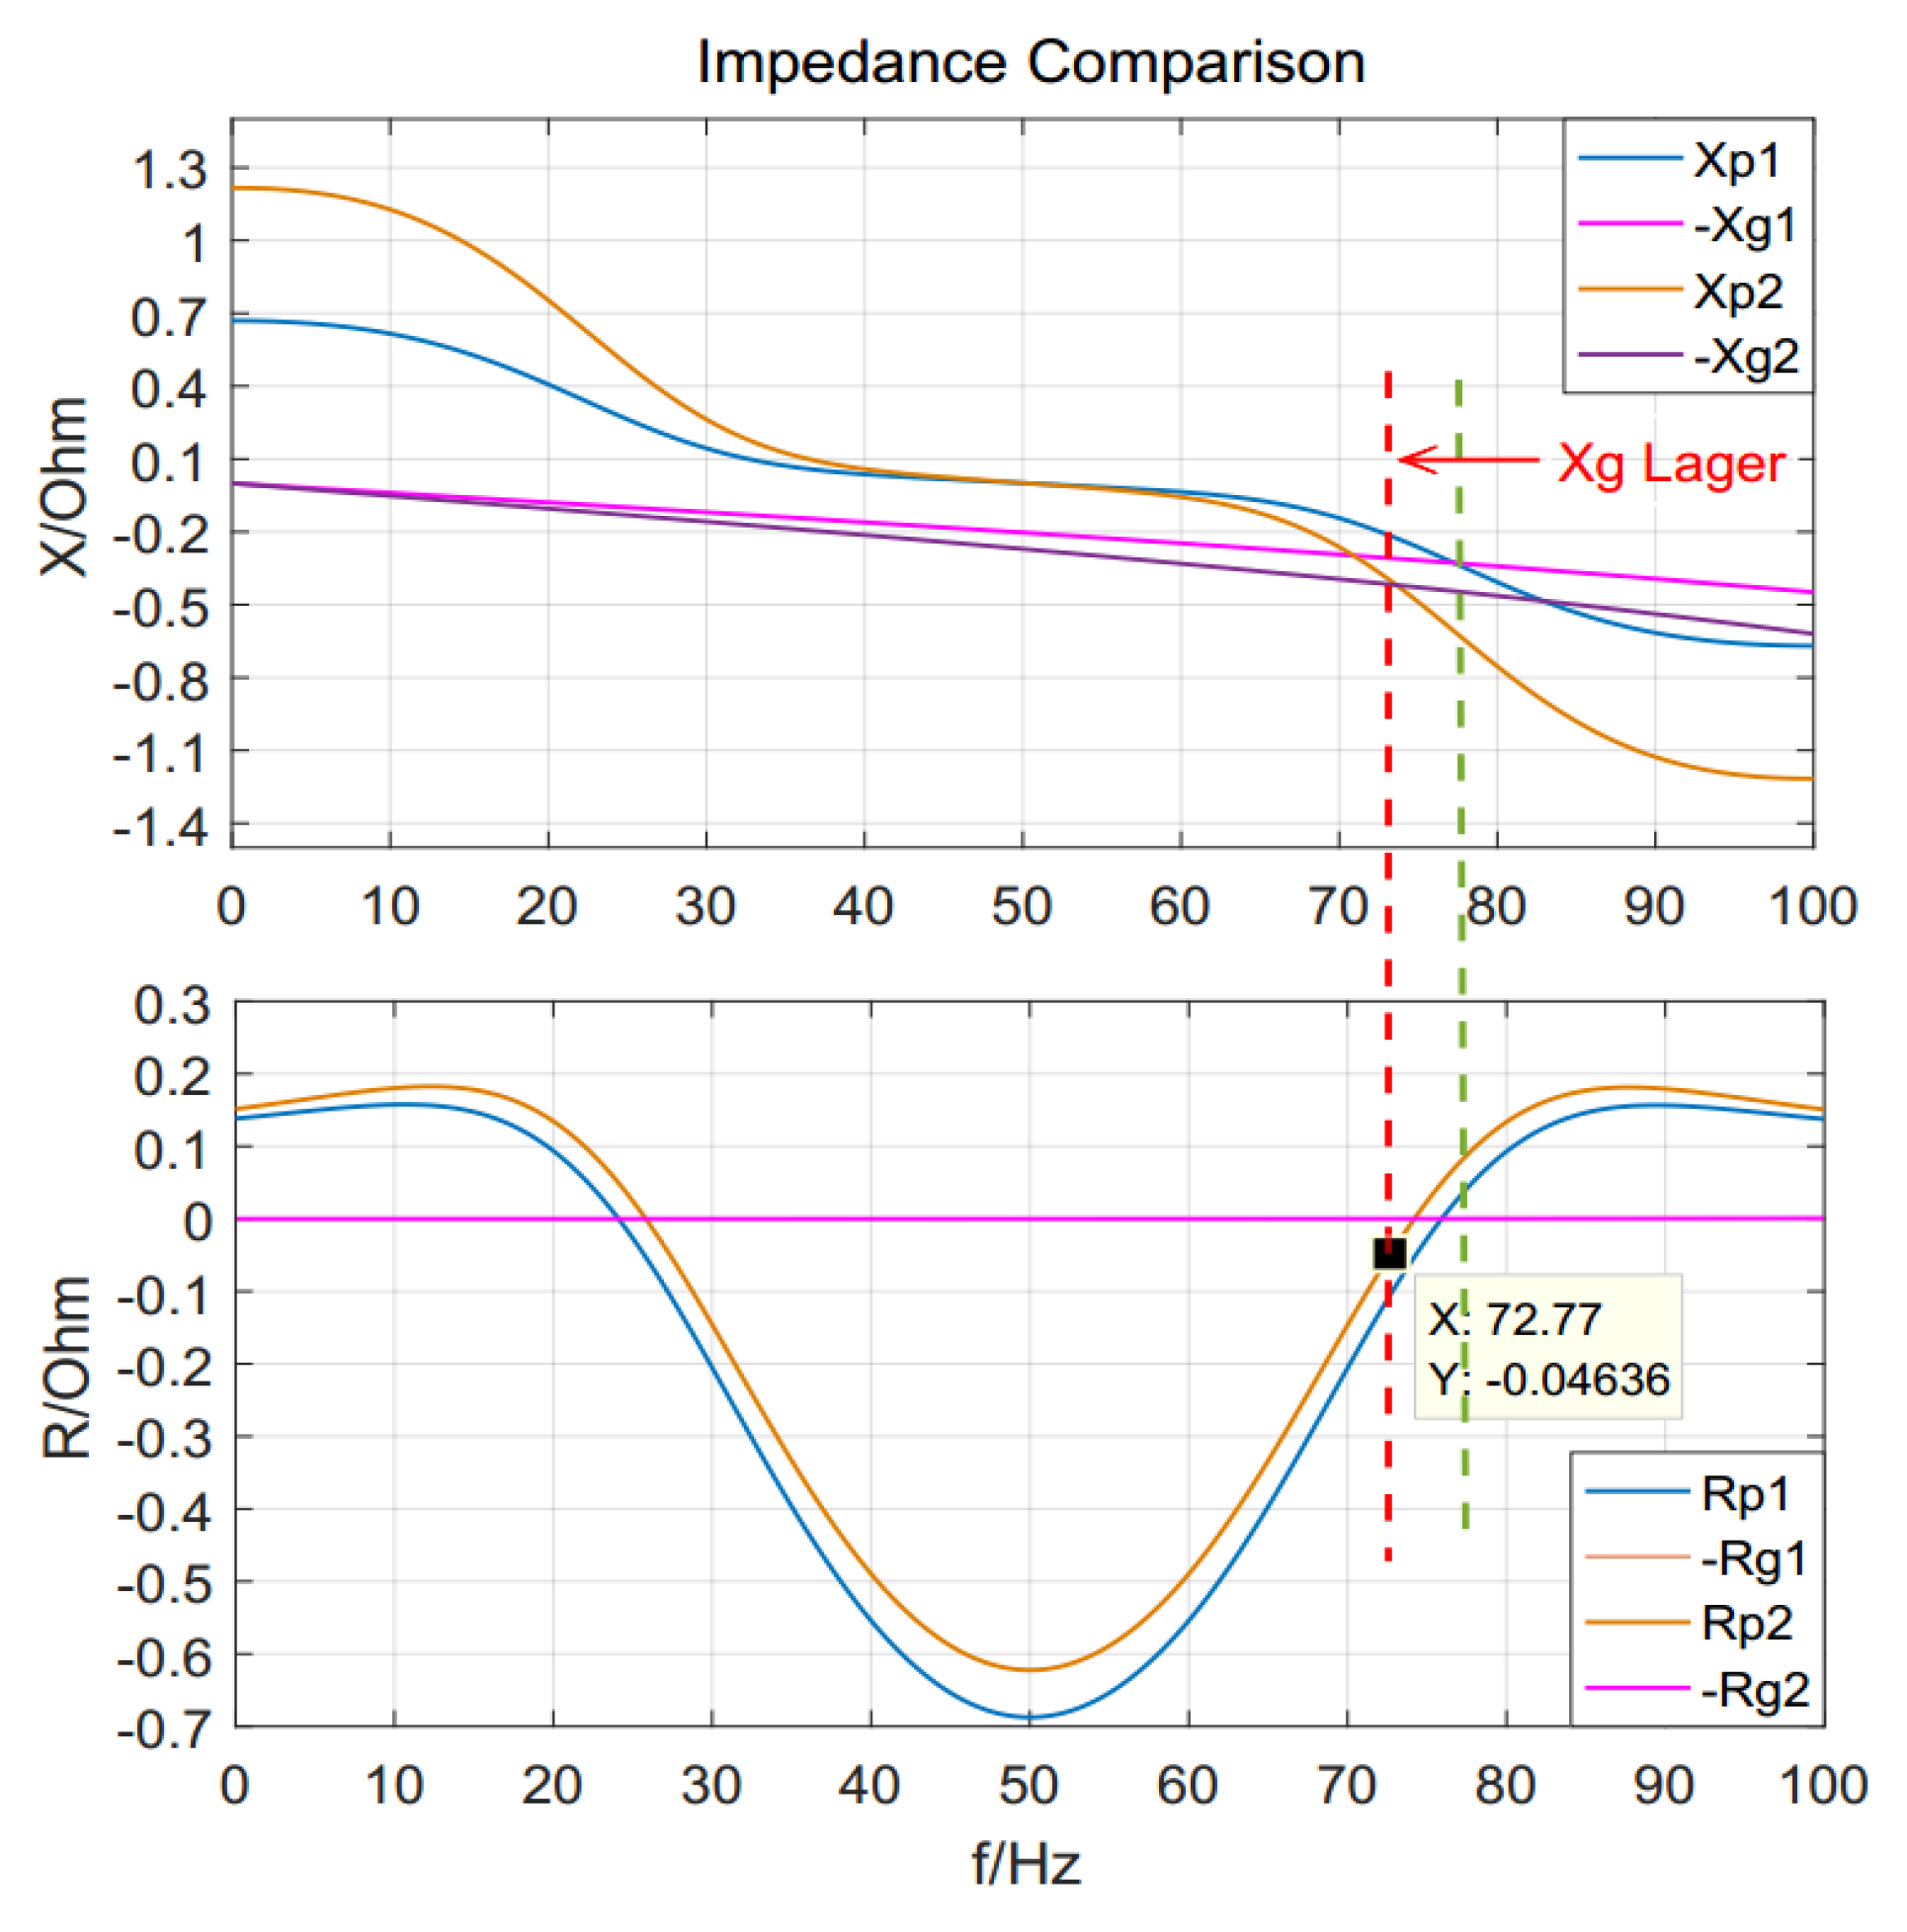
3.2. SSO Simulation and Theoretical Explanation

The structure diagram of the studied system is shown in Figure 14. The converter side parameters are set as Appendix A, the grid side parameters set in simulation are as Table 2. The SCR decreases from 5.37 to 2.13 at 3 s, and decreases to 1.73 at 4 s.
Furthermore, the power waveform and current spectrum analysis are shown in Figure 15. From (a) we can find that the output power of D-PMSG oscillates twice at the SCR changing moments. The first oscillation quickly stabilized, but the second oscillation at 24 Hz gradually diverges until the system crashes. The magnitude of harmonic components at 5.5 s in output current is shown in Figure 15b, the 26/74 Hz sub/supsynchronous currents exist simultaneously.
Theoretical analysis is conducted to explain this simulation result. Since the current reference does not change, from Figure 6 we can know that the voltage at the PCC will drop along while the grid inductance Lg is increasing. So, the output power is also decreasing. Quantitative stability analysis should be done to figure out why the second oscillation is unstable. In these two SCR condition, calculate the power flow, then the total impedance of D-PMSG and grid ZPMSG + ZGRID could be obtained as follows:
Z t o t a l ( s ) = Z P M S G + Z G R I D = R P M S G + R G R I D + j ( X P M S G + X G R I D ) = j ω 1 L s L H i ( s j ω 1 ) H i ( s j ω 1 ) I 1 T p ( s ) e j φ i 1 + V 1 T p ( s ) 1 + ( R f + 1 s C f ) / / ( s L g )
Then, according to the developed RLC circuit-based stability criterion mentioned in the beginning of this section, the system will be unstable if:
R t o t a l ( f r ) < 0 ,   w h e n   X t o t a l ( f r ) = 0
This criterion is easier to implement by plotting them in the same figure and the direction of Rtotal at the resonant frequency is obviously to see. The analysis shown in Figure 16 gives the impedance comparison of D-PMSG and grid when SCR = 2.13 and 1.73.
The green vertical line indicates that the total resistance at the resonant frequency is positive when SCR = 2.13, which means this system is stable. This is consistent with the power waveform after 3 s in Figure 15a.
When SCR decreases to 1.73, the total resistance at the resonant frequency 72.77 Hz is −0.04, and this system is judged unstable under this operating condition. The fp supsynchronous oscillation current will be captured by the GSC controller and introduces a (2f1fp) subsynchronous current in return, as discussed before, about 27 Hz and 73 Hz, respectively. Moreover, the power will oscillate at a frequency of 23 Hz (|fpf1|), which is very close to the simulation results after 4 s, considering the calculating and modeling errors. It can be concluded that the mechanism of SSO when SCR decreases is theoretically revealed.

4. Discussion

This paper focus on the modeling and analysis of sub/supsynchronous oscillation in D-PMSG based wind farm integrated to a weak AC grid. The small-signal harmonic linearization method is utilized to develop the positive sequence of the GSC. In this main step, the dynamics of PLL under harmonic voltage perturbation is analyzed. Moreover, the mechanism of sub/supsynchronous currents frequency coupling is revealed quantitatively. Based on the impedance model, the influence of converter parameters is further discussed. Finally, the influence of the SCR of AC system on SSO is well explained by impedance-based stability analysis. Simulation experiments are carried out to verify these theoretical discussions. Following conclusions can be made:
  • The D-PMSG’s equivalent inductance XPMSG is positive at subsynchronous frequency while negative (capacitive) at supsynchronous frequency, which means the resonance between D-PMSG and weak grid occurs at the supsynchronous frequency. The relationship of coupled sub/supsynchronous currents could be quantitatively calculated.
  • The D-PMSG’s impedance is sensitive to the PCC voltage and output current, which are decided by power flow. Further proof that when the output current is relatively small as a result of low wind speed, it is very likely to observe oscillations in this system. The influence of control parameters is also discussed. No obvious impact of current controller is found.
  • A simulation experiment was conducted to study the mechanism of SSO when SCR decreases. Both simulation results and theoretical analysis proved that when the grid side impedance increases, the grid-connected D-PMSG system will be more unstable.
Future work based on the work in this paper will discuss the following several issues: The first issue is about how to obtain the reduced-order equivalent model of wind farm which contains hundreds of wind turbine generators. The second issue focus on oscillation suppression, proposing advice related to parameters adjustment or additional damping control strategy. The last issue will discuss the interaction with synchronous generator, further analyzing the accident in Xinjiang, China.

Author Contributions

Methodology, S.Y.; software, S.Y. and X.Y.; validation, J.S., T.Z., and S.Y.; writing—original draft preparation, S.Y.; writing—review and editing, X.Y. and T.Z.; funding acquisition, Z.H. and J.S.

Funding

This research was supported by China Huaneng Group Co., Ltd. Headquarters Technology Project: Research on Subsynchronous Oscillation Mechanism and Suppression Measures of Grid-connected Wind Farm (HNKJ18-H34) and Shaanxi Provincial Key Research and Development Program (2019ZDLGY18-04).

Conflicts of Interest

The authors declare no conflict of interest.

Appendix A

The PSCAD-EMTDC simulation experimental parameters setup in this paper are as following:
Fundamental frequency: f1 = 50 Hz; dc bus voltage: Vdc = 1300 V; dq current controller parameters: Hi(s) = (Kpi + Kii/s) where Kpi = 0.25 and Kii = 355; PLL parameters: Hpll(s) = (Kp + Ki/s)/s where Kp = 0.085 and Ki = 32; current reference: Idref = 1847, Iqref = 0; converter circuit parameters: L = 0.15 mH.

References

  1. Jiao, R.; Huang, X.; Ma, X.; Han, L.; Tian, W. A model combining stacked auto encoder and back propagation algorithm for short-term wind power forecasting. IEEE Access 2018, 6, 17851–17858. [Google Scholar] [CrossRef]
  2. Wu, X.; Ning, W.; Yin, T.; Yang, X.; Tang, Z. Robust design method for the SSDC of a DFIG based on the practical small-signal stability region considering multiple uncertainties. IEEE Access 2018, 6, 16696–16703. [Google Scholar] [CrossRef]
  3. Kunjumuhammed, L.; Pal, B.C.; Gupta, R.; Dyke, K.J. Stability analysis of a PMSG-based large offshore wind farm connected to a VSC-HVDC. IEEE Trans. Energy Convers. 2017, 32, 1166–1176. [Google Scholar] [CrossRef]
  4. Fan, L.; Miao, Z. Mitigating SSR using DFIG-based wind generation. IEEE Trans. Sustain. Energy 2012, 3, 349–358. [Google Scholar] [CrossRef]
  5. Liu, H.K.; Xie, X.; Zhang, C.; Li, Y.; Liu, H.; Hu, Y. Quantitative SSR analysis of series-compensated DFIG-based wind farms using aggregated RLC circuit model. IEEE Trans. Power Syst. 2017, 32, 474–483. [Google Scholar] [CrossRef]
  6. IEEE Committee Report. Reader’s guide to subsynchronous resonance. IEEE Trans. Power Syst. 1992, 7, 150–157. [Google Scholar] [CrossRef]
  7. Irwin, G.; Jindal, A.; Isaacs, A. Subsynchronous control interactions between type 3 wind turbines and series compensated AC transmission systems. In Proceedings of the 2011 IEEE Power and Energy Society General Meeting, San Diego, CA, USA, 24–29 July 2011; IEEE: Detroit, MI, USA, 2017; pp. 1–6. [Google Scholar]
  8. Badrzadeh, B.; Sahni, M.; Zhou, Y.; Muthumuni, D.; Gole, A. General Methodology for Analysis of Sub-Synchronous Interaction in Wind Power Plants. IEEE Trans. Power Syst. 2013, 28, 1858–1869. [Google Scholar] [CrossRef]
  9. Huang, Y.; Yuan, X.; Hu, J. Effect of reactive power control on stability of DC-link voltage control in VSC connected to weak grid. In Proceedings of the 2014 IEEE PES General Meeting, National Harbor, MD, USA, 27–31 July 2014; pp. 1–5. [Google Scholar]
  10. Liu, Z.; Liu, B.; Duan, S.; Kang, Y. A novel DC capacitor voltage balance control method for cascade multilevel STATCOM. IEEE Trans. Power Electron. 2012, 27, 14–27. [Google Scholar] [CrossRef]
  11. Cheng, Y.; Sahni, M.; Muthumuni, D.; Badrzadeh, B. Reactance scan crossover-based approach for investigating SSCI concerns for DFIG-based wind turbines. IEEE Trans. Power Deliv. 2013, 28, 742–751. [Google Scholar] [CrossRef]
  12. Liu, H.; Xie, X.; He, J.; Xu, T.; Yu, Z.; Wang, C. Subsynchronous interaction between direct-drive PMSG based wind farms and weak AC networks. IEEE Trans. Power Syst. 2017, 32, 4708–4720. [Google Scholar] [CrossRef]
  13. Liu, H.; Xie, X.; Liu, W. An oscillatory stability criterion based on the unified dq-frame impedance network model for power systems with high-penetration renewables. IEEE Trans. Power Syst. 2018, 33, 3472–3485. [Google Scholar] [CrossRef]
  14. Jian, S. AC power electronic systems: Stability and power quality. In Proceedings of the 2008 11th Workshop on Control and Modeling for Power Electronics, Zurich, Switzerland, 17–20 August 2008. [Google Scholar]
  15. Jian, S. Small-signal methods for ac distributed power systems—A Review. IEEE Trans. Power Electron. 2009, 24, 2545–2554. [Google Scholar] [CrossRef]
  16. Jian, S.; Bing, Z.; Karimi, K.J. Input impedance modeling of multi-pulse rectifiers by harmonic linearization. IEEE Trans. Power Electron. 2009, 24, 2812–2820. [Google Scholar] [CrossRef]
  17. Rygg, A.; Molinas, M.; Zhang, C.; Cai, X. A modified sequence-domain impedance definition and its equivalence to the dq-domain impedance definition for the stability analysis of ac power electronic systems. IEEE J. Emerg. Sel. Top. Power Electron. 2016, 4, 1383–1396. [Google Scholar] [CrossRef]
  18. Xie, X.; Liu, H.K.; He, J.; Zhang, C.; Qiao, Y. Mechanism and Characteristics of Subsynchronous Oscillation Caused by the Interaction between Full-converter Wind Turbines and AC Systems. Proc. CSEE 2016, 36, 2366–2372. (In Chinese) [Google Scholar]
  19. Cesp, M.; Jian, S. Impedance Modeling and Analysis of Grid-Connected Voltage-Source Converters. IEEE Trans. Power Electron. 2014, 29, 1254–1261. [Google Scholar]
  20. Wang, Y.; Chen, X.; Chen, J.; Gong, C. Analysis of Positive-sequence and Negative-sequence Impedance Modeling of Three-phase LCL-type Grid-connected Inverters Based on Harmonic Linearization. Proc. CSEE 2016, 36, 5890–5898. (In Chinese) [Google Scholar]
  21. Zhang, C.; Wang, W.S.; He, G.; Li, G.; Wang, H.; Tian, Y.Y. Analysis of Sub-Synchronous Oscillation of Full-converter Wind Farm Based on Sequence Impedance and An Optimized Design Method for PLL Parameters. Proc. CSEE 2017, 37, 6757–6767. (In Chinese) [Google Scholar]
  22. Zhang, M.Y.; Xiao, S.W.; Tian, T.; Zhang, H.H.; Bi, T.S.; Liang, F.B. Analysis of SSO Influencing Factors and Parameter Adjustment for Grid-Connected Full-Converter Wind Farm Based on Impedance Sensitivity. Power Syst. Technol. 2018, 42, 2768–2777. (In Chinese) [Google Scholar]
  23. Wen, B.; Boroyevich, D.; Burgos, R.; Mattavelli, P.; Shen, Z. Analysis of d-q small-signal impedance of grid-tied inverters. IEEE Trans. Power Electron. 2015, 31, 675–687. [Google Scholar] [CrossRef]
  24. Shah, S.; Parsa, L. Impedance Modeling of Three-Phase Voltage Source Converters in DQ, Sequence, and Phasor Domains. IEEE Trans. Energy Convers. 2017, 32, 1139–1150. [Google Scholar] [CrossRef]
  25. Vieto, I.; Du, X.; Nian, H.; Jian, S. Frequency-domain coupling in two-level VSC small-signal dynamics. In Proceedings of the 2017 IEEE 18th Workshop on Control and Modeling for Power Electronics (COMPEL), Stanford, CA, USA, 9–12 July 2017. [Google Scholar]
  26. Zhao, M.Q.; Yuan, X.M.; Hu, J.B.; Yan, Y.B. Voltage dynamics of current control time-scale in a VSC-connected weak grid. IEEE Trans. Power Syst. 2016, 31, 2925–2937. [Google Scholar] [CrossRef]
  27. Xin, H.; Dong, W.; Yuan, X.M. Generalized short circuit ratio for multi power electronic based devices infeed to power systems. Proc. CSEE 2016, 36, 6013–6027. (In Chinese) [Google Scholar]
Figure 1. Structure diagram of D-PMSGs integrated in a weak AC grid.
Applsci 09 02831 g001
Figure 2. Schematic diagram of D-PMSG.
Applsci 09 02831 g002
Figure 3. Circuit and control of grid-connected D-PMSG.
Applsci 09 02831 g003
Figure 4. Block diagram of PLL.
Applsci 09 02831 g004
Figure 5. Frequency response of cosine of PLL angle to perturbation in phase a voltage. (a) Magnitude comparison; (b) Phase comparison. Solid lines: model prediction; Marking points: simulation results.
Applsci 09 02831 g005
Figure 6. Phasor analysis of VSC ac side voltage.
Applsci 09 02831 g006
Figure 7. Voltage tracking verification of D-PMSG’s grid side converter (GSC).
Applsci 09 02831 g007
Figure 8. Frequency response of grid-connected D-PMSG’s impedance. (a) Magnitude comparison; (b) Phase comparison. Solid lines: model prediction; Marking points: simulation results.
Applsci 09 02831 g008
Figure 9. Frequency components in output currents. (a) Magnitude; (b) Phase.
Applsci 09 02831 g009
Figure 10. Impedance sensitivity of voltage (Drops). (a) Reactance XPMSG; (b) Resistance RPMSG.
Applsci 09 02831 g010
Figure 11. Impedance sensitivity of current (Drops). (a) Reactance XPMSG; (b) Resistance RPMSG.
Applsci 09 02831 g011
Figure 12. Impedance sensitivity of PLL parameters (Increase). (a) Sensitivity of PLL proportional constant Kp; (b) Sensitivity of PLL integral constant Ki.
Applsci 09 02831 g012
Figure 13. Impedance sensitivity of current controller parameters (Increase). (a) Sensitivity of proportional constant Kpi in Hi(s); (b) Sensitivity of integral constant Kii in Hi(s).
Applsci 09 02831 g013
Figure 14. Diagram of subsynchronous oscillation (SSO) studied simulation system.
Applsci 09 02831 g014
Figure 15. Power waveform and current spectrum analysis of SSO. (a) Output power oscillation frequency; (b) Harmonic current components at 5.5 s.
Applsci 09 02831 g015
Figure 16. Impedance comparison of ZPMSG and ZGrid.
Applsci 09 02831 g016
Table 1. Frequency components in dq-domain current.
Ia [f], Ib [f], Ic [f]T(θ1)Id[f], Iq[f]
f1fpf1− fp
2f1 − fpfp − f1
fpf1fp − f1
2f1− fpf1f1− fp
Table 2. Grid side impedance parameters.
SymbolItemValue
VsSystem Voltage0.82 kV (L-L, RMS)
LgLg1: Before 3 s0.2 mH
Lg2: 3~4 s0.495 mH
Lg3: After 4 s0.62 mH
RfFilter resistance0.02 Ω
CfFilter capacitance500 μF

