A Case of Specificity: How Does the Acoustic Voice Quality Index Perform in Normophonic Subjects?

 ,
,
Abstract
1. Introduction
2. Materials and Methods
2.1. Participants
2.2. Voice Recordings
2.3. Overall Dysphonia Ratings
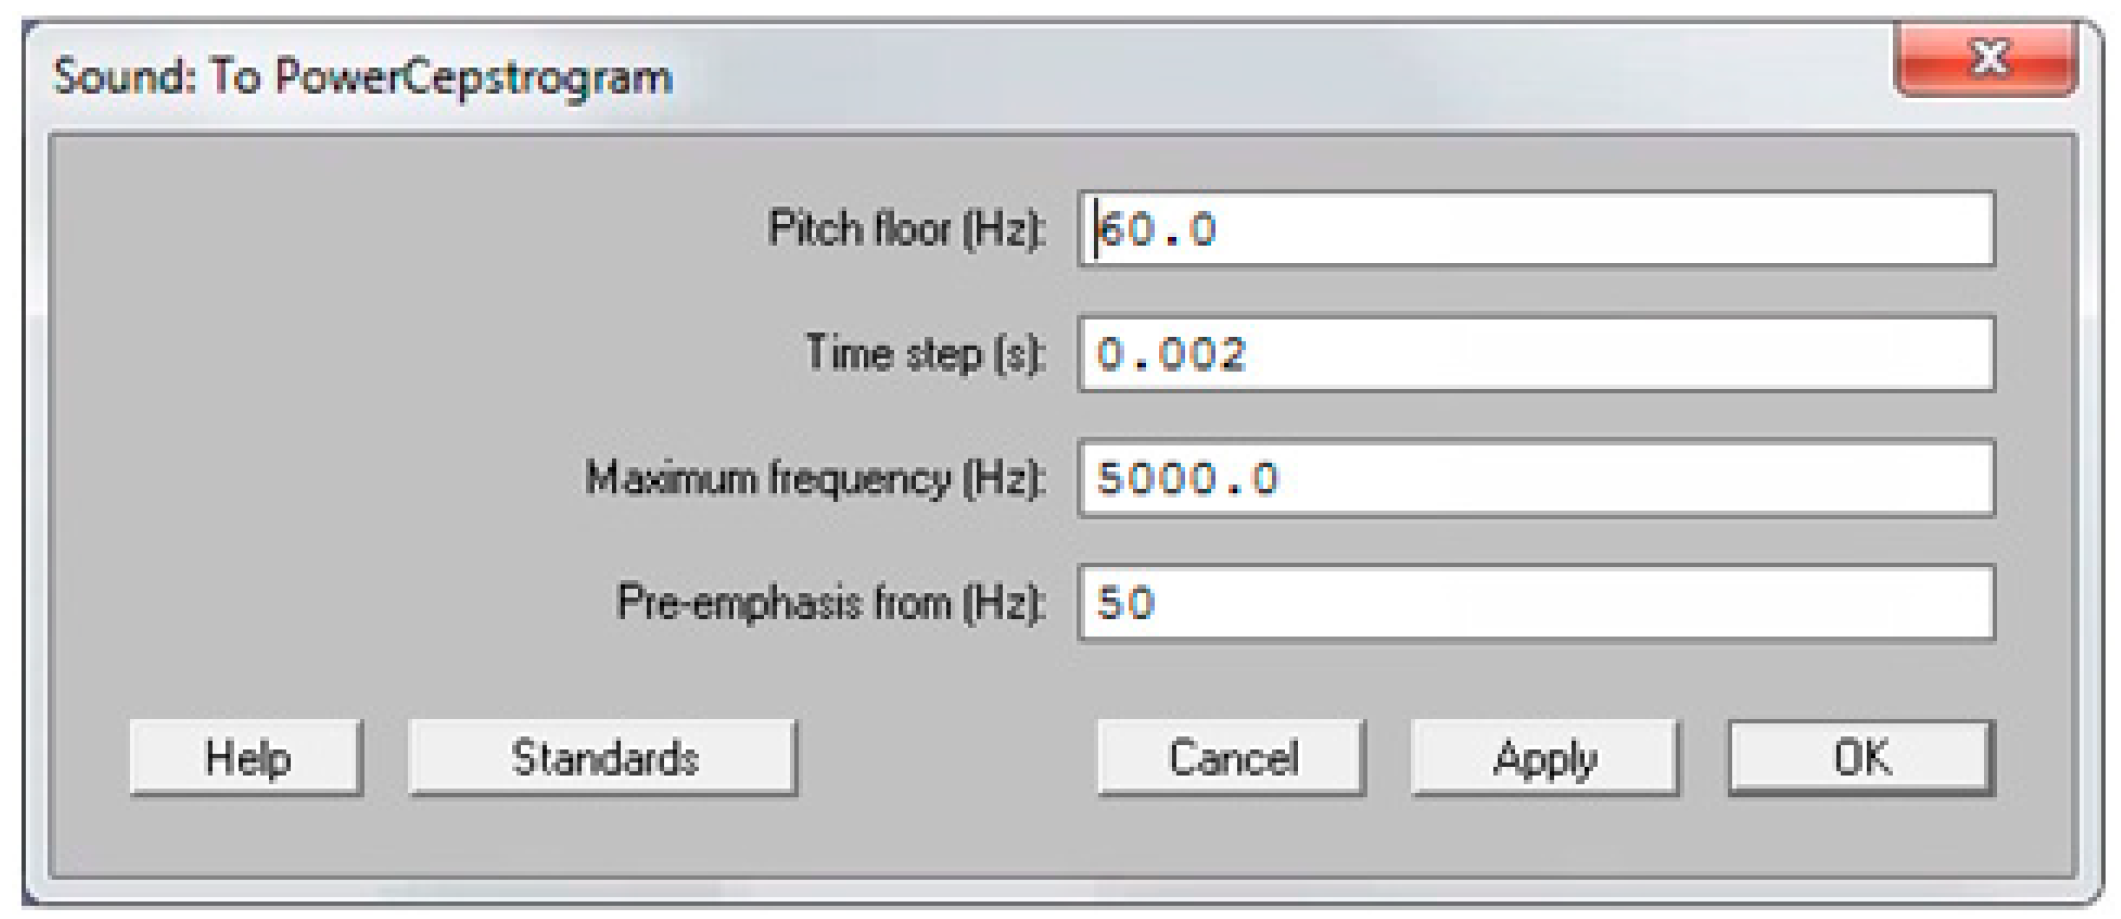
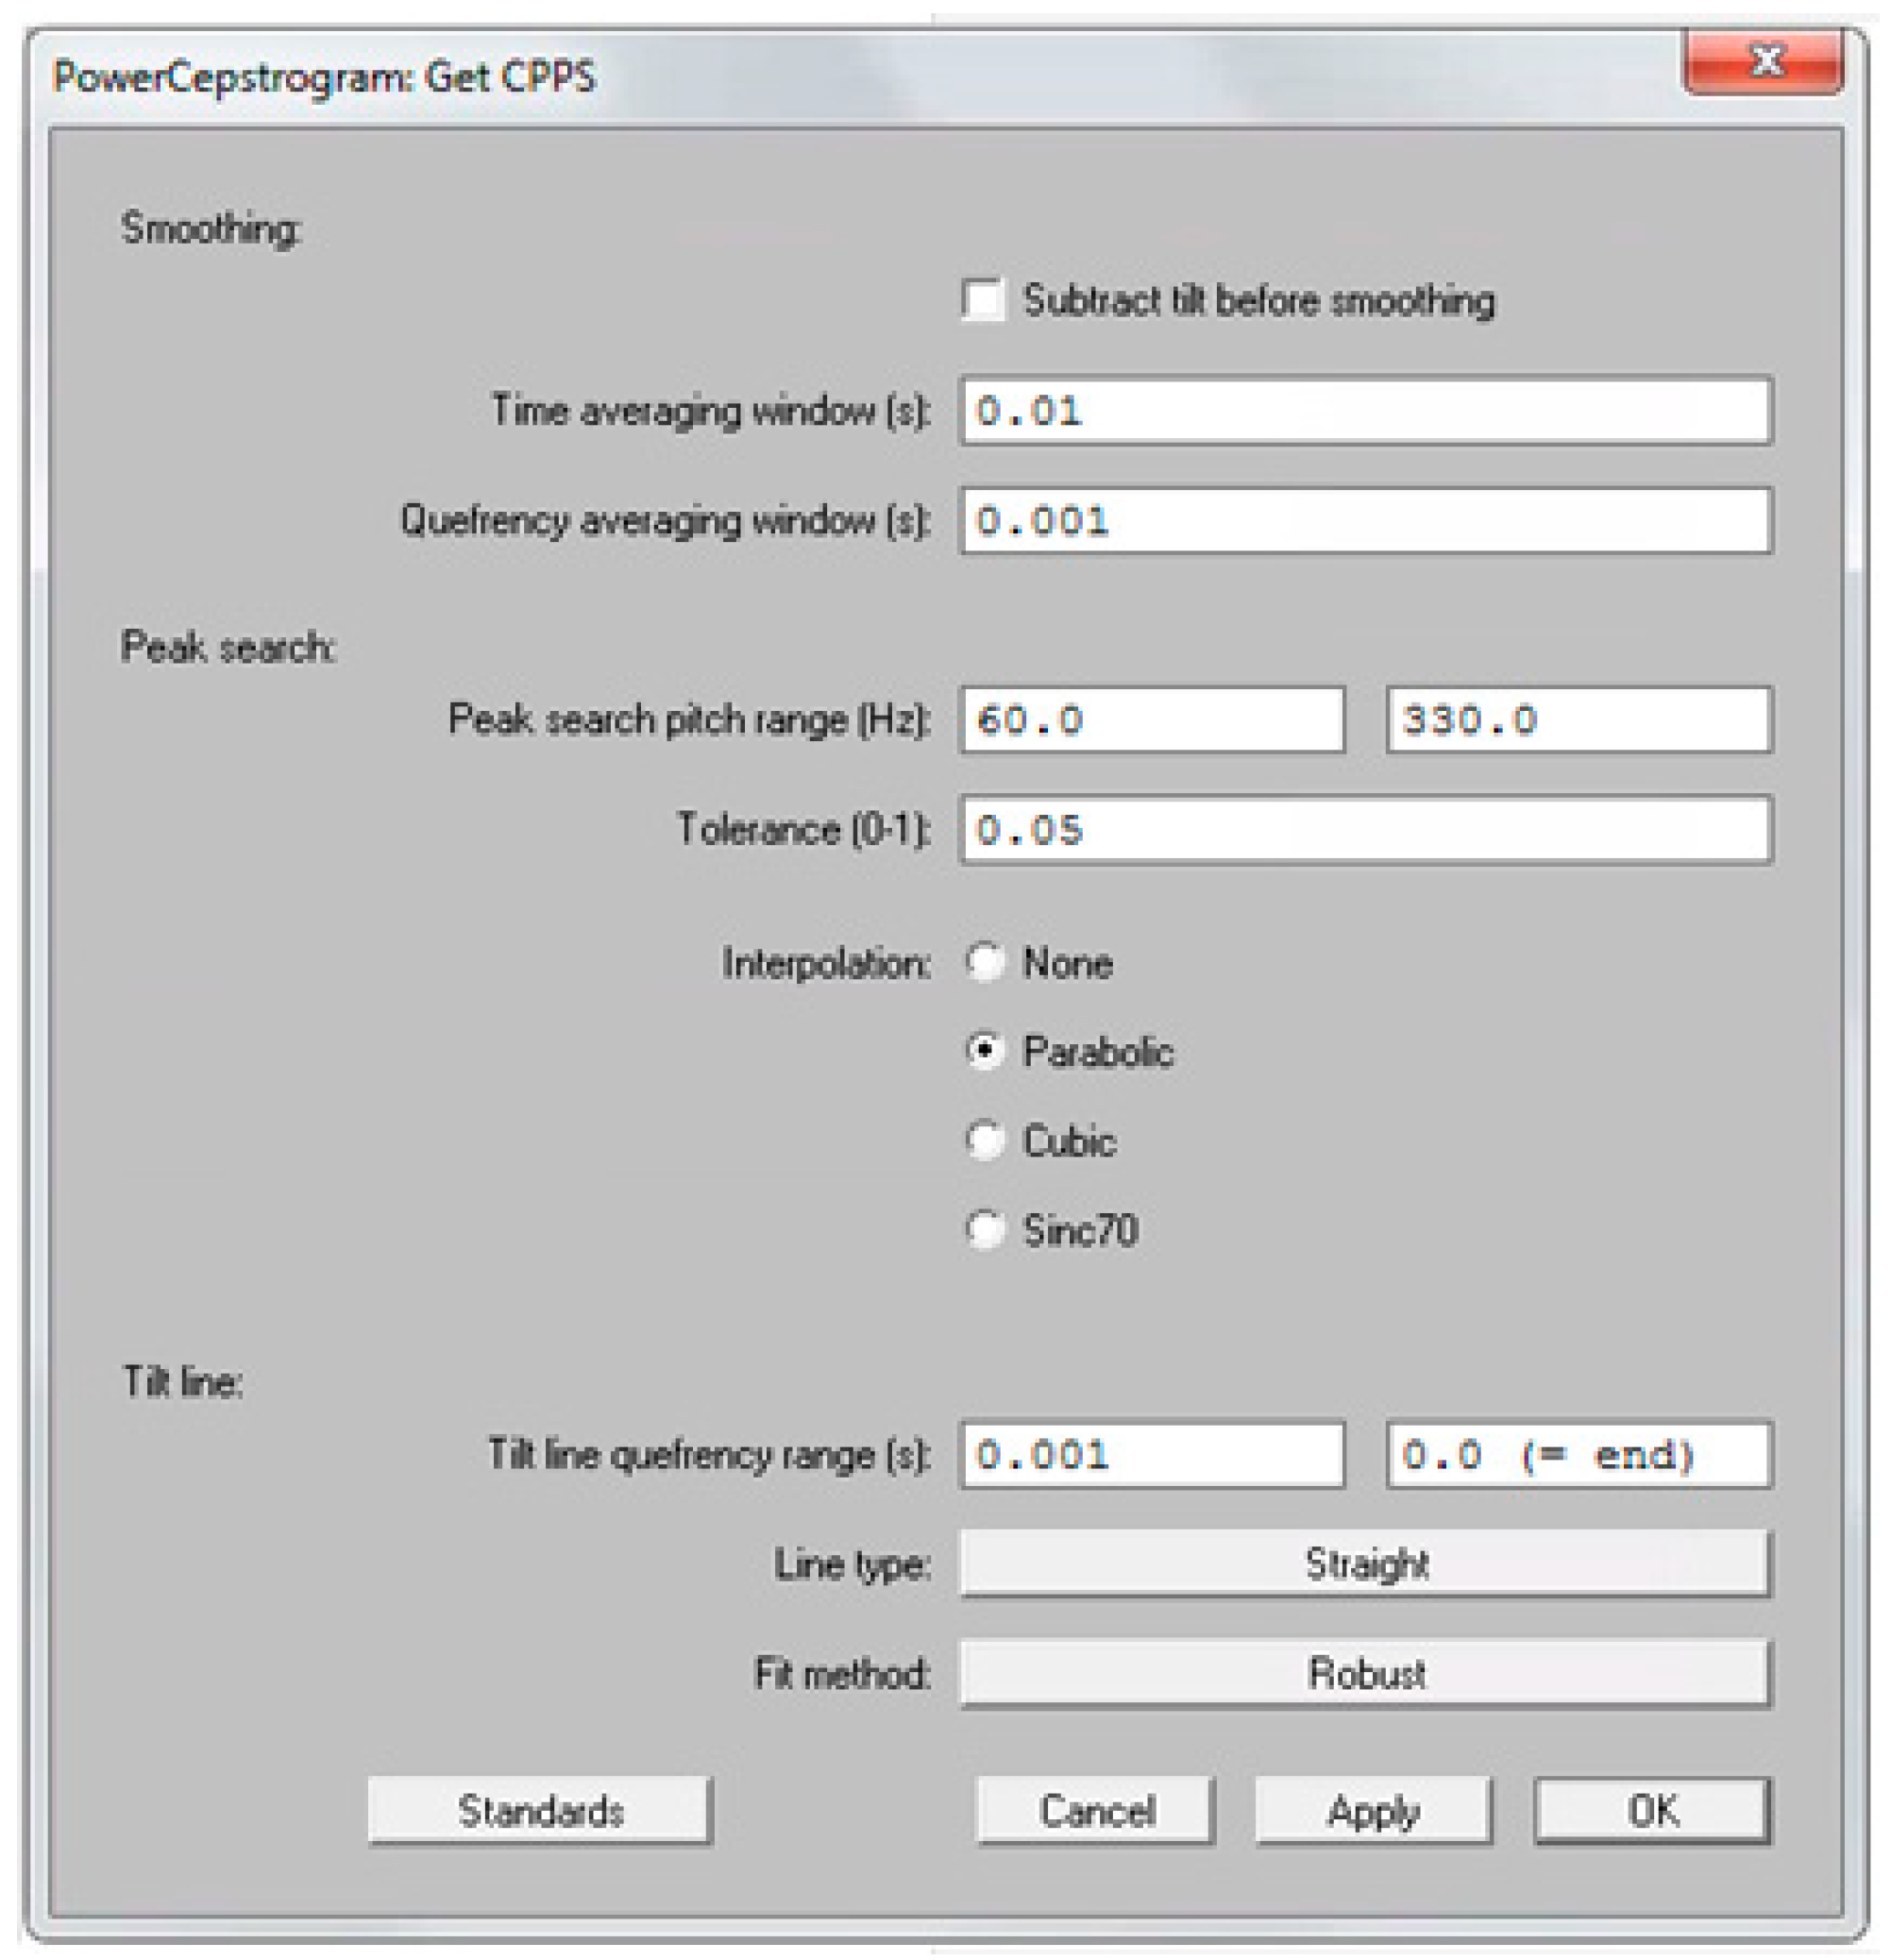
2.4. Acoustic Measures and AVQI
2.5. Statistical Analysis
3. Results
3.1. Normative Data for AVQI and CPPS
3.2. Gender Effects
3.3. Normal Versus Subclinical Voice Quality
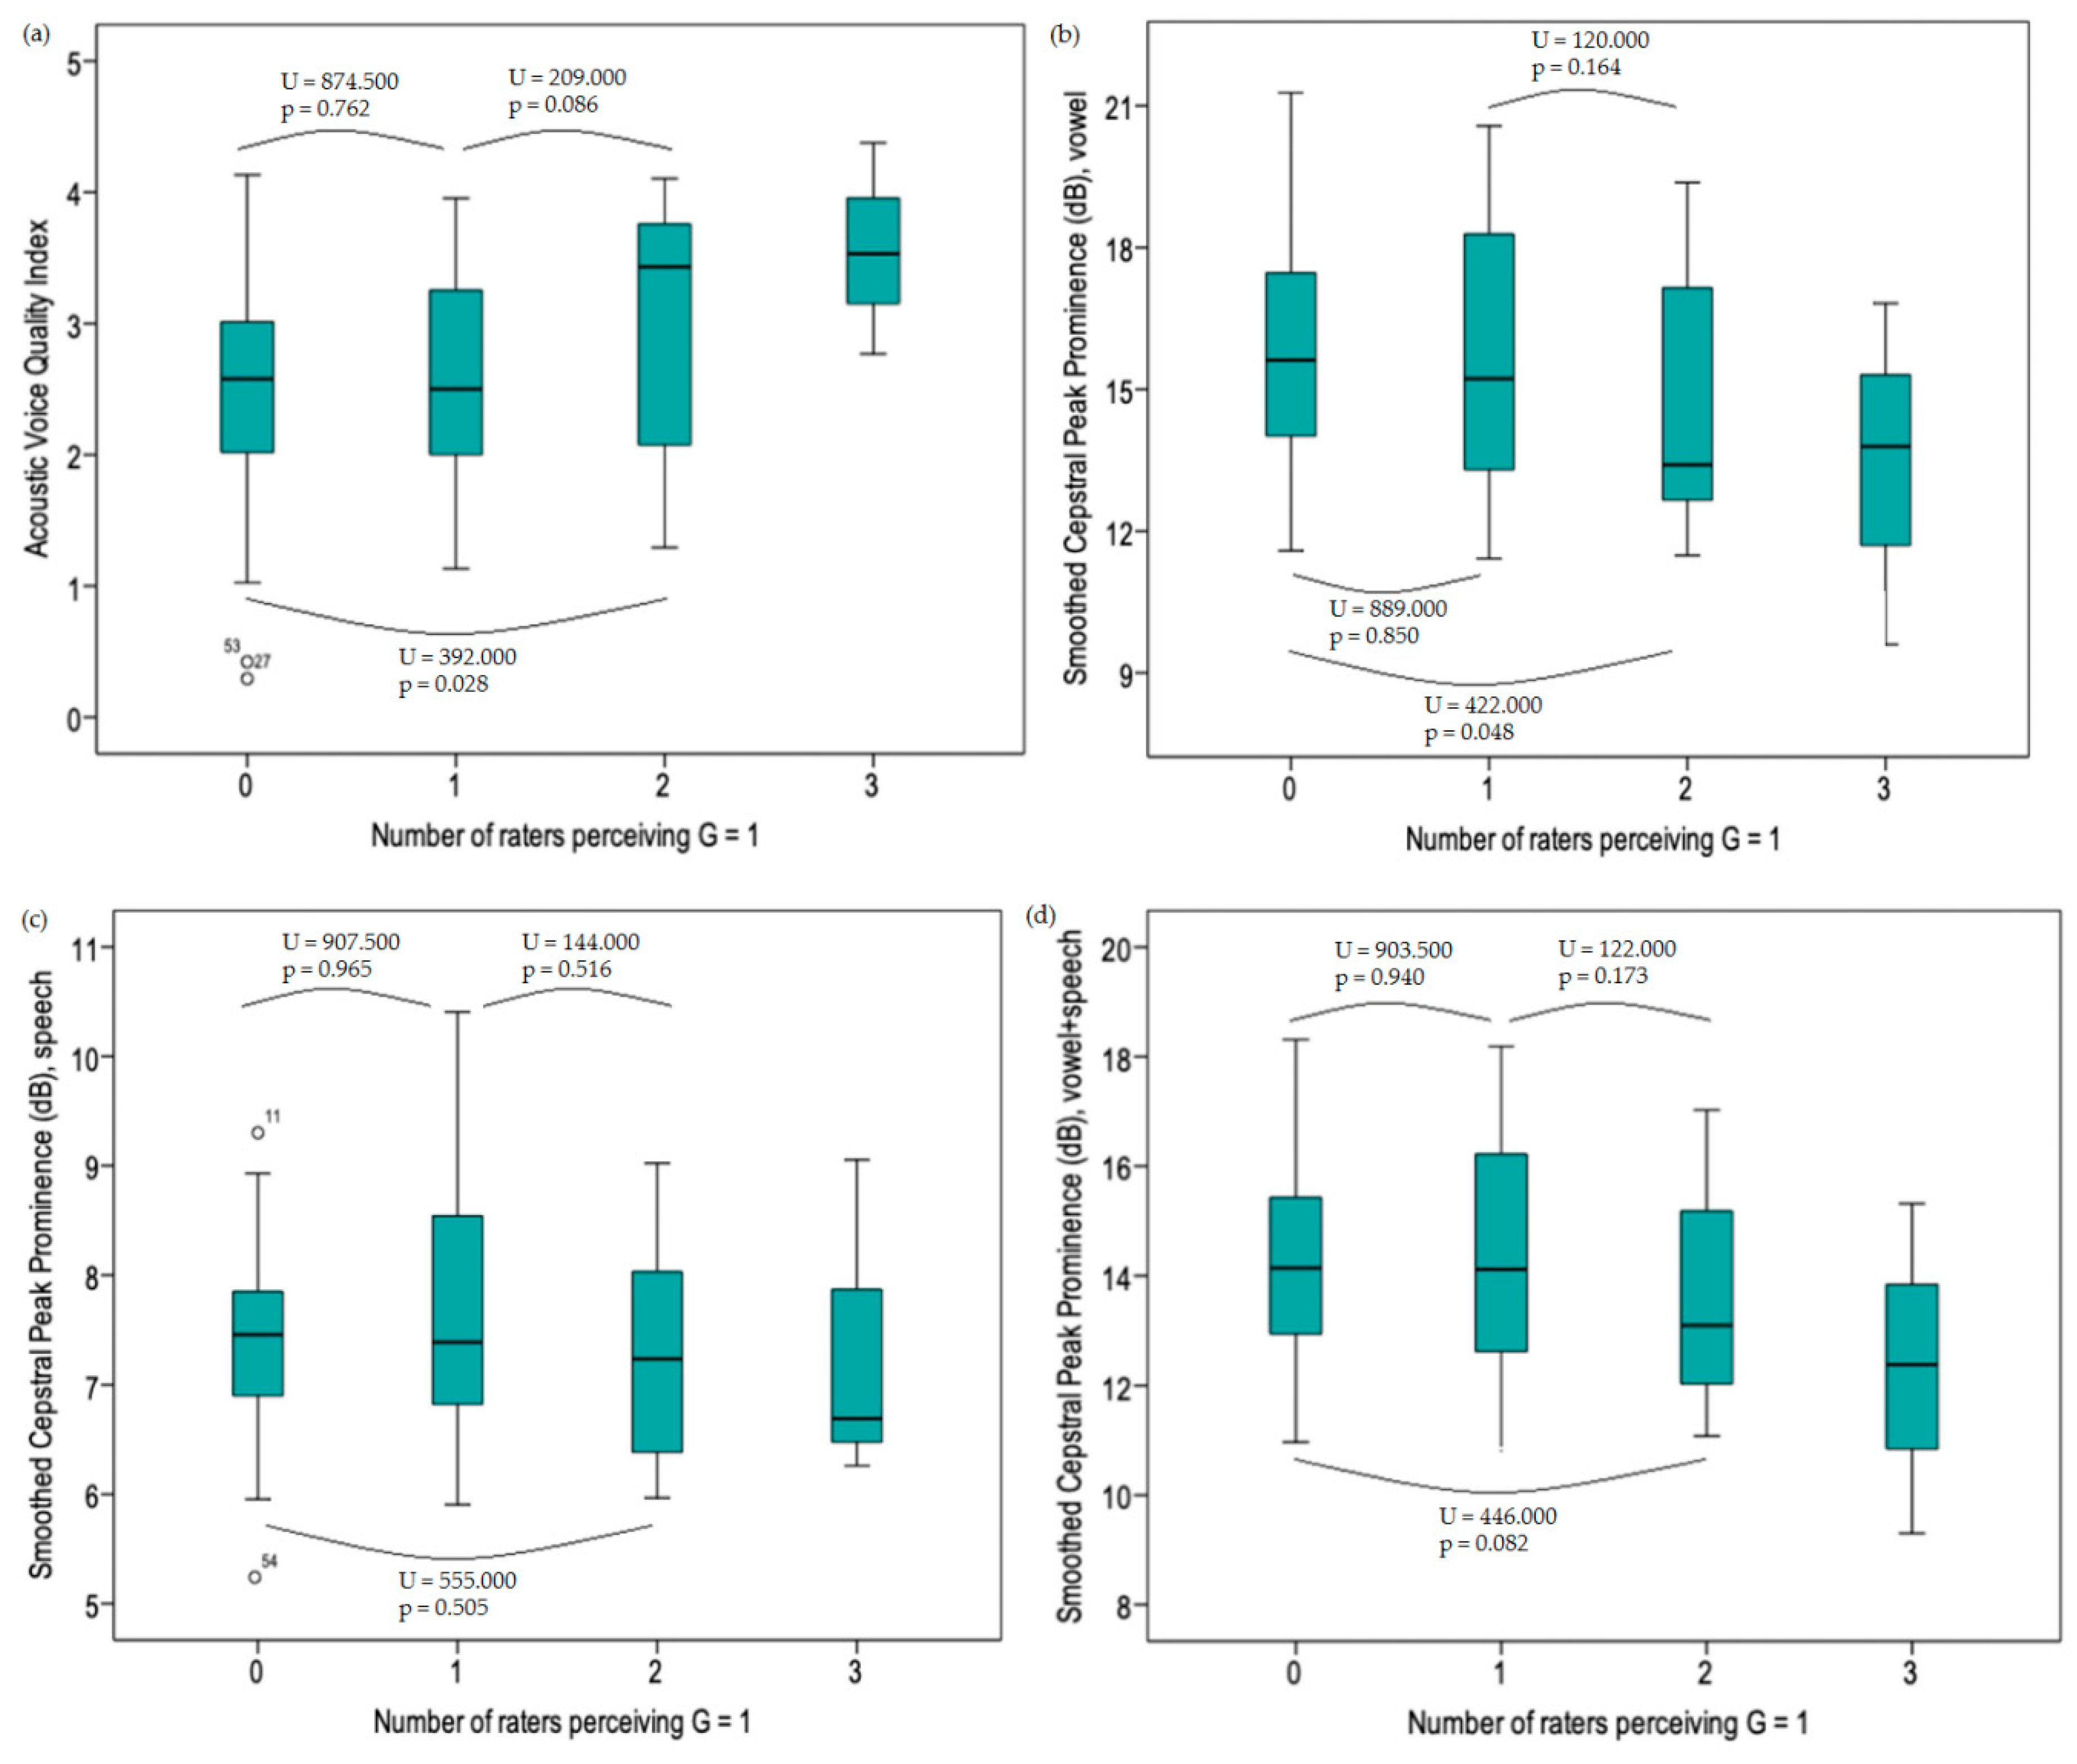
3.4. Subclinical Levels of Dysphonia
4. Discussion
5. Conclusions
Author Contributions
Funding
Conflicts of Interest
Abbreviations
| AVQI | acoustic voice quality index |
| CAPE-V | consensus auditory-perceptual evaluation of voice |
| CPPS | smoothed version of the cepstral peak prominence |
| G | grade |
| GRBAS scale | grade, roughness, breathiness, asthenia and strain scale |
| HNR | harmonics-to-noise-ratio |
| SL | shimmer local |
| SLdB | shimmer local dB |
| Slope | general spectral slope |
| Tilt | spectral trendline inclination |
References
- Kreiman, J.; Gerratt, B.R.; Kempster, G.B.; Erman, A.; Berke, G.S. Perceptual evaluation of voice quality: Review, tutorial, and a framework for future research. J. Speech Lang. Hear. Res. 1993, 36, 21–40. [Google Scholar] [CrossRef]
- Hirano, M. Psycho-Acoustic Evaluation of Voice. Disorders of Human Communication 5 Clinical Examination of Voice; Springer: Berlin, Germany, 1981; pp. 81–84. [Google Scholar]
- Kempster, G.; Gerrat, B.; Verdolini Abott, K.; Barkmeier-Kraemer, J.; Hillman, R. Consensus auditory-perceptual evaluation of voice: Development of a standardized clinical protocol. Am. J. Speech Lang. Pathol. 2009. [Google Scholar] [CrossRef]
- Barsties, B.; De Bodt, M. Assessment of voice quality: Current state-of-the-art. Auris Nasus Larynx 2015, 42, 183–188. [Google Scholar] [CrossRef] [PubMed]
- Maryn, Y.; Corthals, P.; Van Cauwenberge, P.; Roy, N.; De Bodt, M. Toward improved ecological validity in the acoustic measurement of overall voice quality: Combining continuous speech and sustained vowels. J. Voice 2010, 24, 540–555. [Google Scholar] [CrossRef] [PubMed]
- Parsa, V.; Jamieson, D.G. Acoustic discrimination of pathological voice: Sustained vowels versus continuous speech. J. Speech Lang. Hear. Res. 2001, 44, 327–339. [Google Scholar] [CrossRef]
- Barsties, B.; Maryn, Y. External Validation of the Acoustic Voice Quality Index Version 03.01 With Extended Representativity. Ann. Otol. Rhinol. Laryngol. 2016, 125, 571–583. [Google Scholar] [CrossRef] [PubMed]
- Maryn, Y.; De Bodt, M.; Roy, N. The Acoustic Voice Quality Index: Toward improved treatment outcomes assessment in voice disorders. J. Commun. Disord. 2010, 43, 161–174. [Google Scholar] [CrossRef] [PubMed]
- Reynolds, V.; Buckland, A.; Bailey, J.; Lipscombe, J.; Nathan, E.; Vijayasekaran, S.; Kelly, R.; Maryn, Y.; French, N. Objective assessment of pediatric voice disorders with the acoustic voice quality index. J. Voice 2012, 26, 672.e1–672.e17. [Google Scholar] [CrossRef]
- Barsties, B.; Maryn, Y. The Acoustic Voice Quality Index. Toward expanded measurement of dysphonia severity in German subjects. HNO 2012, 60, 715–720. [Google Scholar] [CrossRef]
- Maryn, Y.; De Bodt, M.; Barsties, B.; Roy, N. The value of the acoustic voice quality index as a measure of dysphonia severity in subjects speaking different languages. Eur. Arch. Otorhinolaryngol. 2014, 271, 1609–1619. [Google Scholar] [CrossRef]
- Hosokawa, K.; Barsties, B.; Iwahashi, T.; Iwahashi, M.; Kato, C.; Iwaki, S.; Sasai, H.; Miyauchi, A.; Matsushiro, N.; Inohara, H.; et al. Validation of the Acoustic Voice Quality Index in the Japanese Language. J. Voice 2017, 31, 260.e1–260.e9. [Google Scholar] [CrossRef] [PubMed]
- Uloza, V.; Petrauskas, T.; Padervinskis, E.; Ulozaitė, N.; Barsties, B.; Maryn, Y. Validation of the Acoustic Voice Quality Index in the Lithuanian Language. J. Voice 2017, 31, 257.e1–257.e11. [Google Scholar] [CrossRef] [PubMed]
- Kankare, E.; Barsties, B.; Maryn, Y.; Ilomäki, I.; Laukkanen, A.M.; Tyrmi, J.; Rantala, L.; Asikainen, M.; Rorarius, E.; Siirilä, M.; et al. A preliminary study of the acoustic voice quality index in Finnish speaking population. In Proceedings of the 11th Pan European Voice Conference, Florence, Italy, 31 August–4 September 2015. [Google Scholar]
- Barsties, B.; Maryn, Y. The improvement of internal consistency of the Acoustic Voice Quality Index. Am. J. Otolaryngol. 2015, 36, 647–656. [Google Scholar] [CrossRef] [PubMed]
- Hosokawa, K.; Barsties, V.; Latoszek, B.; Iwahashi, T.; Iwahashi, M.; Iwaki, S.; Kato, C.; Yoshida, M.; Sasai, H.; Miyauchi, A.; et al. The Acoustic Voice Quality Index Version 03.01 for the Japanese-speaking Population. J. Voice 2019, 33, 125.e1–125.e12. [Google Scholar] [CrossRef] [PubMed]
- Delgado Hernández, J.; León Gómez, N.M.; Jiménez, A.; Izquierdo, L.M.; Barsties, V.; Latoszek, B. Validation of the Acoustic Voice Quality Index Version 03.01 and the Acoustic Breathiness Index in the Spanish language. Ann. Otol. Rhinol. Laryngol. 2018, 127, 317–326. [Google Scholar] [CrossRef] [PubMed]
- Uloza, V.; Latoszek, B.B.V.; Ulozaite-Staniene, N.; Petrauskas, T.; Maryn, Y. A comparison of Dysphonia Severity Index and Acoustic Voice Quality Index measures in differentiating normal and dysphonic voices. Eur. Arch. Otorhinolaryngol. 2018, 275, 949–958. [Google Scholar] [CrossRef] [PubMed]
- Kim, G.H.; Lee, Y.W.; Bae, I.H.; Park, H.J.; Wang, S.G.; Kwon, S.B. Validation of the Acoustic Voice Quality Index in the Korean Language. J. Voice 2018. [Google Scholar] [CrossRef] [PubMed]
- Barsties, V.; Latoszek, B.; Ulozaitė-Stanienė, N.; Petrauskas, T.; Uloza, V.; Maryn, Y. Diagnostic Accuracy of Dysphonia Classification of DSI and AVQI. Laryngoscope 2019, 129, 692–698. [Google Scholar] [CrossRef]
- Barsties, V.; Latoszek, B.; Lehnert, B.; Janotte, B. Validation of the Acoustic Voice Quality Index Version 03.01 and Acoustic Breathiness Index in German. J. Voice 2018, 127, 317–326. [Google Scholar]
- Kankare, E.; Barsties, V.; Latoszek, B.; Maryn, Y.; Asikainen, M.; Rorarius, E.; Vilpas, S.; Ilomäki, I.; Tyrmi, J.; Rantala, L.; et al. The acoustic voice quality index version 02.02 in the Finnish-speaking population. Logop. Phoniatr. Vocol. 2019, 1–8. [Google Scholar] [CrossRef]
- Englert, M.; Lima, L.; Behlau, M. Acoustic Voice Quality Index and Acoustic Breathiness Index: Analysis With Different Speech Material in the Brazilian Portuguese. J. Voice 2019. [Google Scholar] [CrossRef] [PubMed]
- Pommée, T.; Maryn, Y.; Finck, C.; Morsomme, D. Validation of the Acoustic Voice Quality Index, Version 03.01, in French. J. Voice 2018. [Google Scholar] [CrossRef]
- Maryn, Y.; Kim, H.T.; Kim, J. Auditory-Perceptual and Acoustic Methods in Measuring Dysphonia Severity of Korean Speech. J. Voice 2016, 30, 587–594. [Google Scholar] [CrossRef] [PubMed]
- Hillenbrand, J.; Cleveland, R.A.; Erickson, R.L. Acoustic correlates of breathy vocal quality. J. Speech Hear. Res. 1994, 37, 769–778. [Google Scholar] [CrossRef] [PubMed]
- Hillenbrand, J.; Houde, R.A. Acoustic correlates of breathy vocal quality: Dysphonic voices and continuous speech. J. Speech Hear. Res. 1996, 39, 311–321. [Google Scholar] [CrossRef] [PubMed]
- Wolfe, V.; Martin, D. Acoustic correlates of dysphonia: Type and severity. J. Commun. Disord. 1997, 30, 403–415. [Google Scholar] [CrossRef]
- Heman-Ackah, Y.D.; Michael, D.D.; Goding, G.S. The relationship between cepstral peak prominence and selected parameters of dysphonia. J. Voice 2002, 16, 20–27. [Google Scholar] [CrossRef]
- Heman-Ackah, Y.D.; Heuer, R.J.; Michael, D.D.; Ostrowski, R.; Horman, M.; Baroody, M.M.; Rosemary Ostrowski, M.M.; James Hillenbrand, M.S.; Heuer Reinhardt, J.; Michelle Horman, M.A.; et al. Cepstral peak prominence: A more reliable measure of dysphonia. Ann. Otol. Rhinol. Laryngol. 2003, 112, 324–333. [Google Scholar] [CrossRef] [PubMed]
- Halberstam, B. Acoustic and perceptual parameters relating to connected speech are more reliable measures of hoarseness than parameters relating to sustained vowels. ORL J. Otorhinolaryngol. Relat. Spec. 2004, 66, 70–73. [Google Scholar] [CrossRef]
- Lowell, S.Y.; Colton, R.H.; Kelley, R.T.; Hahn, Y.C. Spectral- and cepstral-based measures during continuous speech: Capacity to distinguish dysphonia and consistency within a speaker. J. Voice 2011, 25, e223–e232. [Google Scholar] [CrossRef]
- Moers, C.; Möbius, B.; Rosanowski, F.; Nöth, E.; Eysholdt, U.; Haderlein, T. Vowel- and text-based cepstral analysis of chronic hoarseness. J. Voice 2012, 26, 416–424. [Google Scholar] [CrossRef] [PubMed]
- Eadie, T.L.; Baylor, C.R. The effect of perceptual training on inexperienced listeners’ judgments of dysphonic voice. J. Voice 2006, 20, 527–544. [Google Scholar] [CrossRef] [PubMed]
- Heman-Ackah, Y.D.; Sataloff, R.T.; Laureyns, G.; Lurie, D.; Michael, D.D.; Heuer, R.; Rubin, A.; Eller, R.; Chandran, S.; Abaza, M.; et al. Quantifying the cepstral peak prominence, a measure of dysphonia. J. Voice 2014, 28, 783–788. [Google Scholar] [CrossRef] [PubMed]
- Sauder, C.; Bretl, M.; Eadie, T. Predicting Voice Disorder Status From Smoothed Measures of Cepstral Peak Prominence Using Praat and Analysis of Dysphonia in Speech and Voice (ADSV). J. Voice 2017, 31, 557–566. [Google Scholar] [CrossRef] [PubMed]
- Englert, M.; Lima, L.; Constantini, A.C.; Latoszek, B.B.V.; Maryn, Y.; Behlau, M. Acoustic Voice Quality Index—AVQI for Brazilian Portuguese speakers: Analysis of different speech material. Codas 2019, 31, e20180082. [Google Scholar] [CrossRef] [PubMed]
- Wuyts, F.L.; De Bodt, M.S.; Van de Heyning, P.H. Is the reliability of a visual analog scale higher than an ordinal scale? An experiment with the GRBAS scale for the perceptual evaluation of dysphonia. J. Voice 1999, 13, 508–517. [Google Scholar] [CrossRef]
- Barsties, V.; Latoszek, B.; Ulozaitė-Stanienė, N.; Maryn, Y.; Petrauskas, T.; Uloza, V. The Influence of Gender and Age on the Acoustic Voice Quality Index and Dysphonia Severity Index: A Normative Study. J. Voice 2017, 33, 340–345. [Google Scholar] [CrossRef] [PubMed]
- Latoszek, B.B.V.; De Bodt, M.; Gerrits, E.; Maryn, Y. The Exploration of an Objective Model for Roughness With Several Acoustic Markers. J. Voice 2018, 32, 149–161. [Google Scholar] [CrossRef] [PubMed]
- Phadke, K.V.; Laukkanen, A.M.; Ilomäki, I.; Kankare, E.; Geneid, A.; Švec, J.G. Cepstral and Perceptual Investigations in Female Teachers With Functionally Healthy Voice. J. Voice 2018. [Google Scholar] [CrossRef] [PubMed]
- Maryn, Y.; Roy, N. Sustained vowels and continuous speech in the auditory-perceptual evaluation of dysphonia severity. J. Soc. Bras. Fonoaudiol. 2012, 24, 107–112. [Google Scholar] [CrossRef] [PubMed]


| AVQI Version | Language | Number of Voice Samples | Threshold | Sensitivity | Specificity | Reference |
|---|---|---|---|---|---|---|
| first | Dutch | 251 | 2.95 | 74% | 96% | Maryn et al. [5] |
| first | Dutch | 39 | 2.95 | 85% | 100% | Maryn et al. [8] |
| first | Dutch | 50 | 3.19 | 92% | 73% | Maryn et al. [11] |
| first | Dutch | 50 | 3.66 | 85% | 80% | Maryn et al. [11] |
| first | German | 50 | 3.05 | 98% | 75% | Maryn et al. [11] |
| first | French | 50 | 3.07 | 97% | 70% | Maryn et al. [11] |
| first | English | 50 | 3.29 | 90% | 90% | Maryn et al. [11] |
| first | English | 50 | 3.25 | 95% | 82% | Maryn et al. [11] |
| first | German | 61 | 2.70 | 79% | 92% | Barsties et al. [10] |
| first | Australian English | 107 | 3.46 | 82% | 92% | Reynolds et al. [9] |
| first | Dutch | 60 | 2.80 | 91.7% | 87.5% | Barsties et al. [15] |
| second 02.02 | Lithuanian | 264 | 3.31 | 71.7% | 88% | Barsties et al. [20] |
| second 02.02 | Korean | 1.524 | 3.33 | 90.0% | 96.5% | Kim et al. [19] |
| second 02.02 | Finnish | 50 | 2.35 | 82.1% | 95.5% | Kankare et al. [14] |
| second 02.02 | Finnish | 200 | 2.87 | 79.6% | 86.2% | Kankare et al. [22] |
| second 02.02 | Lithuanian | 264 | 3.31 | 78.1% | 92.0% | Uloza et al. [18] |
| second 02.02 | Lithuanian | 184 | 2.97 | 83.8% | 93.7% | Uloza et al. [13] |
| second 02.02 | Japanese | 336 | 3.15 | 72.5% | 95.2% | Hosokawa et al. [12] |
| second 02.02 | Dutch | 60 | 2.43 | 100% | 93.6% | Barsties et al. [15] |
| third 03.01 | Dutch | 1058 | 2.43 | 78.5% | 93.2% | Barsties et al. [7] |
| third 03.01 | Japanese | 455 | 1.41 | 84.4% | 85.6% | Hosokawa et al. [16] |
| third 03.01 | Spanish | 183 | 2.28 | 74.8% | 94.6% | Delgado et al. [17] |
| third 03.01 | German | 218 | 1.85 | 72% | 90% | Barsties et al. [21] |
| third 03.01 | French | 120 | 2.33 | 59.8% | 100% | Pommée et al. [24] |
| third 03.01 | Brazilian Portuguese | 50 | 1.10 | 57.8% | 100% | Englert et al. [37] |
| third 03.01 | Brazilian Portuguese | 53 | 1.16 | 86% | 80% | Englert et al. [23] |
| third 03.01 | Brazilian Portuguese | 53 | 1.56 | 88.6% | 100% | Englert et al. [23] |
| Mean | 2.67 |
| Gender | Normophonic | Subclinical | All | |||||||||||||
|---|---|---|---|---|---|---|---|---|---|---|---|---|---|---|---|---|
| N | Mean | SD | Lower PI | Upper PI | N | Mean | SD | Lower PI | Upper PI | N | Mean | SD | Lower PI | Upper PI | ||
| AVQI | F | 52 | 2.60 | 0.67 | 1.26 | 3.94 | 20 | 2.92 | 0.83 | 1.26 | 4.58 | 72 | 2.68 | 0.73 | 1.22 | 4.14 |
| M | 31 | 2.28 | 0.91 | 0.46 | 4.10 | 20 | 2.71 | 0.90 | 0.91 | 4.51 | 51 | 2.45 | 0.92 | 0.61 | 4.29 | |
| F + M | 83 | 2.48 | 0.78 | 0.92 | 4.04 | 40 | 2.81 | 0.86 | 1.09 | 4.53 | 123 | 2.59 | 0.82 | 0.95 | 4.23 | |
| CPPS vowel | F | 52 | 15.08 | 2.04 | 11.00 | 19.16 | 20 | 14.17 | 1.88 | 10.41 | 17.93 | 72 | 14.82 | 2.03 | 10.76 | 18.88 |
| M | 31 | 17.18 | 2.71 | 11.76 | 22.61 | 20 | 16.06 | 3.25 | 9.56 | 22.56 | 51 | 16.74 | 2.96 | 10.82 | 22.66 | |
| F + M | 83 | 15.86 | 2.51 | 10.84 | 20.88 | 40 | 15.11 | 2.79 | 9.53 | 20.69 | 123 | 15.62 | 2.62 | 10.38 | 20.86 | |
| CPPS sentences | F | 52 | 7.59 | 0.73 | 6.13 | 9.05 | 20 | 7.76 | 1.05 | 5.66 | 9.86 | 72 | 7.64 | 0.82 | 6.00 | 9.28 |
| M | 31 | 7.22 | 0.79 | 5.64 | 8.80 | 20 | 7.19 | 1.10 | 4.99 | 9.39 | 51 | 7.21 | 0.91 | 5.39 | 9.03 | |
| F + M | 83 | 7.45 | 0.77 | 5.91 | 8.99 | 40 | 7.48 | 1.10 | 5.28 | 9.68 | 123 | 7.46 | 0.88 | 5.70 | 9.22 | |
| CPPS combination | F | 52 | 13.80 | 1.49 | 10.82 | 16.78 | 20 | 13.23 | 1.63 | 9.97 | 16.49 | 72 | 13.64 | 1.54 | 10.56 | 16.72 |
| M | 31 | 15.08 | 2.06 | 10.96 | 19.20 | 20 | 14.37 | 2.53 | 9.31 | 19.43 | 51 | 14.80 | 2.26 | 10.28 | 19.32 | |
| F + M | 83 | 14.27 | 1.82 | 10.63 | 17.91 | 40 | 13.80 | 2.18 | 9.44 | 18.16 | 123 | 14.12 | 1.95 | 10.22 | 18.02 | |
| 52 F vs 31 M | ||
|---|---|---|
| AVQI | Statistical test | Independent-samples student t test |
| Test value | 1.673 | |
| Sign. | p = 0.101 | |
| CPPS vowel | Statistical test | Independent-samples student t test |
| Test value | −3.734 | |
| Sign | p < 0.001 | |
| CPPS sentences | Statistical test | Independent-samples student t test |
| Test value | 2.182 | |
| Sign. | p = 0.032 | |
| CPPS combination | Statistical test | Independent-samples student t test |
| Test value | −3.028 | |
| Sign | p = 0.004 |
| Normophonic | Subclinical | Statistic | Sign. | |
|---|---|---|---|---|
| AVQI | N = 83 | N = 40 | Mann-Whitney U = 1303.5 | p = 0.054 |
| Mean = 2.48 | Mean = 2.81 | |||
| SD = 0.78 | SD = 0.86 | |||
| CPPS vowel | N = 83 | N = 40 | Mann-Whitney U = 1385 | p = 0.138 |
| Mean = 15.86 | ean = 15.11 | |||
| SD = 2.51 | SD = 2.79 | |||
| CPPS sentences | N = 83 | N = 40 | Mann-Whitney U = 1573 | p = 0.64 |
| Mean = 7.45 | Mean = 7.48 | |||
| SD = 0.77 | SD = 1.10 | |||
| CPPS combination | N = 83 | N = 40 | Mann-Whitney U = 1421.5 | p = 0.198 |
| Mean = 14.27 | Mean = 13.80 | |||
| SD = 1.82 | SD = 2.18 |
| N Judges G = 1 | AVQI | CPPS Vowel | CPPS Sentences | CPPS Combination |
|---|---|---|---|---|
| 0 | N = 83 | N = 83 | N = 83 | N = 83 |
| Mean = 2.48 | Mean = 15.86 | Mean = 7.45 | Mean = 14.27 | |
| SD = 0.78 | SD = 2.51 | SD = 0.77 | SD = 1.82 | |
| 1 | N = 22 | N = 22 | N = 22 | N = 22 |
| Mean = 2.57 | Mean = 15.75 | Mean = 7.60 | Mean = 14.29 | |
| SD = 0.75 | SD = 2.78 | SD = 1.16 | SD = 2.82 | |
| 2 | N = 15 | N = 15 | N = 15 | N = 15 |
| Mean = 3.03 | Mean = 14.52 | Mean = 7.32 | Mean = 13.38 | |
| SD = 0.93 | SD = 2.57 | SD = 0.99 | SD = 1.87 | |
| 3 | N = 3 | N = 3 | N = 3 | N = 3 |
| Mean = 3.56 | Mean = 13.40 | Mean = 7.34 | Mean = 12.33 | |
| SD = 0.80 | SD = 3.63 | SD = 1.50 | SD = 3.01 |
© 2019 by the authors. Licensee MDPI, Basel, Switzerland. This article is an open access article distributed under the terms and conditions of the Creative Commons Attribution (CC BY) license (http://creativecommons.org/licenses/by/4.0/).
Share and Cite
Batthyany, C.; Maryn, Y.; Trauwaen, I.; Caelenberghe, E.; van Dinther, J.; Zarowski, A.; Wuyts, F. A Case of Specificity: How Does the Acoustic Voice Quality Index Perform in Normophonic Subjects? Appl. Sci. 2019, 9, 2527. https://doi.org/10.3390/app9122527
Batthyany C, Maryn Y, Trauwaen I, Caelenberghe E, van Dinther J, Zarowski A, Wuyts F. A Case of Specificity: How Does the Acoustic Voice Quality Index Perform in Normophonic Subjects? Applied Sciences. 2019; 9(12):2527. https://doi.org/10.3390/app9122527
Chicago/Turabian StyleBatthyany, Christina, Youri Maryn, Ilse Trauwaen, Els Caelenberghe, Joost van Dinther, Andrzej Zarowski, and Floris Wuyts. 2019. "A Case of Specificity: How Does the Acoustic Voice Quality Index Perform in Normophonic Subjects?" Applied Sciences 9, no. 12: 2527. https://doi.org/10.3390/app9122527
APA StyleBatthyany, C., Maryn, Y., Trauwaen, I., Caelenberghe, E., van Dinther, J., Zarowski, A., & Wuyts, F. (2019). A Case of Specificity: How Does the Acoustic Voice Quality Index Perform in Normophonic Subjects? Applied Sciences, 9(12), 2527. https://doi.org/10.3390/app9122527