Article

Personality or Value: A Comparative Study of Psychographic Segmentation Based on an Online Review Enhanced Recommender System

1
Key Laboratory of Adolescent Cyberpsychology and Behavior, Ministry of Education, Central China Normal University, Wuhan 430079, China
2
School of Information Management, Central China Normal University, Wuhan 430079, China
3
Department of Electrical and Computer Engineering, Rice University, Houston, TX 77005, USA
4
Department of Psychology, The University of Memphis, Memphis, TN 38152, USA
*
Author to whom correspondence should be addressed.
Hui Liu and Yinghui Huang are co-first authors.
Appl. Sci. 2019, 9(10), 1992; https://doi.org/10.3390/app9101992
Submission received: 1 March 2019 / Revised: 28 April 2019 / Accepted: 8 May 2019 / Published: 15 May 2019
(This article belongs to the Special Issue Sentiment Analysis for Social Media)

Abstract

:
Big consumer data promises to be a game changer in applied and empirical marketing research. However, investigations of how big data helps inform consumers’ psychological aspects have, thus far, only received scant attention. Psychographics has been shown to be a valuable market segmentation path in understanding consumer preferences. Although in the context of e-commerce, as a component of psychographic segmentation, personality has been proven to be effective for prediction of e-commerce user preferences, it still remains unclear whether psychographic segmentation is practically influential in understanding user preferences across different product categories. To the best of our knowledge, we provide the first quantitative demonstration of the promising effect and relative importance of psychographic segmentation in predicting users’ online purchasing preferences across different product categories in e-commerce by using a data-driven approach. We first construct two online psychographic lexicons that include the Big Five Factor (BFF) personality traits and Schwartz Value Survey (SVS) using natural language processing (NLP) methods that are based on behavior measurements of users’ word use. We then incorporate the lexicons in a deep neural network (DNN)-based recommender system to predict users’ online purchasing preferences considering the new progress in segmentation-based user preference prediction methods. Overall, segmenting consumers into heterogeneous groups surprisingly does not demonstrate a significant improvement in understanding consumer preferences. Psychographic variables (both BFF and SVS) significantly improve the explanatory power of e-consumer preferences, whereas the improvement in prediction power is not significant. The SVS tends to outperform BFF segmentation, except for some product categories. Additionally, the DNN significantly outperforms previous methods. An e-commerce-oriented SVS measurement and segmentation approach that integrates both BFF and the SVS is recommended. The strong empirical evidence provides both practical guidance for e-commerce product development, marketing and recommendations, and a methodological reference for big data-driven marketing research.

1. Introduction

In big data era, the research paradigms of marketing service have been greatly changed by the enormous marketing data accumulated from the internet, such as on demographics, user behavior (we will henceforth use the word “user”, “customer”, and “consumer” interchangeably), and social relationships. These fine-grained marketing data are informative, thus providing marketers with extra opportunities to evaluate users’ preferences [1], predicting the next product users will buy [2,3], delivering targeted advertisements [4,5], uncovering consumer perceptions of brand [6], and acquiring competitive intelligence [7]. In particular, psychological aspects of user behavior, critical for understanding rather than merely predicting consumer preference, ultimately contribute to intelligent decision-making in marketing. Unfortunately, investigations of how big data helps inform has, thus far, only received scant attention [8].
Studies have demonstrated that psychological variables, such as value and personality, are the main theories and tools for user psychographic segmentation, which is an important determinant of user purchase behaviors and preferences [9,10]. In particular, personality traits, one of the psychographic segmentation components, has been the main consumer psychological and marketing characteristic used in e-commerce. Unfortunately, the predictive and explanatory power of personality traits for online user behavior remains controversial [11]. This controversy motivates the investigation of other types of psychographic segmentation, such as value, in understanding user preferences, which have not been investigated. Furthermore, it is unclear whether the predictive and explanatory power varies between product categories and between different segment-wise preference prediction methods. The main reason is that collecting psychographic segmentation data from e-commerce users is difficult on a large scale, typically requiring consumers to complete lengthy questionnaires.
Psychological variables, such as personality and value, are deeply embedded in the language that people use today [12]. With massive user data in the form of natural language, natural language data provides a clearer picture of people’s cognitive and behavioral processes than data collected from traditional and widely used self-report surveys [13,14,15]. Practically, natural language processing (NLP) techniques can be applied to identifying psychographic variables, such as e-commerce users’ online word use, to understand and predict users’ purchase behaviors and preferences on a large scale.
E-commerce websites, in particular, have accumulated a large amount of user-generated content (UGC), which provides the basis for observing users’ psychographics and predicting user preferences directly. With the rapid development of techniques such as big data, artificial intelligence, and computational linguistics, UGC provides a reliable path for automatically identifying consumer psychographics, including personality and values, based on unstructured data. Inspired by recent advances in big data-driven psycholinguistic research, which indicate the behavioral evidence of online word use related to psychographics [16,17], we base our research on real-world Amazon consumer review and rating data. We propose psychographics-related word use evidence, extract consumers’ psychographic characteristics using sentiment analysis methods, and introduce a deep neural network (DNN) to predict and explain user preferences in e-commerce.
We found that, overall, psychographic variables significantly improved the explanatory power of e-consumer preferences across most product categories we studied, whereas the improvement in predictive power was not significant. Specifically, the Schwartz Value Survey (SVS) tended to outperform Big Five Factor (BFF) segmentation in predicting and explaining user preferences, with the exception of a few product categories. However, somewhat surprisingly, dividing e-consumers into heterogeneous groups using a clustering method did not significantly improve the predictive and explanatory power of online consumer preferences compared to handling consumers as a whole. Furthermore, the DNN method that we proposed demonstrated the best performance in understanding e-consumer preferences, and regarding product category, there were more significant differences for psychographic segmentation in predicting, than explaining, e-consumer preferences. Additionally, we recommend an e-commerce-oriented SVS measurement and segmentation approach that integrates both BFF and the SVS.
Our work extends the depth and breadth of psychographic theories through user preference prediction in e-commerce scenarios. Specifically, we found that subdimensions of psychographic variables and product types provide practical references for psychographic measurement development and applications for the specific e-commerce product categories that we studied. By introducing psychographic-related word use behavioral evidence, followed by big data approaches, we have attempted to overcome the difficulties of obtaining e-consumer psychographics on a large scale, and have provided a promising psychographic-based consumer preference prediction method for subsequent research.
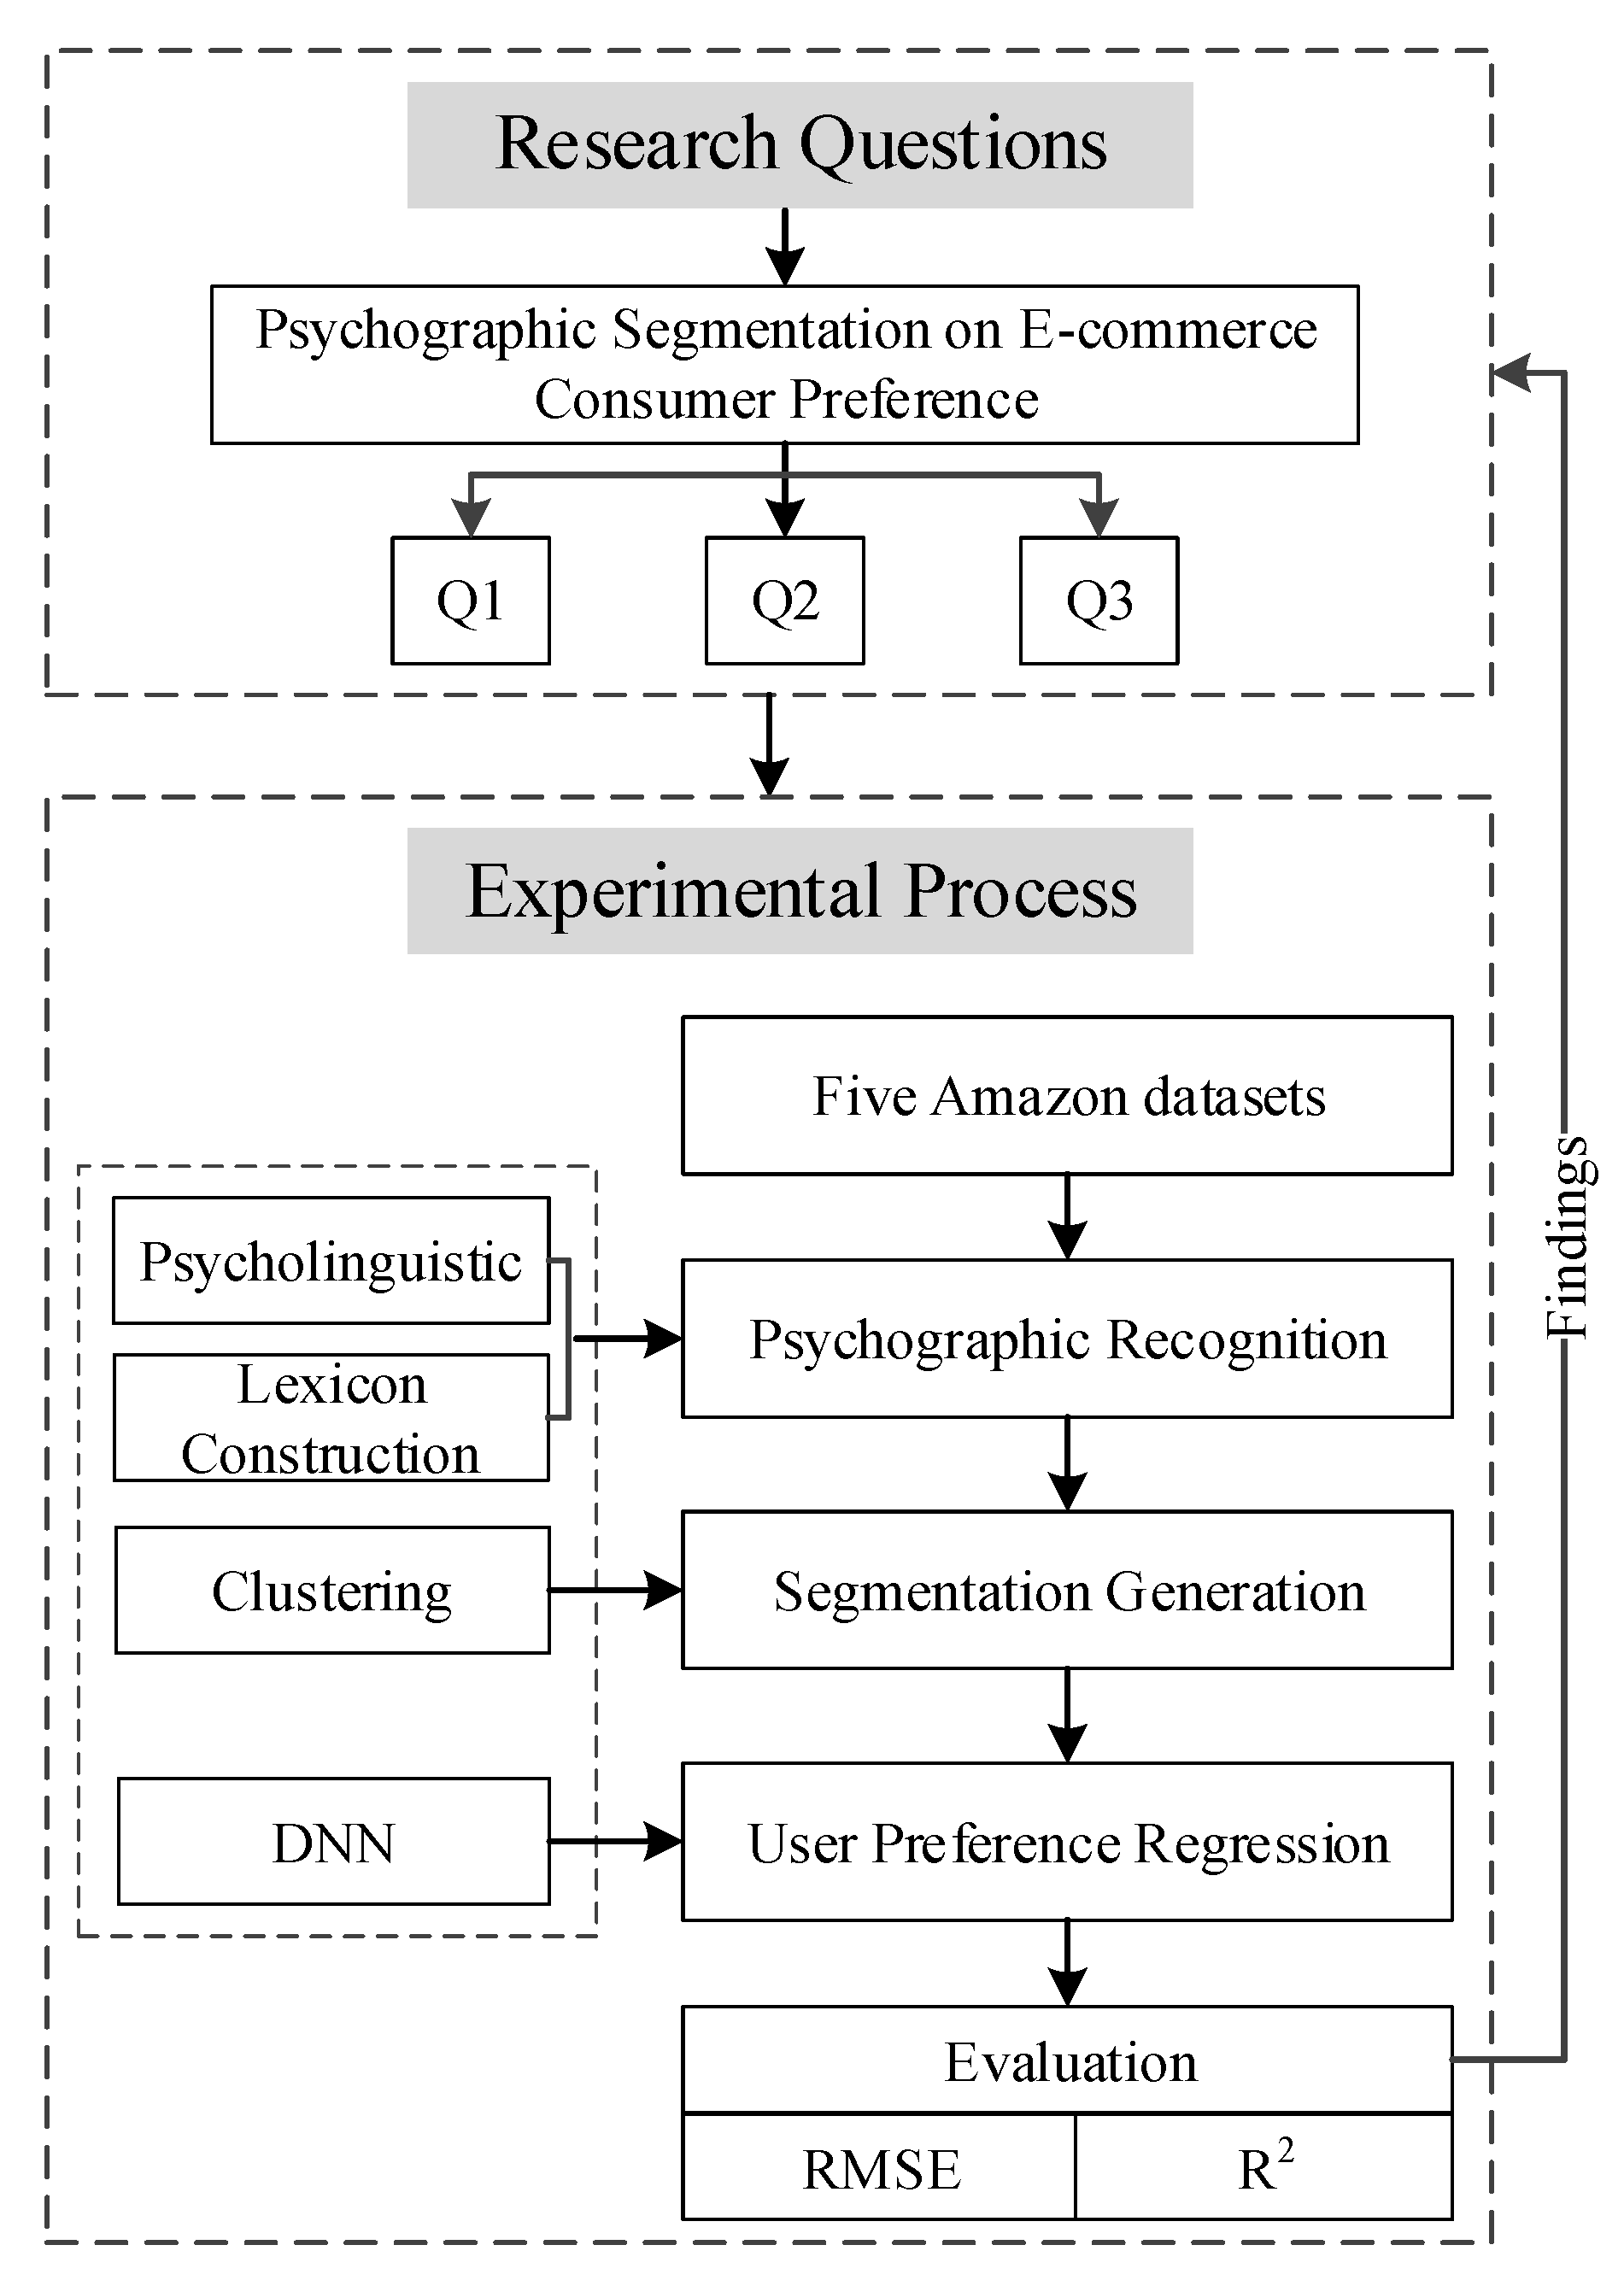
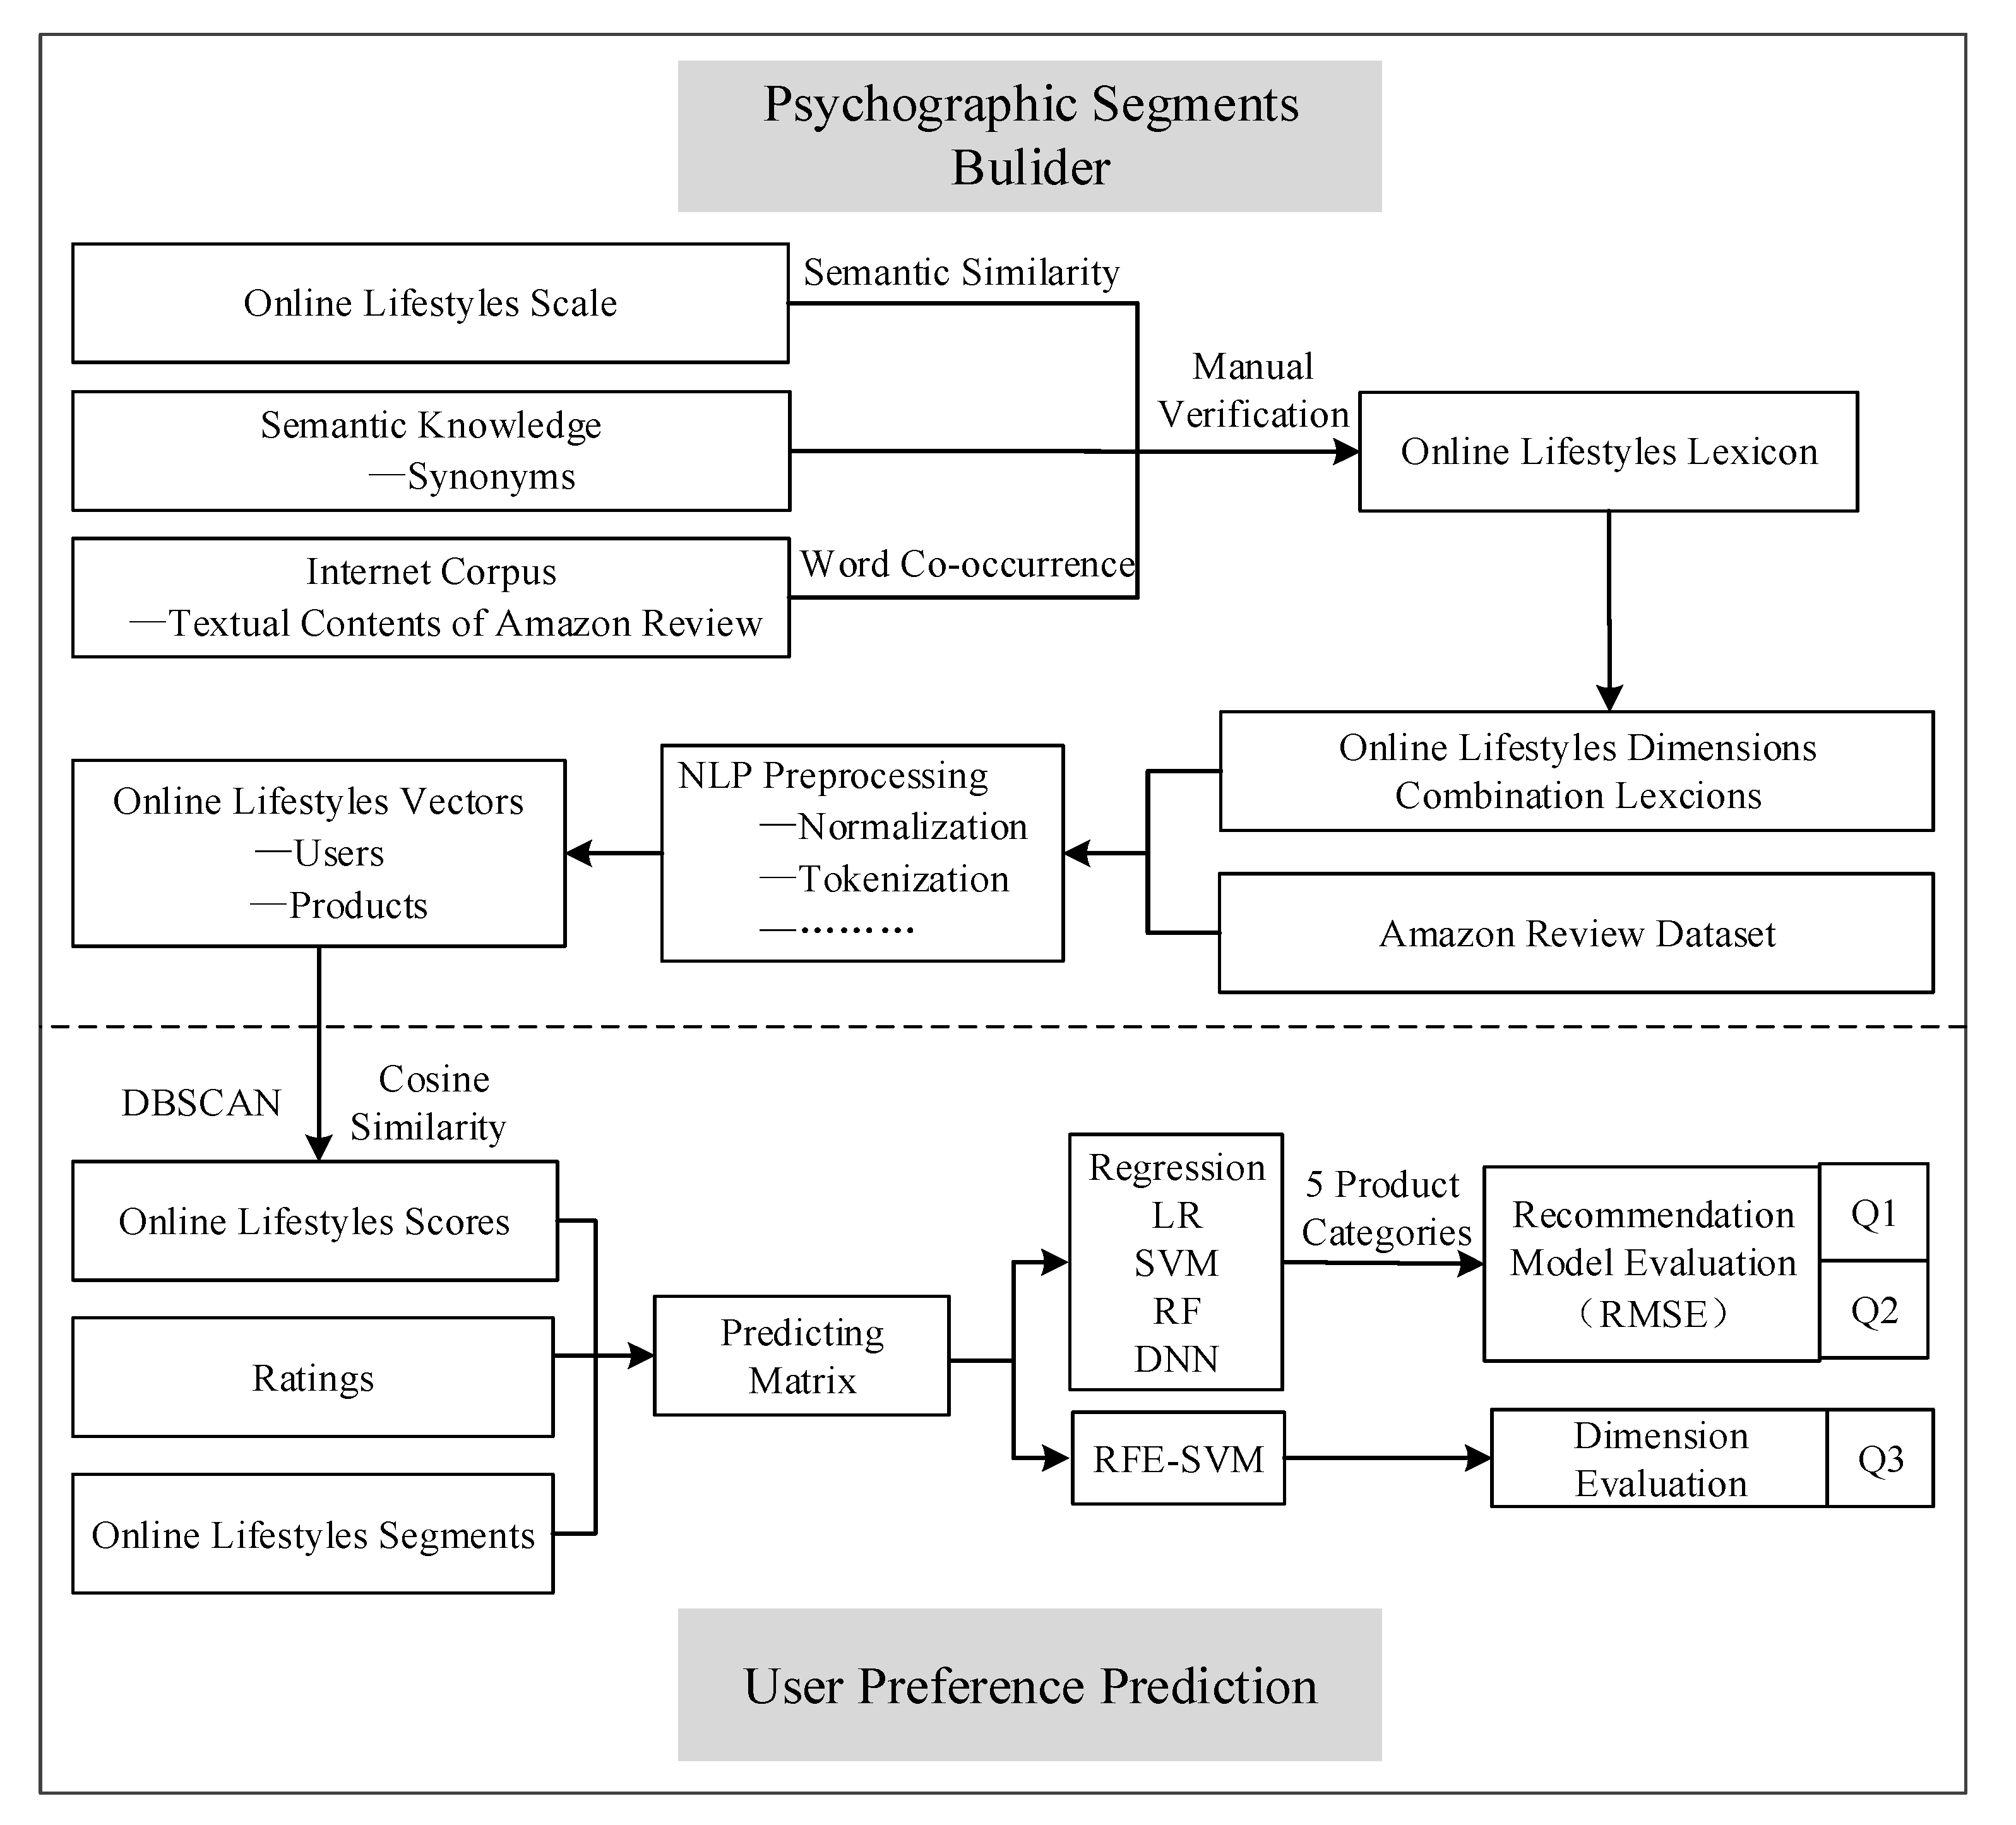
2. Literature Review and Research Design

In this section, we review the foundational work on consumer psychographics and trace its relationship with user preferences, particularly in online scenarios. Building on the current development in online behavioral measures of psychographics, we then introduce and propose related methods and techniques in computer science and psycholinguistics. Finally, we organize and outline our research questions and framework.

2.1. Psychographic Segmentation

Market segmentation has had a longstanding history since Smith (1956) [18] first suggested it as a product differentiation strategy to increase competitiveness. It has been widely acknowledged as a fundamental tool in understanding customer behaviors [19,20]. Wedel and Kamakura (2012) defined segmentation as “a set of variables or characteristics used to assign potential customers to homogeneous groups” [21]. Segmentation is critical because a company has limited resources and must focus on how to best identify and serve its customers.
Initially, market segmentation was mainly rooted in personality profiles. The most frequently used scale for measuring general aspects of personality as a way to define homogeneous submarkets is the Edwards Personal Preference Schedule. Generally, however, early studies based on Edwards Personal Preference Schedule were plagued with low and even inconsistent correlations with customer behavior and preferences, and hence failed to satisfy marketers’ needs [22]. One of the main reasons was that the studies used standardized personality tests that were originally developed in clinical or academic instead of business contexts [23]. Since then, the Big Five Factor personality traits—that frequently and consistently appeared in most attempts to define the basic human factors, that is, neuroticism, extraversion, agreeableness, conscientiousness and openness—have replaced the Edwards Personal Preference Schedule.
Lifestyle is defined as a set of behaviors that mirrors individual psychological considerations and sociological consequences [24], and is more valid in shaping individual behavior compared to personality traits. The lifestyle construct used in market segmentation is based on research on motivation [23] and personal values [22]. Mitchell (1994) proposed that lifestyle is a mixture of a personal life and perceived value, whereas value is a synthesis of individual attitudes, beliefs, hopes, prejudices, and demands [25]. Activities, interests, and opinions (AIO) is one of the most widely used lifestyle measurement tools [23]. It encompasses variables from rational, specific, and behavioral psychology fields as well as from sociodemographic attributes, and provides good insight into the lifestyles of individuals [26]. Indeed, individuals’ value priorities are part of their basic world views, and are commonly defined as desirable, trans-situational goals that vary in importance and serve as guiding principles in individuals’ lives [27]. Moreover, values are broader in scope than attitudes or the types of variables contained in AIO measures, and can be an important basis for segmentation. Generally, value inventories often only contain a handful of values instead of 200 or 300 AIO items. Therefore, scholars have begun to use simple, intuitive, and elegant values as another lifestyle-related psychographic segmentation method to replace the very extensive and burdensome AIO approach [22].
Early value-related works widely used three lifestyle measurements that are simpler alternatives to AIO: value, attitude, and lifestyle (VALS); list of values (LOV); and the Rokeach Value Survey (RVS). One of the most widely used value segmentation theories is the Stanford Research Institute’s consulting values and lifestyles (VALS2) typology, which contains 35 psychographic questions and four demographic questions that link demographics and purchase patterns with psychological attitudes [28].
The RVS proposed by Rokeach (1973) [29], LOV [30] developed by the Survey Research Center at the University of Michigan, and SVS [31] developed by Schwartz et al. approximately two decades ago, are three widely used instruments to assess individual values and lifestyles. RVS requires respondents to rank 18 terminal values and 18 instrumental values. The terminal values are considered to be either self-centered or society-centered, and intrapersonal or interpersonal in focus, whereas the instrumental values are moral values and competence. LOV, proposed by Kahle, Beatty, and Homer (1986) [30], is a shorter and more easily implemented instrument which includes only nine values. SVS is a more acceptable and widely used value instrument nowadays, and suggests that there are 10 primary values organized into a circumplex [27], as shown in Figure 1. This circumplex serves as the umbrella under which the majority of individual value judgments fall. Schwartz (2012) noted the shared motivational emphases of adjacent values: power (Pow), achievement (Achiev), hedonism (Hed), stimulation (Stim), self-direction (S-D), universalism (Univ), benevolence (Benev), tradition (Trad), conformity (Conf), and security (Sec) [27]. Although the theory underlying SVS discriminates 10 values, it postulates that, at a more basic level, values form a continuum of related motivations. The Schwartz value implies that the entire set of 10 values relates to any other variable (e.g., behavior, attitude, age, etc.) in an integrated manner.

2.2. Psychographic Segmentation and Consumer Behavior

Market segmentation consists of viewing a heterogeneous market as a number of smaller homogeneous markets, with differing product preferences among important market segments for the purpose of developing better firm strategies. Consumer behavior and predictive preference models can be much more effective when the target audience is split into different customer segments and individually tailored predictive models are developed for each segment [32], with some of them based on psychographics.
Researchers have based the psychographic segmentation of markets on various factors, including personality, lifestyle, and values. Early psychographics mainly considered personality, but research based on one of the personality profiles, that is, Edwards Personal Preference Schedule, failed in predicting consumer purchase decisions. Other scholars used the BFF personality model. Hirsh, Kang, and Bodenhausen (2012) surveyed people about various marketing messages and found that people respond more positively to messages tailored to their personality [33]. In the music domain, I Fernández-Tobías et al. (2016) showed that online music recommendations are more successful when they leverage the correlations between people’s personality and their music preferences [34]. Similarly, Karumur, Nguyen, and Konstan (2016) discovered correlations between personality and movie preferences among Netflix users [35]. Additionally, studies in marketing have found that personality explains only a surprisingly small amount of the overall variance in consumer behavior [11].
Various studies have been conducted on the effect of user lifestyles on consumers’ products purchases [36] and preferences [37,38]. The comprehensive results have confirmed the effect of consumer lifestyle in predicting users’ online preferences. Lee et al. (2009) assessed consumer lifestyles regarding the adoption of electronic products, and the results based on structural equation modeling demonstrated that consumer lifestyle factors (fashion consciousness, leisure orientation, internet involvement, and e-shopping preferences) are direct and indirect antecedents of consumers’ intentions to adopt high-tech products [36]. Based on the AIO survey, Piazza et al. (2017) investigated the relationship between lifestyle and online user preferences, and found that there are weak monotonic correlations between Facebook likes and the lifestyles of individuals [38]. Based on a web-usage lifestyle scale developed by AIO, Pan et al. (2014) applied a tagging method to identify online lifestyles and to make recommendations according to the similarity of a user lifestyle tag to a telecommunications company product lifestyle tag [37].
In addition to lifestyle and personality, the relationship between value and consumer preferences has also been asserted. Scholars have used the LOV construct in relation to consumer fashion leadership [39], involvement [40], and brand preferences [41]. Based on questionnaire data, Weng and Run (2013) investigated the effects of Malaysian consumers’ personal values using mainly LOV measurements with regard to their overall behavioral intention and purchase satisfaction [42]. Fraj and Martinez (2006) adopted VALS and identified which values and lifestyles best explain environmentally friendly behaviors [43]. Based on RVS, Padgett and Mulvey (2007) demonstrated that technology must be leveraged via links to customer values [44]. Wiedmann, Hennigs, and Siebels (2009) constructed a luxury-related value for identifying different types of luxury consumers, and found that hedonic value aspects as components of the SVS of self-directed pleasure and life enrichment were most important for their perception of luxury value [45].
The combination of segmentation and prediction, where segmentation is used to help build segment-wise prediction models, has been a common segmentation approach and has been applied to different business scenarios. Antipov and Pokryshevskaya (2010) conducted user segmentation research based on the decision tree method and then built a separate logistic regression scoring model for each segment using the churn dataset [46]. Reutterer et al. (2006) proposed a two-stage approach for deriving behaviorally persistent segments and predicting a customer’s tendency to symptomatically (re)purchase using retail purchase history data [47]. Ge et al. (2011) exploited multifocal learning to divide consumers into different focal groups and automatically predict a problem category based on real-world customer problem log data [48].

2.3. Behavioral Measures of Psychographic Segmentation

Although it plays a promising role in predicting online user preferences, psychographic segmentation has not been widely studied in online shopping scenarios. There are two main reasons. First, data collection for such research typically requires online customers to complete lengthy surveys and, therefore, cannot be easily applied on a large scale. Second, acquiring the abstract psychographic characteristics of online customers through the mandatory selection of questionnaires is plagued by issues of reliability and validity for the questionnaire [16]. At the present time, with the in-depth development of big data techniques, researchers can access a large number of open-ended reports of user psychological characteristics embedded in user-generated content (UGC). In recent years, an increasing number of studies have demonstrated that such reports are ecologically valid and driven entirely by what people say they are doing and thinking, in their own words [16].
Psychology and marketing research indicate that human language reflects psychological characteristics. The frequency with which we use certain categories of words provides clues to these characteristics. Several researchers have found that variations in word use embedded in writing such as blogs, essays, and tweets can predict aspects of personality, thinking style, social connections, and purchase decisions [49,50,51]. These works, that explore the feasibility of deriving psychological characteristics from UGC text, have demonstrated that computational models based on derived psychological characteristics have competitive performance compared with models using a self-reported questionnaire [52,53]. Research indicates cases in which natural language data have provided a clearer picture of people’s cognitive and behavioral processes than data collected from a traditional and widely used self-report survey [16].
As one of the psychographic segmentations, human values are thought to become generalized across broad swaths of time and culture, and are deeply embedded in the language that people use every day [12]. Therefore, values could be extracted from a user’s online words using behavior. Boyd et al. (2015) investigated the link between user word use behavioral measurements and Schwartz value scores, and proposed the theme words associated with each SVS value dimension [16]. Regarding personality, Yarkoni (2010) reported individual words used in online blogs (N = 694) that positively and negatively correlated with personality [17]. These works constitute a proof-of-concept study that demonstrates the utility of relying on natural language markers of abstract psychological phenomena, including values and personality, and present significant opportunities to better predict and understand their connection to consumers’ behaviors and thoughts in a broader sense.

2.4. Research Questions and Design

2.4.1. Q1: What Is the Predictive and Explanatory Power of Psychographic Segmentation in E-Commerce User Preferences?

Marketers and scholars have highlighted the need to account for customer perceptions and expectations in a specific market segment. In the offline context, relationships between psychographic segmentation and user behaviors and preferences have been asserted in various scenarios, and results have demonstrated that psychographic variables are effective in understanding and predicting user behaviors and preferences [26,54]. However, in the e-commerce context, the potential predictive and explanatory power between segmentations—particularly psychographic variables and the clustering method—in predicting e-commerce consumer preferences has not been comprehensively studied.

2.4.2. Q2: What Are the Differences between SVS and BFF Segmentation in Predicting and Explaining E-Commerce User Preferences?

Researchers argue that values are a useful basis for segmentation or psychographics because, compared with AIO, values are less numerous, more central and, compared with personality, more immediately related to motivations and consumer behaviors [21]. The comparison between personality and values mostly shares the context of brand preference. For example, Mulyanegara (2009; 2011) compared the predictive power of personality and values on brand preferences within a fashion context and found that values are indeed better predictors of brand preferences [55,56]. Although scholars have studied the predictive and explanatory power of psychological segmentation on consumer behavior, few studies have examined the relative importance of different psychographic variables, that is, personality and values, in understanding e-commerce consumer behavior.

2.4.3. Q3: What Is the Adaptability of Psychographic Measurements in Predicting and Explaining E-Commerce User Preferences?

As two of the psychographic measures, the SVS and BFF models have been proven to improve the understanding of consumer purchase behaviors and preferences. However, Schwartz (2012) highlighted that not all value dimensions can effectively predict individual behaviors [27]. In an online context, it is reasonable to partition the value items into more or less fine-tuned distinct values according to the needs and objectives of the analysis.

2.4.4. Overview

Psychographic segmentation has been criticized by the well-known public opinion analyst and social scientist Daniel Yankelovich, who said that psychographics is “very weak” at predicting people’s purchases, making it a “very poor” tool for corporate decision-makers [57]. Studies have demonstrated that there is a significant difference between customer behaviors among different product types [58]. Different segment groups create different purchasing patterns. However, the relationship between segmentation and user buying behavior and preferences is strongly affected by the product category [42,59]. In recent years, deep learning has made great progress and has demonstrated significantly better performance compared to traditional algorithms in online big data environments. Considering the scale of online user preferences, the use of deep neural networks (DNNs) will potentially make better psychological segmentation-based preference regression models.
In this research, we introduce empirical evidence in psycholinguistic research and the recent progress of DNN algorithms in identifying and integrating consumer psychographic segments from online shopping behaviors, and investigate its performance in an e-commerce consumer preference regression model. Moreover, accounting for the predictive and explanatory power of psychographic segmentation in e-commerce consumer preferences, we use both RMSE and R2 to conduct evaluations across five product categories. Figure 2 shows the overview of our research.
In the next section, we present the results related to the three main study questions in this research. Additionally, we investigate the promising influence of the product category and preference regression method that supports our research.

3. Methodologies

We now describe the proposed approach, beginning with intuition and then going into detail. Given that Amazon.com is the most studied online consumer domain in the context of e-commerce, we used Amazon consumer behavior data to present our methods. In this section, we introduce our methods, and apply these methods to identify Amazon customers’ SVS and BFF scores to predict their online preference.

3.1. Word Use-Based Psychographic Inference

Lexicon is the basis for utilizing customer word use behaviors to automatically extract psychological traits. The combination of semantic knowledge and online corpora not only utilizes the semantic relationships as prior knowledge to provide accurate seed words but, also, help to foster the word association information, such as term position and word co-concurrency in the corpus [60]. Based on semantic knowledge and Amazon corpus, our research applies the NLP method to automatically construct SVS and BFF consumer psychographic lexicons for consumer value and personality identification. First, we obtained two seed words according to the SVS- and BFF-related word use behavior proposed by prior psycholinguistic works. Second, we applied the semantic knowledge embedded in WordNet, which is an English lexical database, to extend the seed words. Third, we further extended these seed words on the large-scale Amazon consumer review corpus, to construct the psychographic lexicons. Finally, we calculated the multidimensional psychographic scores for consumers and products based on the lexicons and consumer online reviews.

3.1.1. Construction of Psychographic Seed Words by Psycholinguistics

The empirical evidence between psychographics and consumer word use behavior is the solid basis for seed word set construction. Boyd et al. (2015) provided three value-related word use behavior sources: self-report “Value Essay”, Self-Report Behavior Essay, and Facebook updates. They then presented the theme words as positive or negative using the Schwartz values [16]. Basically, we combine these three sources to build two SVS lexicon seed word sets. However, there are some contradictions, such as that Religion-related words in the Value Essay are negatively related with Self-Direction (R2 ≥ 0.01), but in the Self-Report Behavior Essay, these words are positively related with user Self-Direction (R2 ≥ 0.01)]. Considering that behavioral measures tend to outperform self-report as addressed by Boyd et al. 2015, we give priority to the user behavior measurement or the use of words in Facebook updates. Similarly, the work of Yarkoni (2010) provides the basis to construct BFF seed word sets [17]. Table 1 and Table 2 summarize themes related to SVS and seed words related to BFF; see Boyd et al. 2015 for more details.
WordNet is a large English lexical database that groups nouns, verbs, adjectives, and adverbs into sets of cognitive synonyms, each expressing a distinct concept. Synonym sets are interlinked by means of conceptual semantic and lexical relations. WordNet’s structure makes it a useful tool for NLP. Based on WordNet and the psychographic seed words, we extracted the related words by following the Synonym Rule: for each positive seed word, its synonym is considered to have the same SVS or BFF dimension. Therefore, we obtain the consumer psychographic (SVS and BFF) candidate thesaurus composed of seed words and their synonyms from WordNet.

3.1.2. Psychographic Candidate Thesaurus Extension by Amazon Corpus

Consumer word use behaviors in UGC are very diverse. For one thing, the WordNet-based word extension ignores contexts where words often have different meanings [49,61]. The word “depressed”, for example, can variously refer to sadness, an economic condition, or even the physical state of an object. Thus, in specific online shopping context, it is difficult to identify a potential word use characteristic using the candidate thesaurus alone.
In recent years, many scholars have adopted an NLP method called word embedding to discover new context-wise words in which a specific meaning is embedded. Based on the large-scale internet corpus, these methods have achieved remarkable progress [62]. Word embeddings map words to high-dimensional numerical vectors that contain the semantic information in these words. The basic idea of our method is to map each word into a K-dimensional vector space through word embeddings and to calculate the semantic similarity between words in corpus and words in a thesaurus using the cosine distance between vectors. Based on the psychographic candidate thesaurus, we use Word2Vec to construct word vector models which can identify new words in large-scale internet corpora by word similarity.
We apply cosine distance to measure word semantic similarity between word vectors in the psychographic candidate thesaurus and the corpus. Let w o r d 1 = ( v 1 w 1 , v 2 w 1 , v m w 1 ) , w o r d 2 = ( v 1 w 2 , v 2 w 2 , v m w 2 ) , where m is the word vector dimension; we use m = 200 in our experiments. We can then write cosine distance as follows:
s i m ( w o r d 1 , w o r d 2 )   = c o s θ =   k = 1 m v k w 1 × v k w 2 k = 1 m ( v k w 1 ) 2 × k = 1 m ( v k w 2 ) 2 ,
where the numerator represents the dot product of the two vectors and the denominator represents the modular product of the word vectors.
Based on the cosine distance, we utilize the Top10 algorithm in the Gensim [63] software implementation of Word2vec to calculate the 10 most similar words to the seed words in the thesaurus. We set 0.45 as the threshold for the similarity value according to our empirical results, and traverse the word embedding trained on Amazon corpus [64] to obtain the top 10 most similar words for the psychographic (SVS and BFF) candidate thesaurus. We then extend the candidate thesaurus by adding the top 10 most similar words. We obtain the final candidate thesaurus by carrying out the above procedure repeatedly, until there are no new words to be extracted.
Considering that consumer online word use is sometime ambiguous and that the adjacent values of psychographic are continuous, we calculate multidimensional values corresponding to the psychographics for every candidate word. According to the online psychographic score equation below, we calculate the semantic distances between each pair of words in the extended psychographic seed word sets to obtain the score of the word in all SVS or BFF dimensions. The online psychographic scores equation is
w o r d p s y _ s c o r e s ( w e x t , w p s y d i m )         = M a x { s i m ( w e x t , w s e d 1 ) , s i m ( w e x t , w s e d 2 ) , , s i m ( w e x t , w s e d p ) } ,
where w e x t is a word from the final online psychographic candidate thesaurus, w p s y _ d i m is a specific psychographic dimension, w s e d 1 and w s e d 2 , …, w s e d p are seed words attached to w p s y _ d i m in the candidate thesaurus constructed in Section 3.1.1. In addition, three experts are hired to manually verify the SVS and BFF lexicon and to remove words marked as irrelevant by at least two experts. We then get positive or negative SVS and BFF lexicons with similar meanings to the seed words included.

3.1.3. Lexicon-Based Psychographic Inference

We define the p-dimensional positive/negative psychographic scores attached to an consumer/product as L = { L 1 , L 2 , , L p } , user/product reviews set as { r 1 , r 2 , , r m } , and the total number of a user’s reviews as m and one of the review r i as { w i 1 , w i 2 , , w i n } , where n is the total number of words in the review. According to the psychographic lexicon, we calculate consumer psychographic scores using Equation (2), where p-dimensional psychographic scores are defined as L u L p u , where wij is the psychographic score attached to a word in the consumer reviews.
L u L p u = i = 1 m j = 1 n w i j
The values are normalized as
L 10 u =   L u M a x ( L 10 u ) .
Overall, we calculate the positive and negative psychographic (BFF and SVS) scores for each consumer and product in the Amazon review dataset.

3.2. User Preference Prediction Based on Psychographic Segmentation and Neural Network

Based on the psychographic inference method, we obtained the psychographic scores for each consumer and product in the Amazon dataset. In this section, we further introduce density-based spatial clustering of applications with noise (DBSCAN) and a few regression methods, including DNN, to predict user preference.

3.2.1. Psychographic Segmentation Based on DBSCAN

Clustering-based segmentation is often used to categorize consumers on the basis of the relative importance they place on various product attributes, benefits, personality, and value [45,65]. DBSCAN cluster analysis does not require one to specify the number of clusters in the data a priori, as opposed to k-means. DBSCAN can find arbitrarily shaped clusters. It can even find a cluster completely surrounded by, but not connected to, a different cluster. We conduct DBSCAN on the consumers’ psychographic scores, namely, the SVS and BFF scores (see Section 3.1). In the subsequent e-commerce consumer preference-predicting process, we predict the preferences based on the positive and negative consumer/product psychographic scores and the segmented groups they belong to.

3.2.2. User Preference Prediction Based on Psychographic Segmentation and Deep Neural Network

Let U and I be the number of consumers and products, R the training interaction matrix, and R ^ the predicted interaction matrix. Let Y be a set of y u , i , Y ^ be a set of y ^ u i , y u i be the preference of user u to product i , and y ^ u i denote the corresponding predicted score. We use a partially observed vector (rows of the   features   set X   and   X ^ ) as a combination of consumer representation x ( u ) and product representation x ( i ) , where x ( u ) = { u P 1 p s y , u P 2 p s y , u P D p s y , u N 1 p s y , u N 2 p s y , , u N D p s y } , x ( i ) = { i P 1 p s y , i P 2 p s y , , i P D p s y , i N 1 p s y , i N 2 p s y , , i N D p s y } . u P D p s y and u N D p s y represent positive and negative psychographic scores, respectively, “psy” represents psychographic methods (SVS or BFF), and P D and N D represent the number of dimensions of psychographic lexicons (positive or negative), respectively. We define R as { X , Y } and R ^ as { X ^ ,   Y ^ }. Then, we conduct three main segment-wise regression algorithms to build the preference-predicting models.
Random Forest (RF): RF has been shown to be effective in a wide range of segment-wise user preference predicting problems [66]. Random forest is an ensemble of binary trees { T 1 ( X ) , , T B ( X ) } , where X = x ( u ) x ( i ) = { x 1 , , x P } is a p-dimensional vector of molecular descriptors or properties associated with a molecule. Each of these trees is stochastically trained on random subsets of the data. The ensemble produces B outputs { Y ^ 1 = T 1 ( X ) , , Y ^ B = T B ( X ) } , where Y ^ b ,   b = 1 , , B is the prediction for a molecule by the b th tree. Outputs of all trees are aggregated to produce one final prediction. Y ^ in regression is the average of the individual tree predictions.
Support Vector Machine (SVM): The ability of the support vector machine has been recognized in automated user/product modeling to predict retailer outcomes [67,68]. An SVM discriminates between data by constructing a hyperplane w T φ ( X ) + b = 0 by minimizing w 2 2 + C ϵ i , subject to y i ( w T φ ( x i ) + b ) 1 ϵ i , ϵ i 0 i , where φ ( x i ) is either x i or a higher dimensional representation of x i , C is the cost parameter, w is the weight vector, ϵ i is margin of tolerance where no penalty is given to errors [69].
Deep Neural Network (DNN): Thanks to deep learning’s (DL) capability in solving many complex tasks while providing state-of-the-art results, academia and industry alike have been in a race to apply deep learning to a wider range of applications [70]. Although neural networks are widely used in market segmentation [71,72], few researchers have introduced deep neural networks (DNNs) into market segmentation to predict user preferences. DNN enables effective capture of non-linear and non-trivial user-product relationships. A typical DNN consists of an input layer, a few hidden layers, and an output layer with number of nodes equal to the cardinality of categories. We use the typical mean square error (MSE), i.e., i = 1 B ( y i y i ^ ) 2 as a loss function of our DNN method, where y i ^ = h ( g ( x i ) ) , g is some linear combination of node values in the hidden layers of the network, and h is an activation function (typically sigmoid or hyperbolic tangent function). Training a neural network involves minimizing the loss function defined above using gradient descent and backpropagation of the gradient across multiple hidden layers to update the weights between nodes. Here, we initialize the weight using Gaussian distribution with expectation 0 and variance 1, then form a neural network with two hidden layers for consumer preference regression tasks.

3.3. Evaluation

RMSE and R2 are two of the most widely used consumer preference evaluation methods for rating prediction and can reflect the performance of psychographic segmentations in user preference and rating prediction. We apply both in an evaluation method for the prediction. Let y ^ u , i be the predicted ratings, y u ,   i the true ratings, y u ¯ the mean rating for consumer u, and n the size of test dataset. Then, RMSE and R2 are defined as follows:
RMSE = 1 n i = 1 n ( y u ,   i y ^ u , i ) 2 ,
R 2 = i = 1 n ( y ^ u , i y u ¯ ) 2 i = 1 n ( y u ,   i y ^ u , i ) 2 i = 1 n ( y u ,   i y u ¯ ) 2 .

4. Experiment

In the previous section, we have constructed the positive and negative e-commerce psychographic lexicons, namely SVS-pos, SVS-neg and BFF-pos, BFF-neg lexicons (see S1.csv, S2.csv, S3.csv and S4.csv respectively in supplementary materials for more details), and conducted e-commerce consumer segmentation based on the identified SVS and BFF scores and DBSCAN. In this section, we further proposed a DNN method to build the segment-wise consumer rating regression model. Then, we proceeded to utilize the online shopping data in Amazon to conduct our experiments.

4.1. Dataset Description

Amazon is one of the largest e-commerce platforms in the world and has accumulated a large amount of user buying behavior data. The Amazon review dataset, published by McAuley et al. [64], contains product reviews and metadata from Amazon.com, including 142.8 million reviews spanning from May 1996 to July 2014. We selected 5 review datasets from 5 product categories according to “K-core” values of “10”, whereby each of the remaining users or items have at least 10 reviews. According to the work by Arnoux et al. (2017) [73], we consider that 10 reviews (whereby the average length of review is 189 words) is capable for consumer/product psychographic inference and comparable to 25 tweets. Table 3 shows the detailed dataset description.
The sample review shows details about our data:
{
 “reviewerID ‘: ’A2SUAM1J3GNN3B”,
 “asin‘: ’0000013714”,
 “reviewerName‘: ’J. McDonald”,
 “helpful‘: [2,3],
 “reviewText‘: ’I bought this for my husband who plays the piano. He is having a wonderful time playing these old hymns. The music is at times hard to read because we think the book was published for singing from more than playing from. Great purchase though!”,
 “overall”: 5.0,
 “summary‘: ’Heavenly Highway Hymns”,
 “unixReviewTime”: 1252800000,
 “reviewTime‘: ’09 13, 2009”
}

4.2. Experimental Procedure

The data processing process is divided into the following steps. Figure 3 shows the whole picture of our experiment process across Section 3 and Section 4.
First of all, we keep the “reviewerID”, “asin”, “overall”, “reviewText”, and “summary” tags in the seven datasets above and combined “reviewText” and “summary” as the word use behaviors in recognized online psychographics.
Second, we conduct text preprocessing, including normalization, tokenization, removing stop words, and stemming on the textual contents using Amazon reviews and lexicons by Python, machine learning tool Scikit-learn (https://scikit-learn.org/stable/modules/generated/sklearn.cluster.DBSCAN.html) and the Natural Language Toolkit (NLTK) [74]. Normalization is a process that converts a list of words to a more uniform sequence. Given a character sequence and a defined document unit, tokenization is the task of chopping it up into pieces, called tokens. Some extremely common words in reviews, which would be of little value in helping select texts matching our need, are excluded from the vocabulary entirely. These words are called stop words. The goal of stemming is to reduce inflectional forms, and sometimes derivationally related forms of a word, to a common base form. We perform stemming by Lancaster Stemmer in NLTK on both words in lexicon and reviews. We removed stop words using the English stop word list in NLTK, obtained the of words in lowercase using the text lower method in Python, and conducted Z-score normalization using scale method in Scikit-learn. Based on the SVS-pos, SVS-neg, BFF-pos, and BFF-neg lexicons in Section 3.1, and all the data preprocessing steps above, we calculate the psychographic scores by matching the used words and the words in these lexicons. Thus, we get the SVS and BFF scores for each Amazon consumer and product.
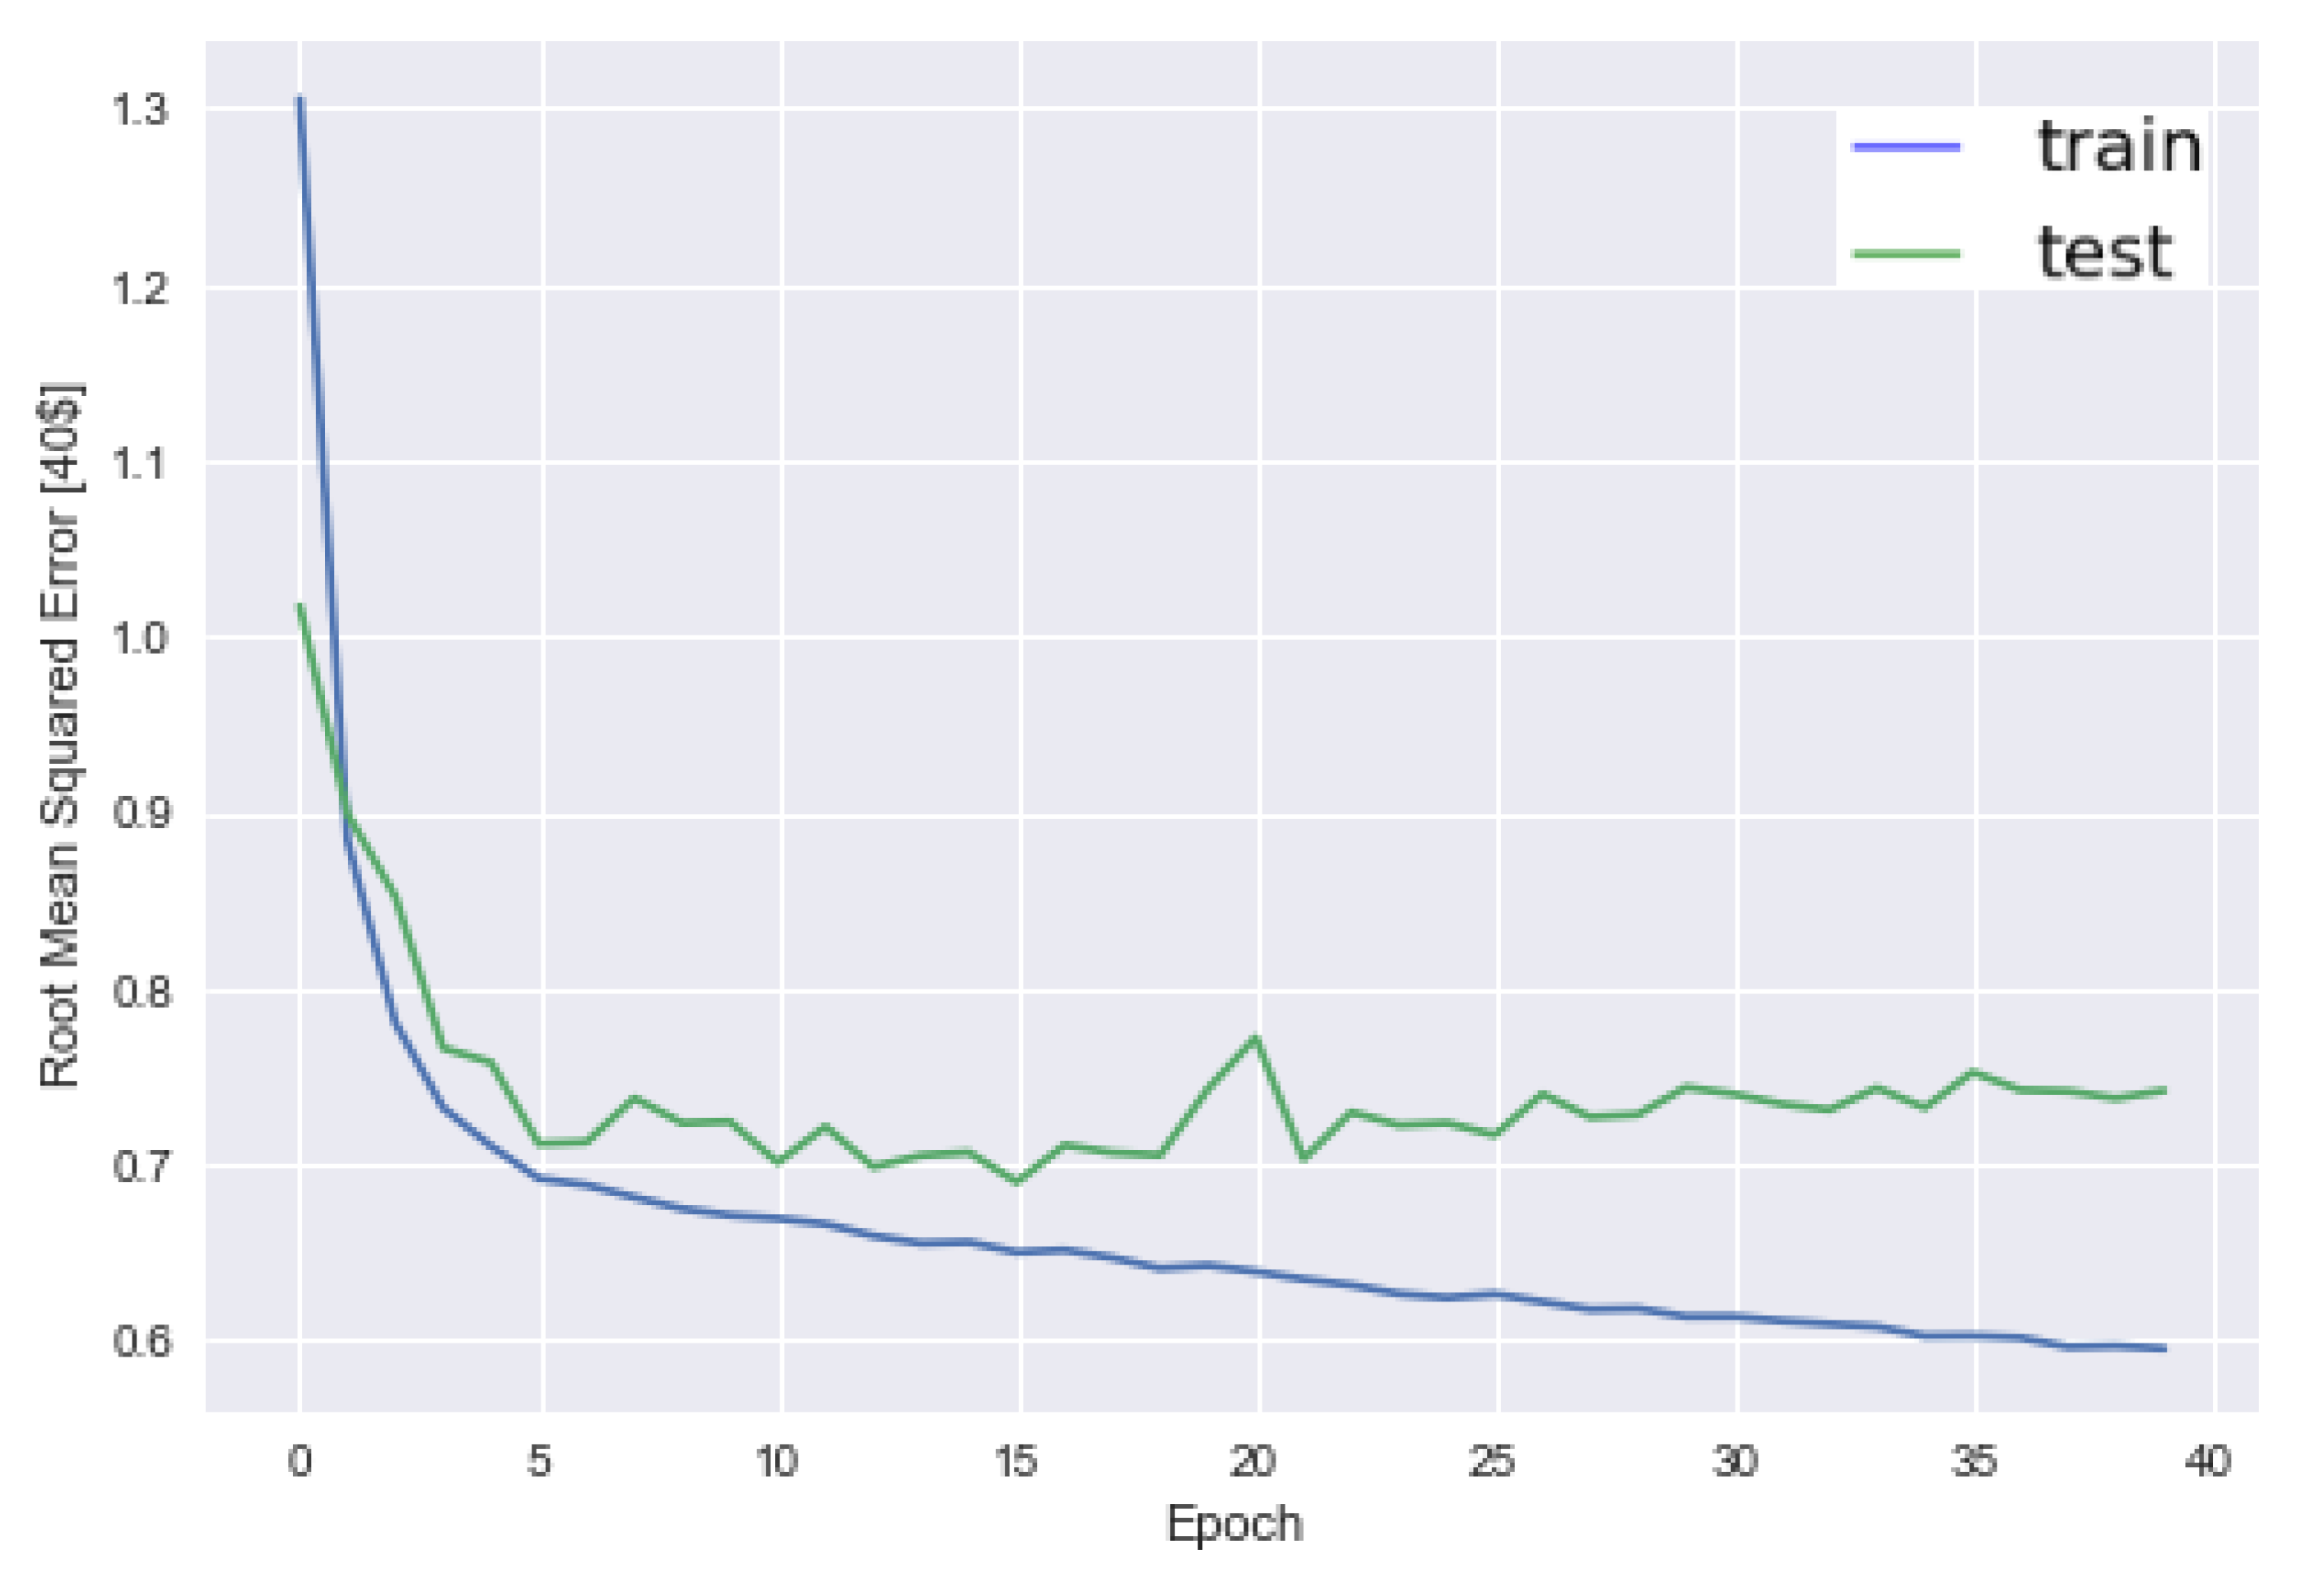
Third, for each of the product categories, we perform the DBSCAN algorithm in the consumers’ SVS or BFF scores, using Scikit-learn, to get the consumers’ positive and negative psychographic scores and attached psychographic segment tags. We then build the rating predicting dataset which combines psychographic scores (as independent variables) with the rating given by the consumer to the product (as a dependent variable). We also construct feature sets for each product category which contains random values between 0 and 1 as the control group. For each of these datasets, we optimize the parameters for DNN by gradient descent. The optimal number of epochs (a single pass through the full training set) used for the neural network algorithm is decided by the performance on the validation set. For SVM, we use the validation set for optimizing the cost parameter C. We use Scikit-learn (https://scikit-learn.org/stable/modules/generated/sklearn.linear_model.LinearRegression.html) implementation of linear regression (LR), SVM with a radial basis function kernel, random forest, and Keras implementation of Google TensorFlow software (https://www.tensorflow.org) for developing DNN and baseline. A 5-fold cross-validation is applied to select training and test datasets for each fold and avoid overfitting for linear regression, SVM, RF, and DNN. An example of RMSE evolution with epochs for DNN is shown in Figure 4. In Figure 4, we can see that the best epoch is around 15.
Fourth, we apply feature ranking with a recursive feature elimination method to investigate the feature importance of different psychographic subdimensions in understanding consumer online preference. The support vector machine-based recursive feature elimination (RFE-SVM) approach is a popular technique for feature selection and subsequent regression task, especially in predicting consumer preference [75]. At each iteration, a linear SVM is trained, followed by removing one or more “bad” features from further consideration. The quality of the features is determined by the absolute value of the corresponding weights used in the SVM. The features remaining after a number of iterations are deemed to be the most useful for discrimination and can be used to provide insights into the given data [76]. By introducing the RFE-SVM in segment-wise consumer rating prediction, we can dive into the subdimensions of SVS and BFF to explore whether these dimensions are effective in predicting and explaining preferences.
Finally, we perform an online consumer preference-predicting experiment that contains 5 product categories * 4 predictive algorithms (LR, SVM, RM, NN) * 3 psychographic variables tools (Random, SVS, and BFF) * 2 clustering method (clustering consumers based on DBSCAN or not).
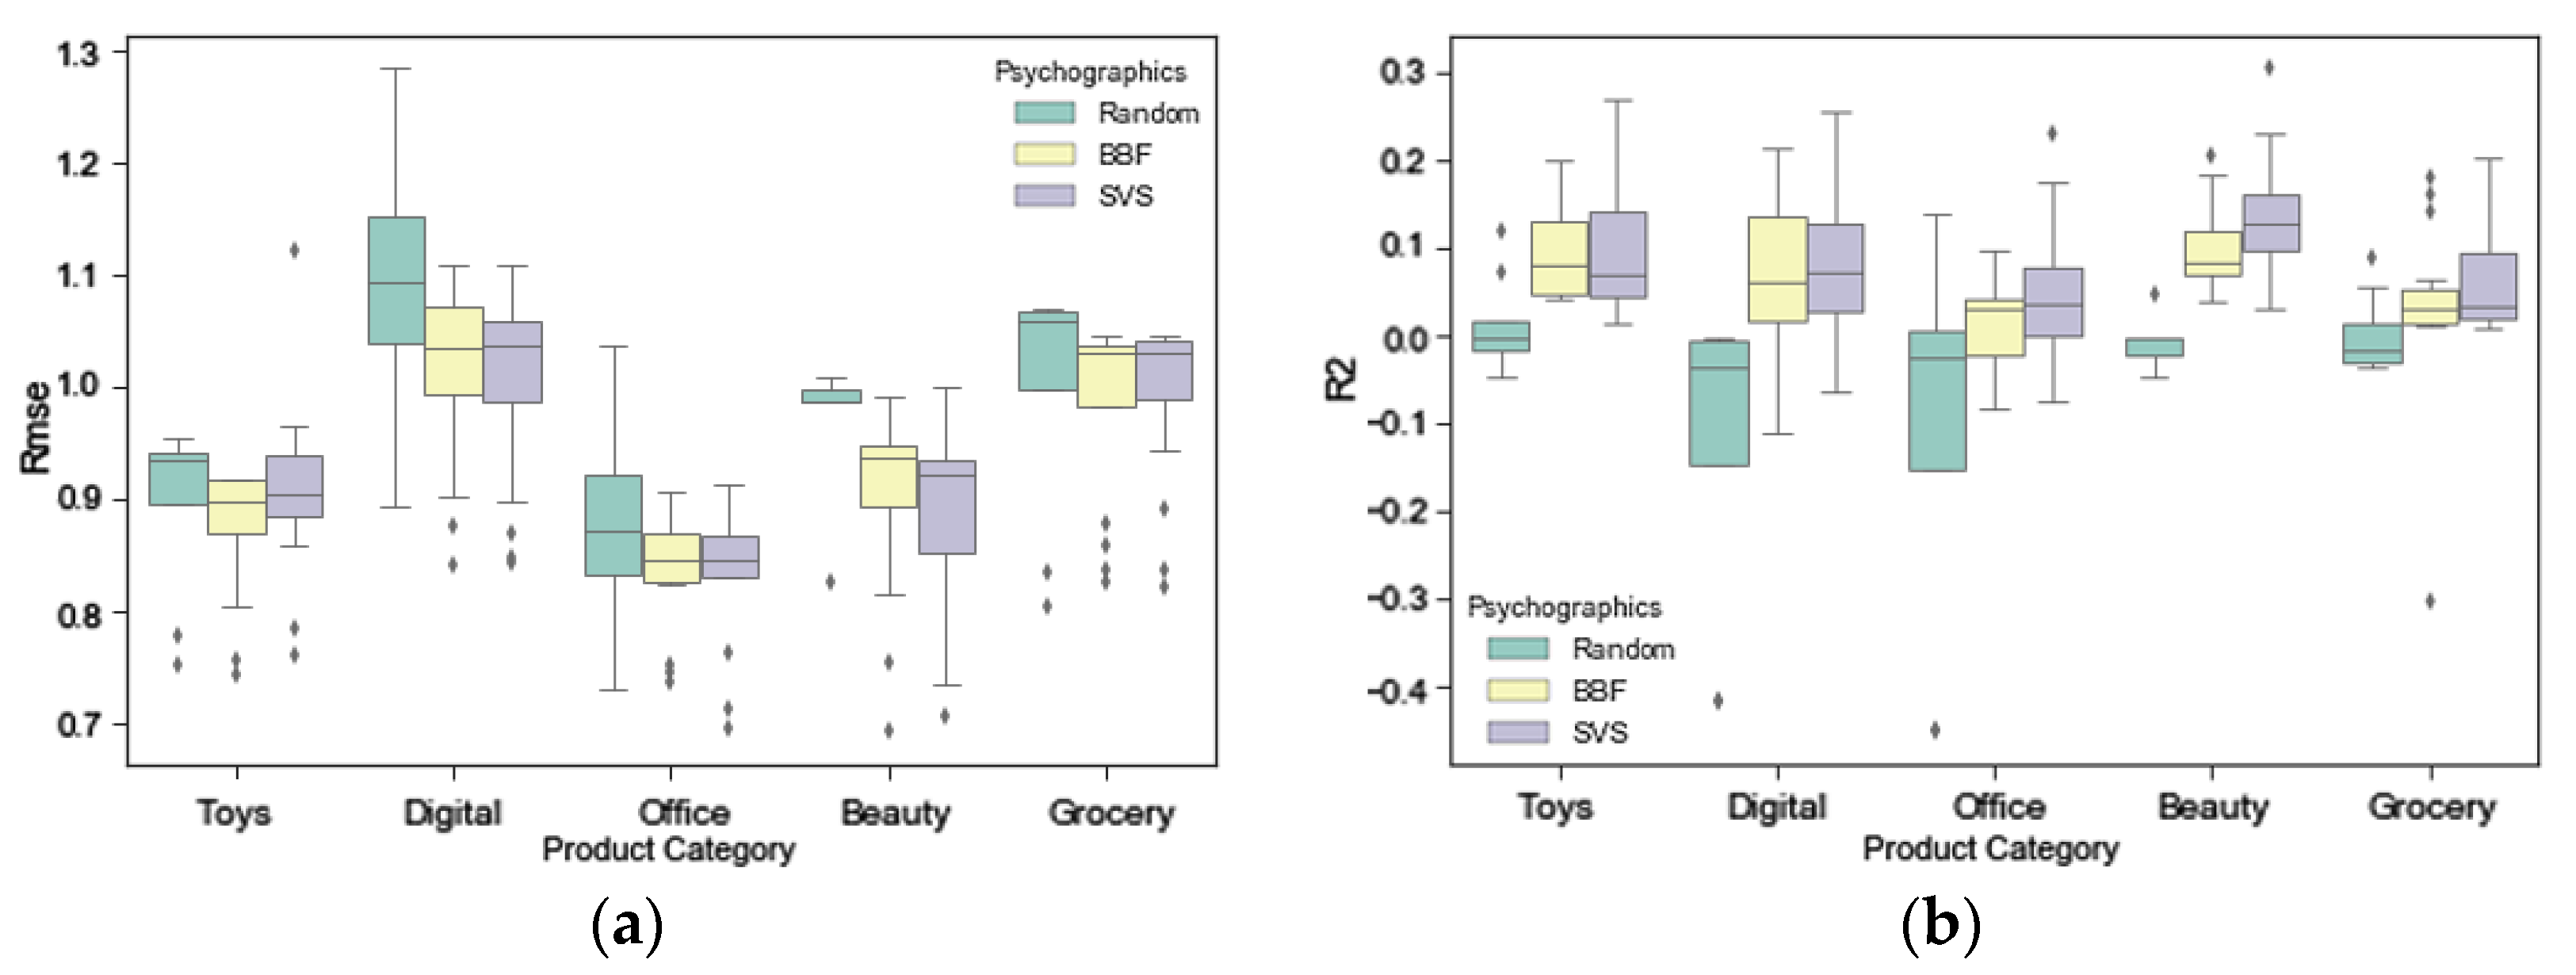
5. Result Analysis

5.1. Analysis of the Significance of Different Experimental Settings in Predicting and Explaining E-Commerce User Preferences

We evaluate the predictive and explanatory power of user preference prediction based on LR, support vector machine (SVM), random forest (RF), and DNN, integrating consumer psychographic segmentation across different Amazon product categories. Table 4 shows part of the results of RMSE and R2 under different experimental settings for the user preference prediction process. The nine columns are “ProductCatrgory”, “ClusterId”, “SampleNum”, “Psychographic Variable”, “Clustering or Not”, “RegressionMethods”, “RMSE”, “R2” and “ReviewLen”. The “ProductCatrgory” column contains five Amazon product categories from Table 3; “ClusterId” is the tag for each segment; “SampleNum ” is the number of Amazon consumer ratings and reviews; “Psychographic Variables ”; “ Psychographic Variables” is the psychographic variable that we use to perform consumer segmentation; “Clustering or Not” is the experiment setting of applied DBSCAN clustering that determines whether consumer segmentation is performed; “RegressionMethods” is the regression model used in preference prediction; and “RMSE” and “R2” are the RMSE and R2, respectively, for regression model evaluation; “ReviewLen” is the average amount of words in review for each dataset. We perform analysis of variance (ANOVA) on the results to test whether different experimental settings (product category, predictive algorithms, psychographic variables, and clustering or not) have an influence on the performance (R2 and RMSE) of preference prediction.
Table 5 shows the ANOVA results which demonstrate that the product category, clustering method, and regression methods have a significant effect on both R2 and RMSE (p-value < 0.000). For the segmentation variables that we use (SVS, BFF, and random segmentation), there are significant differences between the three groups (p-value < 0.05) for R2, whereas the difference is not significant for RMSE.

5.2. Analysis of the Effect of Psychographic Segmentation on Predicting and Explaining E-Commerce User Preferences

To investigate our three main questions, we further compare the differences between the SVS, BFF, and random segmentation, and their subdimensions, in predicting and explaining consumer preferences, while excluding the influence of other experimental settings.

5.2.1. Q1: Analysis of the Effect of the Clustering-Based Segmentation in Predicting and Explaining User Preferences

We conduct Tukey’s range test, which is a single-step multiple comparison procedure and statistical test, on Table 4. Table 6 shows the Tukey’s range test results for the preferences based on the psychographic variables and DBSCAN segmentation method. Surprisingly, we can see that there is no significant difference in both RMSE and R2, regardless of whether we use DBSCAN to obtain psychographic segments. Additionally, the psychographic variables significantly improve the performance of user preference explanation (R2), whereas the improvement of efficiency is not significant in user preference prediction (RMSE).

5.2.2. Q2: Analysis of the Significance and Differences between Psychographic Tools in Predicting and Explaining User Preferences

We applied Tukey’s range test to further compare the differences between the SVS, BFF, and random segmentation within psychographic variables. Table 7 shows the results. For all product categories that we study, there are no significant differences between the three groups in terms of RMSE. By contrast, there are significant differences between both the SVS and BFF with the random segmentations in R2.
We plot the mean values of RMSE and R2 for the three segmentation variables in the different product categories; Figure 5 shows the results. For differences between the SVS and BFF in user rating explanation, the SVS is superior to BFF in explaining consumer preferences (R2) across all product categories, except for Toys and Games. For user rating prediction, the SVS and BFF tend to perform better than random segmentation in predicting user preferences (RMSE) in Beauty, Digital Music, and Office Products. Compared with BFF, the SVS is slightly more powerful in predicting user ratings (RMSE) for Beauty and Digital Music, whereas there is no difference between them for Grocery and Gourmet Food, and Office Products. However, the SVS was useless in predicting user ratings (RMSE) for Toys and Games, whereas BFF improved the predictive power of user ratings.

5.2.3. Q3: Analysis of the Adaptability of Psychographic Measurement in Predicting and Explaining E-Commerce User Preferences

In Section 5.2.2, we studied the predictive and explanatory power of psychographic segmentation across different product categories. However, it remains unclear whether all subdivision dimensions of psychographic variables help understand user preferences across different e-commerce product categories. Table 8 shows part of the results of different subdimensions’ psychographic variables in predicting and explaining user preferences using the RFE-SVM approach. In Table 8, feature ranking corresponds to the ranking position of the ith psychographic subdimension, where the selected, i.e., estimated best dimensions are assigned rank 1; “importance support” represents these selected dimensions (with value TRUE); “feature source” represents whether a dimension is positively or negatively related to the SVS or BFF; “product category” contains five products from Table 8; “psychographic” contains three psychographic segmentations including the SVS, BFF, and random segmentation; and “subdimension” represents the subdimensions of positive and negative SVS and BFF. There are 810 rows in Table 8, and 150 rows with psychographic subdimensions that support our rating prediction models. We group the importance ranking in the 150 rows by product category and plot the total rankings for different subdimensions of the SVS and BFF. Only approximately 18.5% of the subdimensions of the psychographic measurements were effective in understanding specific e-commerce preferences. We can see that within Table 8, with the exception of Sec and Univ, all subdimensions of the SVS and BFF are useful. However, in different product categories, there are more subdimensions that are not effective in understanding consumer preferences, including Benev, Hed, Trad, Openness, and Extraversion in Beauty; Benev, Conf, and Openness in Office Products; Benev, Hed, Trad, Openness, and Extraversion in Toys and Games; Achiev, Hed, and Stim in Digital Music; and Achiev, Benev, Conf, and Openness in Grocery and Gourmet Food.
We conduct Tukey’s range test based on the 150 rows with psychographic subdimensions supporting our regression models; Table 9 shows the results. There are 37 significant comparisons that indicate the relationship between subdimensions of the SVS and BFF. From Table 9, we can see that, in terms of the effectiveness of psychographic subdimensions in understanding consumer preferences, the SVS subdimensions tend to follow the descending order of Pow, Trad, Conf, SD, Benev, and Stim. For subdimensions of BFF, the descending order is Conscientiousness, Neuroticism, and Openness. Figure 6 and Figure 7 show two intuitive expressions of these orders, respectively.

5.3. Analysis of Product Category and Regression Methods in Predicting and Explaining E-Commerce User Preferences

In this section, we analyze the internal differences in the new segment-wise preference regression methods and product categories that support the main research questions. Based on Table 4, we perform the Tukey’s range test on the preference prediction method and product categories; the details are shown in Table 10.
Regarding RMSE, there were more significant differences in RMSE between different product categories compared to those in R2, which is shown in Figure 8. The rating prediction performance of psychographics tends to follow a descending order from Office Products, which obtains the best predictive power, to Toys and Games, Beauty, Grocery and Gourmet Food, and Digital Music. Regarding R2, as shown in Figure 9, the psychographic variables in Beauty, and Toys and Games obtain a significantly greater R2 than that of Office Products (p-value < 0.05). In terms of the regression method, as shown in Figure 10 and Figure 11, DNN is significantly better than the other three methods in terms of both RMSE and R2. The performance of methods tends to follow a descending order from DNN to RF, LR, and SVR in the performance of preference prediction.

6. Discussion

In this study, we have focused on the promising role that different psychographic segmentations play in the understanding of e-commerce consumer preferences. Based on real-world user behavior data from Amazon, we have introduced psychographic-related behavioral evidence from psycholinguistics and applied NLP, clustering, and DNN methods to identify users’ psychographic segments and to further predict their preferences.
We summarize our results as follows. First, we have found that dividing e-consumers into heterogeneous groups using a clustering method did not significantly improve the predictive and explanatory power of e-commerce consumer preferences. By contrast, psychographic variables significantly improved the explanatory power of e-consumer preferences, whereas the improvement in predictive power was not significant. This finding is consistent with past studies [11,42] which showed that individual segments based on their psychographic measures do not seem to provide a great deal of predictive power in the context of buying behavior.
Second, we have found that both value and personality segmentations significantly improve user preference explanation under different e-commerce scenarios, whereas no significant improvement was shown in user preference prediction. These findings have verified previous research that psychographic variables do not seem to provide substantial predictive power in the context of offline buying behavior [11]. However, these findings somehow contradict works suggesting that customer segmentation based on these variables may be easy to understand, but may not provide the best possible explanatory power [42,
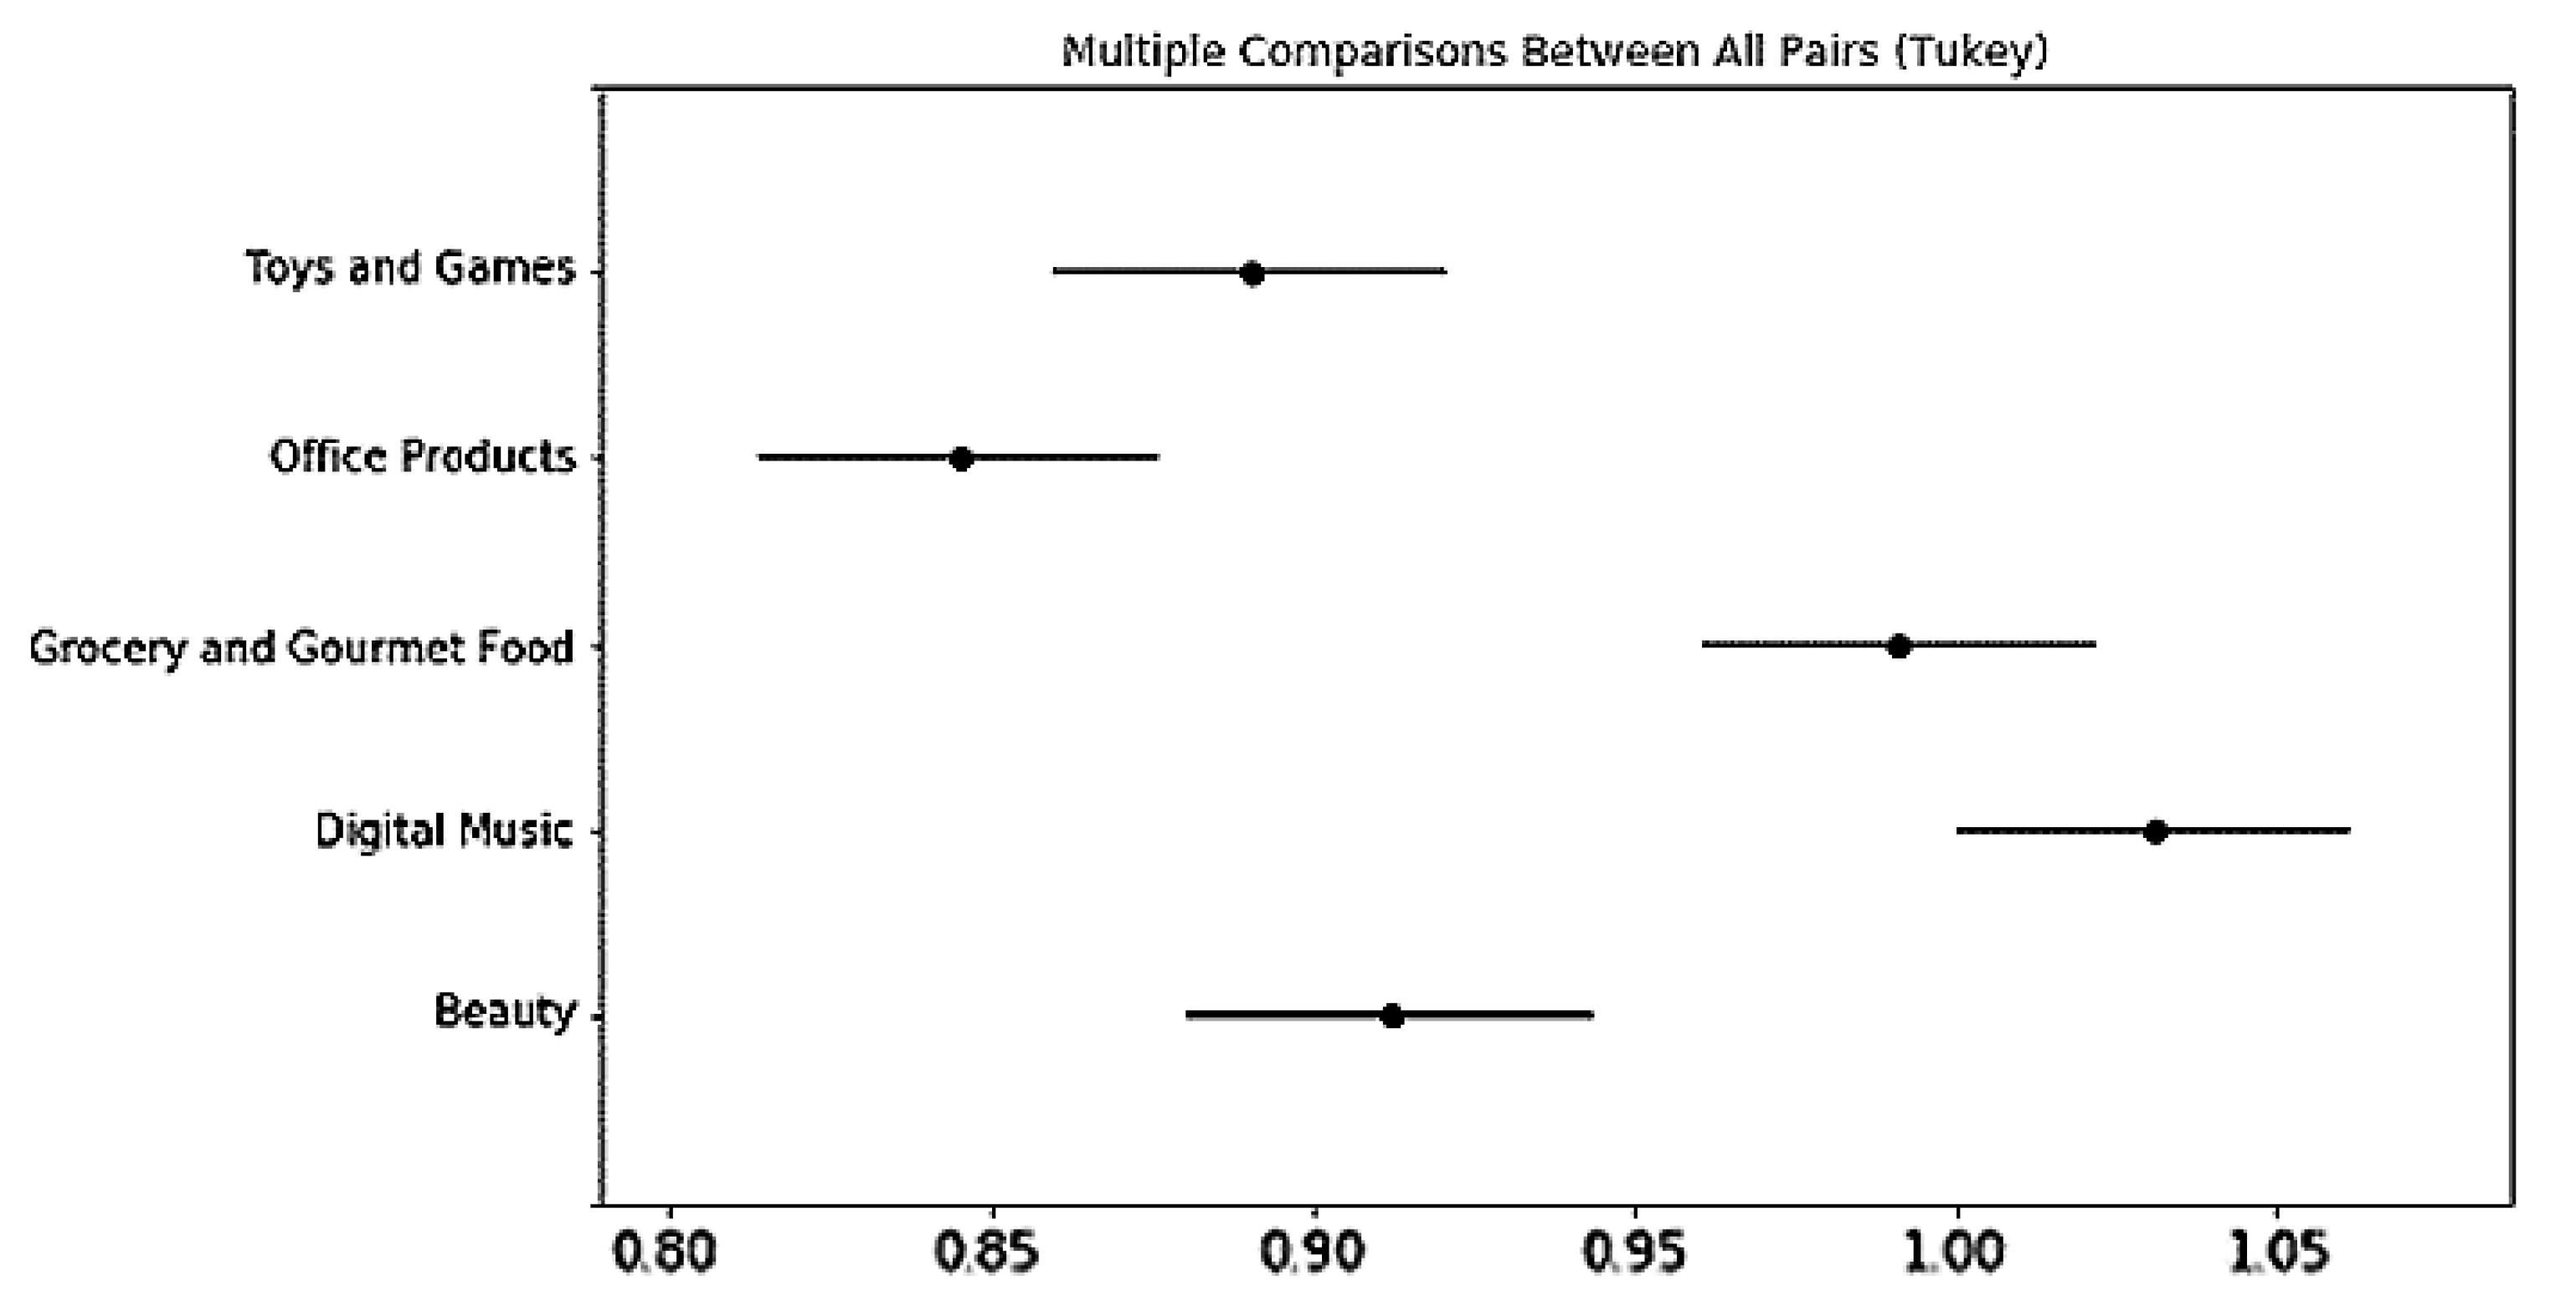
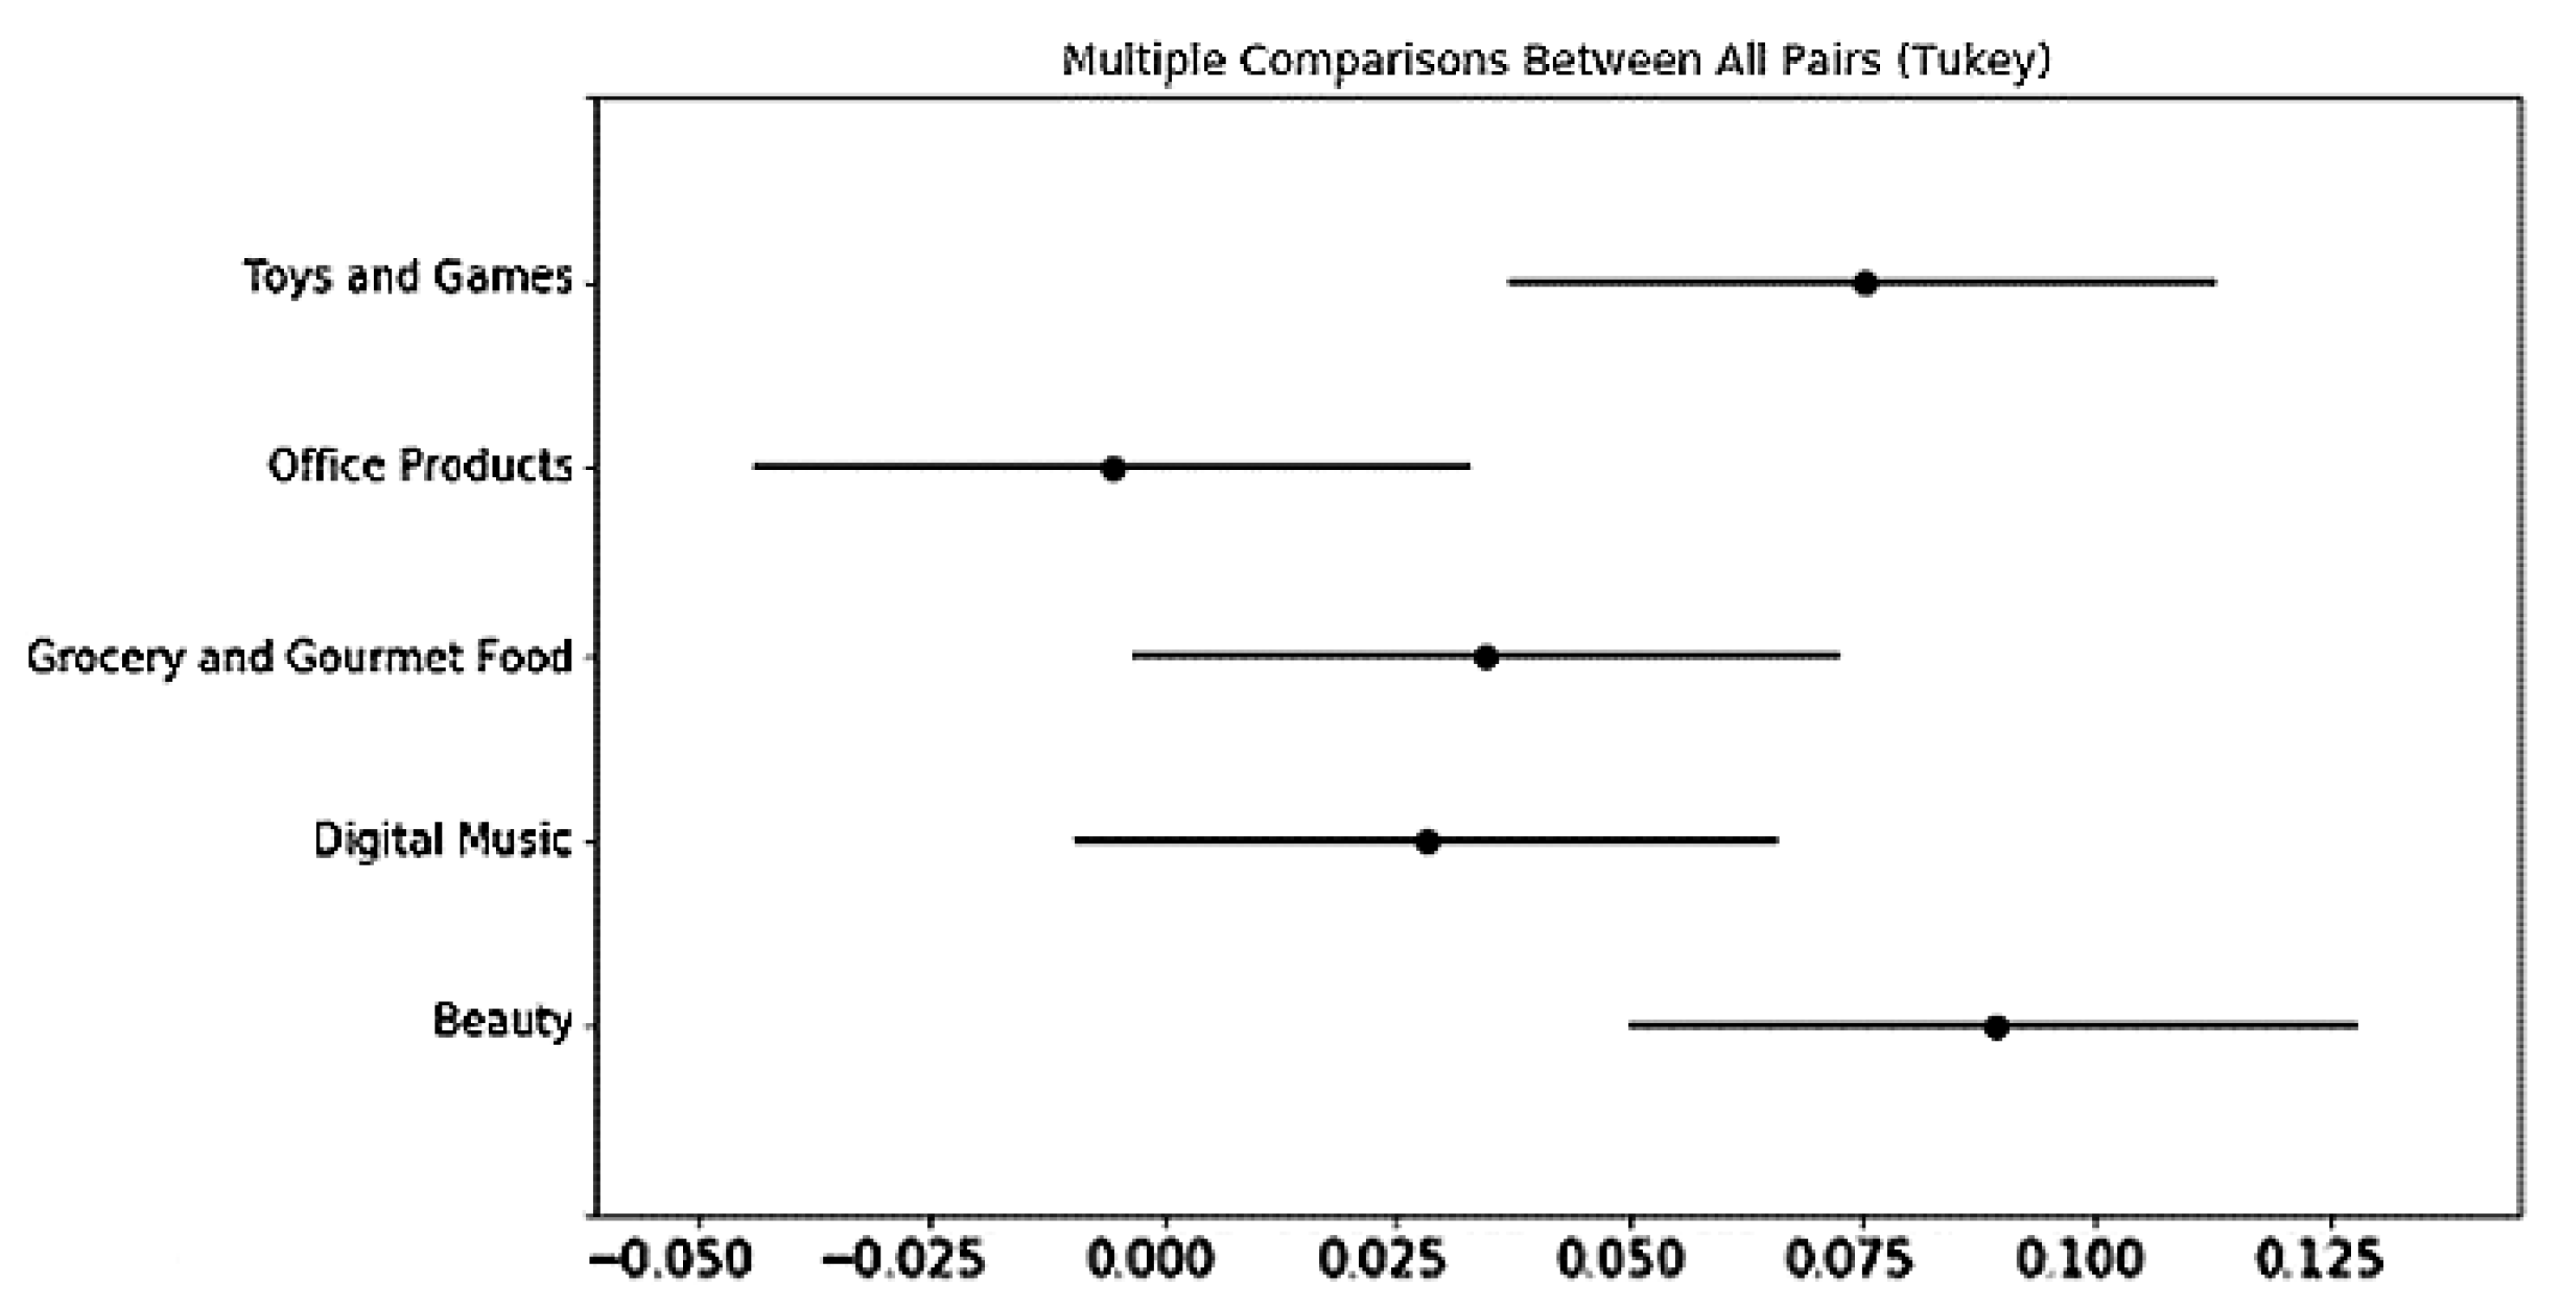
58]. These findings show that psychographic variables may play a more important role in understanding shopping behaviors in online, rather than offline, shopping scenarios. Additionally, although there is no significant difference between the SVS and BFF across all product categories, both the SVS and BFF tend to predict e-consumer preferences better across most of the product categories that we have studied, and the SVS seems to outperform BFF in all the product categories that we have studied, except Toys and Games. Values that characterize human motivation may be a better psychographic variable compared with personality, which emphasizes individual differences.
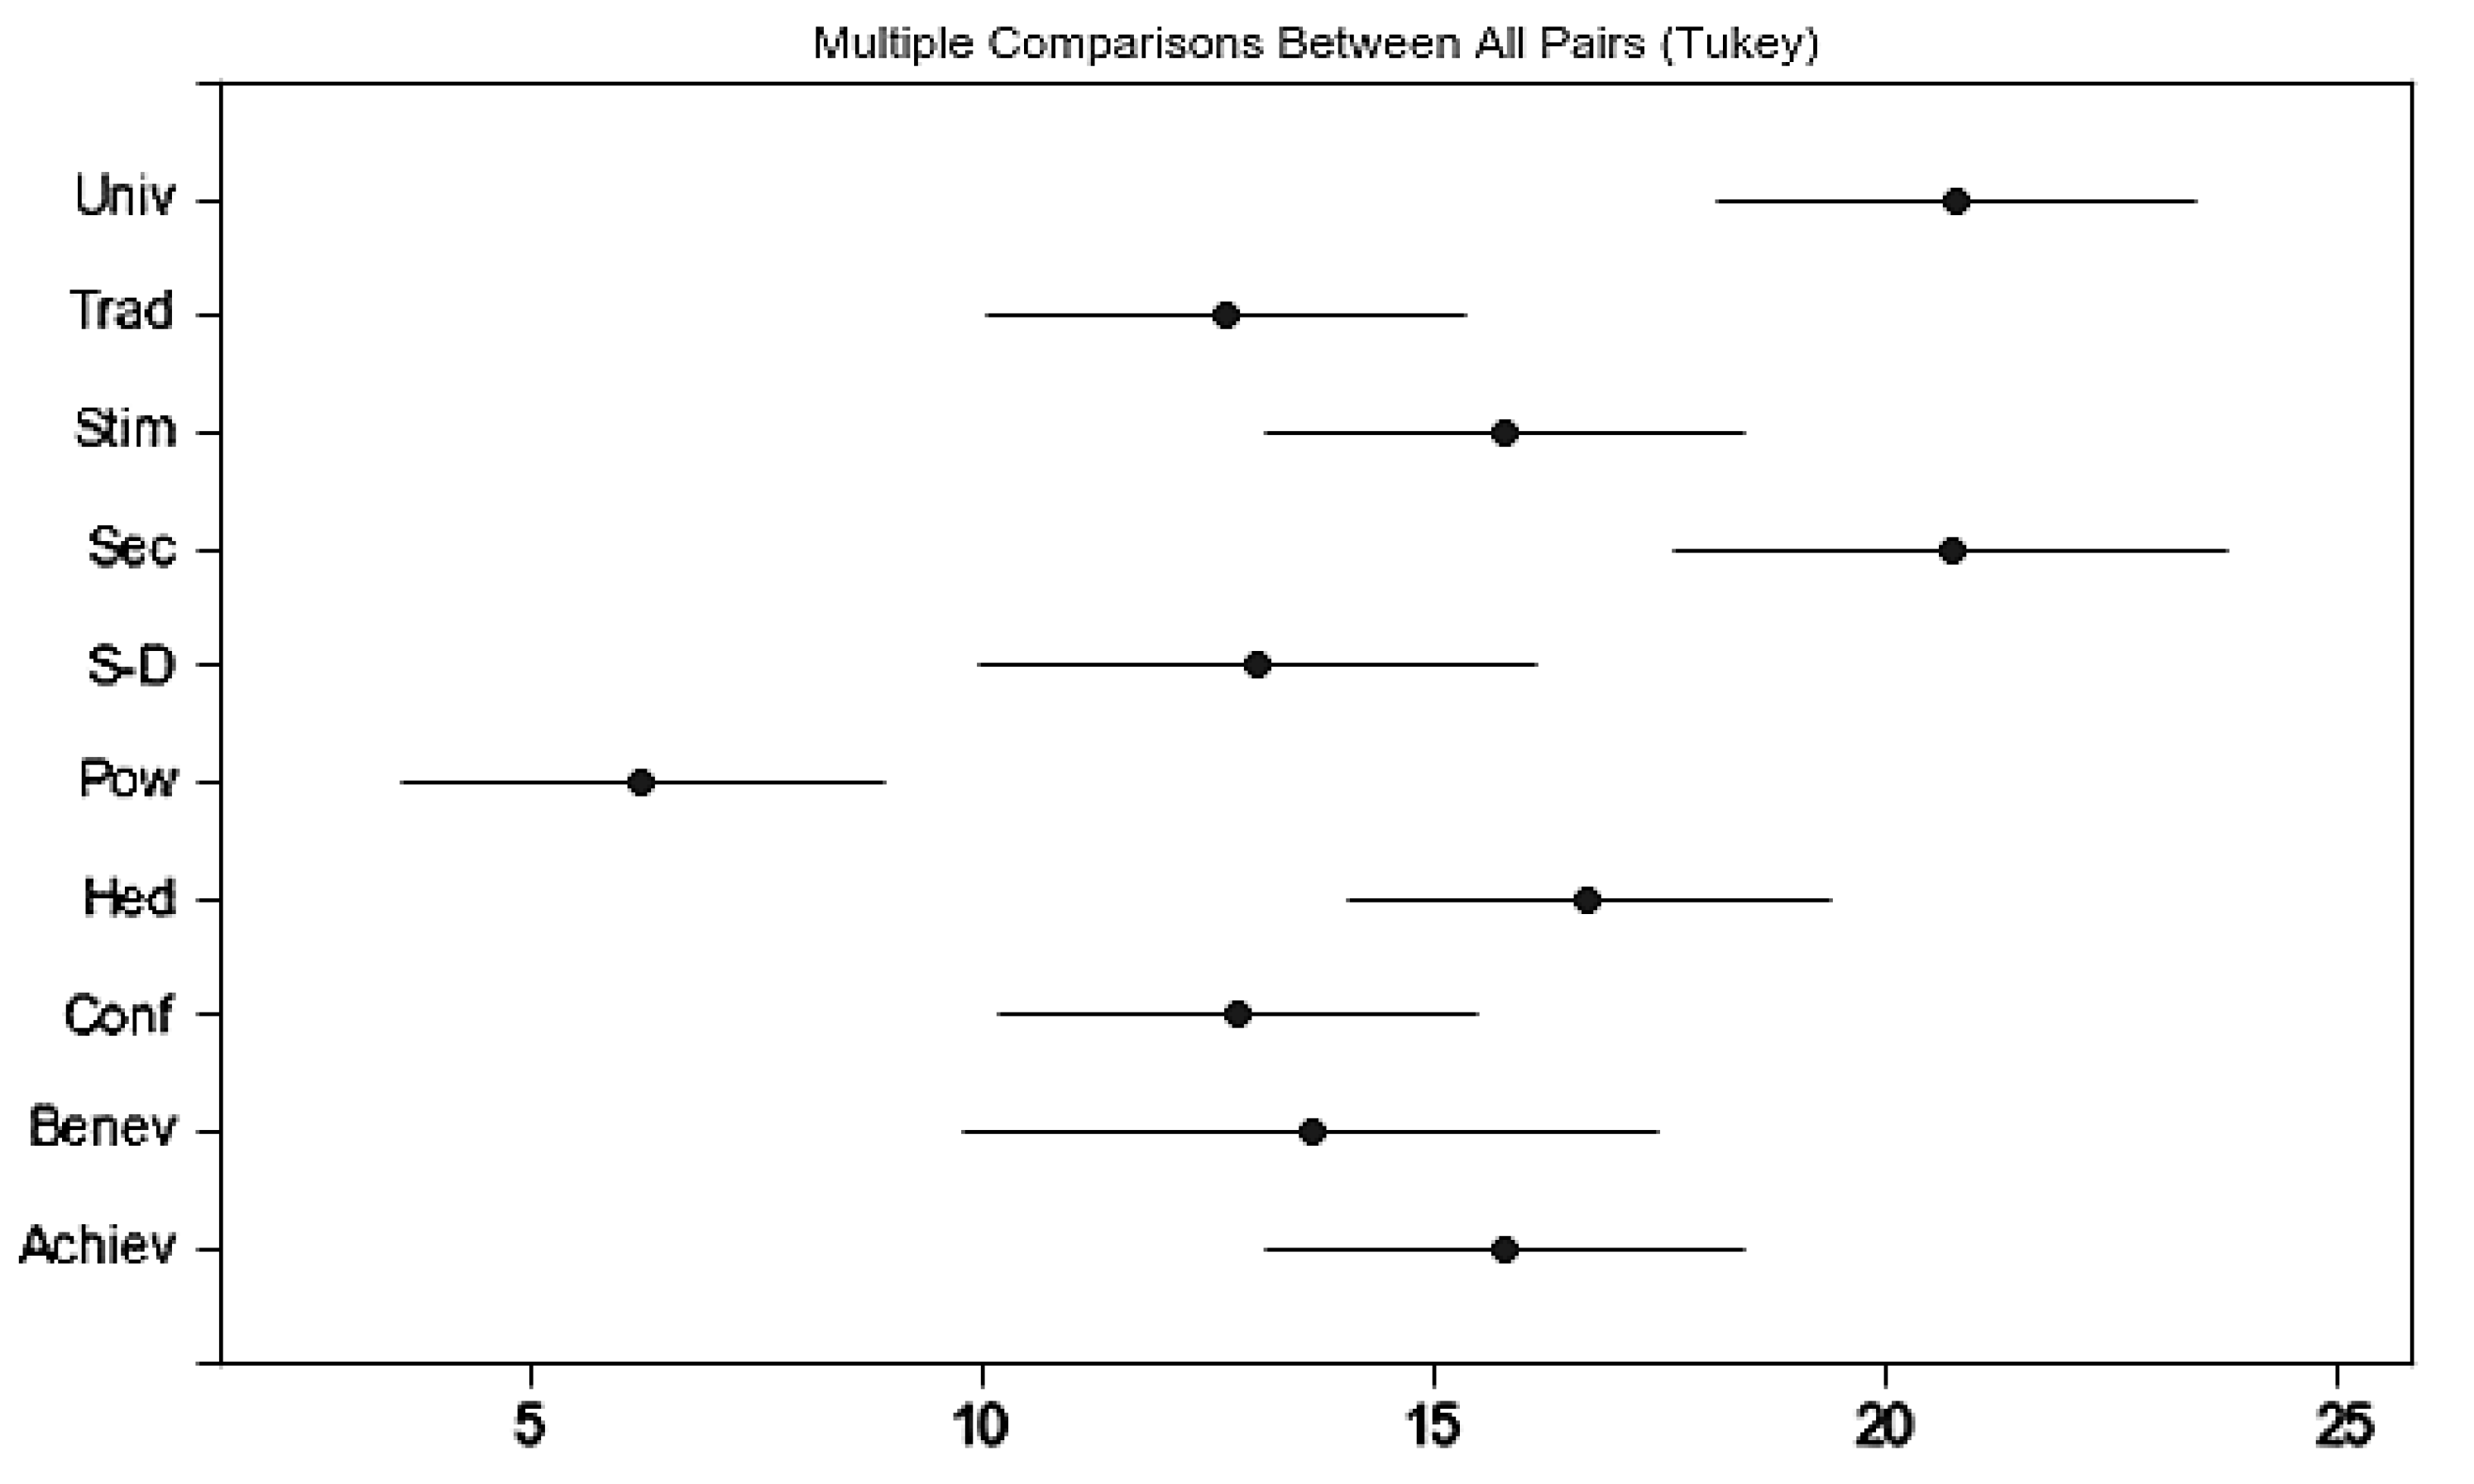
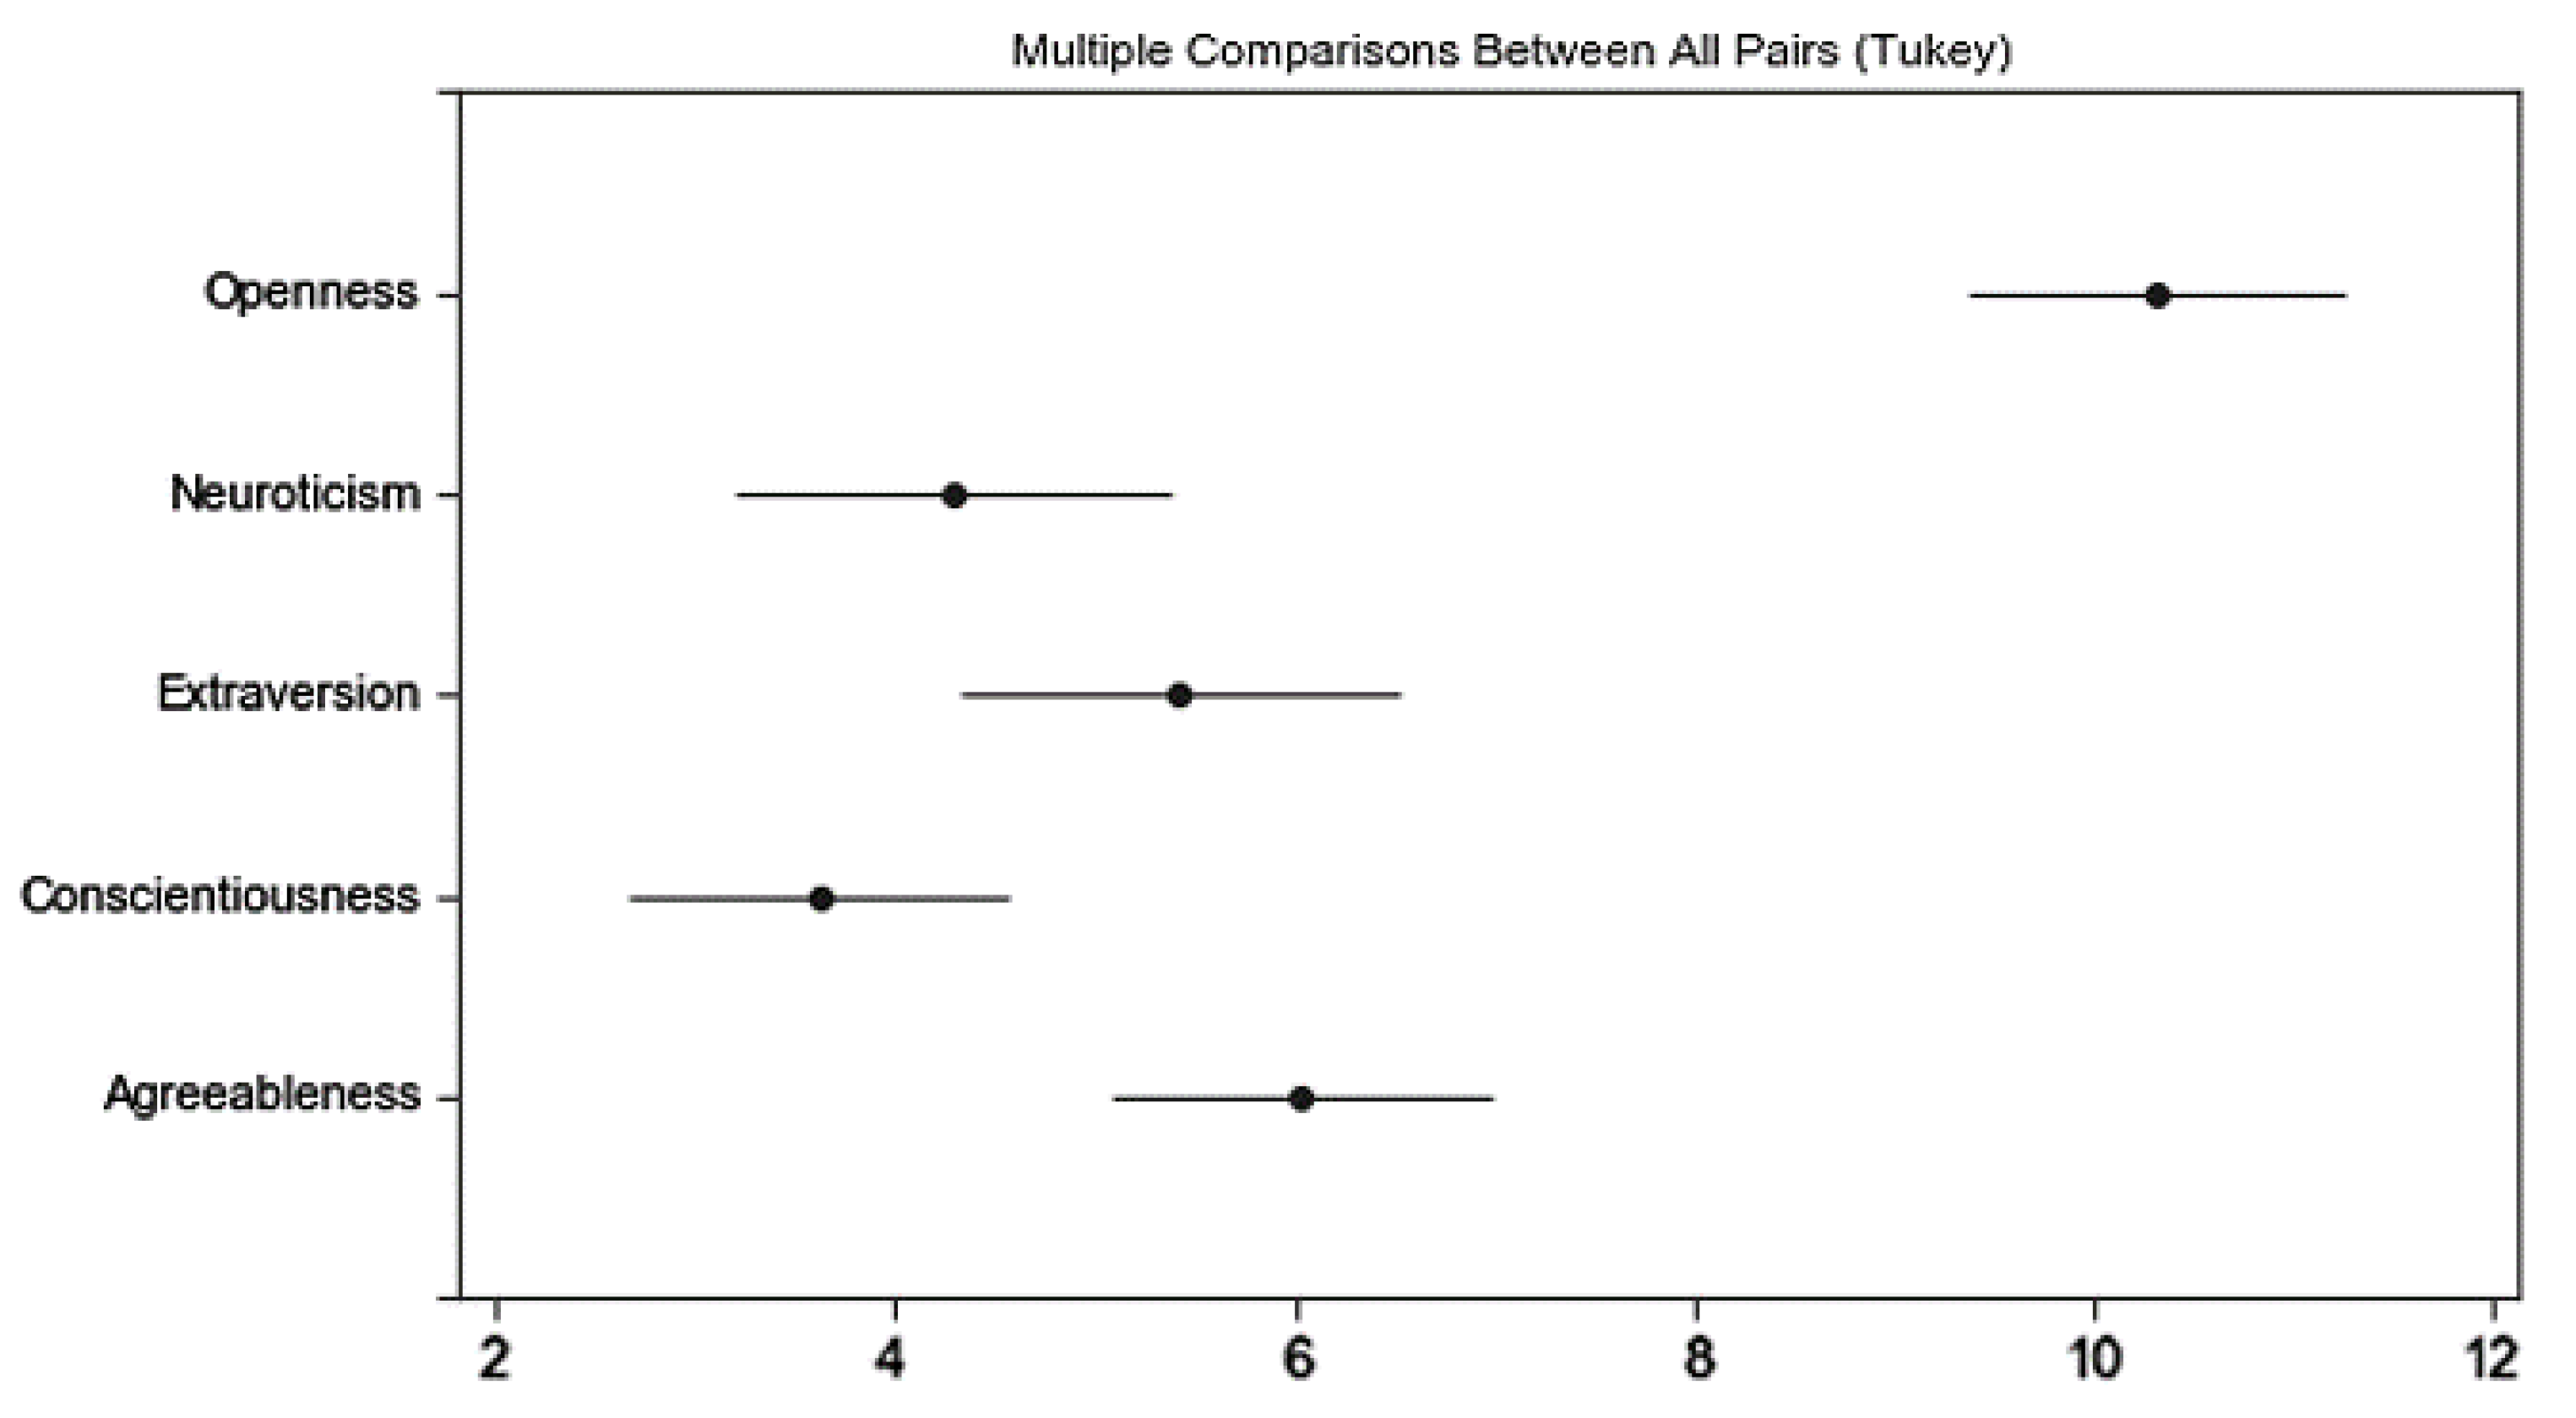
Third, we have found that only 18.5% of the subdimension combinations within a psychographic tool have stable effectiveness in understanding e-commerce preferences related to a specific product category. However, all BFF subdimensions are important in understanding e-consumer preferences, whereas the security and benevolence of the SVS do not demonstrate their effectiveness. We have found that using more subdimensions does not significantly improve the predictive and explanatory power within different product categories. Although the SVS is capable of explaining e-consumer preferences, our work indicates that there may be some subdimensions of the SVS that are able to perform better in understanding e-consumer preferences. This finding is consistent with Schwartz’s argument that it is reasonable to partition the value items into more or less fine-tuned distinct values according to the needs and objectives of the analysis [27].
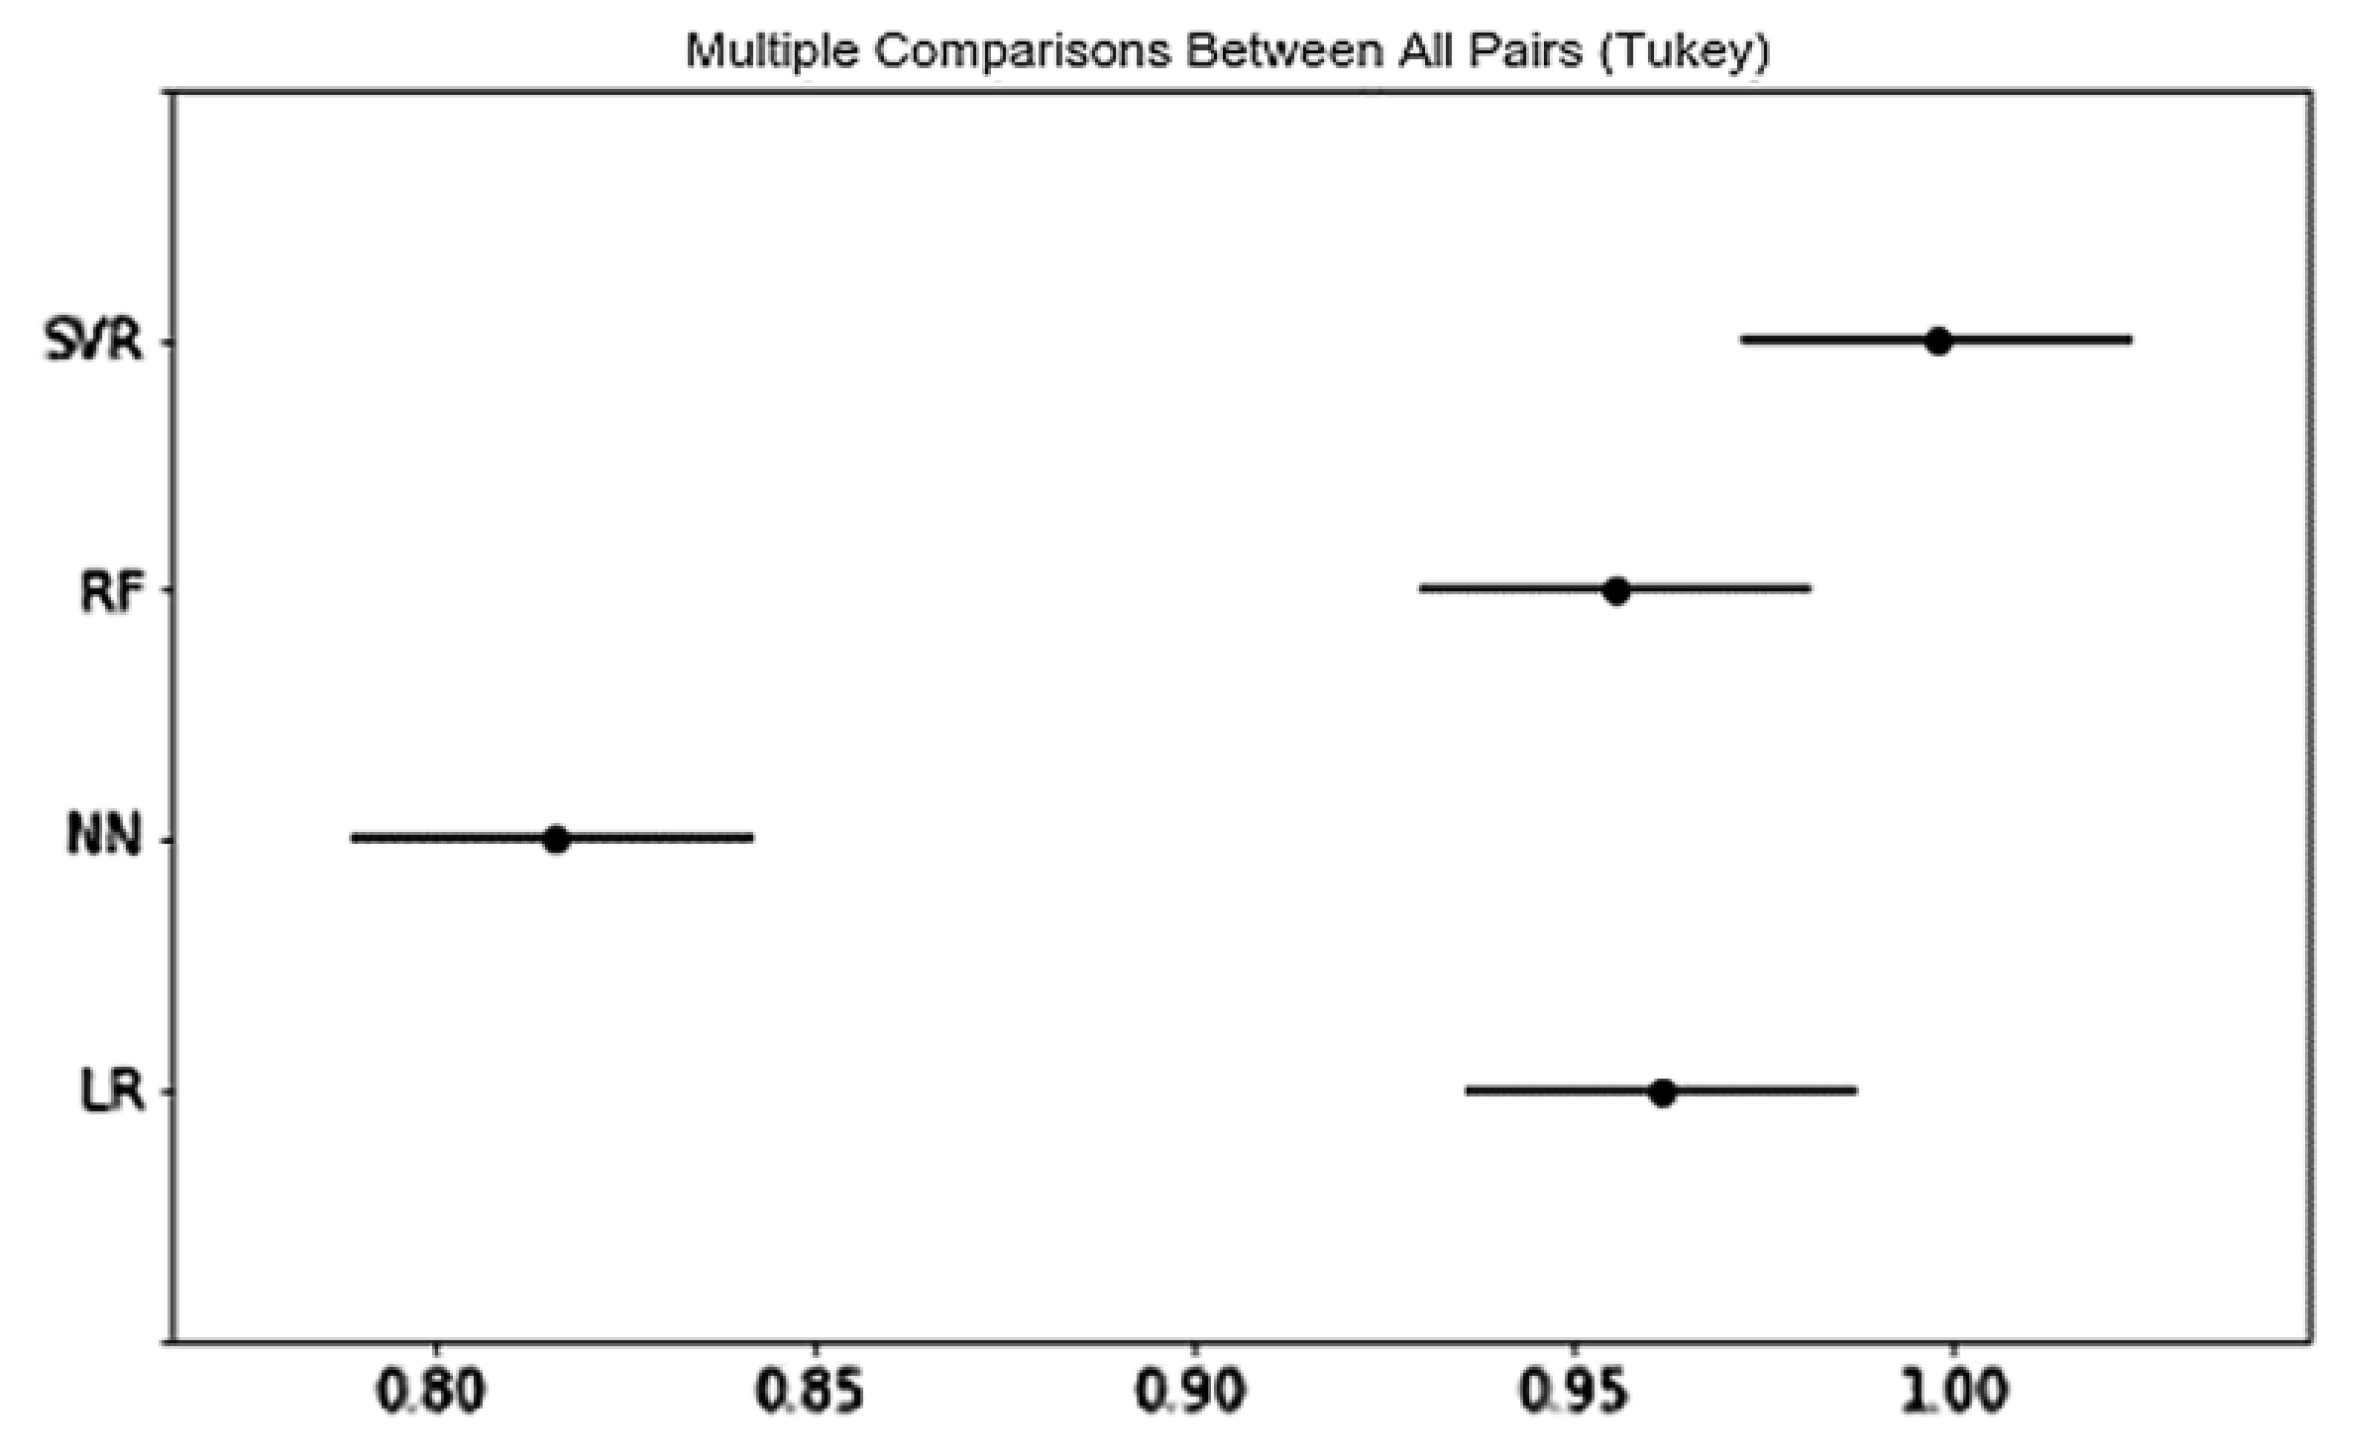
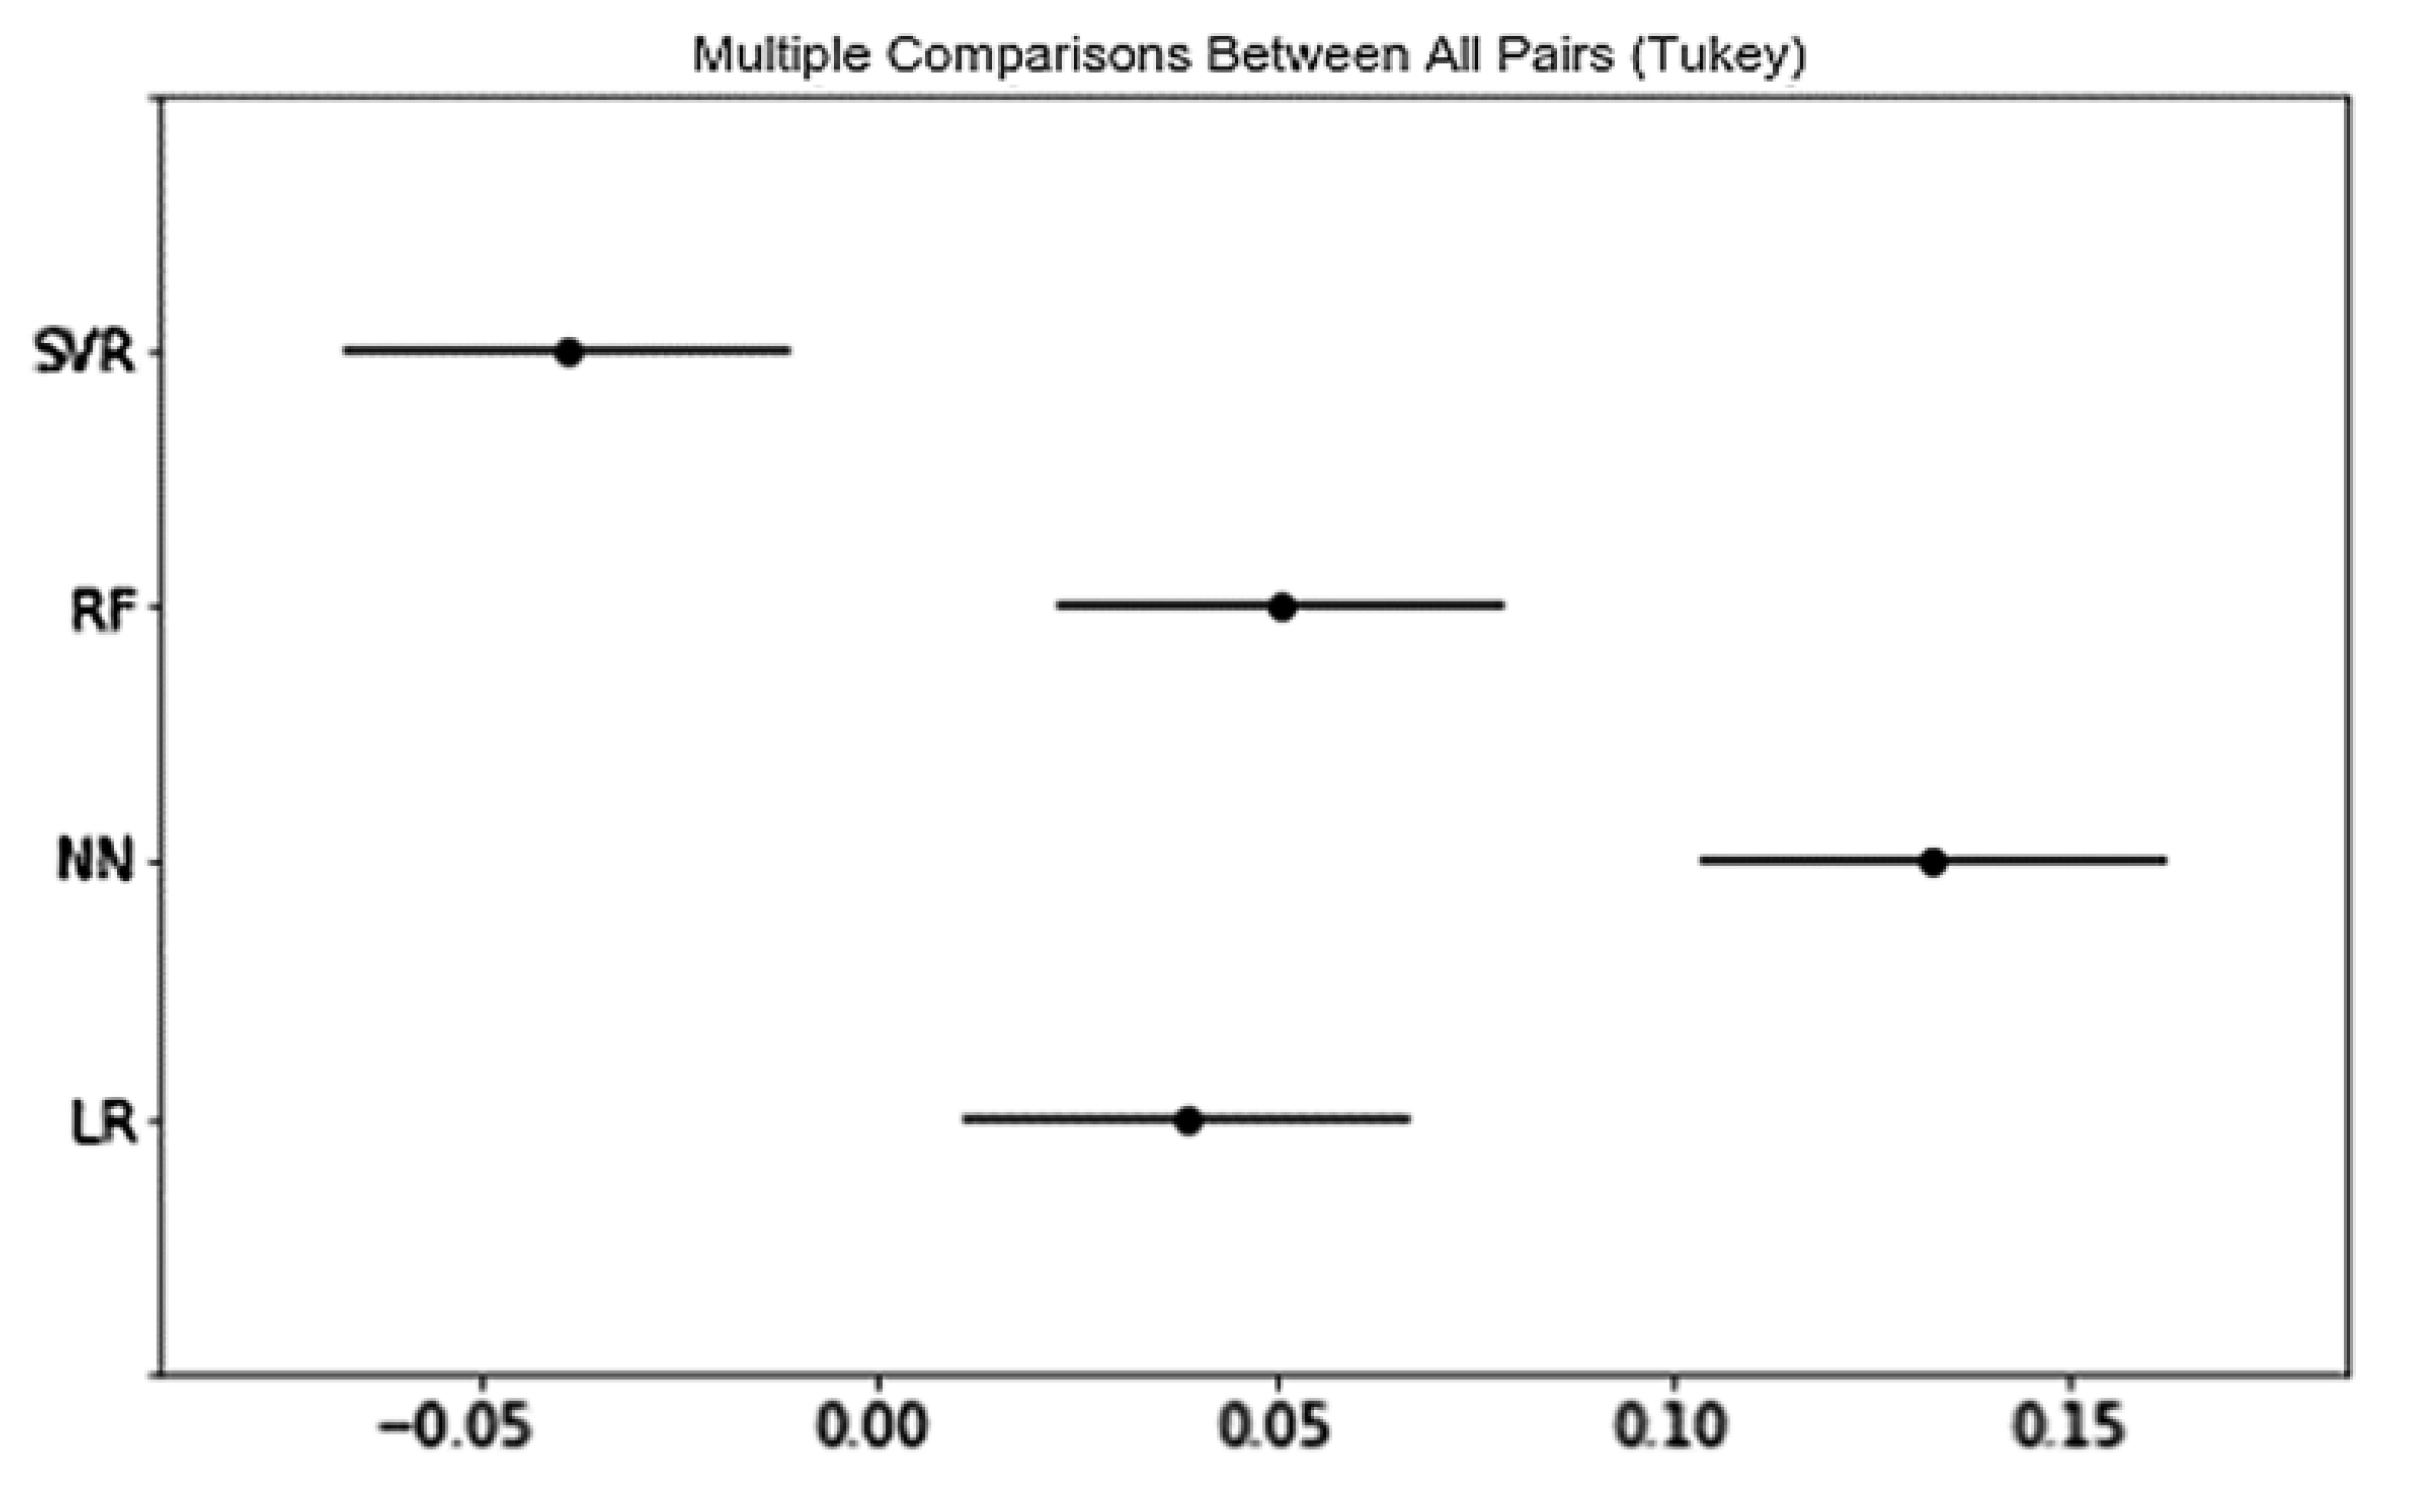
Finally, the DNN method that we have proposed obtained the best predictive and explanatory power in understanding e-consumer preferences; it is significantly better than RF and SVM that were applied in previous research. Regarding product categories, there are more significant differences for psychographic variables in predicting than explaining e-consumer preferences. Moreover, the role of psychographic variables in predicting and explaining e-consumer preferences typically does not demonstrate consistency in different product categories: psychographic variables demonstrates the best predictive power in Office Products and the least explanatory power in Office Products. In most cases, prediction models are likely to possess some level of both explanatory and predictive power [77]. We can, therefore, visualize performances of different models in terms of a trade-off between explanatory and predictive power on a two-dimensional plot, where the two axes indicate prediction accuracy and explanatory power, respectively. We leave such visualization for future work. As the influence of psychographic variables on user preferences is moderated by product category, our findings indicate a more complicated relationship between them.
This study has extended the depth and breadth of psychographic-related studies through user preference prediction in real-world e-commerce scenarios. Our findings regarding psychographic segmentation and segment-wise preference prediction have provided theoretical guidance for psychographic variable adoption, selection, and use in electronic marketing researches like online advertising, retail, and recommendation. Practically, our findings regarding subdimensions of psychographic variables have provided a practical reference for psychographic measurement development in each e-commerce product category that we have studied. Additionally, the influence of product category on psychographic-based preference prediction and explanation indicates promising e-commerce product research directions and applications. By introducing psychographic-related word use behavioral evidence, followed by natural language processing and DNN techniques, we have attempted to overcome the difficulties of observing e-consumer psychographics on a large scale, and have provided a promising psychographic-based consumer preference prediction method for subsequent research and applications.
However, our study has some limitations. First, we have only applied the review dataset with “K-core” values of 10, whereas there are a huge number of consumers who have either a limited number of reviews or words in their reviews, potentially causing bias in the psychographic inference. Second, the original dataset does not provide demographic information and we have not evaluated the difference between the psychographic scores and the scores assessed by self-report, which may have caused biases in our research results. Third, in addition to psychographic-related single words, there may be other linguistic clues embedded in phrases, sentences, and paragraphs that we have not taken into consideration. Fourth, although our research has demonstrated the significant explanatory power of psychographic tools in understanding e-consumer preferences, no significant predictive power or difference was found. Psychographic variables such as AIO, VALS, and LOV, or their combinations, should be taken into consideration in fully assessing the influence of psychographics on the understanding of e-consumer preferences.
In future studies, we will improve the consumer diversity of Amazon data to verify our findings. Promising future research directions include: evaluating the current psychographic inference method; developing a new psychographic variable identification method by introducing more advanced DNN models and textual features like SVS-related themes [16] and word embeddings [78]; verifying and comparing word use behaviors (K-core); combining different psychographic variables, together with other well-known segmentation approaches (e.g., demographic segmentation, behavioral segmentation, geographic segmentation, etc.) to further understand their influence in predicting and understanding e-consumer preferences.

Supplementary Materials

The following are available online at https://www.mdpi.com/2076-3417/9/10/1992/s1, Table S1–S4.

Author Contributions

The study was carried out in collaboration between all authors. H.L., Y.H., X.H. and W.W. designed the research topic. Y.H. and H.L. conducted the experiment and wrote the paper. Z.W. and K.L. examined the experimental data and checked the experimental results. All authors agreed to submission of the manuscript.

Funding

This research is supported by Program of National Natural Science Foundation of China (No. 71571084, No. 71271099) and China Scholarship Council.

Conflicts of Interest

The authors declare no conflict of interest.

References

  1. Jacobs, B.J.D.; Donkers, B.; Fok, D. Model-based purchase predictions for large assortments. Marketing Sci. 2016, 35, 389–404. [Google Scholar] [CrossRef]
  2. Lu, S.; Xiao, L.; Ding, M. A video-based automated recommender (VAR) system for garments. Marketing Sci. 2016, 35, 484–510. [Google Scholar] [CrossRef]
  3. Xie, K.L.; Zhang, Z.; Zhang, Z. The business value of online consumer reviews and management response to hotel performance. Int. J. Hospit. Manag. 2014, 43, 1–12. [Google Scholar] [CrossRef]
  4. Chen, J.; Haber, E.; Kang, R.; Hsies, G.; Mahmud, J. Making use of derived personality: The case of social media ad targeting. In Proceedings of the Ninth International AAAI Conference on Web and Social Media, Oxford, UK, 26–29 May 2015. [Google Scholar]
  5. Trusov, M.; Ma, L.; Jamal, Z. Crumbs of the cookie: User profiling in customer-base analysis and behavioral targeting. Marketing Sci. 2016, 35, 405–426. [Google Scholar] [CrossRef]
  6. Culotta, A.; Cutler, J. Mining brand perceptions from twitter social networks. Marketing Sci. 2016, 35, 343–362. [Google Scholar] [CrossRef]
  7. Jin, J.; Ji, P.; Gu, R. Identifying comparative customer requirements from product online reviews for competitor analysis. Eng. Appl. Artif. Intell. 2016, 49, 61–73. [Google Scholar] [CrossRef]
  8. Matz, S.C.; Netzer, O. Using big data as a window into consumers’ psychology. Curr. Opin. Behave. Sci. 2017, 18, 7–12. [Google Scholar] [CrossRef]
  9. Jih, W.J.K.; Lee, S.F. An exploratory analysis of relationships between cellular phone uses’ shopping motivators and lifestyle indicators. J. Comp. Inf. Syst. 2004, 44, 65–73. [Google Scholar]
  10. Ko, E.; Kim, E.; Taylor, C.R.; Kim, K.H.; Kang, J.I. Cross-national market segmentation in the fashion industry: A study of European, Korean, and US consumers. Int. Marketing Rev. 2007, 24, 629–651. [Google Scholar] [CrossRef]
  11. Sandy, C.J.; Gosling, S.D.; Durant, J. Predicting consumer behavior and media preferences: The comparative validity of personality traits and demographic variables. Psychol. Market. 2013, 30, 937–949. [Google Scholar] [CrossRef]
  12. Pennebaker, J.W.; Chung, C.K.; Frazee, J.; Lavergne, G.M.; Beaver, D.I. When small words foretell academic success: The case of college admissions essays. PLoS ONE 2014, 9, e115844. [Google Scholar] [CrossRef] [PubMed]
  13. Buettner, R. Predicting user behavior in electronic markets based on personality-mining in large online social networks. Electr. Marketing 2017, 27, 247–265. [Google Scholar] [CrossRef]
  14. Lee, A.J.T.; Yang, F.-C.; Chen, C.-H.; Wang, C.-S.; Sun, C.-Y. Mining perceptual maps from consumer reviews. Decis. Support Syst. 2016, 82, 12–25. [Google Scholar] [CrossRef]
  15. Wang, Y.; Lu, X.; Tan, Y. Impact of product attributes on customer satisfaction: An analysis of online reviews for washing machines. Electr. Commerce Res. Appl. 2018, 29, 1–11. [Google Scholar] [CrossRef]
  16. Boyd, R.L.; Wilson, S.R.; Pennebaker, J.W.; Kosinski, M.; Stillwell, J.D.; Michaela, R. Values in words: Using language to evaluate and understand personal values. In Proceedings of the ICWSM, Oxford, UK, 26–29 May 2015; pp. 31–40. [Google Scholar]
  17. Yarkoni, T. Personality in 100,000 words: A large-scale analysis of personality and word use among bloggers. J. Res. Personal. 2010, 44, 363–373. [Google Scholar] [CrossRef]
  18. Smith, W.R. Product differentiation and market segmentation as alternative marketing strategies. J. Marketing 1956, 21, 3–8. [Google Scholar] [CrossRef]
  19. Karlsson, L.; Dolnicar, S. Someone’s been sleeping in my bed. Ann. Tour. Res. 2016, 58, 159–162. [Google Scholar] [CrossRef]
  20. Shukla, P.; Babin, B.J. Effects of consumer psychographics and store characteristics in influencing shopping value and store switching. J. Consum. Behav. 2013, 12, 194–203. [Google Scholar] [CrossRef]
  21. Wedel, M.; Kamakura, W.A. Market Segmentation: Conceptual and Methodological Foundation; Springer Science & Business Media: Berlin, Germany, 2012. [Google Scholar]
  22. Vyncke, P. Lifestyle segmentation: From attitudes, interests and opinions, to values, aesthetic styles, life visions and media preferences. Eur. J. Commun. 2002, 17, 445–463. [Google Scholar] [CrossRef]
  23. Gunter, B.; Furnham, A. Consumer Profiles (Rle Consumer Behaviour): An Introduction to Psychographics; Routledge: London, UK, 2014. [Google Scholar]
  24. Walters, G.D. Lifestyle Theory: Past, Present, and Future; Nova Science Publishers: Commack, NY, USA, 2006. [Google Scholar]
  25. Mitchell, V.W. How to identify psychographic segments: Part 1. Marketing Intell. Plann. 1994, 12, 4–10. [Google Scholar] [CrossRef]
  26. Bruwer, J.; Li, E. Wine-related lifestyle (WRL) market segmentation: Demographic and behavioural factors. J. Wine Res. 2007, 18, 19–34. [Google Scholar] [CrossRef]
  27. Schwartz, S.H. An overview of the Schwartz theory of basic values. Online Read. Psychol. Cult. 2012, 2, 11. [Google Scholar] [CrossRef]
  28. Lin, C.F. Segmenting customer brand preference: Demographic or psychographic. J. Product. Brand Manag. 2002, 11, 249–268. [Google Scholar] [CrossRef]
  29. Rokeach, M. The Nature of Human Values; Free Press: Detroit, MI, USA, 1973. [Google Scholar]
  30. Kahle, L.R.; Beatty, S.E.; Homer, P. Alternative measurement approaches to consumer values: The list of values (LOV) and values and life style (VALS). J. Consum. Res. 1986, 13, 405–409. [Google Scholar] [CrossRef]
  31. Sagiv, L.; Schwartz, S.H. Cultural values in organisations: Insights for Europe. Eur. J. Int. Manag. 2007, 1, 176–190. [Google Scholar] [CrossRef]
  32. Yang, J.; Liu, C.; Teng, M.; Liao, M.; Xiong, H. Buyer targeting optimization: A unified customer segmentation perspective, Big Data. In Proceedings of the 2016 IEEE International Conference on IEEE, Washington, DC, USA, 5–8 December 2016; pp. 1262–1271. [Google Scholar]
  33. Hirsh, J.B.; Kang, S.K.; Bodenhausen, G.V. Personalized persuasion: Tailoring persuasive appeals to recipients’ personality traits. Psychol. Sci. 2012, 23, 578–581. [Google Scholar] [CrossRef]
  34. Fernández-Tobías, I.; Braunhofer, M.; Elahi, M.; Ricci, F.; Cantador, I. Alleviating the new user problem in collaborative filtering by exploiting personality information. User Model. User Adapt. Interact. 2016, 26, 221–255. [Google Scholar] [CrossRef] [Green Version]
  35. Karumur, R.P.; Nguyen, T.T.; Konstan, J.A. Exploring the value of personality in predicting rating behaviors: A study of category preferences on movielens. In Proceedings of the 10th ACM Conference on Recommender Systems, Boston, MA, USA, 15–19 September 2016; pp. 139–142. [Google Scholar]
  36. Lee, H.J.; Lim, H.; Jolly, L.D.; Lee, J. Consumer lifestyles and adoption of high-technology products: A case of South Korea. J. Int. Consum. Marketing 2009, 21, 153–167. [Google Scholar] [CrossRef]
  37. Pan, Y.; Luo, L.; Liu, D.; Xu, X.; Shen, W.; Gao, J. How to recommend by online lifestyle tagging (olt). Int. J. Inf. Technol. Decis. Making 2014, 13, 1183–1209. [Google Scholar] [CrossRef]
  38. Piazza, A.; Zagel, C.; Haeske, J.; Bodendorf, F. Do you like according to your lifestyle? a quantitative analysis of the relation between individual facebook likes and the users’ lifestyle. In Proceedings of the International Conference on Applied Human Factors and Ergonomics; Springer: Cham, Switzerland, 2017; pp. 128–139. [Google Scholar]
  39. Goldsmith, R.E.; Freiden, J.B.; Kilsheimer, J.C. Social values and female fashion leadership: A cross-cultural study. Psychol. Marketing 1993, 10, 399–412. [Google Scholar] [CrossRef]
  40. Kim, H.S. Consumer profiles of apparel product involvement and values. J. Fashion Marketing Manag. Int. J. 2005, 9, 207–220. [Google Scholar] [CrossRef]
  41. Heine, K.; Trommsdorff, V. Practicable value-cascade positioning of luxury fashion brands. In Proceedings of the 9th International Marketing Trends Conference, Venice, Italy, 20–23 January 2010; pp. 21–23. [Google Scholar]
  42. Teck, W.J.; Cyril de Run, E. Consumers’ personal values and sales promotion preferences effect on behavioural intention and purchase satisfaction for consumer product. Asia Pac. J. Marketing Logist. 2013, 25, 70–101. [Google Scholar] [CrossRef]
  43. Fraj, E.; Martinez, E. Environmental values and lifestyles as determining factors of ecological consumer behaviour: An empirical analysis. J. Consum. Marketing 2006, 23, 133–144. [Google Scholar] [CrossRef]
  44. Padgett, D.; Mulvey, M.S. Differentiation via technology: Strategic positioning of services following the introduction of disruptive technology. J. Retail. 2007, 83, 375–391. [Google Scholar] [CrossRef]
  45. Wiedmann, K.P.; Hennigs, N.; Siebels, A. Value-based segmentation of luxury consumption behavior. Psychol. Marketing 2009, 26, 625–651. [Google Scholar] [CrossRef]
  46. Antipov, E.; Pokryshevskaya, E. Applying CHAID for logistic regression diagnostics and classification accuracy improvement. J. Target. Meas. Anal. Marketing 2010, 18, 109–117. [Google Scholar] [CrossRef] [Green Version]
  47. Reutterer, T.; Mild, A.; Natter, M.; Taudes, A. A dynamic segmentation approach for targeting and customizing direct marketing campaigns. J. Interact. Marketing 2006, 20, 43–57. [Google Scholar] [CrossRef]
  48. Ge, Y.; Xiong, H.; Zhou, W.; Li, S.; Sahoo, R. Multifocal learning for customer problem analysis. ACM Trans. Intell. Syst. Technol. 2011, 2, 24. [Google Scholar] [CrossRef]
  49. Schwartz, H.A.; Eichstaedt, J.C.; Kern, M.L.; Dziruizynski, L.; Ramones, S.M.; Agrawal, M.; Shah, A.; Kosinski, M.; Stillwell, D.; Seligman, M.E.P.; et al. Personality, gender, and age in the language of social media: The open-vocabulary approach. PLoS ONE 2013, 8, e73791. [Google Scholar] [CrossRef] [PubMed]
  50. Gosling, S.D.; Mason, W. Internet research in psychology. Ann. Rev. Psychol. 2015, 66, 877–902. [Google Scholar] [CrossRef]
  51. Adamopoulos, P.; Ghose, A.; Todri, V. The impact of user personality traits on word of mouth: Text-mining social media platforms. Inf. Syst. Res. 2018, 29, 612–640. [Google Scholar] [CrossRef]
  52. Bleidorn, W.; Hopwood, C.J. Using machine learning to advance personality assessment and Theory. Personal. Soc. Psychol. Rev. 2018, 23, 190–203. [Google Scholar] [CrossRef] [PubMed]
  53. Park, G.; Schwartz, H.A.; Eichstaedt, J.C.; Kern, C.J.; Kosinski, M.L.; Stillwell, M.; Ungar, J.D.; Seligman, H.L.; Martin, E.P. Automatic personality assessment through social media language. J. Personal. Soc. Psychol. 2015, 108, 934. [Google Scholar] [CrossRef] [PubMed]
  54. Grunert, K.G.; Perrea, T.; Zhou, Y.; Huang, G.; Sorensen, B.T.; Krystallis, A. Is food-related lifestyle (FRL) able to reveal food consumption patterns in non-Western cultural environments? Its adaptation and application in urban China. Appetite 2011, 56, 357–367. [Google Scholar] [CrossRef]
  55. Casidy, M.R.; Tsarenko, Y. Predicting brand preferences: An examination of the predictive power of consumer personality and values in the Australian fashion market. J. Fashion Marketing Manag. Int. J. 2009, 13, 358–371. [Google Scholar] [CrossRef]
  56. Mulyanegara, R.C. The relationship between market orientation, brand orientation and perceived benefits in the non-profit sector: A customer-perceived paradigm. J. Strateg. Marketing 2011, 19, 429–441. [Google Scholar] [CrossRef]
  57. Yankelovich, D.; Meer, D. Rediscovering market segmentation. Harvard Bus. Rev. 2006, 84, 122. [Google Scholar]
  58. Sinha, P.K.; Uniyal, D.P. Using observational research for behavioural segmentation of shoppers. J. Retail. Consum. Serv. 2005, 12, 35–48. [Google Scholar] [CrossRef]
  59. Oly Ndubisi, N.; Tung, M.C. Awareness and usage of promotional tools by Malaysian consumers: The case of low involvement products. Manag. Res. News 2006, 29, 28–40. [Google Scholar] [CrossRef]
  60. Wang, W.; Li, Y.; Huang, Y.; Liu, H.; Zhang, T. A method for identifying the mood states of social network users based on cyber psychometrics. Future Internet 2017, 9, 22. [Google Scholar] [CrossRef]
  61. Pero, S.; Huettner, A. Affect analysis of text using fuzzy semantic typing. In IEEE Transactionsons on Fuzzy Systems; IEEE: New York, NY, USA, 2001; pp. 483–496. [Google Scholar]
  62. Turian, J.; Ratinov, L.; Bengio, Y. Word representations: A simple and general method for semi-supervised learning. In Proceedings of the 48th Annual Meeting of the Association for Computational Linguistics, Uppsala, Sweden, 11–16 July 2010; pp. 384–394. [Google Scholar]
  63. “Gensim_ models.word2vec – Word2vec embeddings”. (2019, May 13). Available online: https://radimrehurek.com/gensim/models/word2vec.html (accessed on 18 February 2019).
  64. McAuley, J.; Targett, C.; Shi, Q.; van den Hengel, A. Image-based recommendations on styles and substitutes. In Proceedings of the 38th International ACM SIGIR Conference on Research and Development in Information Retrieval, Santiago, Chile, 9–13 August 2015; pp. 43–52. [Google Scholar]
  65. Müllensiefen, D.; Hennig, C.; Howells, H. Using clustering of rankings to explain brand preferences with personality and socio-demographic variables. J. Appl. Statistics 2018, 45, 1009–1029. [Google Scholar] [CrossRef]
  66. Levin, N.; Zahavi, J. Predictive modeling using segmentation. J. Interact. Marketing 2001, 15, 2–22. [Google Scholar] [CrossRef]
  67. Cui, D.; Curry, D. Prediction in marketing using the support vector machine. Marketing Sci. 2005, 24, 595–615. [Google Scholar] [CrossRef]
  68. Cortez, P.; Cerdeira, A.; Almeida, F.; Matos, T.; Reis, J. Modeling wine preferences by data mining from physicochemical properties. Decis. Support Syst. 2009, 47, 547–553. [Google Scholar] [CrossRef] [Green Version]
  69. Sharang, A.; Rao, C. Using machine learning for medium frequency derivative portfolio trading. arXiv 2015, arXiv:1512.06228. [Google Scholar]
  70. Esteva, A.; Robicquet, A.; Ramsundar, B.; Kuleshov, V.; DePristo, M.; Chou, K.; Cui, C.; Corrado, G.; Thurn, S.; Dean, J. A guide to deep learning in healthcare. Nat. Med. 2019, 25, 24. [Google Scholar] [CrossRef] [PubMed]
  71. Vellido, A.; Lisboa, P.J.G.; Meehan, K. Segmentation of the on-line shopping market using neural networks. Exp. Syst. Appl. 1999, 17, 303–314. [Google Scholar] [CrossRef]
  72. Boone, D.S.; Roehm, M. Retail segmentation using artificial neural networks. Int. J. Res. Marketing 2002, 19, 287–301. [Google Scholar] [CrossRef]
  73. Arnoux, P.H.; Xu, A.; Boyette, N.; Mahmud, J.; Akkiraju, R.; Sinha, V. 25 Tweets to Know You: A New Model to Predict Personality with Social Media. In Proceedings of the Eleventh International AAAI Conference on Web and Social Media, Montréal, QC, Canada, 15–18 May 2017. [Google Scholar]
  74. Perkins, J. Python 3 Text Processing with NLTK 3 Cookbook; Packt Publishing Ltd.: Birmingham, UK, 2014. [Google Scholar]
  75. Guyon, I.; Weston, J.; Barnhill, S.; Vapnik, V. Gene selection for cancer classification using support vector machines. Mach. Learn. 2002, 46, 389–422. [Google Scholar] [CrossRef]
  76. Bedo, J.; Sanderson, C.; Kowalczyk, A. An efficient alternative to svm based recursive feature elimination with applications in natural language processing and bioinformatics. In Australasian Joint Conference on Artificial Intelligence; Springer: Berlin, Germany, 2006; pp. 170–180. [Google Scholar]
  77. Shmueli, G. To explain or to predict? Statistics Sci. 2010, 25, 289–310. [Google Scholar] [CrossRef]
  78. Zheng, L.; Noroozi, V.; Yu, P.S. Joint deep modeling of users and items using reviews for recommendation. In Proceedings of the Tenth ACM International Conference on Web Search and Data Mining, ACM, Cambridge, UK, 6–10 February 2017; pp. 425–434. [Google Scholar]
Figure 1. Schwartz Value Survey circumplex.
Applsci 09 01992 g001
Figure 2. Research framework.
Applsci 09 01992 g002
Figure 3. Experiment process.
Applsci 09 01992 g003
Figure 4. Deep neural network training and testing with different epochs.
Applsci 09 01992 g004
Figure 5. Mean values of RMSE and R2 about three segmentation variables across different product Categories. (a) Mean values of RMSE; (b) Mean values of R2.
Applsci 09 01992 g005
Figure 6. Difference between subdimensions of SVS in understanding consumer rating.
Applsci 09 01992 g006
Figure 7. Difference between subdimensions of BFF in understanding consumer rating.
Applsci 09 01992 g007
Figure 8. Multiple comparisons between all pairs (Tukey) in product categories for psychographic variable segmentation-based rating prediction (RMSE).
Applsci 09 01992 g008
Figure 9. Multiple comparisons between all pairs (Tukey) in product categories for psychographic segmentation-based rating explaining (R2).
Applsci 09 01992 g009
Figure 10. Multiple comparisons between all pairs (Tukey) in regression methods for psychographic segmentation-based rating prediction (RMSE).
Applsci 09 01992 g010
Figure 11. Multiple comparisons between all pairs (Tukey) in regression methods for psychographic segmentation-based rating explanation (R2).
Applsci 09 01992 g011
Table 1. Schwartz Value Survey (SVS)-related themes.
SVS DirectionSVS DimensionsPositively Related ThemesNegatively Related Themes
Self-EnhancementAchievementSwearingEmpathy, Lord,
Self-TranscendenceBenevolenceFaith (Positive), Faith (Negative), Empathy, Honesty, Family Care, School, Meetings
ConservationConformityFaith (Positive), Faith (Negative), Family Growth, Family Care, Religiosity, Celebration, Group Success, ProselytizingFaith (Negative), Faith (Positive)
Self-EnhancementHedonismRelaxation, SwearingFamily Care, Meetings, Achievement, Religiosity, Religiosity
Self-EnhancementPowerStudentFaith (Negative)
ConservationSecurityFamily Growth, ProselytizingStrive, Action, Nature, Personal, Free, Band, Guitar, Rehearsal, Perform, Money, Enjoy, Spend, Free, Change
Openness to changeSelf-DirectionFaith (Negative), Faith (Positive), Social, Growth, Indulgence, Caring/KnowledgeFaith (Negative), Faith (Positive), Social, Knowledge Gain, Family Care, Social, Growth, Indulgence, Caring/Knowledge
Openness to changeStimulationIndulgence, Knowledge Gain, ExhaustionFaith (Positive), Faith (Negative), Family Care, Religiosity, Celebration
ConservationTraditionReligiosity, Celebration, Proselytizing, Faith (Positive), Faith (Negative), Family Growth, Social, Family CareEnjoyment
Self-TranscendenceUniversalismEmpathy, Faith (Positive), Faith (Negative), Empathy, Family Growth, Social, Growth, Caring/Knowledge, OpennessDaily Routine, Family Care, Student, Faith (Positive), Faith (Negative), Social, Knowledge Gain
Table 2. Big Five Factor (BFF)-related seed words.
Big Five FactorsPositively Related WordsNegatively Related Words
NeuroticismAwful, though, lazy, worse, depressing, irony, terrible, stressful, horrible, sort, annoying, ashamed, banRoad, Southern, visited, ground, oldest, invited, completed
ExtraversionBar, drinks, restaurant, dancing, restaurants, grandfather, Miami, countless, drinking, shots, girls, glorious, pool, crowd, sang, grilledOther, cats, computer, minor
OpennessFolk, humans, of, poet, art, by, universe, poetry, narrative, culture, century, sexual, films, novel, decades, ink, passage, literature, bluesgiveaway
AgreeablenessWonderful, together, visiting, morning, spring, walked, beautiful, staying, felt, share, gray, joy, afternoon, day, moments, hug, gladPorn, cock, fuck
ConscientiousnessCompleted, adventure, adventures, enjoying, Hawaii, deckStupid, boring, desperate, saying, utter, it’s, extreme
Table 3. Experimental dataset description.
Item CategoryTotal Number of UsersTotal Number of ItemsK-Core
Beauty139754810
Office Products72439510
Baby94623110
Grocery and Gourmet Food155649410
Toys and Games103739810
Table 4. Evaluation results of user preference prediction under different experimental settings (partial part of).
Product CategoryClusterIdSampleNumPsychographic VariablesClustering or Not RegressionMethodsRMSER2ReviewLen
Toys and GamesRandom9577RandomRandomRF0.9544 −0.0462 105.3555
Toys and GamesRandom9577RandomRandomRF0.9532 −0.0434 105.3555
Toys and GamesRandom9577RandomRandomLR0.9362 −0.0065 105.3555
Toys and GamesRandom9577RandomRandomLR0.9351 −0.0042 105.3555
Toys and GamesAll9577BFFNot Clustered by DBSCANSVR0.9091 0.0509 105.3555
Toys and GamesAll9577BFFNot Clustered by DBSCANLR0.9084 0.0524 105.3555
Toys and GamesAll9577SVSNot Clustered by DBSCANSVR0.9067 0.0558 105.3555
Toys and GamesAll9577SVSNot Clustered by DBSCANLR0.9007 0.0684 105.3555
Toys and GamesCluster_22044SVSClustered by DBSCANNN1.1217 0.0311 105.3555
Toys and GamesCluster_22044SVSClustered by DBSCANRF0.9350 0.0746 105.3555
Digital MusicCluster_13920SVSClustered by DBSCANSVR1.1081 −0.0632 205.5029
Digital MusicCluster_13920SVSClustered by DBSCANRF1.0575 0.0317 205.5029
Table 5. ANOVA results for experimental settings in predicting consumer rating.
IndexEvaluationFPR (>F)dfSum_sq
PsychographicR236.39 0.0000 2 0.4120
Regression MethodsR232.55 0.0000 3 0.5526
Product CategoryR27.44 0.0000 4 0.1684
ResidualR2 147 0.8320
Clustering or NotR235.20 0.0000 2 0.4028
PsychographicRMSE9.93 0.0001 2 0.0516
Clustering or NotRMSE13.17 0.0000 2 0.0659
Regression MethodsRMSE102.35 0.0000 3 0.7677
Product CategoryRMSE76.31 0.0000 4 0.7632
ResidualRMSE 147 0.3676
Table 6. Tukey’s range test for psychographic segmentation as a whole in understanding consumer preference.
Tukey’s Test for Segmentation
EvaluationsG 1G 2LowerMeandiff (G2−G1)UpperReject (p < 0.05)
R2Clustered by DBSCANNot Clustered by DBSCAN−0.05−0.00270.0446False
R2Clustered by DBSCANRandom−0.167−0.1201−0.0732True
R2Not Clustered by DBSCANRandom−0.1721−0.1174−0.0626True
RMSEClustered by DBSCANNot Clustered by DBSCAN−0.0623−0.0110.0403False
RMSEClustered by DBSCANRandom−0.01030.04060.0914False
RMSENot Clustered by DBSCANRandom−0.00780.05160.1109False
Table 7. Tukey’s test for different psychographic variables.
EvaluationsG1G2LowerMeandiff (G2-G1)UpperReject (p < 0.05)
RMSEBFFRandom−0.01450.03930.0932False
RMSEBFFSVS−0.052−0.00370.0445False
RMSERandomSVS−0.0964−0.04310.0102False
R2BFFRandom−0.158−0.1091−0.0602True
R2BFFSVS−0.01960.02420.0681False
R2RandomSVS0.08490.13330.1817True
Table 8. Importance of different subdimensions of psychographic variable in predicting and explaining user preference.
Importance RankingImportance SupportFeature SourceProduct CategoryPsychographicSubdimensionConsumer or Product
8FALSEposDigital MusicBFFOpennessU
1TRUEposDigital MusicBFFAgreeablenessU
1TRUEposDigital MusicBFFConscientiousnessU
6FALSEposDigital MusicBFFNeuroticismI
5FALSEposDigital MusicBFFExtraversionI
3FALSEposDigital MusicBFFOpennessI
Digital Music
7FALSEposDigital MusicSVSStimU
26FALSEposDigital MusicSVSConfU
25FALSEposDigital MusicSVSHedU
5FALSEposDigital MusicSVSTradU
14FALSEposDigital MusicSVSAchievU
17FALSEposDigital MusicSVSBenevU
4FALSEposDigital MusicSVSPowU
13FALSEposDigital MusicSVSUnivU
16FALSEposToys and GamesSVSS-DI
29FALSEposToys and GamesBFFSecI
1TRUEposToys and GamesBFFStimI
9FALSEposToys and GamesBFFConfI
24FALSEposToys and GamesBFFHedI
19FALSEposToys and GamesSVSTradI
22FALSEposToys and GamesSVSAchievI
30FALSEposToys and GamesSVSBenevI
Table 9. Difference between subdimensions of psychographic in understanding user preference.
Ps1–Ps2 (Importance Ranking)DiffLwrUprP.adj
Subdimensions of SVS
Pow–Achiev−9.5667 −14.4328 −4.7006 0.0000
Pow–Hed−10.4833 −15.3494 −5.6172 0.0000
Sec–Pow14.4780 9.2220 19.7340 0.0000
Stim–Pow9.5667 4.7006 14.4328 0.0000
Univ–Pow14.5667 9.7006 19.4328 0.0000
Univ–Trad8.1167 3.2506 12.9828 0.0000
Univ–Conf7.9833 3.1172 12.8494 0.0000
Trad–Sec−8.0280 −13.2840 −2.7720 0.0000
Sec–Conf7.8946 2.6386 13.1506 0.0000
Univ–S-D7.7776 2.5216 13.0336 0.0001
Sec–S-D7.6889 2.0700 13.3078 0.0004
Pow–Conf−6.5833 −11.4494 −1.7172 0.0005
Trad–Pow6.4500 1.5839 11.3161 0.0007
S-D–Pow6.7891 1.5331 12.0451 0.0012
Pow–Benev−7.4661 −13.4258 −1.5064 0.0021
Univ–Benev7.1006 1.1408 13.0603 0.0049
Sec–Benev7.0118 0.7297 13.2940 0.0131
Univ–Stim5.0000 0.1339 9.8661 0.0371
Univ–Achiev5.0000 0.1339 9.8661 0.0371
Subdimensions of BFF
Openness–Conscientiousness6.7000 1.8339 11.5661 0.0003
Openness–Neuroticism6.0498 0.7938 11.3058 0.0084
Table 10. Tukey’s range test for product category and regression methods.
Tukey’s Test for Product Category
Evaluationsg1g2LowerMeandiff (g2−g1)UpperReject (p Value < 0.05)
RMSEBeautyDigital Music0.057 0.119 0.181 True
RMSEBeautyGrocery and Gourmet Food0.017 0.079 0.142 True
RMSEBeautyOffice Products−0.130 −0.067 −0.004 True
RMSEDigital Music Office Products −0.248 −0.186 −0.124 True
RMSEDigital Music Toys and Games −0.202 −0.141 −0.079 True
RMSEGrocery and Gourmet FoodOffice Products −0.208 −0.146 −0.084 True
RMSEGrocery and Gourmet FoodToys and Games −0.162 −0.101 −0.040 True
R2Beauty Office Products −0.172 −0.095 −0.017 True
R2Office Products Toys and Games 0.004 0.081 0.157 True
Tukey’s Test for Regression Methods
RMSELR NN −0.199 −0.146 −0.094 True
RMSENN RF 0.088 0.140 0.192 True
RMSENN SVR 0.130 0.182 0.235 True
R2LR NN 0.036 0.094 0.151 True
R2LR SVR −0.135 −0.078 −0.022 True
R2NN RF −0.140 −0.082 −0.025 True
R2NN SVR −0.229 −0.172 −0.115 True
R2RF SVR −0.146 −0.090 −0.034 True

