Article

Optical Transmitters without Driver Amplifiers—Optimal Operation Conditions

Institute of Electromagnetic Fields (IEF), ETH Zurich, 8092 Zurich, Switzerland
*
Author to whom correspondence should be addressed.
Appl. Sci. 2018, 8(9), 1652; https://doi.org/10.3390/app8091652
Submission received: 22 August 2018 / Revised: 7 September 2018 / Accepted: 10 September 2018 / Published: 14 September 2018

Abstract

:
An important challenge in optical communications is the generation of highest-quality waveforms with a Mach–Zehnder modulator with a limited electrical swing (Vpp). For this, we discuss, under limited Vpp, the influence of the waveform design on the root-mean-square amplitude, and thus, the optical signal quality. We discuss the influence of the pulse shape, clipping, and digital pre-distortion on the signal quality after the electrical-to-optical conversion. Our simulations and experiments, e.g., suggest that pre-distortion comes at the expense of electrical swing of the eye-opening and results in a lower optical signal-to-noise ratio (OSNR). Conversely, digital post-distortion provides operation with larger eye-openings, and therefore, provides an SNR increase of at least 0.5 dB. Furthermore, we find that increasing the roll-off factor increases the electrical swing of the eye-opening. However, there is negligible benefit of increasing the roll-off factor of square-root-raised-cosine pulse shaped signals beyond 0.4. The findings are of interest for single-channel intensity modulation and direct detection (IM/DD) links, as well as optical coherent communication links.

1. Introduction

Low power consumption is one of the major design goals for the next-generation highly integrated datacom systems [1]. The power consumption of an optical transmitter can be significantly reduced by driver-amplifier-less operation [2]. In transmitters without a driver amplifier, the electrical source is directly connected to the electro-optical modulator [3,4,5]. This reduces the transmitter power consumption [2], improves the link-noise figure [6], and avoids additional noise and non-linear distortions [7,8]. Driver-amplifier-less optical transmitters generating multilevel signals were even shown without digital-to-analog converters (DACs) [9,10]. A key enabler for the driver-amplifier-less optical transmitter technology is an optical modulator with a small Vπ (voltage to switch the modulator from on to off). In fact, numerous optical modulators that can be operated with driving voltages below 1 Vpp (electrical swing) were demonstrated [3,11,12,13,14,15] with speeds up to 100 GBd [16]. For the best performance, the frequency response of optical transmitters must be corrected to mitigate distortions and the resulting inter-symbol interference (ISI). However, the compensation of the transmitter frequency response is known to minimize the electrical output signal power of the DAC [17]; this is due to the increase in the peak-to-average power ratio (PAPR) in pre-distorted signals [18,19,20]. A loss in the electrical signal power is a particular challenge for driver-amplifier-less optical transmitters, because they already have a reduced margin concerning electrical signal power. Therefore, the correct design of the waveform, and eventually, a wisely chosen clipping [21,22,23,24,25,26,27] are required.
State-of-the-art optical transmitters circumvent the penalty of loss in the electrical signal due to predistortion by using electrical driver amplifiers. These amplifiers boost the electrical signal to allow a driving of the modulators in the range of Vπ. Preamplifiers give sufficient margin to apply a digital pre-distortion (DPreD). In fact, digital pre-distortion techniques are more and more deployed in commercial systems. Thus, for instance, a low-cost self-calibration routine to determine the frequency response including the in-phase and quadrature (IQ) skew [28] was developed, and real-time transmission of 1 Tb/s with a 28-nm CMOS ASIC digitally compensating for up to 25 dB of loss in electrical-to-optical (EO) and optical-to-electrical (OE) conversion [29] was shown. DPreD can also cancel, in part, the linear and non-linear distortions. The linear pre-distortion methods compensate for the low-pass characteristic of the transmitter, and therefore, eliminate the inter-symbol interference (ISI) of the signal [30,31,32,33,34,35,36,37]. Non-linear compensation methods can cancel the non-linear transfer function of driver amplifiers, digital-to-analog converters, and Mach–Zehnder modulators. In the case of a dominant non-linear influence on the signal, either Volterra series equalization [38,39,40] or pattern-dependent look-up table-based corrections [41,42] were demonstrated to increase the system performance. Furthermore, the nonlinear Mach–Zehnder modulator transfer function can, for instance, also be linearized by inversion of the latter [40,43] or by the design of a special modulator [44].
However, because of an increasing demand for transmitters with a reduced power consumption and the emergence of high-speed optical modulators with a small Vπ, it is of interest how to design a waveform that optimizes the optical signal-to-noise ratio (OSNR) generated by a driver-amplifier-less optical transmitter.
In this paper, we extend our previous work [45] and show that the correct choice of roll-off factor (ROF) for the signal-pulse shape in combination with clipping and that the digital post-distortion (DPostD), rather than DPreD, enhance the optical signal quality of the driver-amplifier-less transmitters. More precisely, we show that increasing the ROF of a square-root-raised-cosine (SRRC) signal results in a larger electrical eye-opening; however, increasing the ROF beyond 0.4 does not bring benefit with respect to electrical eye-opening. Furthermore, we investigate the impact of clipping to SRRC signals. We also report that DPreD reduces the root-mean square (RMS) amplitude. Instead, DPostD, rather than DPreD, can be used to correct for the transmitter frequency response without influencing the transmitter electrical signal power, and subsequently, the OSNR after the optical modulator. Our simulative analyses were obtained with MATLAB and Mathematica. We substantiated our findings with measurement results showing the gain by DPostD in dependence of DAC output swing, roll-off factor, and symbol rate.

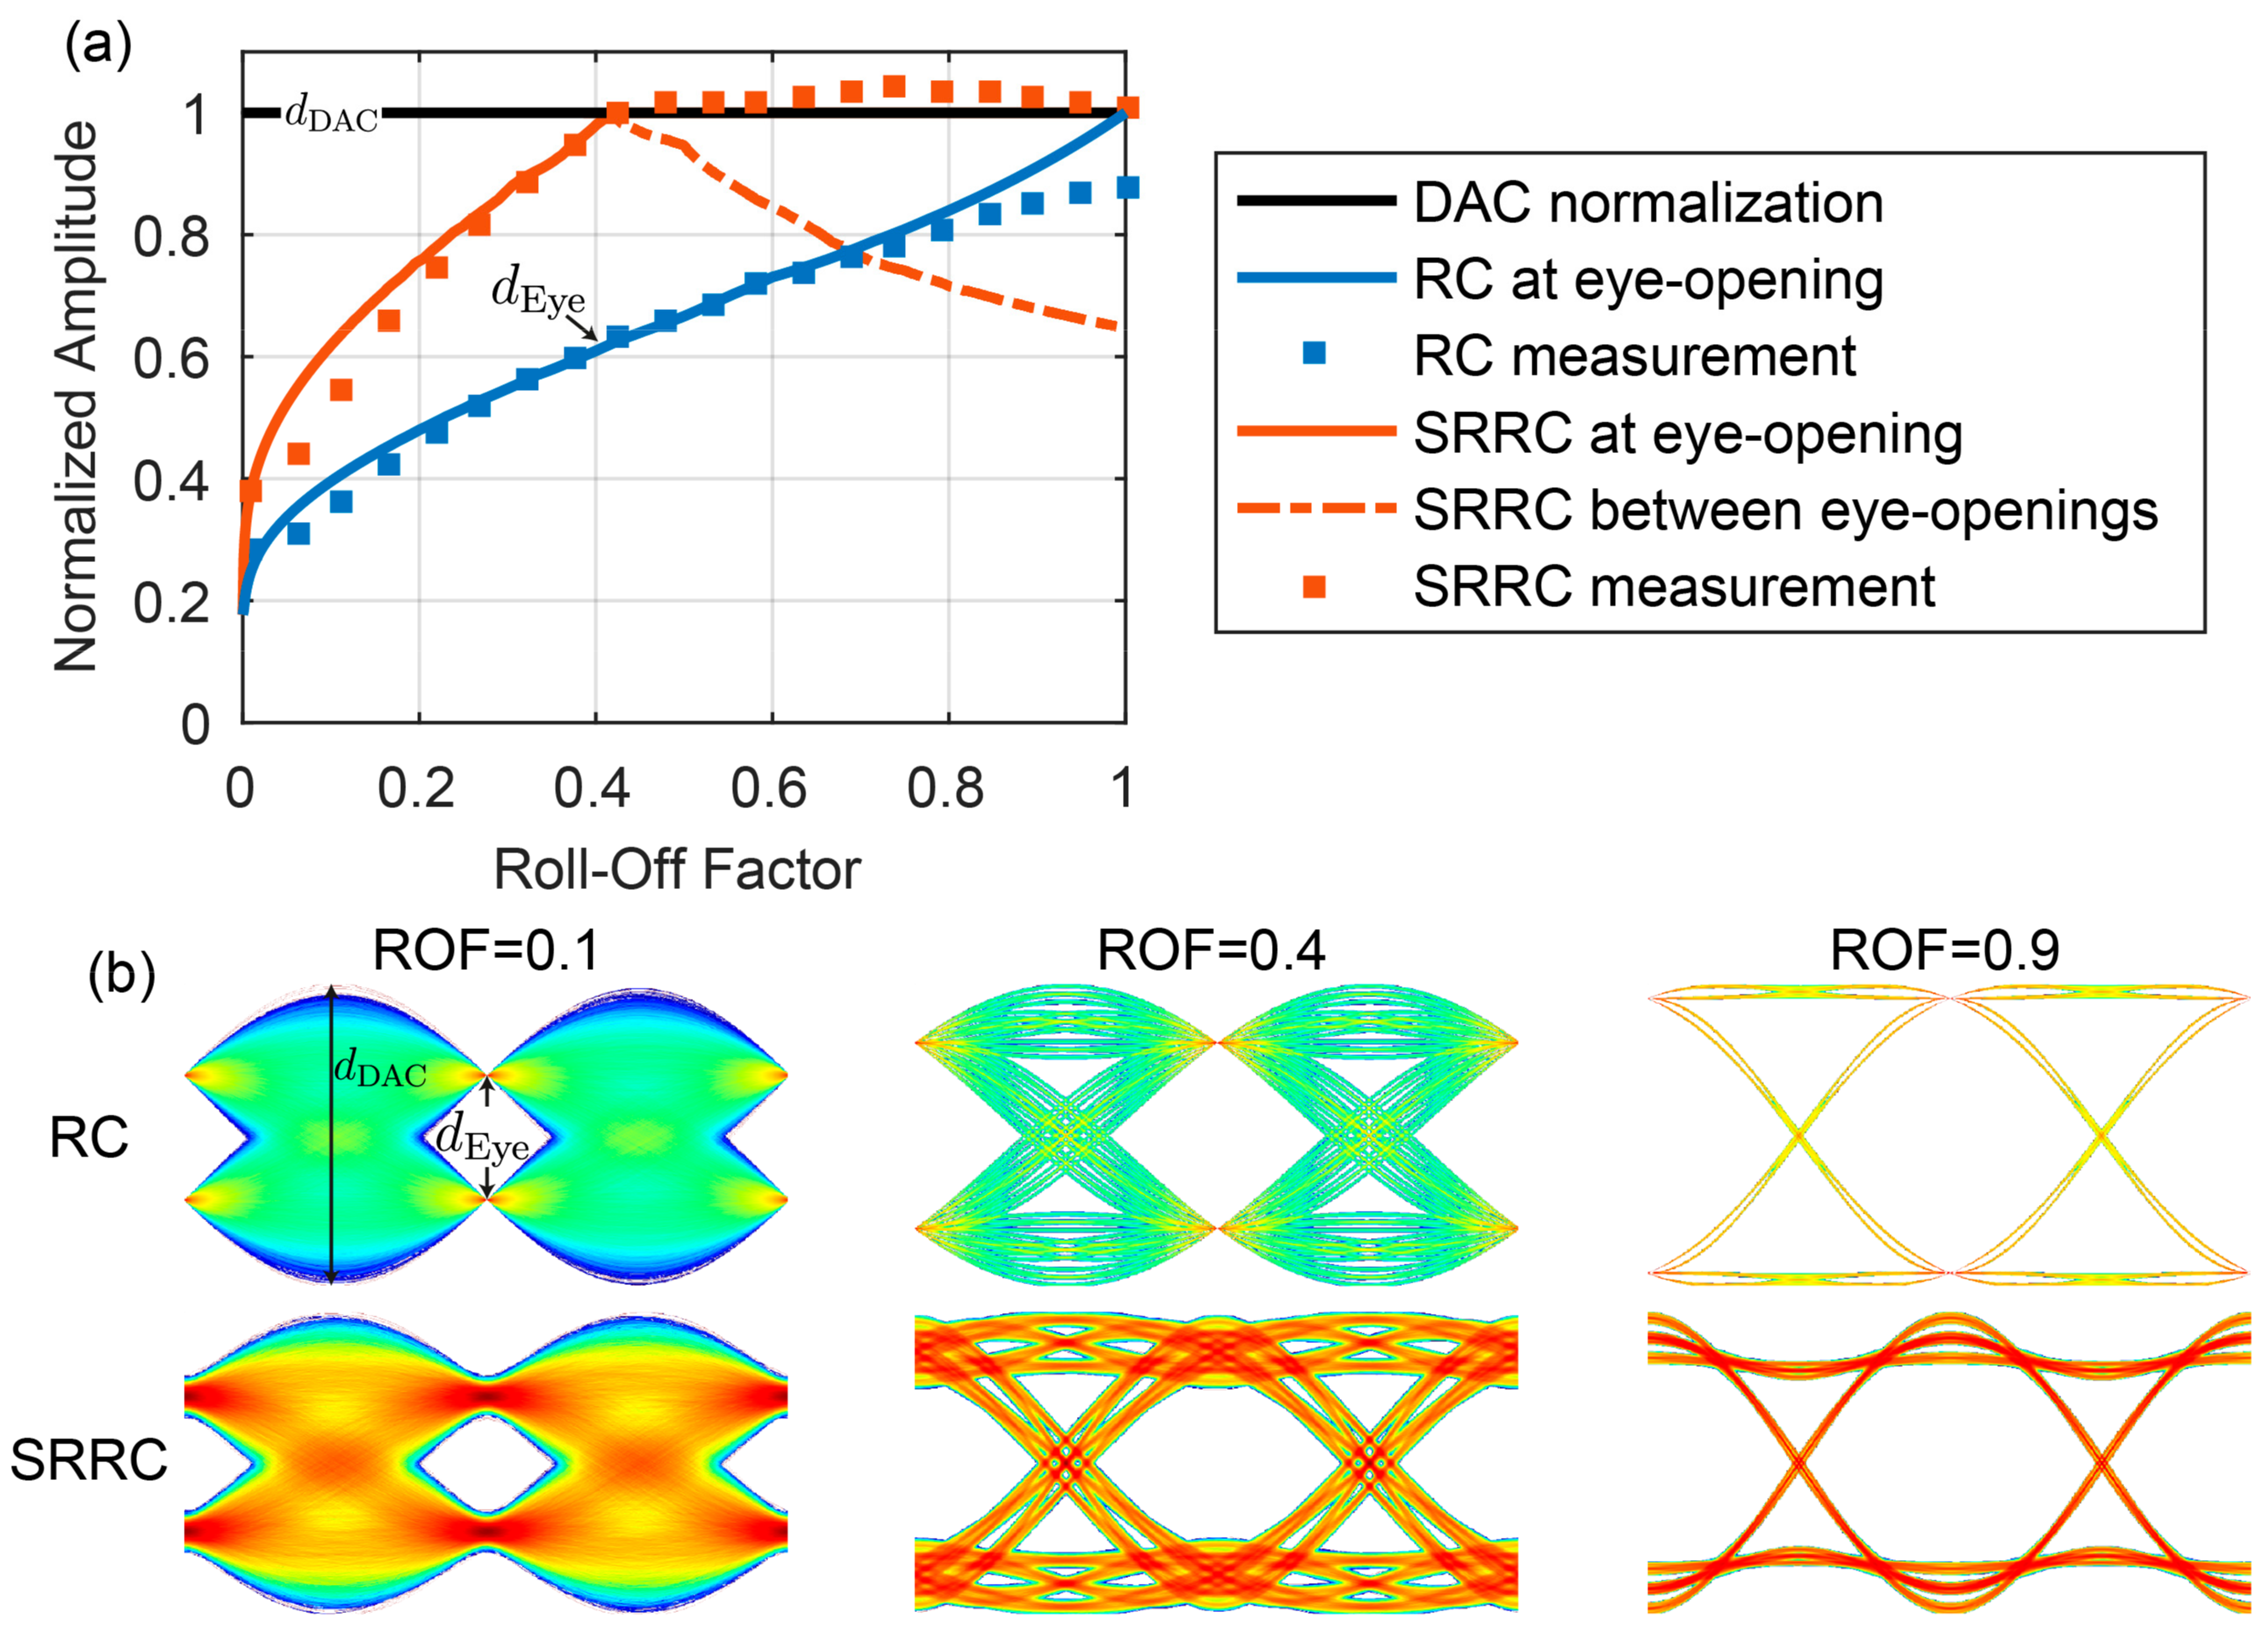
2. Influence of Pulse Shape on the Electrical Eye-Opening

The swing of the electrical eye-opening depends on the maximum available DAC output voltage and the chosen pulse shape. Generally, the maximum of the signal waveform is normalized to the maximum of the DAC output swing d DAC . The eye-opening d Eye is then a fraction thereof, as shown Figure 1. This fraction depends on the pulse shape.
In the past, pulse shaping was mostly done by pulse carving. Here, a second optical modulator was used to shape the form of the optical pulses in a desired manner [46,47,48,49]. Pulse carving with different duty cycles showed advantages in transmission distance [50] and also enabled high-capacity links [51]. Carving of sinc-shaped pulses with very high quality was also shown [52]. However, due to the simplified set-up and versatility, we restricted the analysis of this article to digital pulse shaping and the use of only one optical modulator. Digital pulse shaping is extremely versatile and allows for arbitrary pulse shapes. Due to the advantageous characteristics in transmission, raised-cosine pulse shapes emerged. They are an efficient trade-off between the rectangular and the sinc-like pulse. In transceivers, the raised-cosine (RC) frequency response can be split into a square-root-raised-cosine (SRRC) filter at the transmitter and an SRRC filter at the receiver. This allows matched filtering and leads to inter-symbol interference (ISI)-free waveforms [53]. The excess bandwidth B of these filters depends on the roll-off factor (ROF) and the symbol rate R , and is calculated by B =   0.5 ( 1 + R O F ) R .
We analyzed the amplitude of the eye-opening for RC and SRRC and found different dependencies for the ROF. Figure 1 shows the results of this analysis, where we used a pulse-amplitude modulation (PAM) signal with two levels and determined the amplitude of the waveform. In Figure 1a, the amplitude over ROF is plotted for signals with RC pulse shape in blue and for signals with SRRC pulse shape in red. Here, we show the amplitude at the eye-opening as a solid line and the amplitude between the eye-openings as a dashed line. For the simulations, we always determined the maximum value at these positions, as this defines the scaling for the DAC. In Figure 1a, we also show experimentally determined results for the RMS amplitude plotted with square markers. The experimental results were linearly scaled to fit to the simulation.
For RC signals, the amplitude of the eye-opening increases with the ROF. This value is marked as d Eye in Figure 1. The increase can be seen in simulations and measurements in blue in Figure 1a, as well as in the eye-diagrams for RC signals in Figure 1b. The reason for this is the decreasing swing in between the eye-openings. Since the waveform is normalized to this maximum value, this leads to an effective increase of the eye-opening. The dependence of the overshoot between two symbols for Nyquist filtering and the resulting restrictions were also discussed in Reference [31].
For SRRC signals, the behavior is different. When increasing the ROF, the amplitude of the eye-opening increases until 0.4, but does not further increase above that amplitude [54] (red square markers). After an ROF of slightly above 0.4, the maximum value between the eye-openings becomes smaller than the value at the eye-opening (intersection of red dashed and red solid line). For simplicity, we used 0.4 as the ROF for the intersection.
To illustrate the above-discussed behaviors, we show the impact to the signal generated by a DAC; Figure 1b shows simulated eye-diagrams for RC and SRRC signals with ROFs of 0.1, 0.4, and 0.9. All eye-diagrams were scaled to the same size, which depict the behavior the DAC would have while generating such a signal. The eye-opening for the RC signals increases from left to right, whereas, for SRRC signals, the eye-opening increases from an ROF of 0.1 to 0.4; however, at 0.4, the maximum value of the waveform is already at the eye-opening. Thus, there is no further increase of the RMS amplitude for an ROF larger than 0.4.
In conclusion, maximizing the OSNR in driver-amplifier-less transceivers can, in a first step, be realized by maximizing the electrical driving amplitude. For this, it was expected that increasing the ROF would be beneficial. However, for the case of SRRC signals, which are generally used for the transmitter, there is no benefit of increasing the ROF above 0.4. The analysis was done for a symbol rate which was well below the bandwidth limitations of the DAC. The simulations were done without restrictions of DAC resolution, effective number of bits (ENOB), SNR, and bandwidth. This is reasonable because, for this step, the influence of the pulse shape to the waveform was of interest and not the whole transceiver performance.

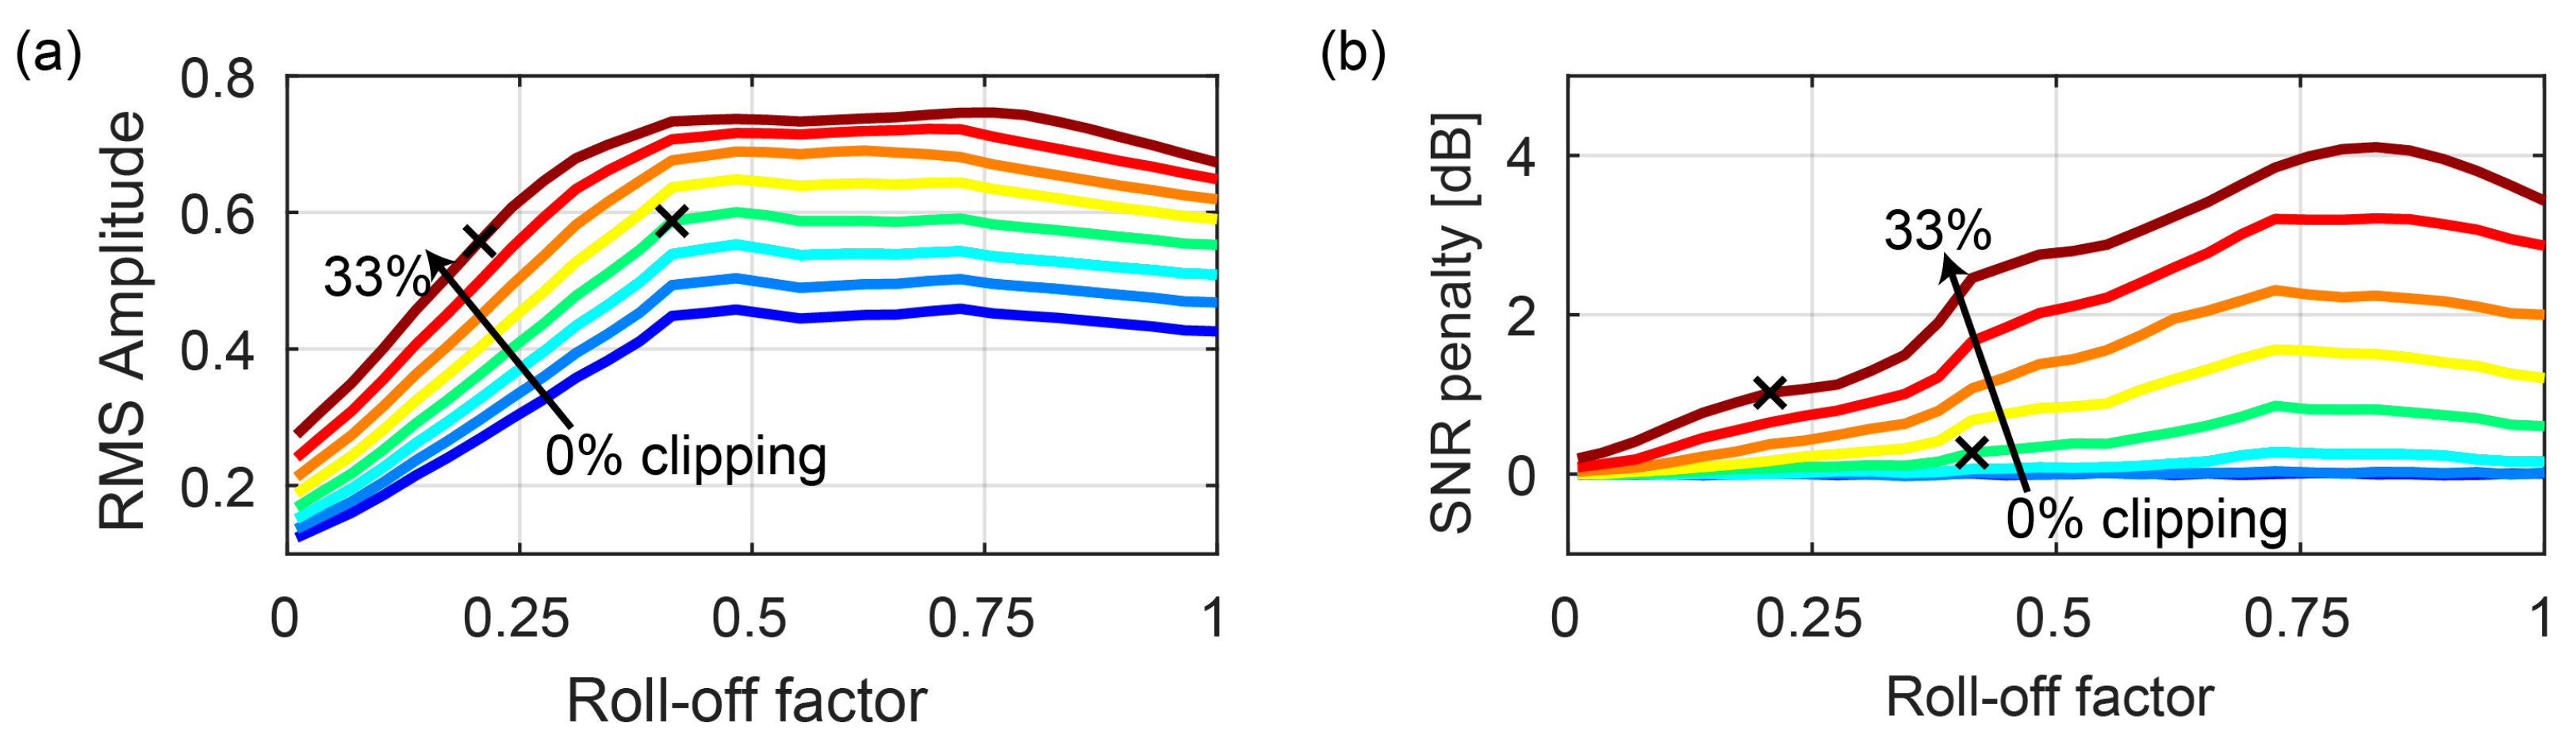
3. Investigation of the Effect of Clipping on the Electrical Eye-Opening

A reason for the roll-off factor dependence of the eye-opening as discussed in the previous section is the peak-to-average power ratio (PAPR). The different PAPRs can be seen in the simulated eye diagrams of Figure 1b. Especially, in the context of multicarrier systems [22], e.g., orthogonal frequency-division multiplexing (OFDM) [23,24,26,55], high PAPR is a well-discussed fundamental issue. Clipping is a solution to handle waveforms with a large PAPR [21,22,23,24,25,26,27]. Clipping limits the maximum amplitude to a certain level. This can be either achieved using a nonlinear driver amplifier or by clipping the values in the digital domain [22]. Clipping reduces the dynamical range, and thus, allows the reduction of the number of required bits for the analog-to-digital conversion [21]. Clipping, however, induces additional noise [21], and therefore, needs to be applied wisely.
Figure 2 shows a simulation for the impact of clipping on SRRC signals. We generated waveforms with one million PAM-2 symbols, oversampled with two samples per symbol, and SRRC as a pulse shape. The waveforms were clipped at different amplitude levels and received with a matched filter; finally, the SNR penalty was evaluated. Eight different clipping values between 0% and 33% clipping were chosen. These clipping values were chosen because they allowed an analysis of up to an SNR penalty of slightly more than 3 dB. A value of 0% clipping means no clipping at all, whereas 33% clipping means that the amplitude was saturated for values above 67% of the positive and negative maximal amplitude. Figure 2a shows the root-mean square (RMS) value of the signal amplitude normalized to the maximum value as a function of different roll-off factors. For a wide range, the RMS amplitude increases with clipping and roll-off factor. Figure 2b shows the resulting SNR penalty from clipping. The SNR penalty increases significantly with the roll-off factor. This is contrary to the optimum in RMS amplitude. Therefore, the ideal ROF lies in the area of 0.4, which allows a large RMS amplitude, but limits the SNR penalty due to clipping. The black crosses in Figure 2 indicate examples at ROFs of 0.2 and 0.4. The power for an ROF of 0.2 with 33% clipping is similar to the power for an ROF of 0.4 with clipping of only 14%. However, the SNR penalty at 0.2 with 33% of clipping is 1 dB, and for 0.4 with 14% clipping, the penalty is only 0.27 dB. This leads to the conclusion that clipping can help increase the RMS amplitude, and thus, the modulation efficiency of the EO conversion. However, a smart choice of ROF does further increase the signal quality. The ROF should not be blindly chosen and just compensated for by applying clipping.

4. Influence of DPreD on the Electrical Eye-Opening
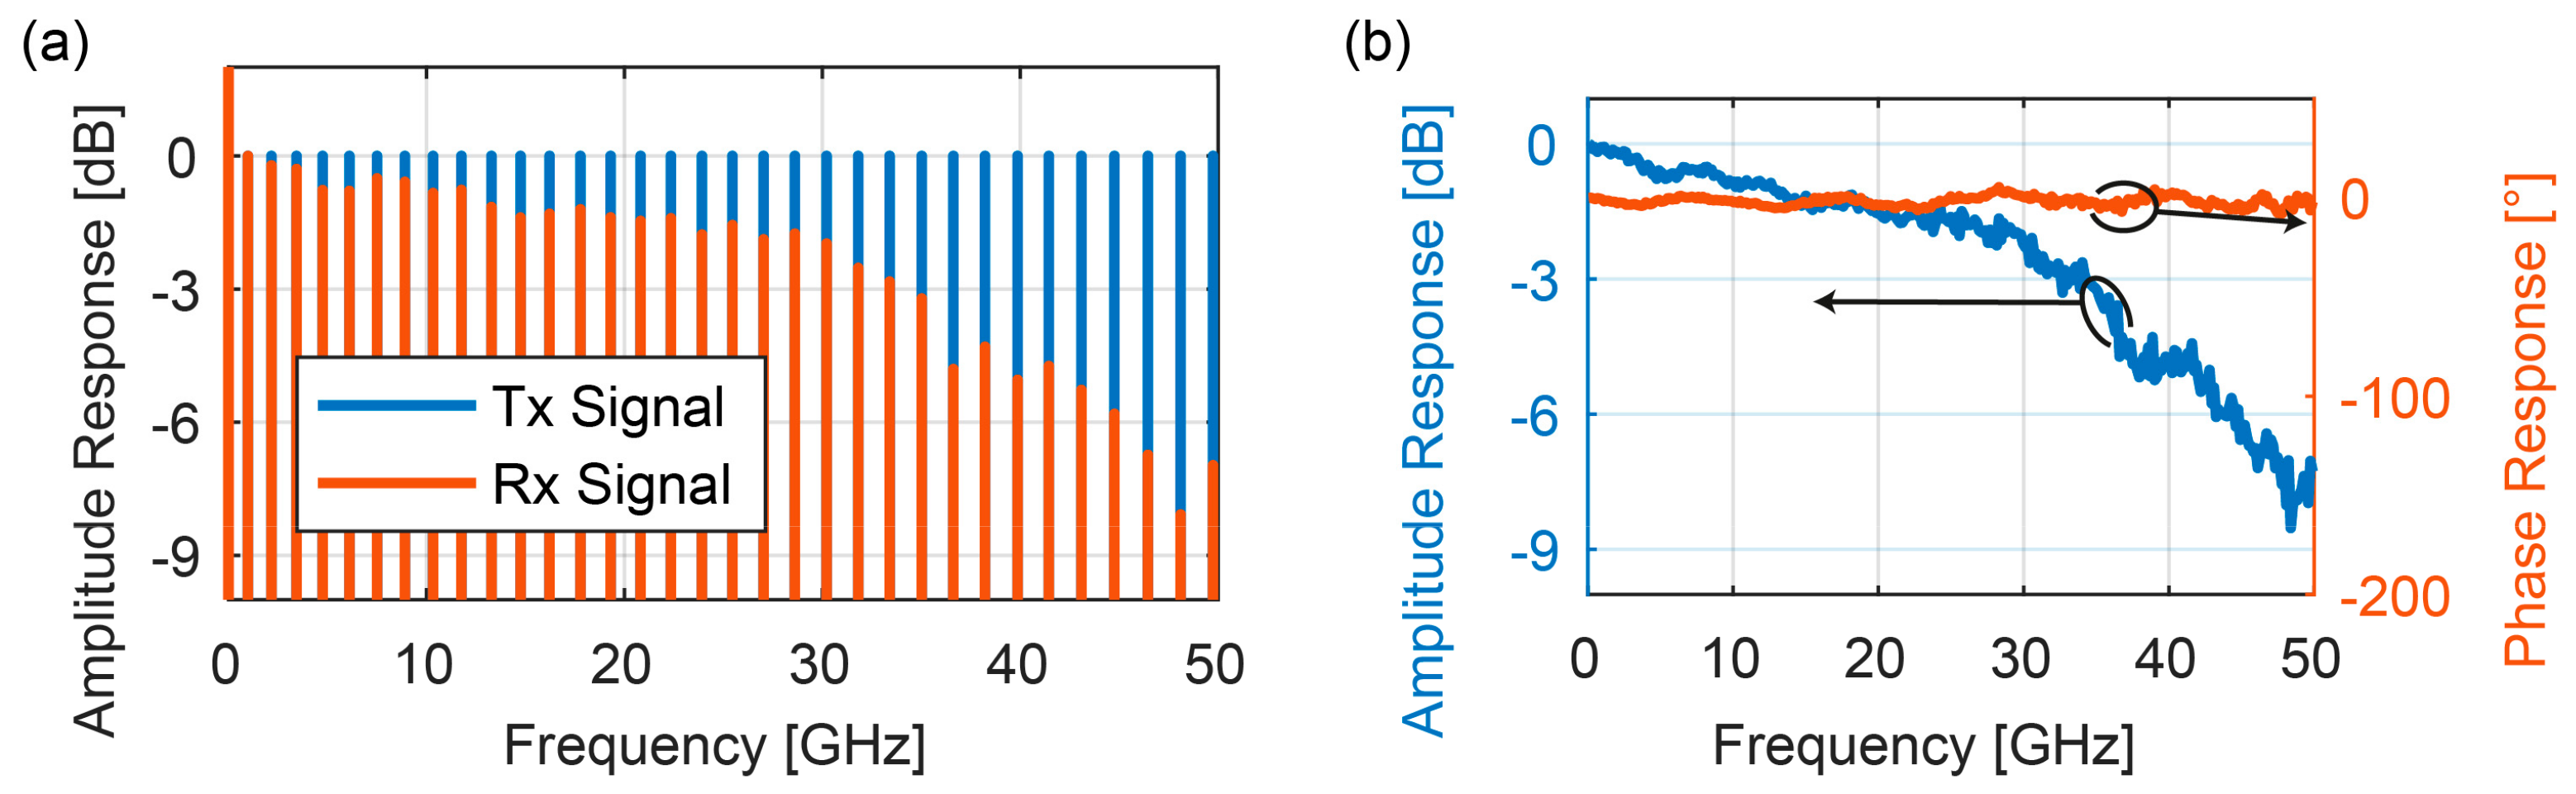
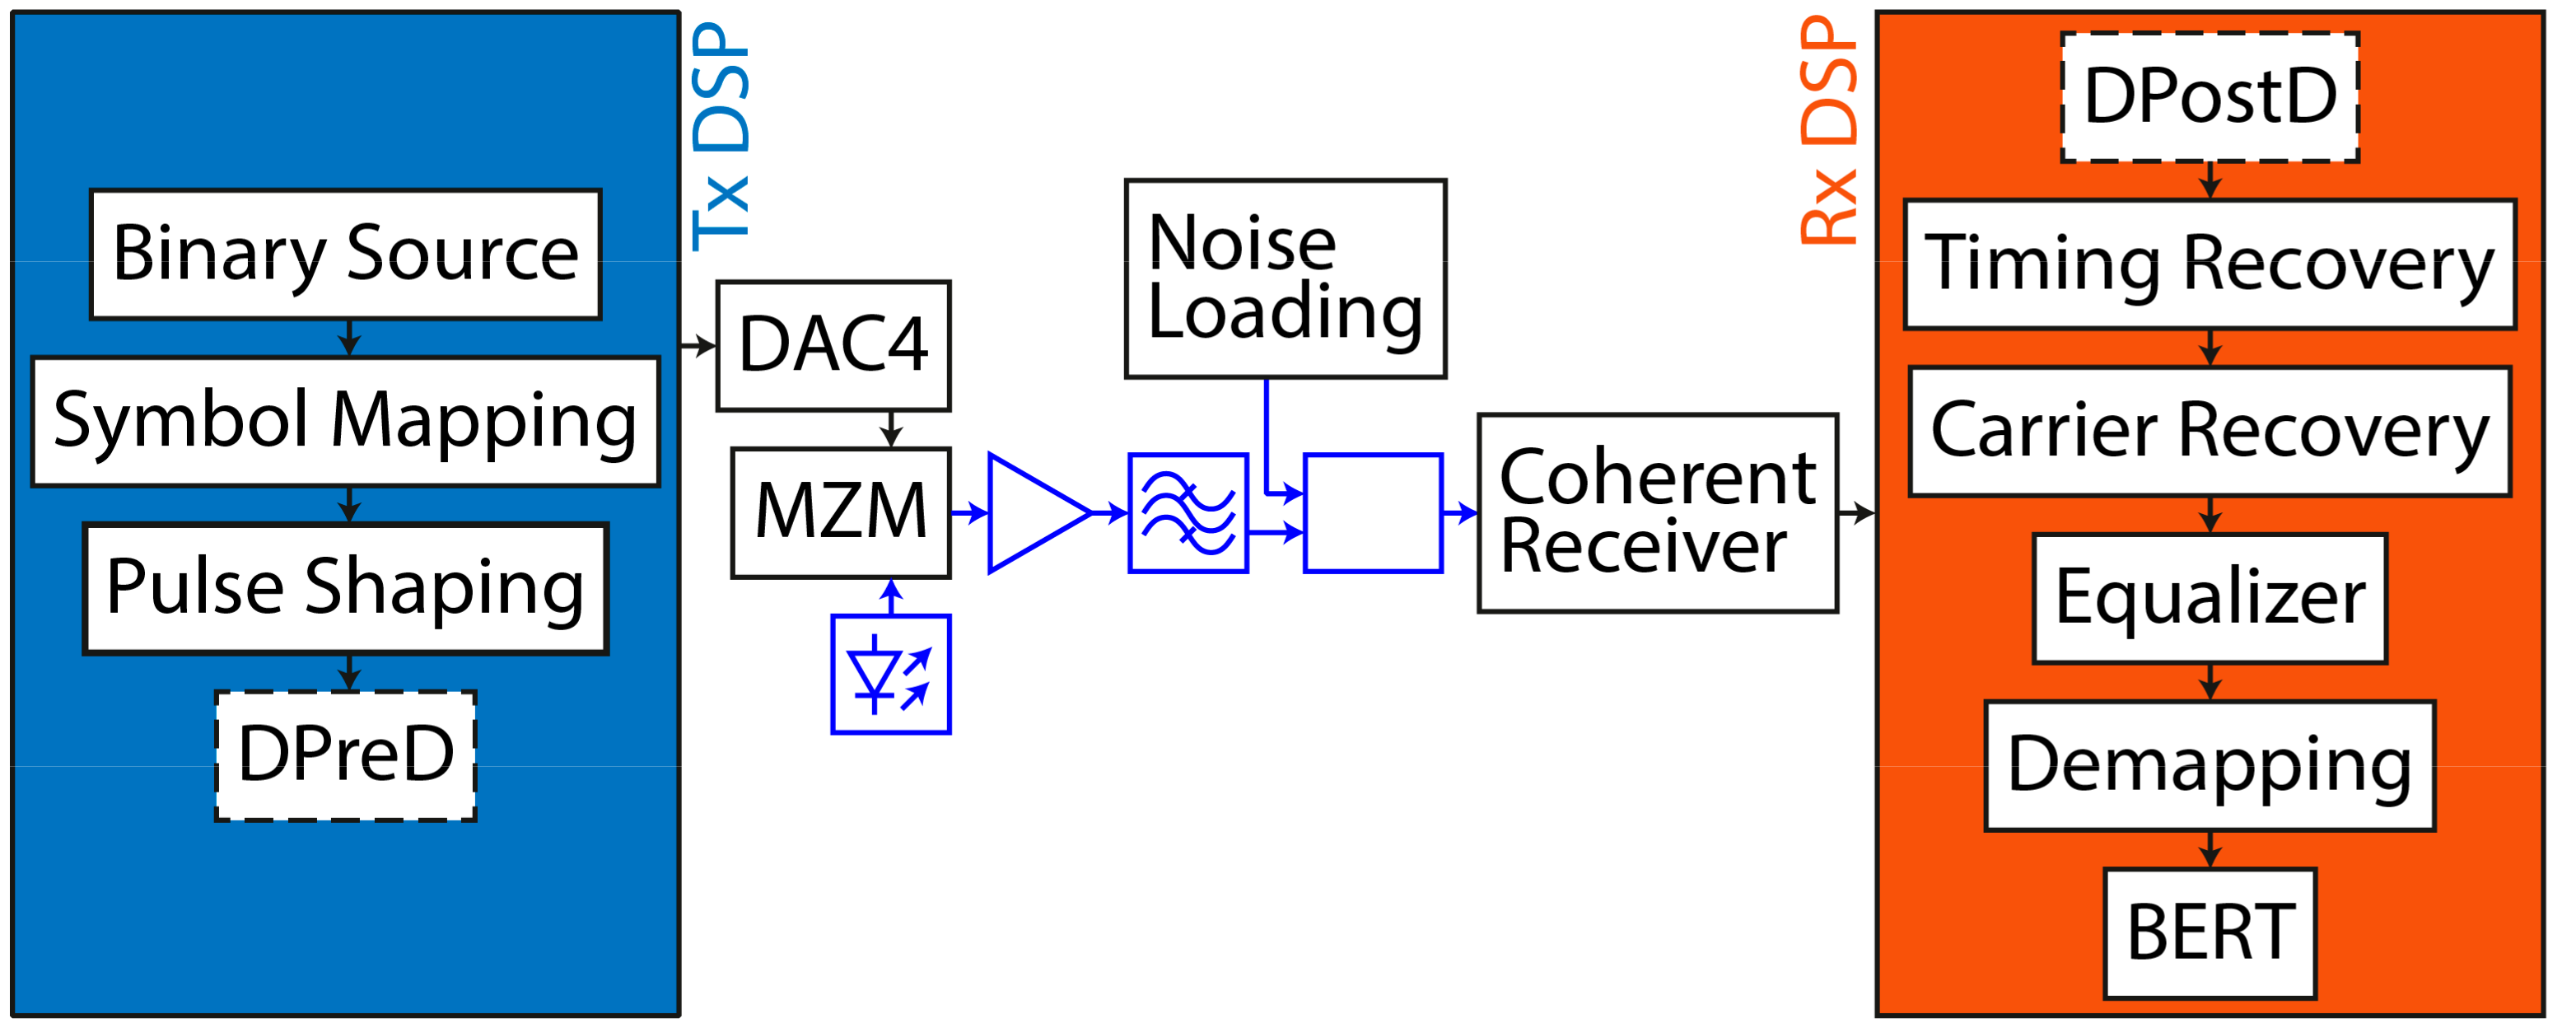
In this section, we describe how the complex frequency response of the link is measured, and we show the influence of DPreD on the RMS amplitude and the bit error ratio (BER) performance as derived from optical measurements. When speaking of DPreD, we correct the transmitter frequency response in the transmitter digital signal processing (DSP) before the digital-to-analog conversion; in the case of DPostD, the finite impulse response (FIR) filter correcting the transmitter frequency response is applied right at the beginning of the receiver DSP.
To measure the frequency and phase response of the link, we generated a test signal and measured its frequency and phase response at the receiver. The test signal consisted of a frequency comb with predefined phase relations. The best results were obtained for a frequency comb that was only constructed with spectral coefficients that correspond to prime numbers [56]. If equidistant spacing was taken, mixing products, e.g., due to non-linearities (NL), would have interfered with the desired spectral lines and possibly could have impaired the measurements. The phase relations of the spectral lines were chosen randomly; this reduced the peak-to-average power ratio of the test signal [57]. This signal was generated with the Micram DAC4 and measured in an electrical back-to-back configuration with an oscilloscope. The measured signal was Fourier-transformed and the difference to the transmitted signal was evaluated. The FIR filter impulse response for the DPreD, as well as that for the DPostD, was then determined by the inverse Fourier transform of the relative change in the coefficients.
Our experimental evaluations showed that the frequency comb is a good test signal to analyze the operation conditions of the set-up (e.g., for the bias voltage of the Mach–Zehnder modulator), minimizing the mixing products between the lines and maximizing the spectral lines lead to a linear operation point with the smallest non-linear mixing products.
Figure 3a shows the amplitude spectrum of a measured frequency comb with 34 spectral lines (chosen as discussed above) for the digitally designed signal in blue and the measured signal in red. The small number of spectral lines was chosen for depictive reasons only. It was previously shown that more spectral lines give an improvement in final signal quality after application of the correction filter. The frequency and phase response, as plotted in Figure 3b, were determined as the difference of the transmitted and received signal for a frequency comb with 331 spectral lines. This measurement shows 3-dB and 6-dB bandwidths of 33 GHz and 44 GHz, respectively.
Applying the correction filter to a new iteration of a comb-based frequency response measurement led to a flat response in frequency and phase. Afterward, the correction filter could be updated to slight changes in the experimental set-up or drifts by the impulse response of the least-mean-square equalizer of transmitted data. The update was done by a convolution of both impulse responses.
In the next step, we evaluated the influence of DPreD on the output of our DAC. The measurements were done with an electrical back-to-back set-up, where the RMS amplitude of the DAC output was directly measured with an oscilloscope with 160 GSa/s. Figure 4 shows a measurement series for SRRC signals with a range of different symbol rates and roll-off factors with and without DPreD. The colors indicate different symbol rates. For each symbol rate, roll-off factors between zero to one were tested. For symbol rates beyond 50 GBd, we swept the roll-off factor from zero until the highest possible, limited by f s / 2 B = 0.5 ( 1 + R O F ) R , where f s is the sampling frequency.
Three effects can be seen in the results. Firstly, the saturation for SRRC signals at a roll-off factor above 0.4, as described in Section 2, can be seen. Secondly, the influence of the DAC’s frequency response to the signals without DPreD can be seen in Figure 4a. That is why the measured RMS amplitude decreases for higher signal bandwidths. The slope of the amplitude decrease follows the evaluated response from Figure 3b. Thirdly, the difference between Figure 4a,b shows the influence of DPreD on the electrical eye-opening. In particular, for high symbol rates, there is a significant attenuation of the electrical eye-opening by DPreD upon comparing it to the case where no DPreD was used.

5. Measurements

We evaluated the influence of DPreD in a coherent optical link. We show 16QAM 28- and 56-GBd signals generated using the SRRC pulse shape. The signals were generated with a Micram DAC4 [58] with a sampling rate of 100 GSa/s, a 3-dB bandwidth of 35 GHz, and a frequency-dependent ENOB between 4 and 6 bits. The DAC was connected without driver amplifiers to an LiNbO3 Oclaro modulator ( V π of 3.5 V, 3-dB bandwidth of 38 GHz). The measurements were done with a coherent receiver with a sampling rate of 160 GSa/s and a 3-dB bandwidth of 63 GHz. The performance was evaluated for different DAC output swings, roll-off factors, and symbol rates.
Figure 5 summarizes the applied DSP steps and gives an overview of the experimental set-up. In the transmitter (Tx) DSP, binary information was mapped to complex symbols, the desired pulse shape was applied, and, if desired, the DPreD was used to correct the frequency response. The experimental set-up consisted of the Micram DAC4 connected without electrical driver amplifiers to the IQ modulator, which modulated a laser operated at a wavelength of 1550 nm. The optical output of the modulator was amplified and filtered with a 2-nm bandpass filter before it was detected with a coherent receiver. In the receiver (Rx) DSP, DPostD was applied in the first step—if desired. Afterward, timing recovery [59], carrier recovery, least-mean-square equalization, hard decision demapping, and bit error ratio testing (BERT) were applied. For the analysis below, we report the BER we acquired using the BERT and the effective SNR, which we determined by comparing the transmitted symbols with the received symbols after the equalizer. The effective SNR allows modulation format-independent analyses and was, therefore, chosen for the final evaluations.
Figure 6a,b show the influence of the DAC output voltage on the bit error ratio (BER) and the effective SNR of a 28-GBd 16QAM signal. The BER was determined from the ratio of wrongly transmitted bits to the total number of transmitted bits. The DAC output swing could be chosen between 350 and 750 mVpp. We evaluated the performance in the low- and the high-SNR regime and show the results for DPreD in blue and DPostD in red. The SNR was adapted to the low- and high-SNR regime by optical noise loading. Due to the higher electrical signal power of signals with DPostD, there is an improvement in the low-SNR, as well as the high-SNR, regime when compared to DPreD. In both SNR regimes, there is an increase of 0.5 dB in effective SNR when changing from DPreD to DPostD. This corresponds to an increase of 12% in optical signal power.
Figure 6c shows the BER for a 56-GBd 16QAM signal measured for different roll-off factors. The performance increases with the roll-off factor. The slope of the improvement changes at an ROF of 0.4, which can be seen due to the given trend lines that are given below and above 0.4. The change in BER slope at a roll-off factor of 0.4 can be attributed to the amplitude of SRRC signals, as discussed in Section 2. We attribute the continued BER improvement above 0.4 to a wider horizontal eye-opening, which gives resilience toward jitter, and thus, a better BER.
To show the gain in overall signal quality due to DPostD, we measured, in a final step, the effective SNR for different symbol rates and ROFs, and compared the results of DPreD with the results of DPostD. Figure 7a shows the effective SNR for symbol rates of 14, 28, 56, 71, 80, and 96 GBd with roll-off factors of 0.04, 0.4, and 0.7 with DPreD as the compensation scheme. The possible symbol rate and roll-off factors are limited by the DAC sampling rate by f s / 2 B = 0.5 ( 1 + R O F ) R , which explains the fewer measurement points for the ROFs of 0.4 and 0.7. Figure 7b shows the measurement results for compensation using DPostD. The trend follows the expected decrease of SNR for higher symbol rates. When increasing the symbol rate from 28 GBd to 56 GBd, there is a decrease in SNR of 3 dB, which is expected due to the fixed signal power, fixed noise spectral density, and the doubling of the signal bandwidth. In addition, it shows that the signal quality increases with ROF. However, when changing from 0.4 to 0.7, the increase is negligible, which follows the results of Section 2. Figure 7c shows the comparison of the measured effective SNR for DPreD to DPostD with a roll-off factor of 0.04. Over all measured symbol rates, there is an SNR gain of at least 0.5 dB, which shows the advantage of DPostD over DPreD for a wide range of symbol rates.
The results in this section clearly indicate that DPostD is beneficial for transmission links that use Mach-Zehnder modulators, which are operated with rather small electrical swings (such as in driver-amplifier-less systems). However, if the link is strongly influenced by nonlinear effects, linear DPostD might experience a penalty compared to DPreD. This is, e.g., the case for a driver amplifier limited by saturation, a modulator operated close to V π , or a nonlinear fiber link. In these cases, the linear DPostD needs to be supported by a nonlinear compensation.

6. Conclusions

We investigated the prerequisites for cost-efficient driver-amplifier-less optical transmitters. Without driver amplifiers, a signal with maximum electrical eye-opening is advantageous. For this, we investigated the influence of the pulse shape, clipping, and DPreD on the electrical eye-opening. We showed that increasing the ROF of SRRC signals up to an ROF of 0.4 is advantageous, but there is little advantage for ROFs beyond 0.4. We also showed that DPostD results in better BER performances than DPreD.

Author Contributions

Conceptualization, A.J., B.B., and J.L. Data curation, A.J. and W.H. Formal analysis, A.J., B.B., and J.L. Investigation, A.J., B.B., R.B., W.H., and J.L. Methodology, A.J., B.B., R.B., and J.L. Project administration, A.J. and J.L. Resources, J.L. Software, A.J. and B.B. Supervision, J.L. Validation, A.J., B.B., R.B., and J.L. Visualization, A.J. and R.B. Writing—original draft, A.J. Writing—review and editing, A.J., B.B., R.B., W.H., and J.L.

Funding

The EU-project PLASMOfab (688166) and the ERC PLASILOR (670478) are acknowledged for financial support.

Acknowledgments

We thank Oclaro for supplying us with the DP IQ modulators. We also thank unknown reviewers that helped improve the discussions of this manuscript with their valuable feedback.

Conflicts of Interest

The authors declare no conflicts of interest.

References

  1. Miller, D.A.B. Attojoule optoelectronics for low-energy information processing and communications. J. Lightw. Technol. 2017, 35, 346–396. [Google Scholar] [CrossRef]
  2. Fujisawa, T.; Kanazawa, S.; Takahata, K.; Kobayashi, W.; Tadokoro, T.; Ishii, H.; Kano, F. 13-μm, 4 × 25-gbit/s, eadfb laser array module with large-output-power and low-driving-voltage for energy-efficient 100 gbe transmitter. Opt. Express 2011, 20, 614. [Google Scholar] [CrossRef] [PubMed]
  3. Kataoka, T.; Miyamoto, Y.; Hagimoto, K.; Wakita, K.; Kotaka, I. Ultrahigh-speed driverless mqw intensity modulator, and 20 gbit/s, 100 km transmission experiments. Electron. Lett. 1992, 28, 897–898. [Google Scholar] [CrossRef]
  4. Loi, K.K.; Shen, L.; Wieder, H.H.; Chang, W.S.C. Novel high-frequency electroabsorption multiple-quantum-well waveguide modulator operating at 1.3 μm on gaas substrates. Optoelectron. Integr. Circ. 1997. [Google Scholar] [CrossRef]
  5. Wang, L.; Hu, R.; Li, M.; Qiu, Y.; Chen, D.; Xiao, X.; Li, Z.; Yu, Y.; Yu, J.; Yang, Q.; et al. Transmission of 24-Gb/s PAM-4 over 150-km SSMF using a driverless silicon microring modulator. In Proceedings of the Asia Communications and Photonics Conference 2014, Shanghai, China, 11–14 November 2014. [Google Scholar]
  6. Ackerman, E.; Betts, G.; Burns, W.; Prince, J.; Regan, M.; Roussell, H.; Cox, C. Low noise figure, wide bandwidth analog optical link. In Proceedings of the 2005 International Topical Meeting on Microwave Photonics, Seoul, Korea, 14 October 2005; pp. 325–328. [Google Scholar]
  7. Cox, C.H.; Ackerman, E.I.; Betts, G.E.; Prince, J.L. Limits on the performance of RF-over-fiber links and their impact on device design. IEEE Trans. Microw. Theory Tech. 2006, 54, 906–920. [Google Scholar] [CrossRef]
  8. Zhou, W.; Okusaga, O.; Nelson, C.; Howe, D.; Carter, G. 10 ghz dual loop opto-electronic oscillator without rf-amplifiers. In Proceedings of the Optoelectronic Devices, San Jose, CA, USA, 19–24 January 2008. [Google Scholar] [CrossRef]
  9. Shastri, A.; Webster, M.; Jeans, G.; Metz, P.; Sunder, S.; Chattin, B.; Dama, B.; Shastri, K. Experimental demonstration of ultra-low-power single polarization 56 Gb/s QAM-16 generation without DAC using CMOS photonics. In Proceedings of the 2014 The European Conference on Optical Communication (ECOC), Cannes, France, 21–25 September 2014; pp. 1–3. [Google Scholar]
  10. Wolf, S.; Lauermann, M.; Schindler, P.; Ronniger, G.; Geistert, K.; Palmer, R.; Kober, S.; Bogaerts, W.; Leuthold, J.; Freude, W.; Koos, C. Dac-less amplifier-less generation and transmission of qam signals using sub-volt silicon-organic hybrid modulators. J. Light. Technol. 2015, 33, 1425–1432. [Google Scholar] [CrossRef]
  11. Fujisawa, T.; Kanazawa, S.; Takahata, K.; Kobayashi, W.; Tadokoro, T.; Ishii, H.; Kano, F. Large-Output-Power, Ultralow-Driving-Voltage (0.5 Vpp) Operation of 1.3-um, 4 × 25 G, EADFB laser array for driverless 100 Gbe transmitter. In Proceedings of the European Conference on Optical Communication 2011, Geneva, Switzerland, 18–22 September 2011. [Google Scholar]
  12. Palmer, R.; Alloatti, L.; Korn, D.; Schindler, P.C.; Baier, M.; Bolten, J.; Wahlbrink, T.; Waldow, M.; Dinu, R.; Freude, W.; et al. Low power mach-zehnder modulator in silicon-organic hybrid technology. IEEE Photonics Technol. Lett. 2013, 25, 1226–1229. [Google Scholar] [CrossRef]
  13. Timurdogan, E.; Sorace-Agaskar, C.M.; Sun, J.; Hosseini, E.S.; Biberman, A.; Watts, M.R. An ultralow power athermal silicon modulator. Nat. Commun. 2014, 5, 4008. [Google Scholar] [CrossRef] [PubMed]
  14. Koeber, S.; Palmer, R.; Lauermann, M.; Heni, W.; Elder, D.L.; Korn, D.; Woessner, M.; Alloatti, L.; Koenig, S.; Schindler, P.C.; et al. Femtojoule electro-optic modulation using a silicon–organic hybrid device. Light. Sci. Appl. 2015, 4, e255. [Google Scholar] [CrossRef]
  15. Nozaki, K.; Shakoor, A.; Matsuo, S.; Fuji, T.; Takeda, K.; Shinya, A.; Kuramochi, A.; Notomi, M. Ultralow-energy electro-absorption modulator consisting of InGaAsP-embedded photonic-crystal waveguide. APL Photonics 2017, 2, 056105. [Google Scholar] [CrossRef]
  16. Baeuerle, B.; Hoessbacher, C.; Heni, W.; Fedoryshyn, Y.; Josten, A.; Haffner, C.; Watanabe, T.; Elder, D.L.; Dalton, L.R.; Leuthold, J. Driver-less Sub-1 Vpp-operation of a Plasmonic-organic hybrid modulator at 100 GBd NRZ. In Proceedings of the 2018 Optical Fiber Communications Conference and Exposition (OFC), San Diego, CA, USA, 11–15 March 2018. [Google Scholar]
  17. Sowailem, M.Y.S.; Hoang, T.M.; Morsy-Osman, M.; Chagnon, M.; Patel, D.; Paquet, S.; Paquet, C.; Woods, I.; Liboiron-Ladouceur, O.; Plant, D.V. 400-G single carrier 500-km transmission with an InP dual polarization IQ modulator. IEEE Photonics Technol. Lett. 2016, 28, 1213–1216. [Google Scholar] [CrossRef]
  18. Bülow, H.; Buchali, F.; Klekamp, A. Electronic dispersion compensation. J. Lightw. Technol. 2008, 26, 158–167. [Google Scholar] [CrossRef]
  19. Sowailem, M.Y.S.; Hoang, T.M.; Morsy-Osman, M.; Chagnon, M.; Qiu, M.; Paquet, S.; Paquet, C.; Woods, I.; Liboiron-Ladouceur, O.; Plant, D.V. Impact of chromatic dispersion compensation in single carrier two-dimensional stokes vector direct detection system. IEEE Photonics J. 2017, 9, 1–10. [Google Scholar] [CrossRef]
  20. Zhou, X.; Huo, J.; Zhong, K.; Khan, F.N.; Gui, T.; Zhang, H.; Tu, J.; Yuan, J.; Long, K.; Yu, C.; et al. Single channel 50 Gbit/s transmission over 40 km SSMF without optical amplification and in-line dispersion compensation using a single-end PD-based PDM-SSB-DMT system. IEEE Photonics J. 2017, 9, 1–11. [Google Scholar] [CrossRef]
  21. Mestdagh, D.J.G.; Spruyt, P.; Biran, B. Analysis of clipping effect in DMT-based ADSL systems. In Proceedings of the 1994 International Conference on Communications, ICC/SUPERCOMM/ICC ’94, Conference Record, Serving Humanity Through Communications, New Orleans, LA, USA, 1–5 May 1994. [Google Scholar]
  22. Tellado, J. Mutlicarrier modulation with low PAR: Applications to DSL and Wireless, 1st ed.; Kluwer Academic Publishers: Dordrecht, The Netherlands, 2002; ISBN 0-7923-7988-8. [Google Scholar]
  23. Armstrong, J. OFDM for Optical Communications. J. Lightw. Technol. 2009, 27, 189–204. [Google Scholar] [CrossRef]
  24. Hwang, T.; Yang, C.Y.; Wu, G.; Li, S.; Li, G.Y. OFDM and its wireless applications: A survey. IEEE Trans. Veh. Technol. 2009, 58, 1673–1694. [Google Scholar] [CrossRef]
  25. Lim, D.W.; Heo, S.J.; No, J.S. An Overview of peak-to-average power ratio reduction schemes for OFDM signals. J. Commun. Netw. 2009, 11, 229–239. [Google Scholar] [CrossRef]
  26. Shieh, W.; Djordjevic, I. OFDM for Optical Communications; Academic Press: Burlington, MA, USA, 2009. [Google Scholar]
  27. Randel, S.; Breyer, F.; Lee, S.C.J.; Walewski, J.W. Advanced modulation schemes for short-range optical communications. IEEE J. Sel. Top. Quantum Electron. 2010, 16, 1280–1289. [Google Scholar] [CrossRef]
  28. Fludger, C.R.S.; Duthel, T.; Hermann, P.; Kupfer, T. Low cost transmitter self-calibration of time delay and frequency response for high baud-rate QAM transceivers. In Proceedings of the Optical Fiber Communication Conference 2017, Los Angeles, CA, USA, 19–23 March 2017. [Google Scholar]
  29. Fludger, C.R.; Vercelli, E.S.; Marenco, G.; Torre, A.D.; Duthel, T.; Kupfer, T. 1Tb/s real-time 4 × 40 Gbaud DP-16QAM superchannel using CFP2-ACO pluggables over 625 km of standard fibre. In Proceedings of the Optical Fiber Communication Conference 2016, Anaheim, CA, USA, 20–22 March 2016. [Google Scholar]
  30. Juan, Q.; Mao, B.; Gonzalez, N.; Binh, N.; Stojanovic, N. Generation of 28 GBaud and 32 GBaud PDM-Nyquist-QPSK by a DAC with 11.3 GHz analog bandwidth. In Proceedings of the Optical Fiber Communication Conference 2013, Anaheim, CA, USA, 17–21 March 2013. [Google Scholar]
  31. Buchali, F.; Klekamp, A.; Schmalen, L.; Drenski, T. Implementation of 64QAM at 42.66 GBaud using 1.5 samples per symbol DAC and demonstration of up to 300 km fiber transmission. In Proceedings of the Optical Fiber Communication Conference 2014, San Francisco, CA, USA, 9–13 March 2014. [Google Scholar]
  32. Rafique, D.; Napoli, A.; Calabro, S.; Spinnler, B. Digital preemphasis in optical communication systems: On the dac requirements for terabit transmission applications. J. Light. Technol. 2014, 32, 3247–3256. [Google Scholar] [CrossRef]
  33. Chagnon, M.; Morsy-Osman, M.; Poulin, M.; Paquet, C.; Lessard, S.; Plant, D.V. Experimental parametric study of a silicon photonic modulator enabled 112-gb/s pam transmission system with a dac and adc. J. Light. Technol. 2015, 33, 1380–1387. [Google Scholar] [CrossRef]
  34. Napoli, A.; Mezghanni, M.M.; Rahman, T.; Rafique, D.; Palmer, R.; Spinnler, B.; Calabrò, S.; Castro, C.; Kuschnerov, M.; Bohn, M. Digital compensation of bandwidth limitations for high-speed DACs and ADCs. J. Lightw. Technol. 2016, 34, 3053–3064. [Google Scholar] [CrossRef]
  35. Khanna, G.; Spinnler, B.; Calabro, S.; De Man, E.; Hanik, N. A robust adaptive pre-distortion method for optical communication transmitters. IEEE Photonics Technol. Lett. 2016, 28, 752–755. [Google Scholar] [CrossRef]
  36. Khanna, G.; Rahman, T.; Man, E.D.; Riccardi, E.; Pagano, A.; Piat, A.C.; Calabro, S.; Spinnler, B.; Rafique, D.; Feiste, U.; et al. Single-carrier 400 g 64qam and 128qam dwdm field trial transmission over metro legacy links. IEEE Photonics Technol. Lett. 2017, 29, 189–192. [Google Scholar] [CrossRef]
  37. Khanna, G.; Spinnler, B.; Calabro, S.; de Man, E.; Chen, Y.; Hanik, N. Adaptive transmitter pre-distortion using feedback from the far-end receiver. IEEE Photonics Technol. Let. 2018, 30, 223–226. [Google Scholar] [CrossRef]
  38. Changsoo, E.; Powers, E.J. A new volterra predistorter based on the indirect learning architecture. IEEE Trans. Signal Process. 1997, 45, 223–227. [Google Scholar] [CrossRef]
  39. Guiomar, F.P.; Pinto, A.N. Simplified volterra series nonlinear equalizer for polarization-multiplexed coherent optical systems. J. Lightw. Technol. 2013, 31, 3879–3891. [Google Scholar] [CrossRef]
  40. Berenguer, P.W.; Nolle, M.; Molle, L.; Raman, T.; Napoli, A.; Schubert, C.; Fischer, J.K. Nonlinear digital pre-distortion of transmitter components. J. Lightw. Technol. 2016, 34, 1739–1745. [Google Scholar] [CrossRef]
  41. Jia, Z.; Chien, H.-C.; Cai, Y.; Yu, J.; Zhu, B.; Ge, C.; Wang, T.; Shi, S.; Wang, H.; Xia, Y.; et al. Experimental demonstration of PDM-32QAM single-carrier 400G over 1200-km transmission enabled by training-assisted pre-equalization and look-up table. In Proceedings of the 2016 Optical Fiber Communication Conference (OFC), Anaheim, CA, USA, 20–24 March 2016. [Google Scholar]
  42. Junwen, Z.; Yu, J.; Chien, H.-C. Advanced Algorithm for high-baud rate signal generation and detection. In Proceedings of the Optical Fiber Communication Conference 2017, Los Angeles, CA, USA, 19–23 March 2017. [Google Scholar]
  43. Napoli, A.; Mezghanni, M.M.; Calabrò, S.; Palmer, R.; Saathoff, G.; Spinnler, B. Digital predistortion techniques for finite extinction ratio IQ mach–zehnder modulators. J. Lightw. Technol. 2017, 35, 4289–4296. [Google Scholar] [CrossRef]
  44. Yamazaki, H.; Takahashi, H.; Goh, T.; Hashizume, Y.; Yamada, T.; Mino, S.; Kawakami, H.; Miyamoto, Y. Optical modulator with a near-linear field response. J. Lightw. Technol. 2016, 34, 3796–3802. [Google Scholar] [CrossRef]
  45. Josten, A.; Baeuerle, B.; Heni, W.; Leuthold, J. Digital post-distortion for cost-efficient driverless optical transmitters. In Proceedings of the Signal Processing in Photonic Communications 2018, Zurich, Switzerland, 2–5 July 2018. [Google Scholar]
  46. Gnauck, A.H.; Raybon, G.; Chandrasekhar, S.; Leuthold, J.; Doerr, C.; Stulz, L.; Agarwal, A.; Banerjee, S.; Grosz, D.; Hunsche, S.; et al. 2.5 Tb/s (64 × 42.7 Gb/s) Transmission over 40 × 100 km NZDSF using RZ-DPSK formatand all-raman-amplified spans. In Proceedings of the Optical Fiber Communications Conference, Anaheim, CA, USA, 17 March 2002. [Google Scholar]
  47. Winzer, P.J.; Dorrer, C.; Essiambre, R.-J.; Kang, I. Chirped return-to-zero modulation by imbalanced pulse carver driving signals. IEEE Photonics Technol. Lett. 2004, 16, 1379–1381. [Google Scholar] [CrossRef]
  48. Gnauck, A.H.; Winzer, P.J. Optical Phase-Shift-Keyed Transmission. J. Lightw. Technol. 2005, 23, 115. [Google Scholar]
  49. Kang, I.; Mollenauer, L.F. Method and Apparatus for Synchronizing a Pulse Carver and a Data Modulator for Optical Telecommunication. U.S. Patent 7,209,669 B2, 24 April 2007. [Google Scholar]
  50. Behrens, C.; Makovejs, S.; Killey, R.I.; Savory, S.J.; Chen, M.; Bayvel, P. Pulse-shaping versus digital backpropagation in 224gbit/s pdm-16qam transmission. Opt. Express 2011, 19, 12879. [Google Scholar] [CrossRef] [PubMed]
  51. Hirooka, T.; Ruan, P.; Guan, P.; Nakazawa, M. Highly dispersion-tolerant 160 Gbaud optical nyquist pulse tdm transmission over 525 km. Opt. Express 2012, 20, 15001. [Google Scholar] [CrossRef] [PubMed]
  52. Soto, M.A.; Alem, M.; Amin Shoaie, M.; Vedadi, A.; Brès, C.-S.; Thévenaz, L.; Schneider, T. Optical sinc-shaped Nyquist pulses of exceptional quality. Nat. Commun. 2013, 4, 2898. [Google Scholar] [CrossRef] [PubMed]
  53. Proakis, J.G.; Salehi, M. Digital Communications, 5th ed.; McGraw-Hill: New York, NY, USA, 2008. [Google Scholar]
  54. Chatelain, B.; Gagnon, F. Peak-to-average power ratio and intersymbol interference reduction by Nyquist pulse optimization. In Proceedings of the IEEE 60th Vehicular Technology Conference, 2004, VTC2004-Fall, Los Angeles, CA, USA, 26–29 September 2004; pp. 954–958. [Google Scholar]
  55. Jansen, S.L.; Morita, I.; Schenk, T.C.W.; Takeda, N.; Tanada, H. Coherent Optical 25.8-Gb/s OFDM transmission over 4160-km SSMF. J. Lightw. Technol. 2008, 26, 6–15. [Google Scholar] [CrossRef]
  56. Buchali, F.; Idler, W.; Rastegardoost, N.; Drenski, T.; Ward, R.; Zhao, L. Preemphased prime frequency multicarrier bases ENOB assessment and its application for optimizing a dual-carrier 1-Tb/s QAM transmitter. In Proceedings of the 2016 Optical Fiber Communications Conference and Exhibition (OFC), Anaheim, CA, USA, 20–24 March 2016. [Google Scholar]
  57. Nikookar, H.; Lidsheim, K.S. Random phase updating algorithm for ofdm transmission with low papr. IEEE Trans. Broadcast. 2002, 48, 123–128. [Google Scholar] [CrossRef]
  58. Schuh, K.; Buchali, F.; Idler, W.; Hu, Q.; Templ, W.; Bielik, A.; Altenhain, L.; Langenhagen, H.; Rupeter, J.; Duemler, U.; et al. 100 GSa/s BiCMOS DAC supporting 400 Gb/s dual channel transmission. In Proceedings of the ECOC 2016; 42nd European Conference on Optical Communication, Dusseldorf, Germany, 18–22 September 2016. [Google Scholar]
  59. Josten, A.; Baeuerle, B.; Dornbierer, E.; Boesser, J.; Hillerkuss, D.; Leuthold, J. Modified godard timing recovery for non integer oversampling receivers. Appl. Sci. 2017, 7, 655. [Google Scholar] [CrossRef]
Figure 1. Investigation of transmitter electrical amplitude and its dependence on pulse shape. (a) Normalized amplitude against roll-off factor (ROF) for raised-cosine (RC; blue) and square-root-raised-cosine (SRRC; red) signals. Simulations for maximum amplitude at eye-opening (solid lines), maximum amplitude between eye-openings (dashed line), and electrical measurements of the root-mean-square (RMS) amplitude (square markers). (b) Simulated eye-diagrams of RC and SRRC signal with roll-off factors of 0.1, 0.4, and 0.9. The color indicates the probability of occurrence; a logarithmic color mapping was used to enhance the visibility of small details; all plots are normalized to the same maximum amplitude d_DAC (digital-to-analog converter).
Applsci 08 01652 g001
Figure 2. Investigation of clipping on signals with SRRC pulse shape. The simulations were done with two samples per symbol, one million symbols, 30 roll-off factors, and eight clipping values (0, 0.05, 0.10, 0.14, 0.19, 0.24, 0.29, and 0.33). The black crosses indicate examples at ROFs of 0.2 and 0.4, which are discussed in the text in more detail. (a) RMS amplitude of clipped and normalized (to maximum) waveforms against roll-off factor. Clipping was done between 0% up to 33%, which corresponds to a saturation of the amplitude at 100% down to 67%. (b) Resulting signal-to-noise ratio (SNR) penalty of clipped SRRC waveforms. The SNR was evaluated after matched filtered detection.
Applsci 08 01652 g002
Figure 3. Characterization of frequency and phase response. (a) Amplitude spectrum of transmitted and received coarse non-integer spaced comb with a reduced set of 34 spectral lines. (b) Frequency and phase response measured with a comb of 331 spectral lines.
Applsci 08 01652 g003
Figure 4. Electrical characterization of the influence of digital pre-distortion (DPreD) on the RMS amplitude of an SRRC signal generated with 100 GSa/s (a) without DPreD and (b) with DPreD. Both plots were linearly normalized to the same maximum value. The colors indicate the symbol rate (6.25, 12.5, 28, 37.5, 50, 56, 71, 80, 90, and 95 GBd). The signal bandwidth results from the symbol rate and the roll-off factor. woDPreD: without digital pre-distortion; wDPreD: with digital pre-distortion.
Applsci 08 01652 g004
Figure 5. Overview of digital signal processing (DSP) and experimental set-up. The optical path is indicated by the blue color. Tx: transmitter; MZM: Mach–Zehnder modulator; Rx: receiver; BERT: bit error ratio testing.
Applsci 08 01652 g005
Figure 6. Influence of DPreD and digital post-distortion (DPostD) on the performance of an optical coherent 16QAM signal. Forward error correction (FEC) limits for KP4-FEC (BER: 2 × 10 4 , hard-decision FEC (HD-FEC) (BER: 3.8 × 10 3 ), and soft-decision FEC (SD-FEC) (BER: 2 × 10 2 ) are given. (a) BER over DAC driving voltage of a 28-GBd signal measured in the low- and high-SNR regime. (b) SNR over DAC driving voltage for the measurements in (a). (c) BER over roll-off factor of a 56-GBd signal. The solid line is a linear interpolation of the measurement values below and above a roll-off factor of 0.4. BER: bit error ratio; DAC: digital-to-analog converter.
Applsci 08 01652 g006
Figure 7. SNR improvement due to DPostD. Dependence of effective SNR on the symbol rate and ROF with DPreD (a) and with DPostD (b). (c) Comparison of effective SNR with an ROF of 0.04 with DPreD in blue and DPostD in red. The measured symbol rates are 14, 28, 56, 71, 80, and 96 GBd; QPSK was used as the modulation format.
Applsci 08 01652 g007

