Article

Effects of Crack and Climate Change on Service Life of Concrete Subjected to Carbonation

Department of Architectural Engineering, Kangwon National University, Chuncheon-si 24341, Korea
Appl. Sci. 2018, 8(4), 572; https://doi.org/10.3390/app8040572
Submission received: 30 January 2018 / Revised: 3 April 2018 / Accepted: 3 April 2018 / Published: 6 April 2018

Abstract

:
Carbonation is among the primary reasons for the initiation of the corrosion of steel rebar in reinforced concrete (RC) structures. Due to structural loading effects and environmental actions, inevitable cracks have frequently occurred in concrete structures since the early ages. Additionally, climate change, which entails increases in CO2 concentration and environmental temperature, will also accelerate the carbonation of concrete. This article presents an analytical way of predicting the service life of cracked concrete structures considering influences of carbonation and climate change. First, using a hydration model, the quantity of carbonatable materials and concrete porosity were calculated. Carbonation depth was evaluated considering properties of concrete materials and environmental conditions. Second, the influence of cracks on CO2 diffusivity was examined. Carbonation depth for cracked concrete was evaluated using equivalent CO2 diffusivity. The effects of climate change, for example, growing CO2 concentration and environmental temperature, were considered using different schemes of carbonation models. Third, different climate change scenarios (such as Representative Concentration Pathways (RCP) 2.6, RCP 4.5, RCP 8.5 and upper 90% confidence interval of RCP 8.5) and time slices (such as 2000 and 2050) were used for case studies. By utilizing the Monte Carlo method, the influences of various climate change scenarios on the service life loss of concrete structures were highlighted.

1. Introduction

Carbonation is among the primary reasons for the initiation of corrosion of steel rebar in reinforced concrete structures. Due to carbonation, the pH value of the pore solution of concrete decreases to values around 9, the protective oxide layer of steel rebar is destroyed, therefore, the corrosion of steel rebar initiates. Additionally, given load effects and environmental actions, inevitable cracks have frequently occurred for concrete structures since the early ages. Cracks can aggravate the ingression of CO2 and considerably lessen the service existence of concrete structures. Carbonation of concrete is happening faster due to global warming, leading to increases in CO2 concentration and environmental temperature. Hence, for the carbonation durability style of reinforced concrete (RC) structures, the influence of cracking and global warming should be taken into consideration [1].
Abundant studies have been carried out on the carbonation behavior of concrete. Papadakis [2] proposed a carbonation model that considered the influences of concrete mixing proportions and environmental conditions on CO2 diffusivity and concrete carbonation resistance. Ann et al. [3] evaluated the service life of concrete using the safety factor method and Monte Carlo simulation. They found that the analysis results from the two methods were similar. Marques and Costa [4] analyzed the service life of concrete structures considering both the corrosion initiation period and corrosion propagation period. Performance-based methodology was used to achieve the target service life of concrete structures. However, the studies of Papadakis [2], Ann et al. [3] and Marques and Costa [4] focused on sound concrete and the effect of cracking on carbonation was not considered.
Regarding the carbonation of cracked concrete, Song et al. [5] proposed an analytical technique for predicting the carbonation depth of cracked concrete. Diffusion of CO2 in sound concrete and cracked concrete was simulated. Tao et al. [6] evaluated the carbonation process of cracked concrete by using the two-dimensional finite element method. The influences of crack width and depth on carbonation were analyzed. However, the studies of Song et al. [5] and Tao et al. [6] did not consider the uncertainties involved in predicting carbonation depth. Kwon and Na [7] proposed a probabilistic approach for the carbonation durability design of cracked concrete to consider the uncertainties of carbonation prediction. Nevertheless, it should be noticed that Kwon and Na [7]’s study did not consider the effect of curing periods on the carbonation of concrete. With increasing curing periods, the carbonation resistance of concrete is improved [8,9]. Moreover, the effect of climate change on carbonation was not considered by Song et al. [5], Tao et al. [6] and Kwon and Na [7].
Regarding the effects of climate change on the carbonation of concrete, Yoon et al. [10] proposed a mathematical model to consider the effect of CO2 concentration increase on the carbonation of concrete; however, the effect of the increase in environmental temperature on carbonation was not considered in their study. Stewart et al. [11] proposed a model that considered climate change impact on the corrosion of concrete where the effects of increases in CO2 concentration and environmental temperature on the corrosion initiation stage, crack initiation stage and crack propagation stage were highlighted. Furthermore, Stewart et al. [12] proposed engineering strategies for the corrosion control of concrete considering climate change. However, the studies conducted by Yoon et al. [10] and Stewart et al. [11,12] did not consider the effect of pre-corrosion cracks on the service life of concrete.
To summarize, the current models only consider a single effect such as the either crack effect or climate change effect on the service life of concrete. To provide a rational evaluation of the service life of concrete, an integrated model considering both the crack and climate change effects are necessary. To overcome the shortcomings of the current studies, this article presents a probabilistic approach for predicting the service life of cracked concrete structures under carbonation and climate change conditions. The effects of concrete mixing proportions, curing periods, cracks and environmental conditions on carbonation depth and service life were systematically analyzed.

2. Probabilistic Approach for Cracked Concrete under Carbonation

2.1. Carbonation Model of Sound Concrete

Carbonation relates to both the material properties and environmental conditions of concrete. The quantity of carbonatable materials in concrete, for example, calcium hydroxide (CH) and calcium silica hydrate (CSH), relies on the cement content in the concrete mixing proportions and reaction amount of cement. In line with the hydration model within our previous studies [1,9], the CH contents can be established by the following:
C H ( t ) = R C H C E C 0 α
where R C H C E is the mass of CH from the hydration of 1-unit mass cement; C 0 is cement content; and α is the degree of cement hydration. R C H C E can be determined by using the mineral compositions of cement [9] and α can be determined using the integral method in the time domain as α = 0 t d α d t d t and the detailed equation for d α d t can be found in [9]. The kinetic cement hydration model d α d t can be used to calculate the age-dependent properties of concrete such as the carbonatable substance contents and porosity. The calculation results of the kinetic cement hydration model can be used for the carbonation model. The input parameters of the kinetic cement hydration model include the binder compound compositions and Blaine surfaces, the concrete mixing proportions and curing conditions. The output parameters of this kinetic cement hydration model are time dependent properties such as the reaction degree of the binder, strength and heat evolution [9].
By using the cement content and reaction degree of cement, CSH contents can be calculated as follows [9]:
C S H ( t ) = 2.85 f S , C C 0 α
where f S , C is the silica weight fraction in cement. The coefficient 2.85 denotes the mass ratio between the CSH molar weight and SiO2 weight in CSH [9].
The hydration products from the cement hydration deposits in the capillary pore spaces of concrete and the porosity of concrete will be reduced due to cement hydration. The porosity of concrete, ɛ, can be determined as follows [2,9]:
ε ( t ) = W ρ W 0.25 C 0 α Δ ε C
where W is the water content in concrete; ρ W is the density of water; and Δ ε C is the porosity reduction due to the carbonation of concrete [2,9].
Papadakis [2] proposed that when relative humidity in the environment is higher than 0.55, the carbonation of concrete is controlled by the diffusion of CO2. The carbonation depth of concrete can be determined as follows:
x c = 2 D [ C O 2 ] 0 t [ CH ] + 3 [ CSH ]
D = A ( ε C 0 ρ c + W 0 ρ w ) a ( 1 R H 100 ) 2.2
where x c is the carbonation depth of concrete; D is the CO2 diffusivity; [ C O 2 ] 0 is the CO2 molar concentration at the concrete surface; [ CH ] is the molar concentration of calcium hydroxide; [ CSH ] is the molar concentration of calcium silicate hydrate; ρ c is the density of cement; A and a are the CO2 diffusivity parameters; and RH is the environmental relative humidity. [ CH ] + 3 [ CSH ] in the denominator of Equation (4) is the content of carbonatable material. The dependence of CO2 diffusivity on temperature can be considered by using Arrhenius’s Law [7].

2.2. Carbonation Model of Cracked Concrete

For concrete structures with cracks, CO2 can ingress into concrete through both the crack zone and sound zone. The total flux of CO2 equals the sum of CO2 flux in the sound and crack zones. The total flux of CO2 can be determined as follows:
D c r ω + D ( l ω ) = D e q l
where D c r is the CO2 diffusion in the crack zone ( D c r relates to crack geometry characteristics, concrete materials properties and saturation degree of cracked zone); ω is the crack width; l is the total length of the concrete structural element; and D e q is the equivalent diffusion coefficient of concrete.
Compared to the total length of concrete, the crack width is very small and the value of ( l ω ) is approximately equal to that of l . The equivalent diffusion coefficient of concrete can be determined as follows:
D e q = [ D c r ω + D ( l ω ) ] / l D c r ω / l + D = [ 1 + D c r D ω l ] D
In Equation (7), the value of D c r D is the ratio of CO2 diffusivity in the cracked and sound zones. With the increase of crack width ω or decrease of crack interspace l , the equivalent diffusion coefficient of concrete increases.
Combining Equation (7) with Equation (4), the carbonation depth of cracked concrete can be estimated as follows:
x c = 2 D e q [ C O 2 ] 0 t [ CH ] + 3 [ CSH ] = 2 [ C O 2 ] 0 t [ CH ] + 3 [ CSH ] [ 1 + D c r D ω l ] D
Climate change, such as the increases in CO2 concentration and environmental temperature, will accelerate carbonation of concrete. Equation (8) does not consider the time dependent CO2 concentration and environmental temperature. By using the difference method, Equation (8) can be re-written as follows:
d x c = C R 1 2 t d t
C R = 2 [ C O 2 ( t ) ] 0 D e q ( t ) [ CH ] + 3 [ CSH ]
where d x c is the increase of carbonation depth in time increment d t ; and C R is the carbonation rate parameter.
With the increase in environmental temperature, CO2 diffusivity increases. Song et al. [5] proposed that the dependence of CO2 diffusivity on temperature can be described using Arrhenius’s Law as follows:
D ( T ) = D r e f exp [ β ( 1 T r e f 1 T ) ]
where D r e f is the CO2 diffusivity at the reference temperature; β is the activity energy of CO2 ( β = 4300); and T r e f (298 K) is the reference temperature.

2.3. Probabilistic Approach for Service Life

Uncertainties of carbonation include physical uncertainty, record uncertainty, model uncertainty and decision uncertainty [7]. Physical uncertainty refers to the natural random nature of the fundamental variables including concrete cover depth, CO2 concentration, concrete quality and native condition. Record uncertainty originates from assumptions for the probability density function. Model uncertainty means the governing mechanism for carbonation including the simplified equation of carbonation, the assumption of the qualities of materials and the assumption of non-correlated variables. Decision uncertainty is the phrase durability failure qualifying criterion, like the period that the carbonation depth exceeds the concrete cover depth.
Within this study, the durability failure qualifying criterion was understood to be carbonation depth exceeding the coverage depth. This durability failure probability can be calculated by utilizing the Monte Carlo method by following [3,7]:
g ( t ) = C V x C
p f = n ( g ( t ) < 0 ) N
where C V is the cover depth of concrete; g ( t ) is the durability failure criteria; and p f is the probability of carbonation durability failure. n ( g ( t ) < 0 ) denotes the number of carbonation durability failures out of a total N trials. For the carbonation durability design of concrete, the time of failure probability of 10% was regarded as the service life of concrete [3,7]. When the failure probability is 10%, the relatability index is 1.3. For other deterioration stages involved in rebar corrosion such as the formation of corrosion cracks and spalling of concrete cover, given that system failure will produce much more serious consequences than corrosion initiation, the failure probability should be lower than 10%.

2.4. Summary of Proposed Model

Figure 1 shows the flowchart of the proposed model. The input parameters of the proposed carbonation model consisted of the concrete mixing proportions and curing conditions, binder compound compositions, concrete specimen crack characteristics and carbonation environmental conditions. Based on the cement hydration-carbonation integrated model, the carbonatable substance contents, porosity and the carbonation depth of concrete can be determined. The effects of climate change on carbonation such as increases in CO2 concentration and environmental temperature, are considered using the difference method. The effect of cracks on carbonation was taken into account using the equivalent diffusion coefficient of CO2. Finally, by using the Monte Carlo simulation method, the probability of corrosion initiation and the service life of concrete can be calculated.

3. Verification of Proposed Model

3.1. Carbonation Depth of Cracked Concrete

Experimental results from Song et al. [5] were used to verify the proposed model. Song et al. [5] conducted an experimental study on the carbonation of concrete with different crack widths and mixing proportions. The concrete mixing proportions are shown in Table 1. Concrete with high water to cement ratio represented low strength concrete. The concrete specimens were cured under water for 28 days at 20 °C. After curing, the specimens were put into a chamber at 65% RH for two weeks. Next, the concrete specimens were put into the CO2 chamber for accelerated carbonation testing (CO2 concentration was 10%, RH = 65%, temperature was about 25 °C). Splitting tests were used to induce 0.05 to 0.25 mm cracks into the concrete specimens.
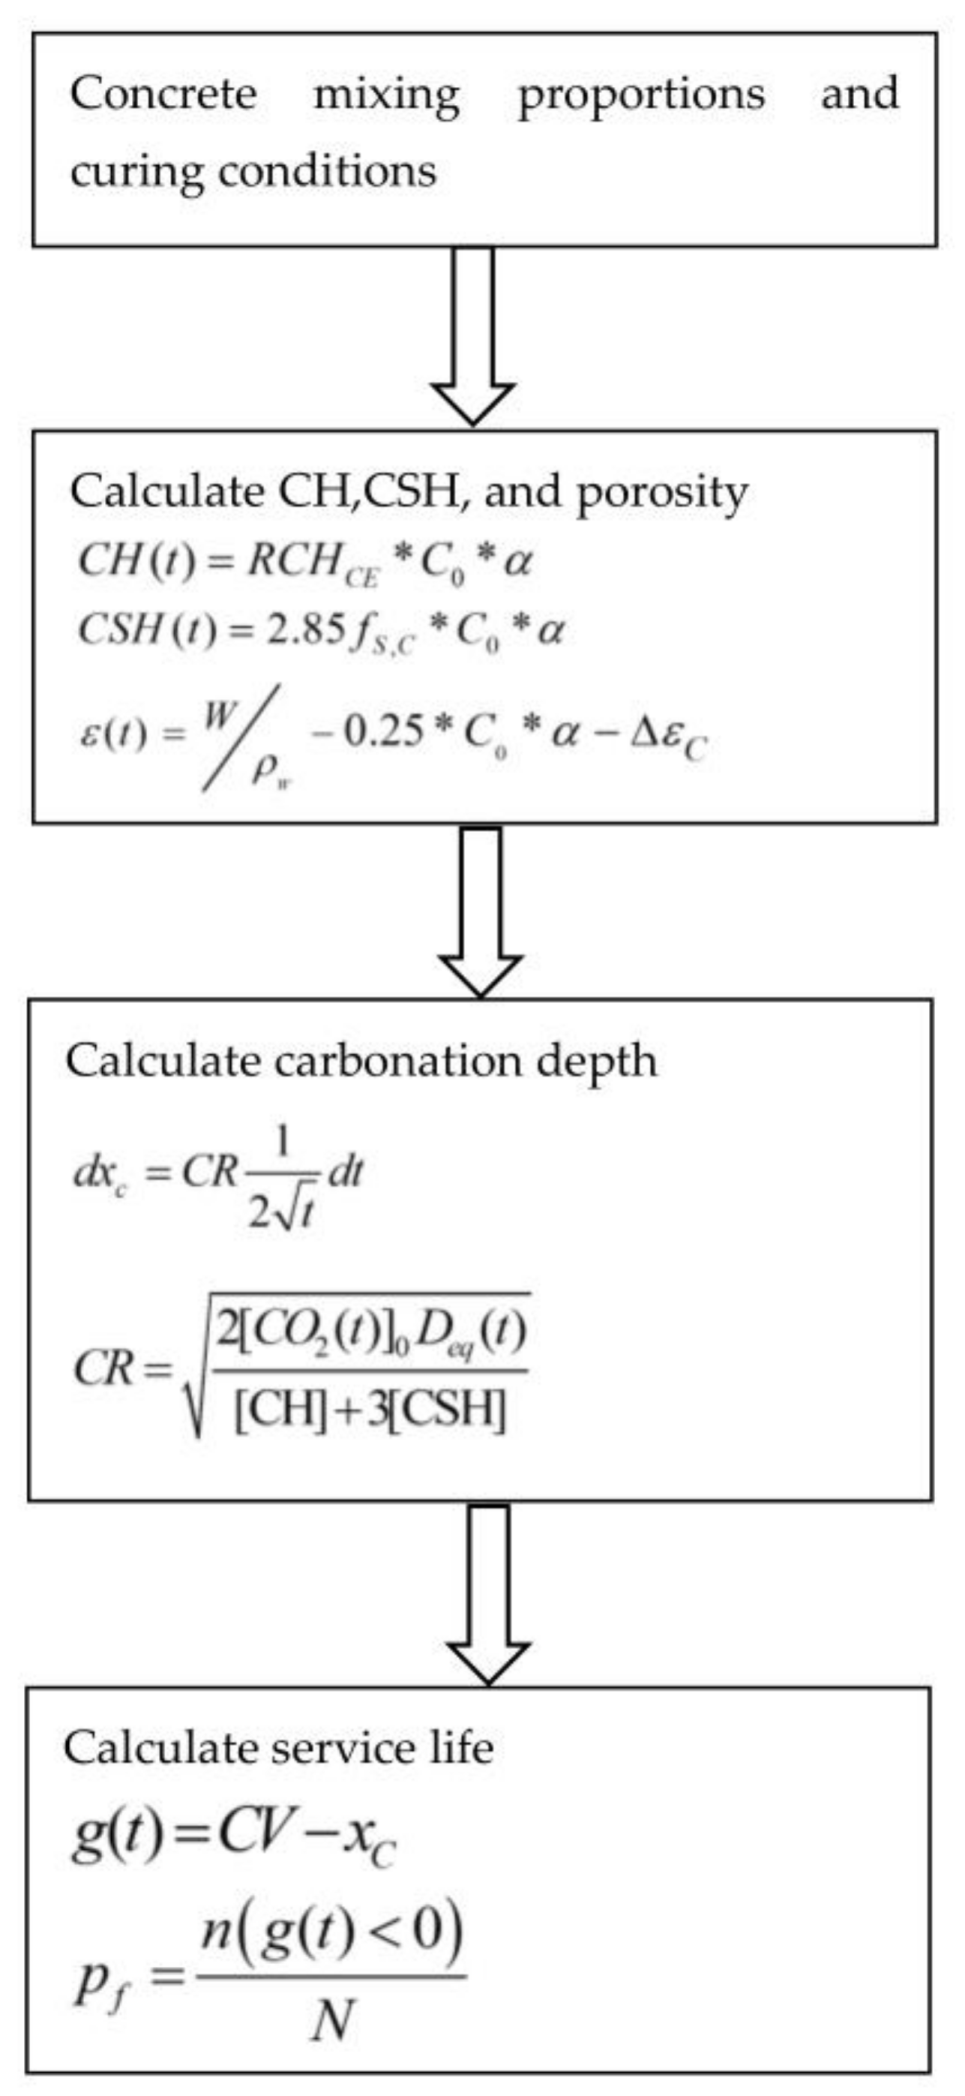
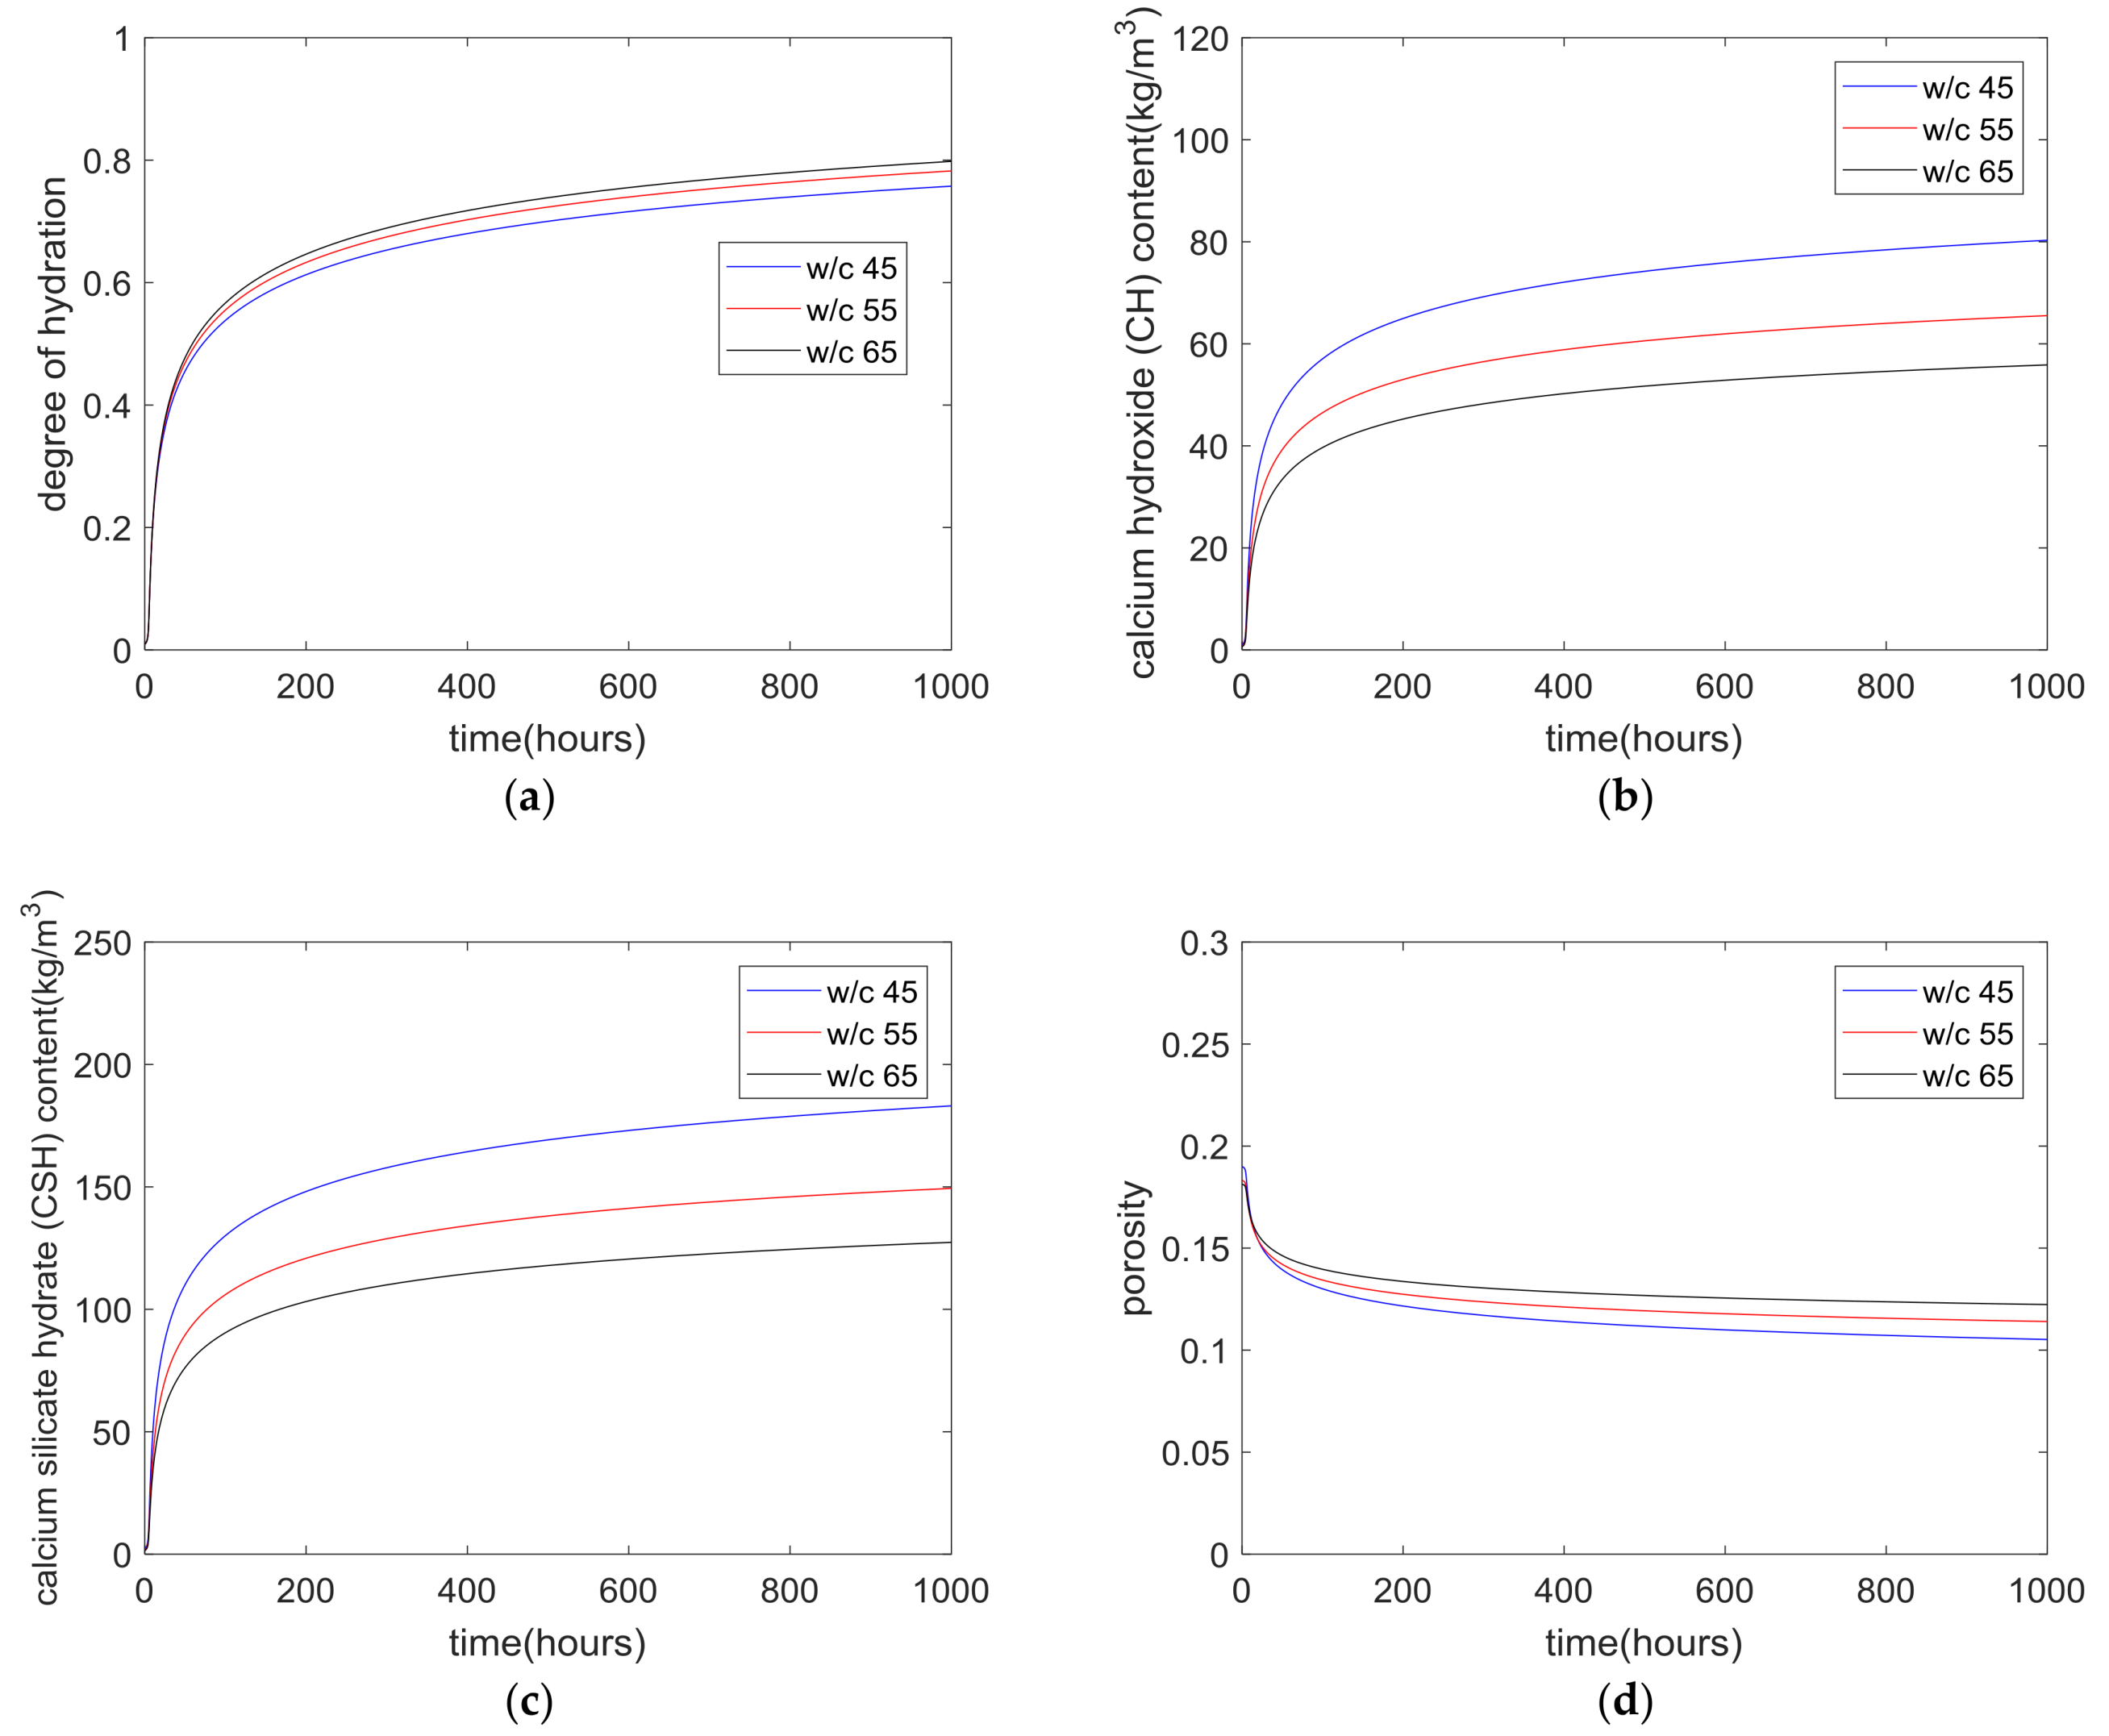
By using the kinetic cement hydration model [9], the degree of cement hydration, CH content, CSH content and porosity of concrete were calculated and are shown in Figure 2. With decreases in the water to cement ratios, the available depositing space of the hydration products and capillary water concentration decreased and consequently, the degree of hydration was reduced (shown in Figure 2a). Concrete with lower water-to-cement ratios had higher CH content (shown in Figure 2b) and CSH content (shown in Figure 2c) and lower porosity (shown in Figure 2d).
Carbonation is significantly influenced by concrete relative humidity. The carbonation of concrete tended to be the highest for environmental relative humidity of 50–70% [9]. When the relative humidity was less than 50%, there was insufficient moisture for the progression of the carbonation reaction. While the relative humidity was higher than 70%, the diffusion of CO2 was hindered due to the increase in the saturation degree of the concrete pores. On the other hand, the rate of cement hydration was also significantly influenced by relative humidity. Cement hydration virtually ceased at about 80% RH for concrete with various water to binder ratios and mixing proportions [9]. In the study by Song et al. [5], after water curing, the concrete was exposed to 65% relative humidity. The relative humidity in the surface skin of concrete approximately equaled that of the environmental relative humidity [2,9]. When the relative humidity in the surface skin concrete was less than 80%, the hydration of cement in the surface skin concrete stopped [9]. Hence, further hydration in the carbonation zone of concrete was marginal and could be ignored.
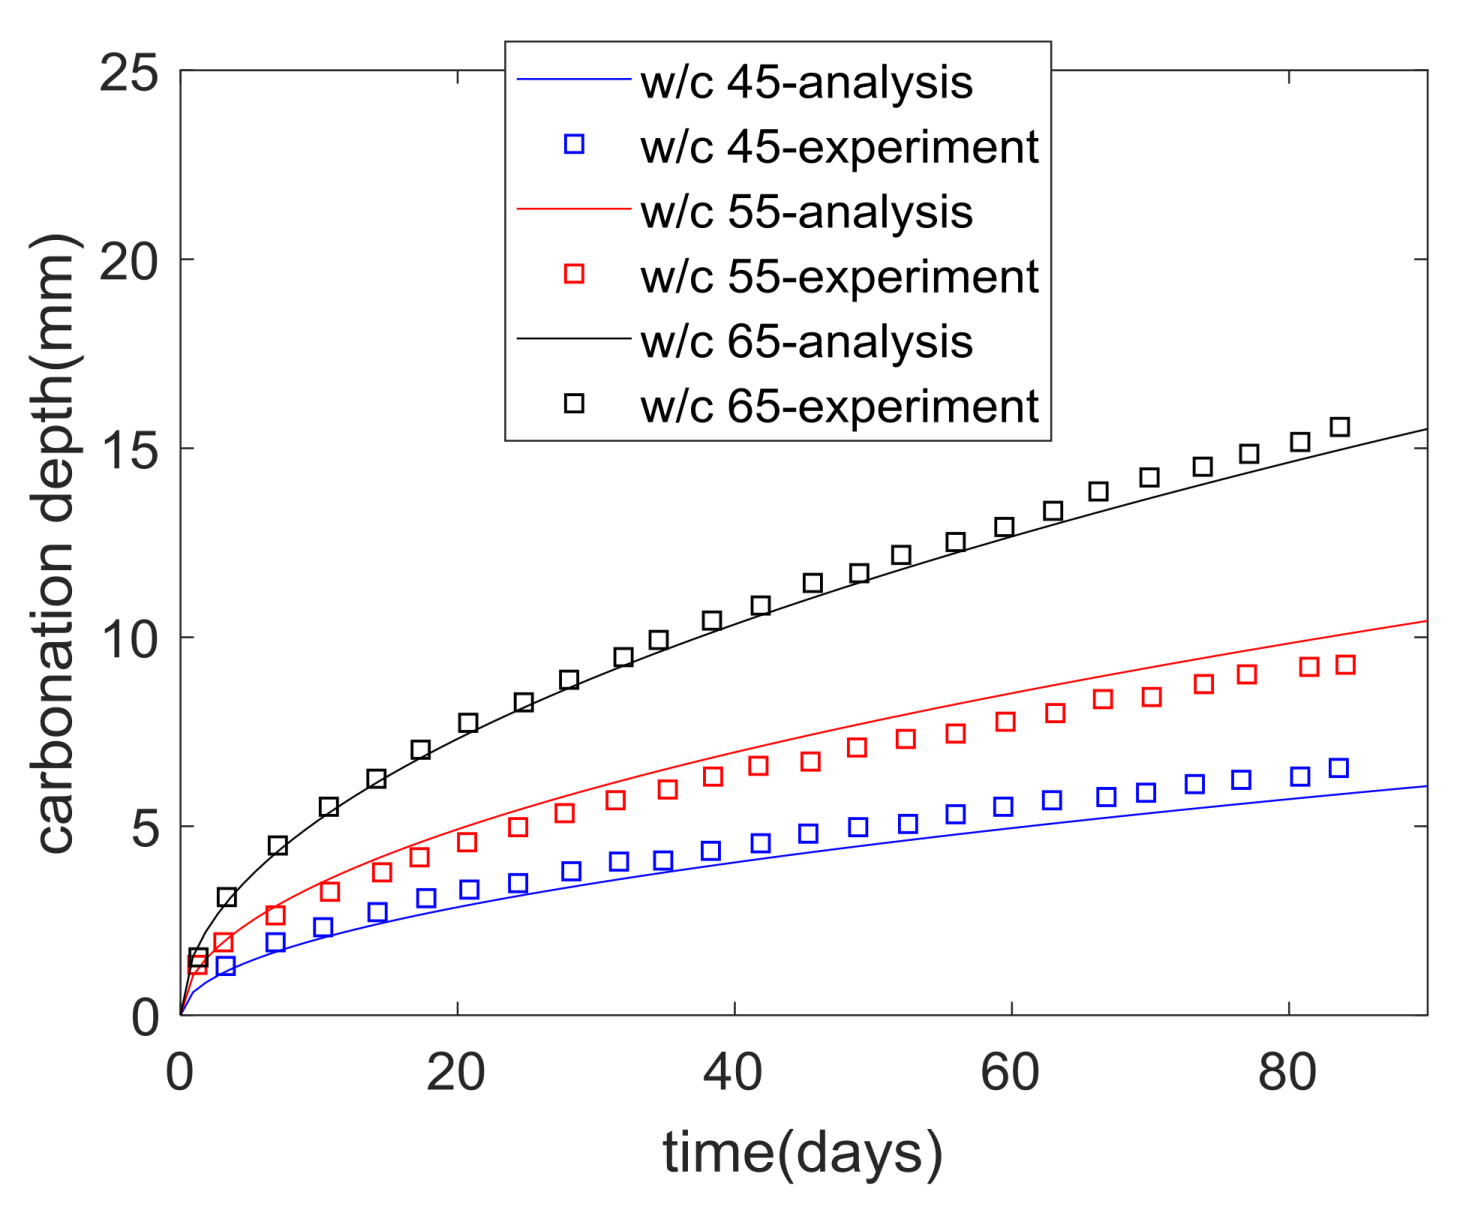
The calculation results from the hydration model can be used as input parameters for evaluating the concrete carbonation depth. By using the experimental results on carbonation depth for sound concrete, the CO2 diffusivity parameters A and a in Equation (5) were set as 2.66×10⁻⁶ and 4.75×10⁻⁶, respectively. These CO2 diffusivity parameters did not change with different water to cement ratios. The calculated results regarding the carbonation depth of sound concrete are shown in Figure 3. Concrete with lower water-to-cement ratios showed lower carbonation depths as concrete with a lower water to cement ratio has higher carbonatable material contents and lower porosity (shown in Figure 2).
According to Song et al. [5], cracks were induced into concrete through splitting tests. A Linear Variable Differential Transformer (LVDT) was used for measuring crack width in a fully unloaded state. It is very difficult to obtain the required crack width, so Song et al. [5] tried to determine the crack width by 0.1 mm-division after the splitting test. In this study, 0.05 mm cracks ranged from 0 to 0.1 mm; 0.15 mm cracks ranged from 0.1 mm to 0.2 mm; and 0.25 mm crack ranged from 0.2 mm to 0.3 mm.
In Equation (7), the value of ω l equals the area ratio between the crack zone and total surface of concrete. The value of D c r D was regressed based on the experimental results of the carbonation depth of cracked concrete. First, for each water to cement ratio such as 0.65, 0.55 and 0.45, based on the comparison of carbonation depths of sound concrete and cracked concrete by using the equivalent CO2 diffusivity (Equation (8)), the value of D c r D was determined. It was found that D c r D was independent on crack width and was only dependent on the water to cement ratio of concrete. Second, linear regression was used to find the relationship between D c r D and the water to cement ratio. We proposed that the relationship between D c r D and the water-to-cement ratio was set as follows:
D c r D 28 = 79223 102299 W C
where D 28 is the CO2 diffusivity after 28 days of curing.
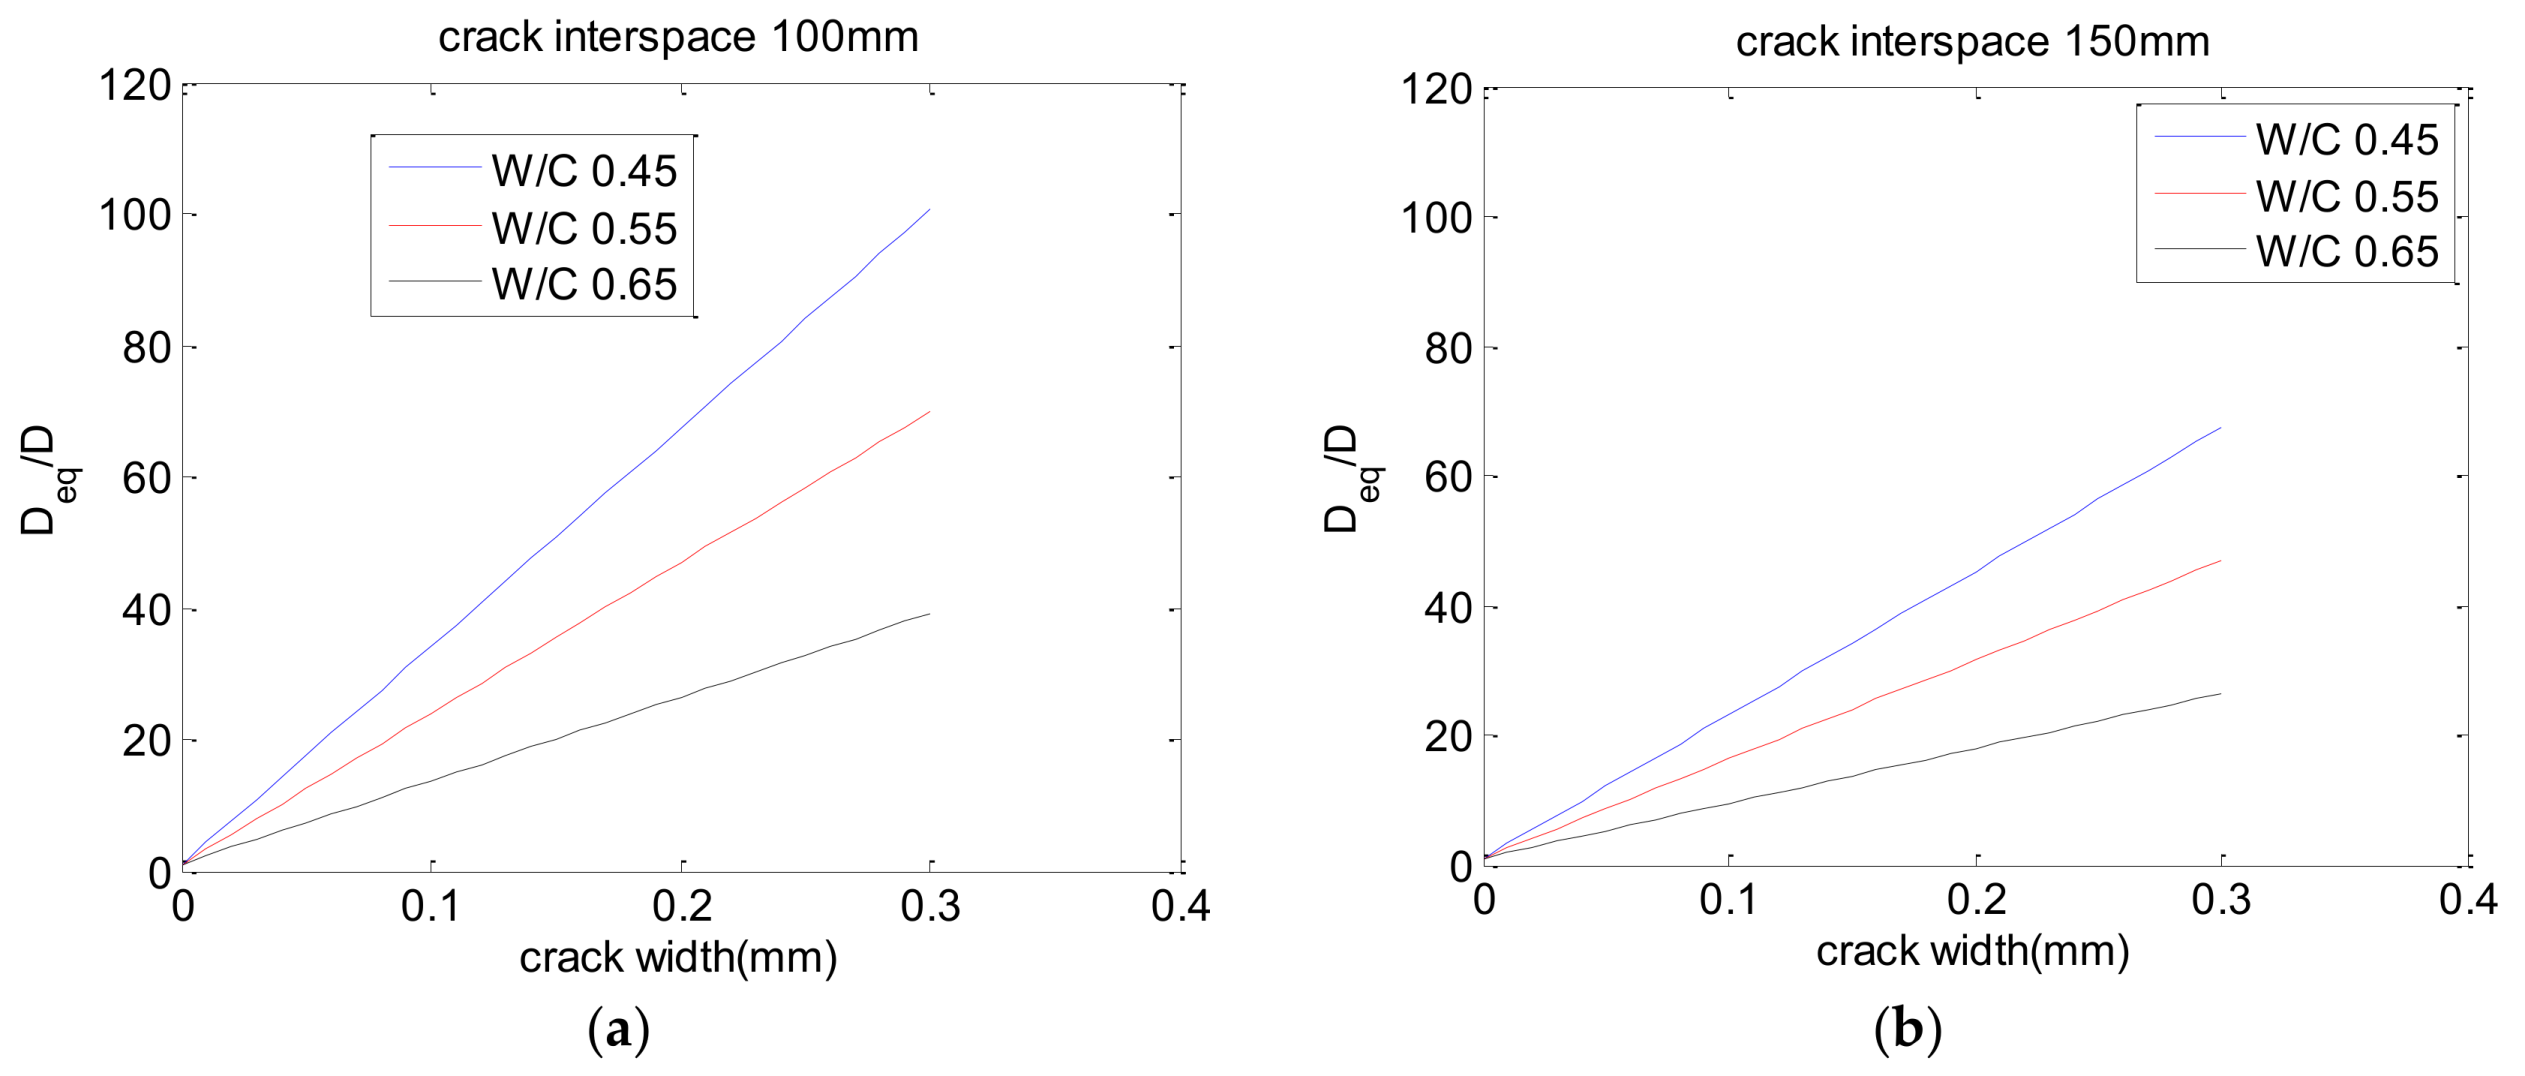
Figure 4 shows the ratio of D e q D versus the crack width for different water-to-cement ratios. One hundred mm and 150 mm were used as the representative values of crack interspace. As shown in this figure, the ratio of D e q D increased with crack width. With the decrease of water-to-cement ratios, the ratio of D e q D increased. Hence, high strength concrete is more vulnerable due to cracking than low strength concrete. With the increase of crack interspaces, the ratio of D e q D decreased.
It should be noted that in Equation (14), the curing period of concrete before the start of the carbonation tests was 28 days. When the concrete curing periods before the carbonation tests changed, the porosity and CO2 diffusivity of concrete will vary correspondingly. By dividing time dependent CO2 diffusivity D ( t ) at the left- and right-hand sides of Equation (14), Equation (14) can be transformed as follows:
D c r D ( t ) = [ 79223 102299 W C ] D 28 D ( t )
After this transformation, the effect of the curing period on CO2 diffusivity was considered. By using Equation (15) and the carbonation reaction (Equation (8)), the carbonation depth of cracked concrete with different curing periods could be calculated. In this study, we used equivalent CO2 diffusivity to calculate the carbonation depth of cracked concrete. As we considered the fundamental mechanisms involved in carbonation such as hydration, carbonation and equivalent CO2 diffusivity, the calculation could be carried out not only within the experimental period but also in the extension period beyond the carbonation experiment. 
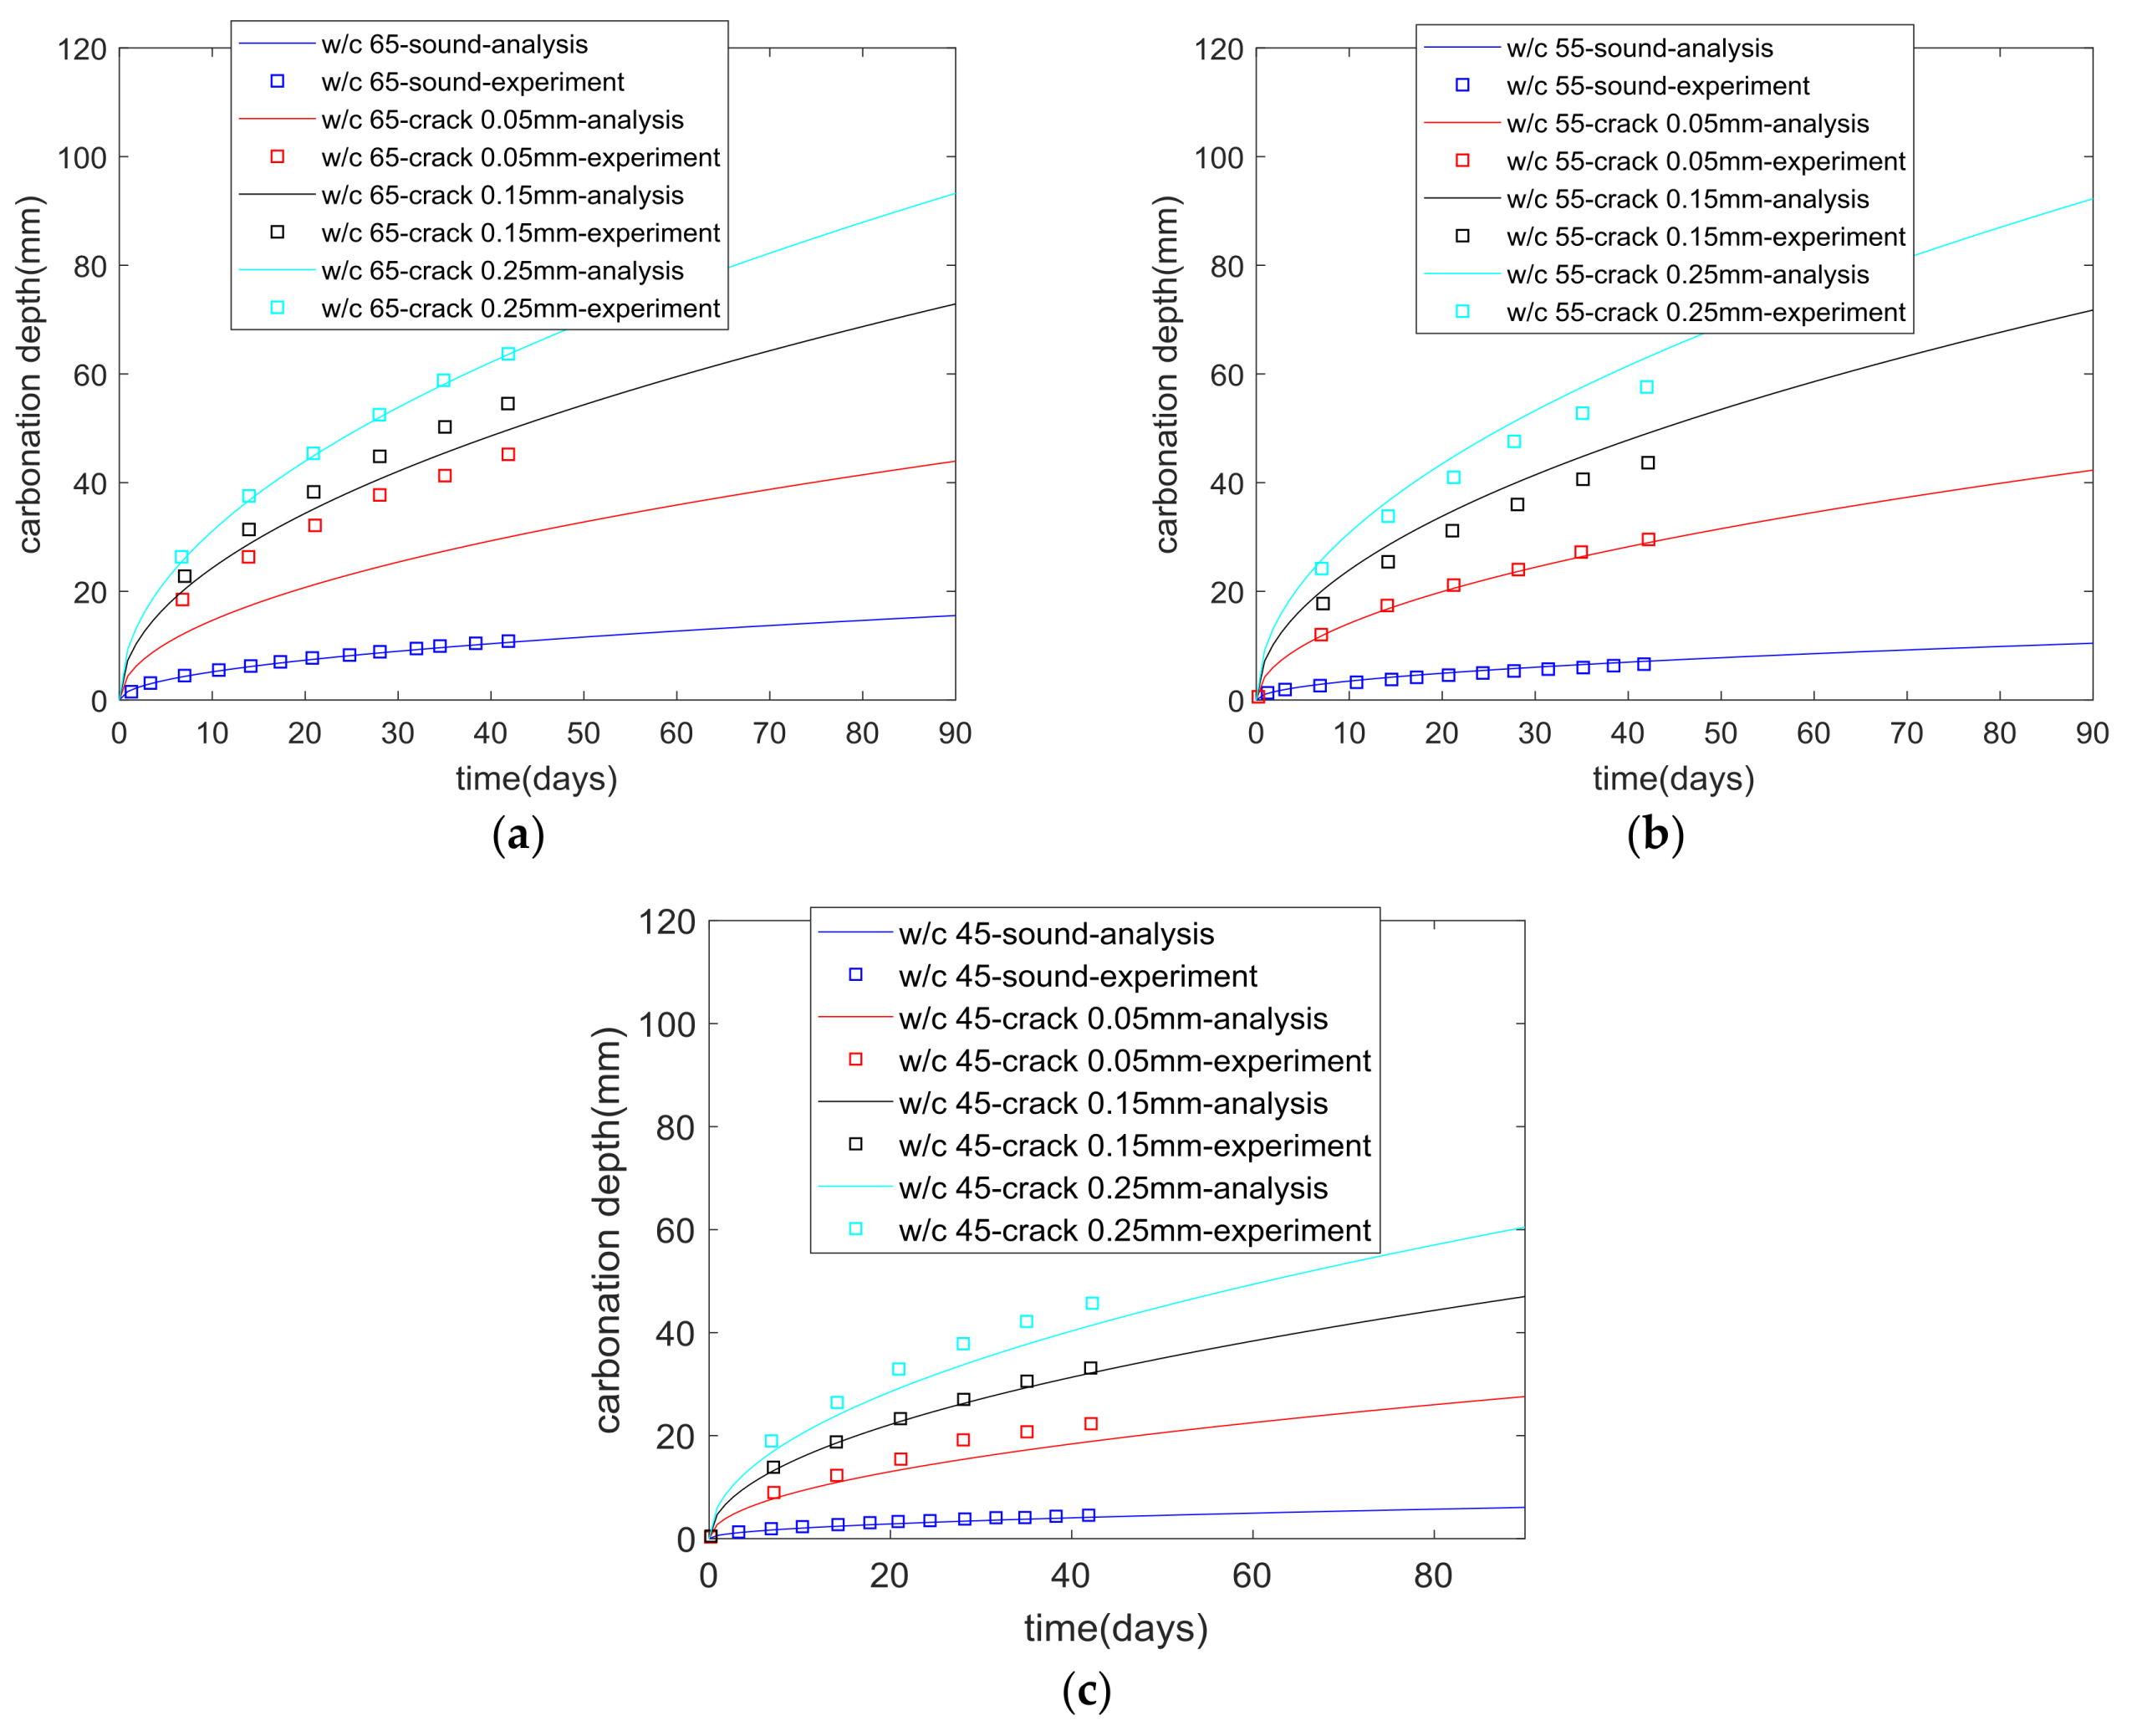
Figure 5 shows that with the increase of water-to-cement ratio and crack width, the carbonation depth of concrete increased. As shown in Figure 5a, for concrete with a water-to-cement ratio of 0.65 and a 0.25 mm crack, after 42 days of accelerated carbonation tests, the carbonation depth was about six times that of sound concrete. While for concrete with a water-to-cement ratio of 0.45 and a 0.25 mm crack (shown in Figure 5c), after 42 days of accelerated carbonation tests, the carbonation depth of concrete was about ten times that of sound concrete. Hence, concrete with a lower water-to-cement ratio is more vulnerable to cracking than concrete with a higher water-to cement ratio. Given the same crack widths, for high strength concrete, when compared with sound concrete, the increase in carbonation depth was more obvious than that of low strength concrete. Additionally, as shown in Figure 5, the theoretical and experimental outcomes showed some deviations. This may be because the crack width used in the calculation may be different from the real crack width in the experiments. For example, when the used crack width in the calculation was 0.15 mm, the real crack width was between 0.1 and 0.2 mm.
In addition, Talukdar et al. [13] theoretically calculated the effective CO2 diffusion coefficient of cracked concrete by considering the crack geometry factor. Crack geometry factor presents significant influence on equivalent CO2 diffusivity of cracked concrete. The secondary fracture crack and damage to the concrete around the crack zone will contribute to CO2 transport and affect the calculation value of the crack geometry factor. To calculate the crack geometry factor, the influences of the secondary fracture crack and concrete damage should be considered. Until now, it has been difficult to find a general equation to determine the crack geometry factor of CO2. The crack geometry factor of chloride ions may be different from that of CO2. To accurately determine the crack geometry factor of CO2, further experimental studies about the CO2 diffusivity of cracked concrete with different crack widths should be undertaken. Hence in this study, for simplicity, we used the experimental regression equation to calculate D c r D . On the other hand, in this study, the values of A and a in Equation (5) are 2.66×10⁻⁶ and 4.75×10⁻⁶, respectively, which were a little different from that found by Papadakis [2] but their magnitude were the same [2]. In Reference [14], Talukdar and Banthia adapted the value of a according to the experimental results of concrete carbonation. The difference of the values A and a between the current study and [14] may be because the current study simplified the carbonation as a diffusion-controlled process.

3.2. Service Life of Cracked Concrete Considering Climate Change

Climate models project the responses of numerous climate variables such as in global environmental temperature and sea level to different scenarios of greenhouse gas emissions and other human-related emissions. Of these different scenarios, the IPCC-AR5 scenario, which was proposed by the Intergovernmental Panel on Climate Change (IPCC), is considered as one of the best models for climate change [15]. 
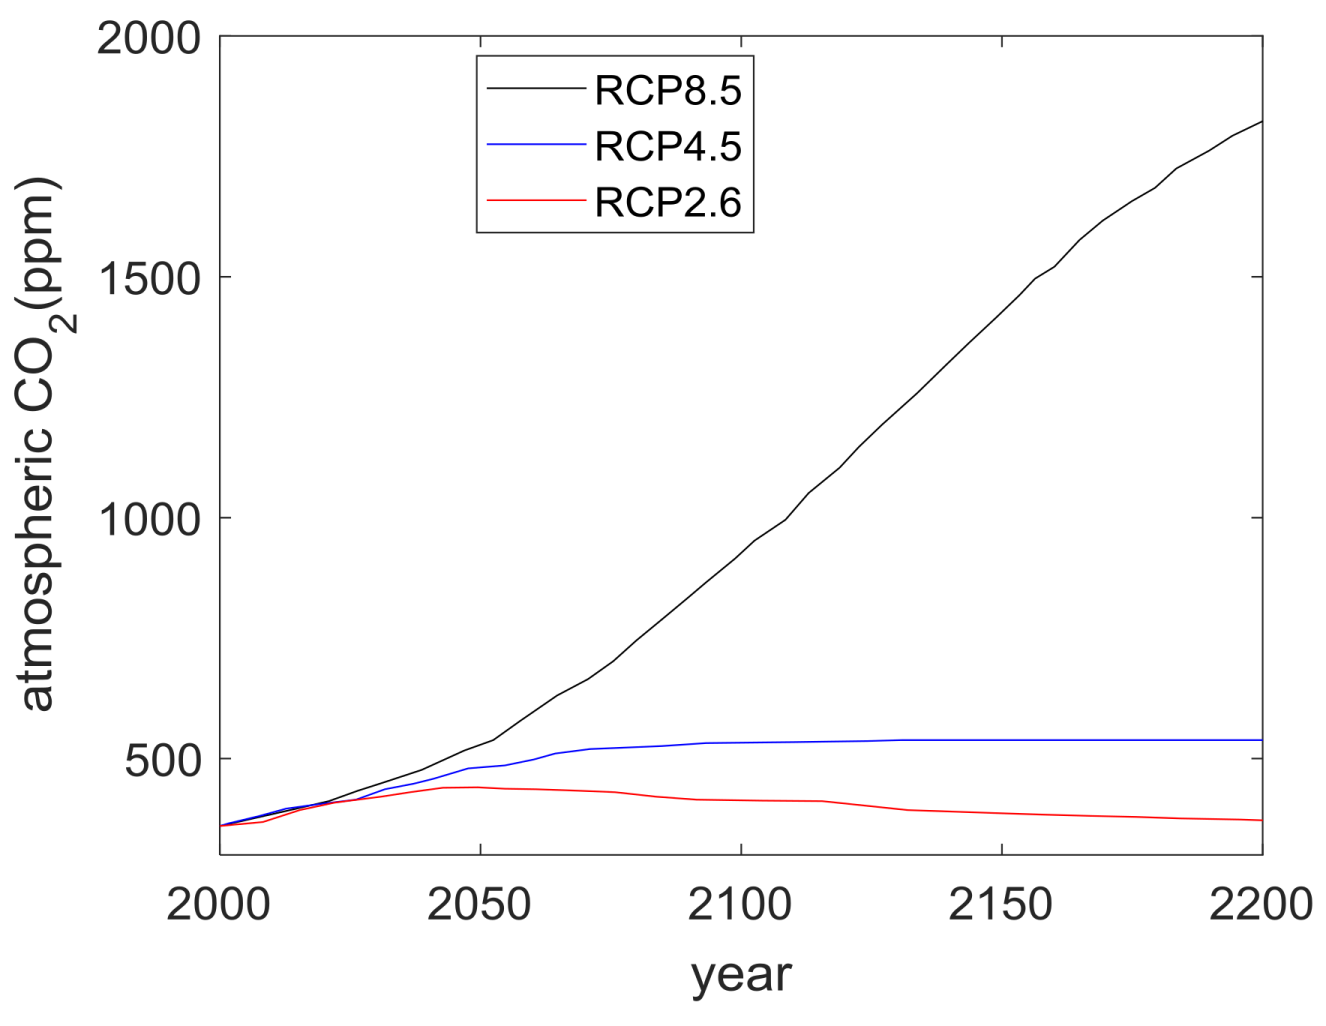
Figure 6 shows the CO2 concentration increase. Representative Concentration Pathways (RCP) 8.5, RCP 4.5 and RCP 2.6 scenarios were considered in this study. RCP 8.5 projected higher CO2 concentration increases than RCP 4.5 and RCP 2.6. 
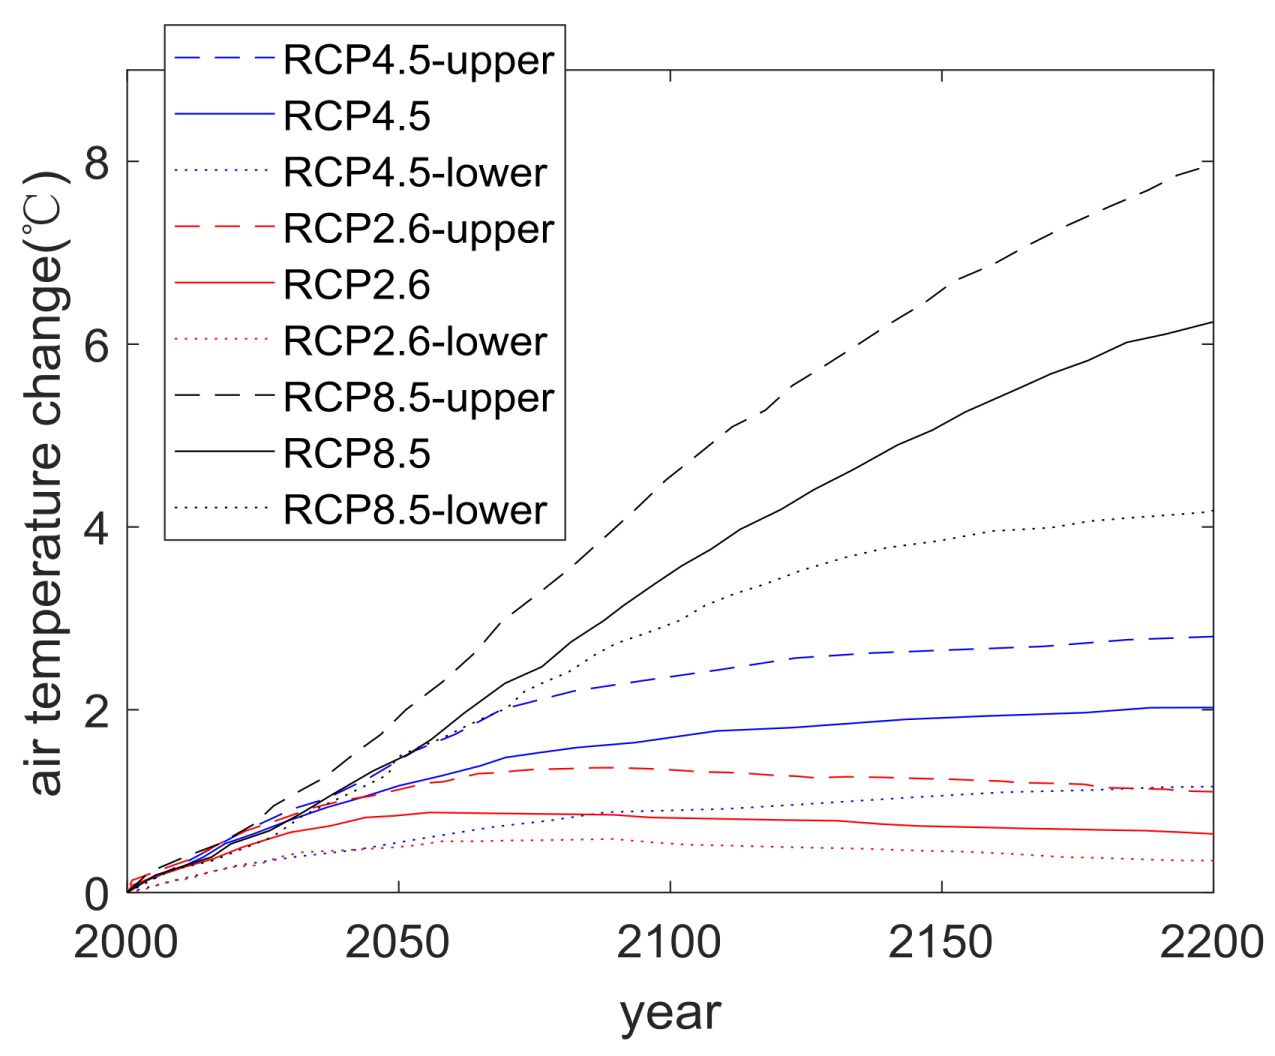
Figure 7 shows the temperature increase for different climate change scenarios. Both mean temperature rises and the upper and lower 90% confidence intervals of each scenarios are included in Figure 7.
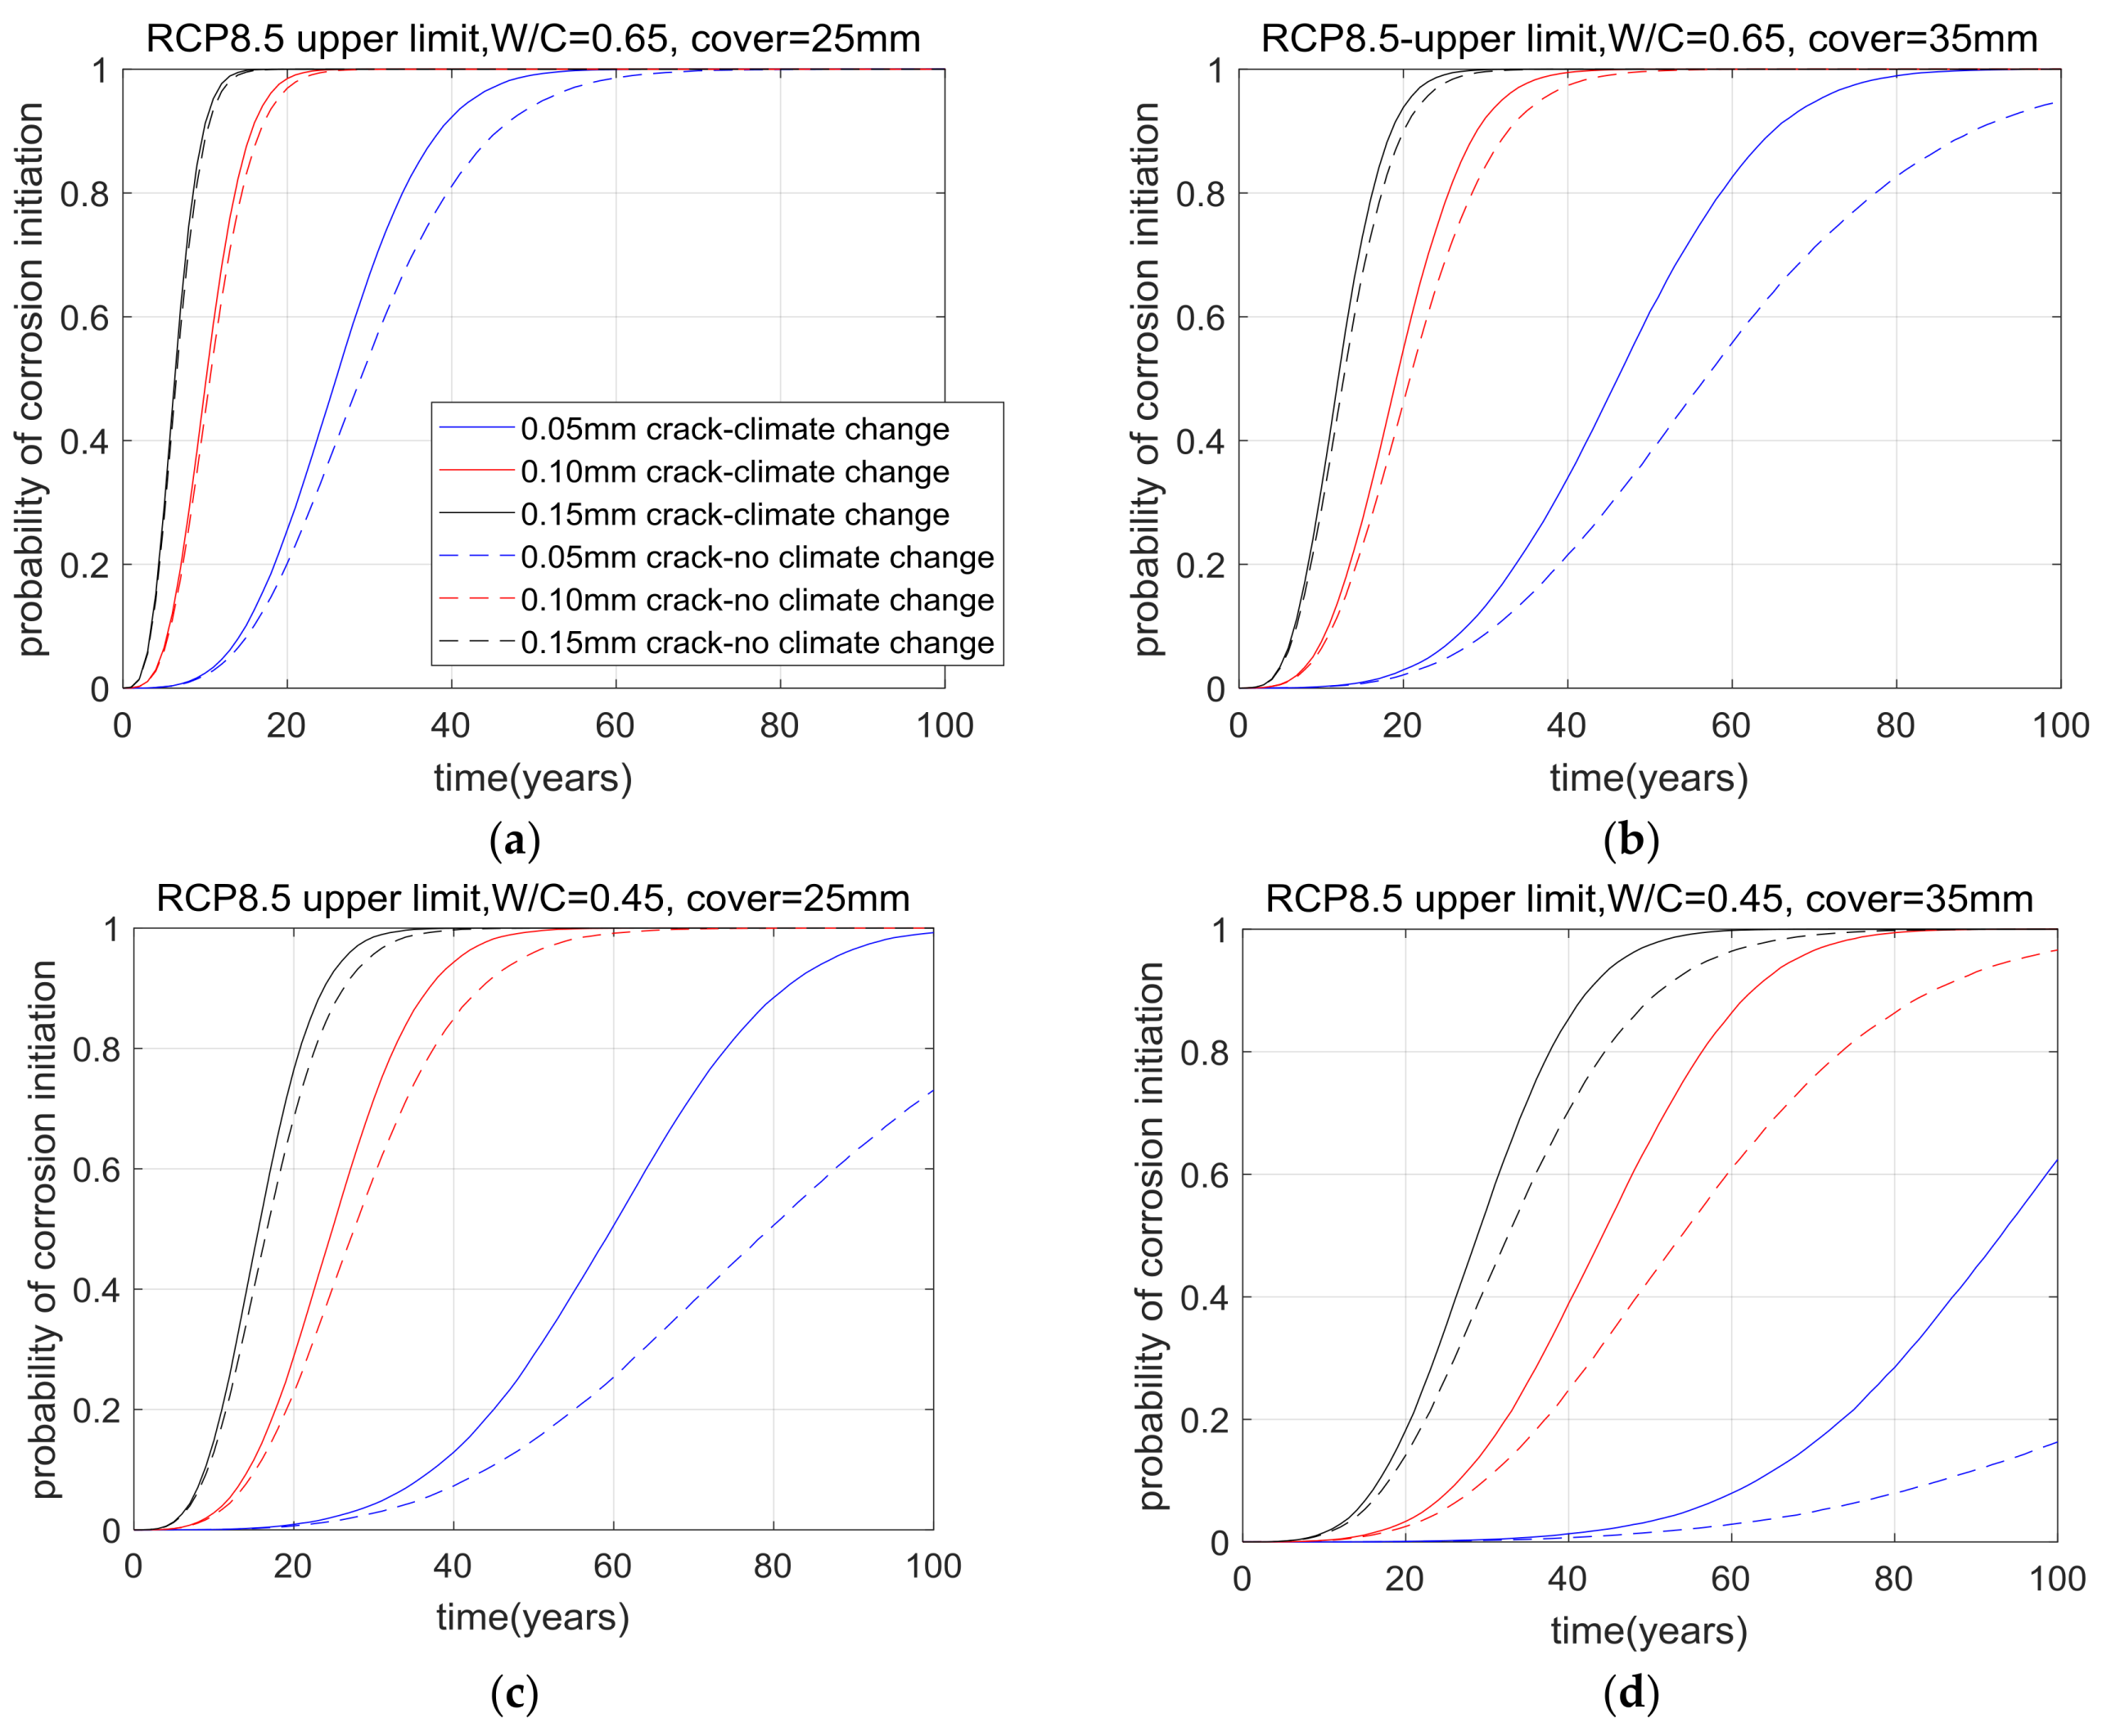
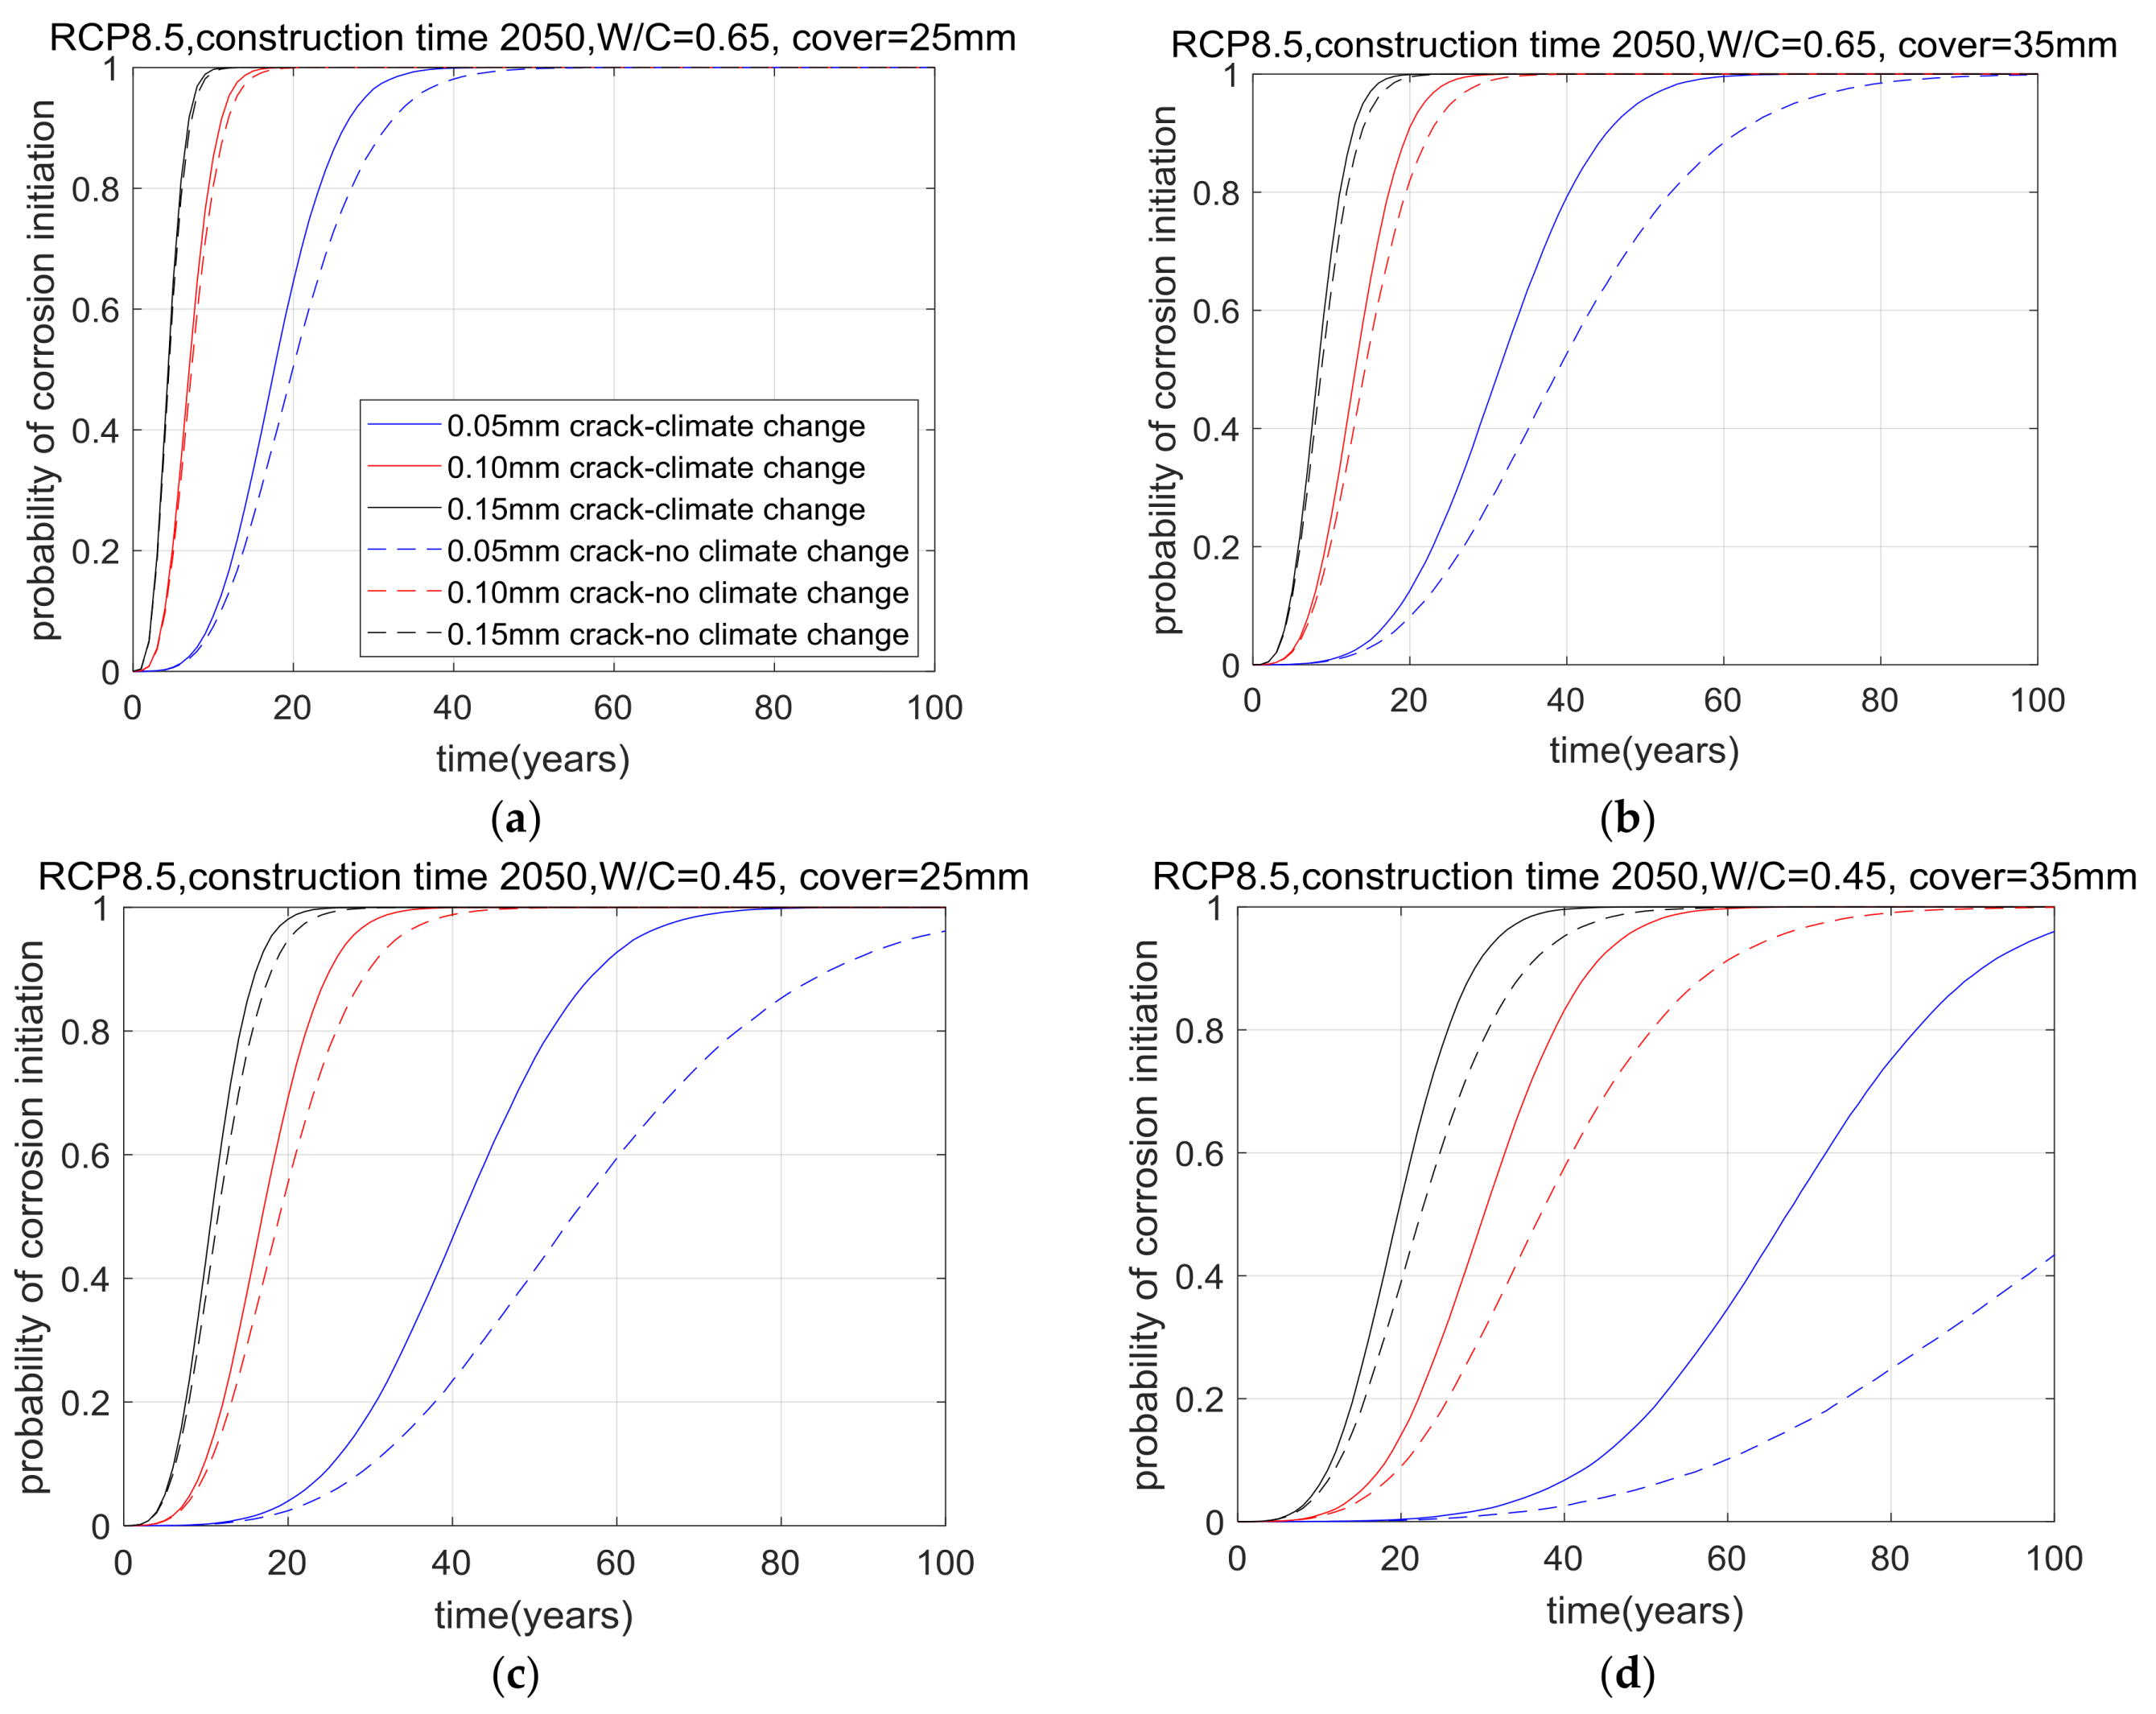
In this section, parameter analysis was carried out to calculate the carbonation depth, probability of corrosion initiation and service life of cracked concrete. Two W/C (0.45 and 0.65), two concrete cover depths (25 mm and 35 mm) and three crack widths (0.05 mm, 0.10 mm and 0.15 mm) were used in the parameter analysis. In this study, W/C = 0.45, cover depth = 35 mm, crack width = 0.05 mm represents the upper limit of service life and W/C = 0.65, cover depth = 25 mm, crack width = 0.25 mm represents the lower limit of service life.
Table 2 shows statistical parameters. In this study, we considered the uncertainties of the C V and C R . The concrete cover depth was assumed to have a normal distribution [11] and the coefficient of variance of cover depth was assumed to be 0.2 [3]. The carbonation rate parameter at the initial time was assumed to have a normal distribution [11] and the coefficient of variance of the carbonation rate parameter was 0.15 [3]. For CO2 concentration and global temperature, the coefficient of variance increased with time [11]. At the initial time, the coefficient of variance equaled zero and at the 100-year mark, the coefficient of variance was taken to be 0.06 [11]. In addition, in this parameter study, the relative humidity was set as 65%, the initial environmental temperature was set as 25 °C, the curing period before carbonation testing was 28 days and the interspace of the concrete crack was 100 mm. Table 3 shows the summary of the analyzed cases. Six cases were analyzed: the RCP 2.6, RCP 4.5, RCP 8.5, RCP 8.5 upper 90% confidence interval, RCP 8.5 at the time slice 2050 and RCP 8.5 upper 90% confidence interval at the time slice 2050. To some extent, the different analysis cases such as RCP 2.6, RCP 4.5, RCP 8.5, RCP 8.5 upper 90% confidence interval, RCP 8.5 at the time slice 2050 and RCP 8.5 upper 90% confidence interval at the 2050-time slice, can represent specific cities [14,16,17].
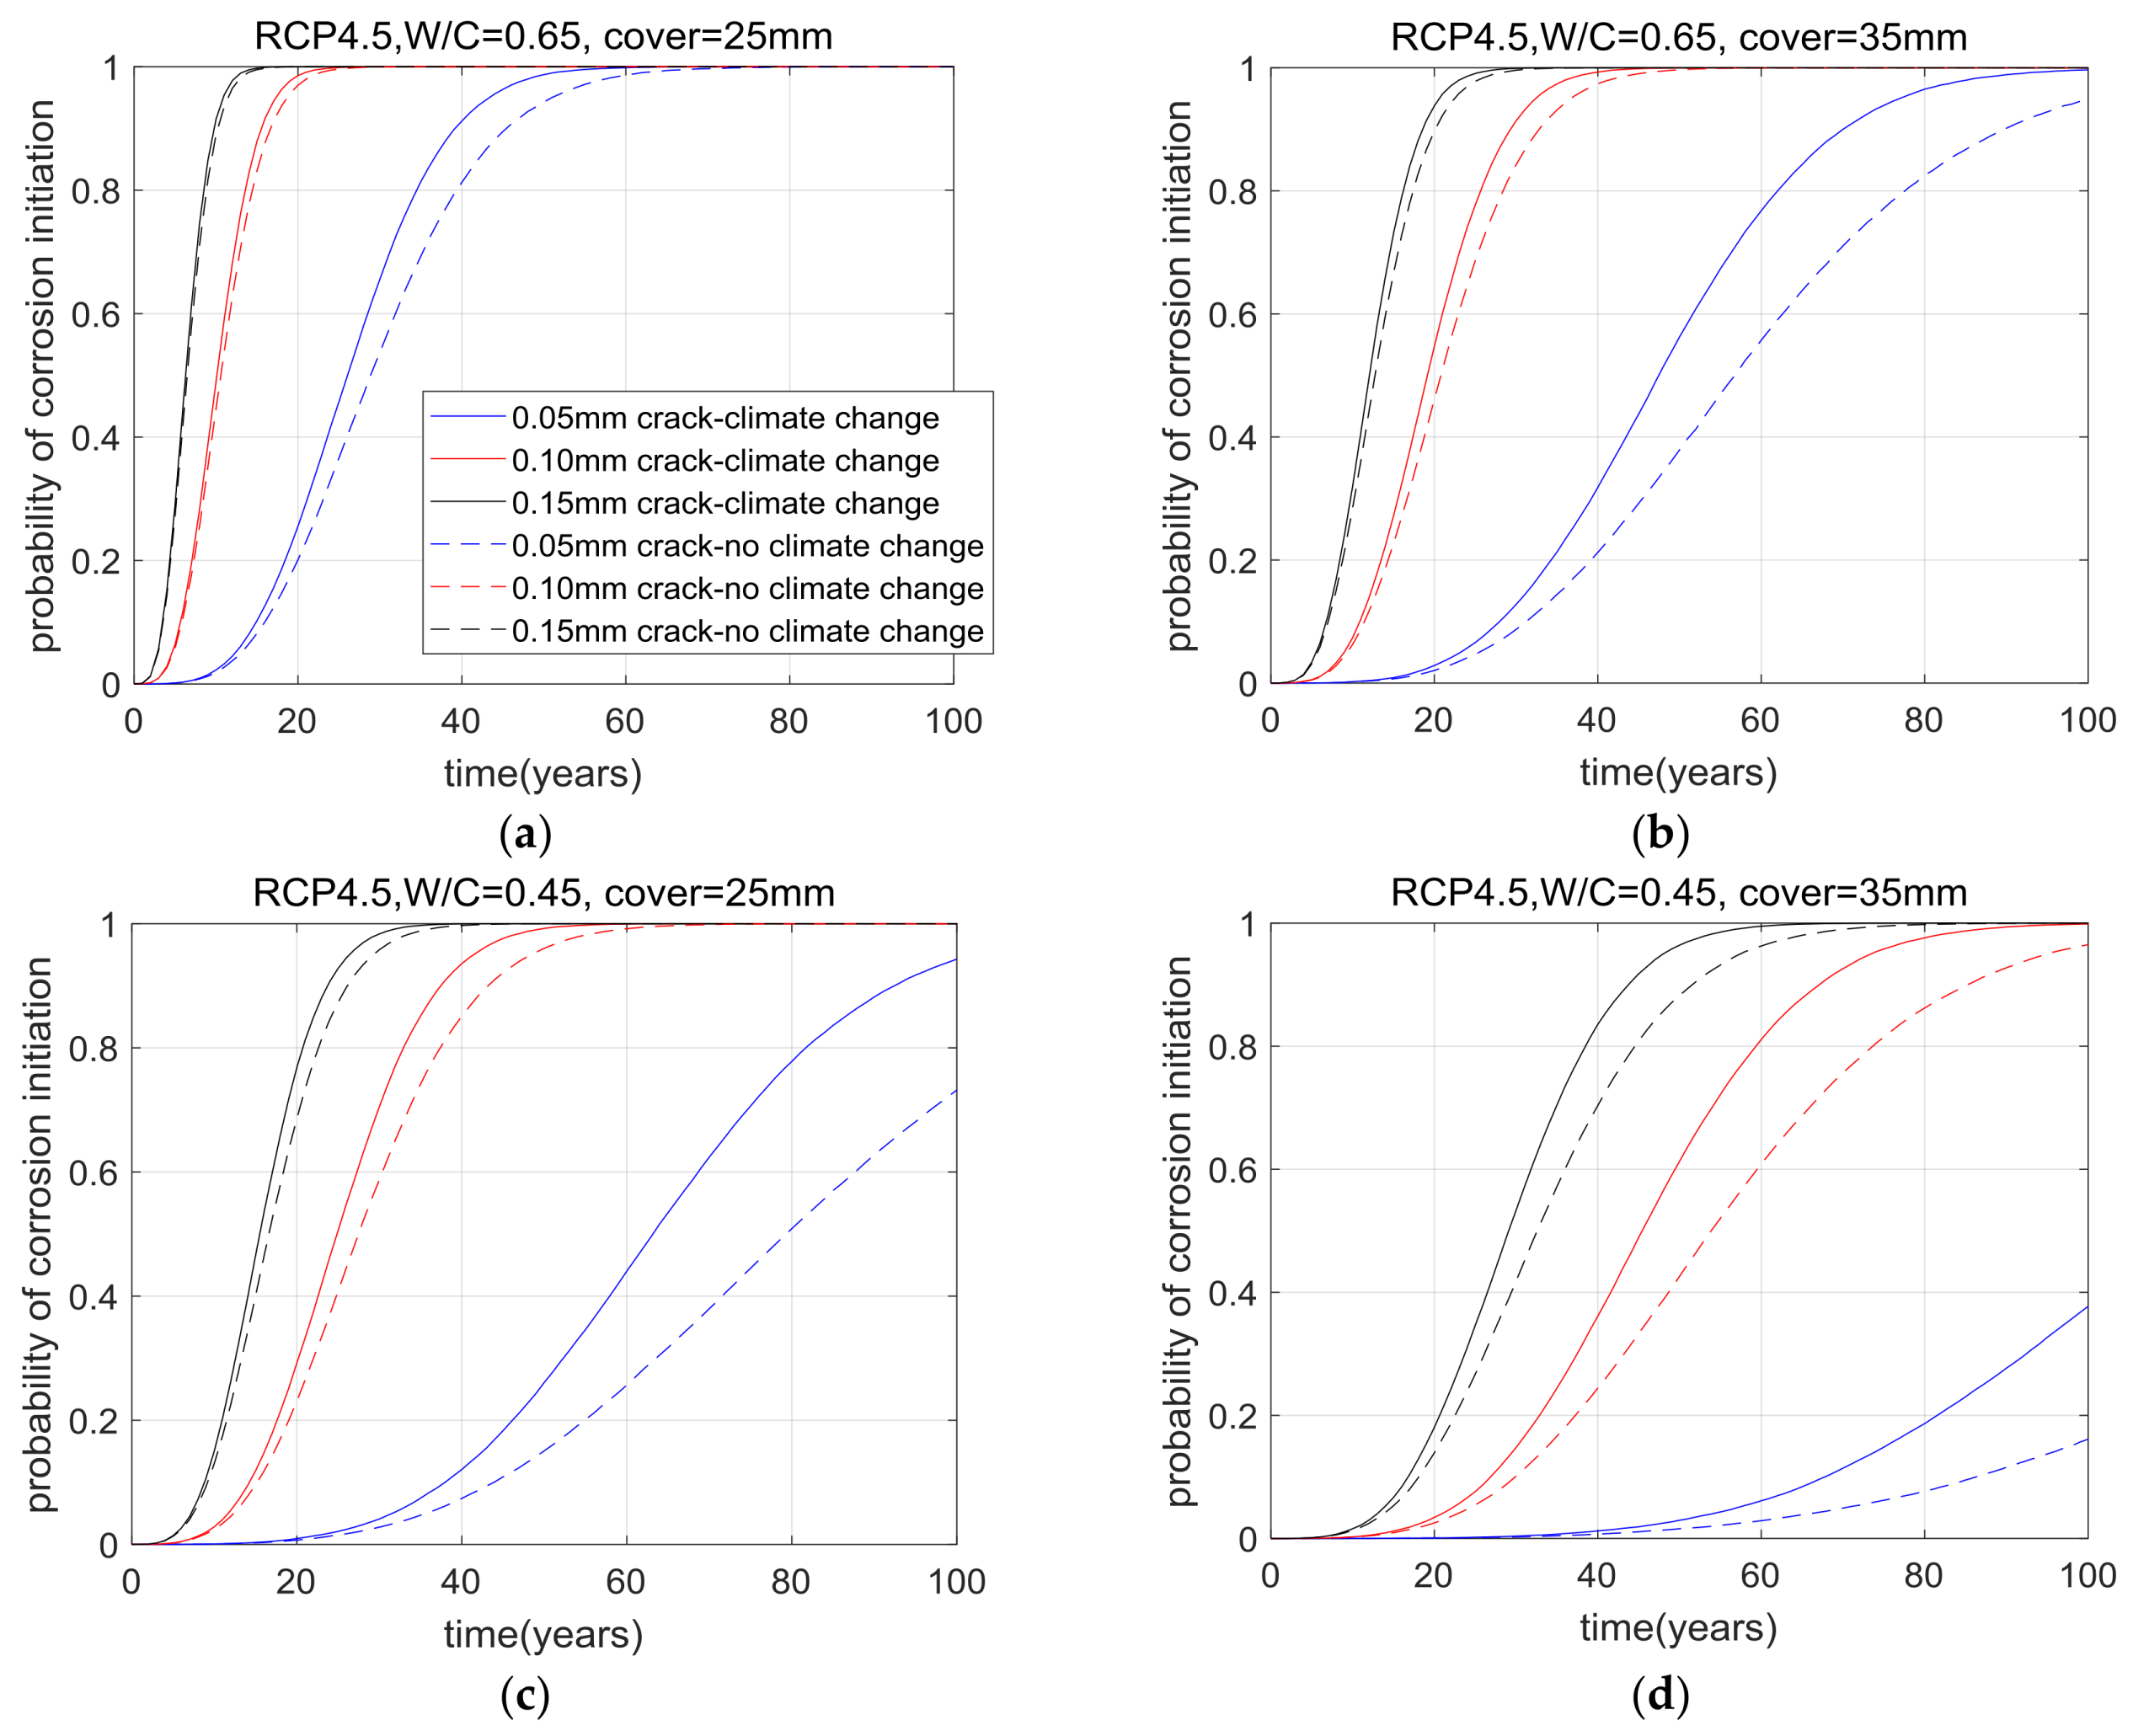
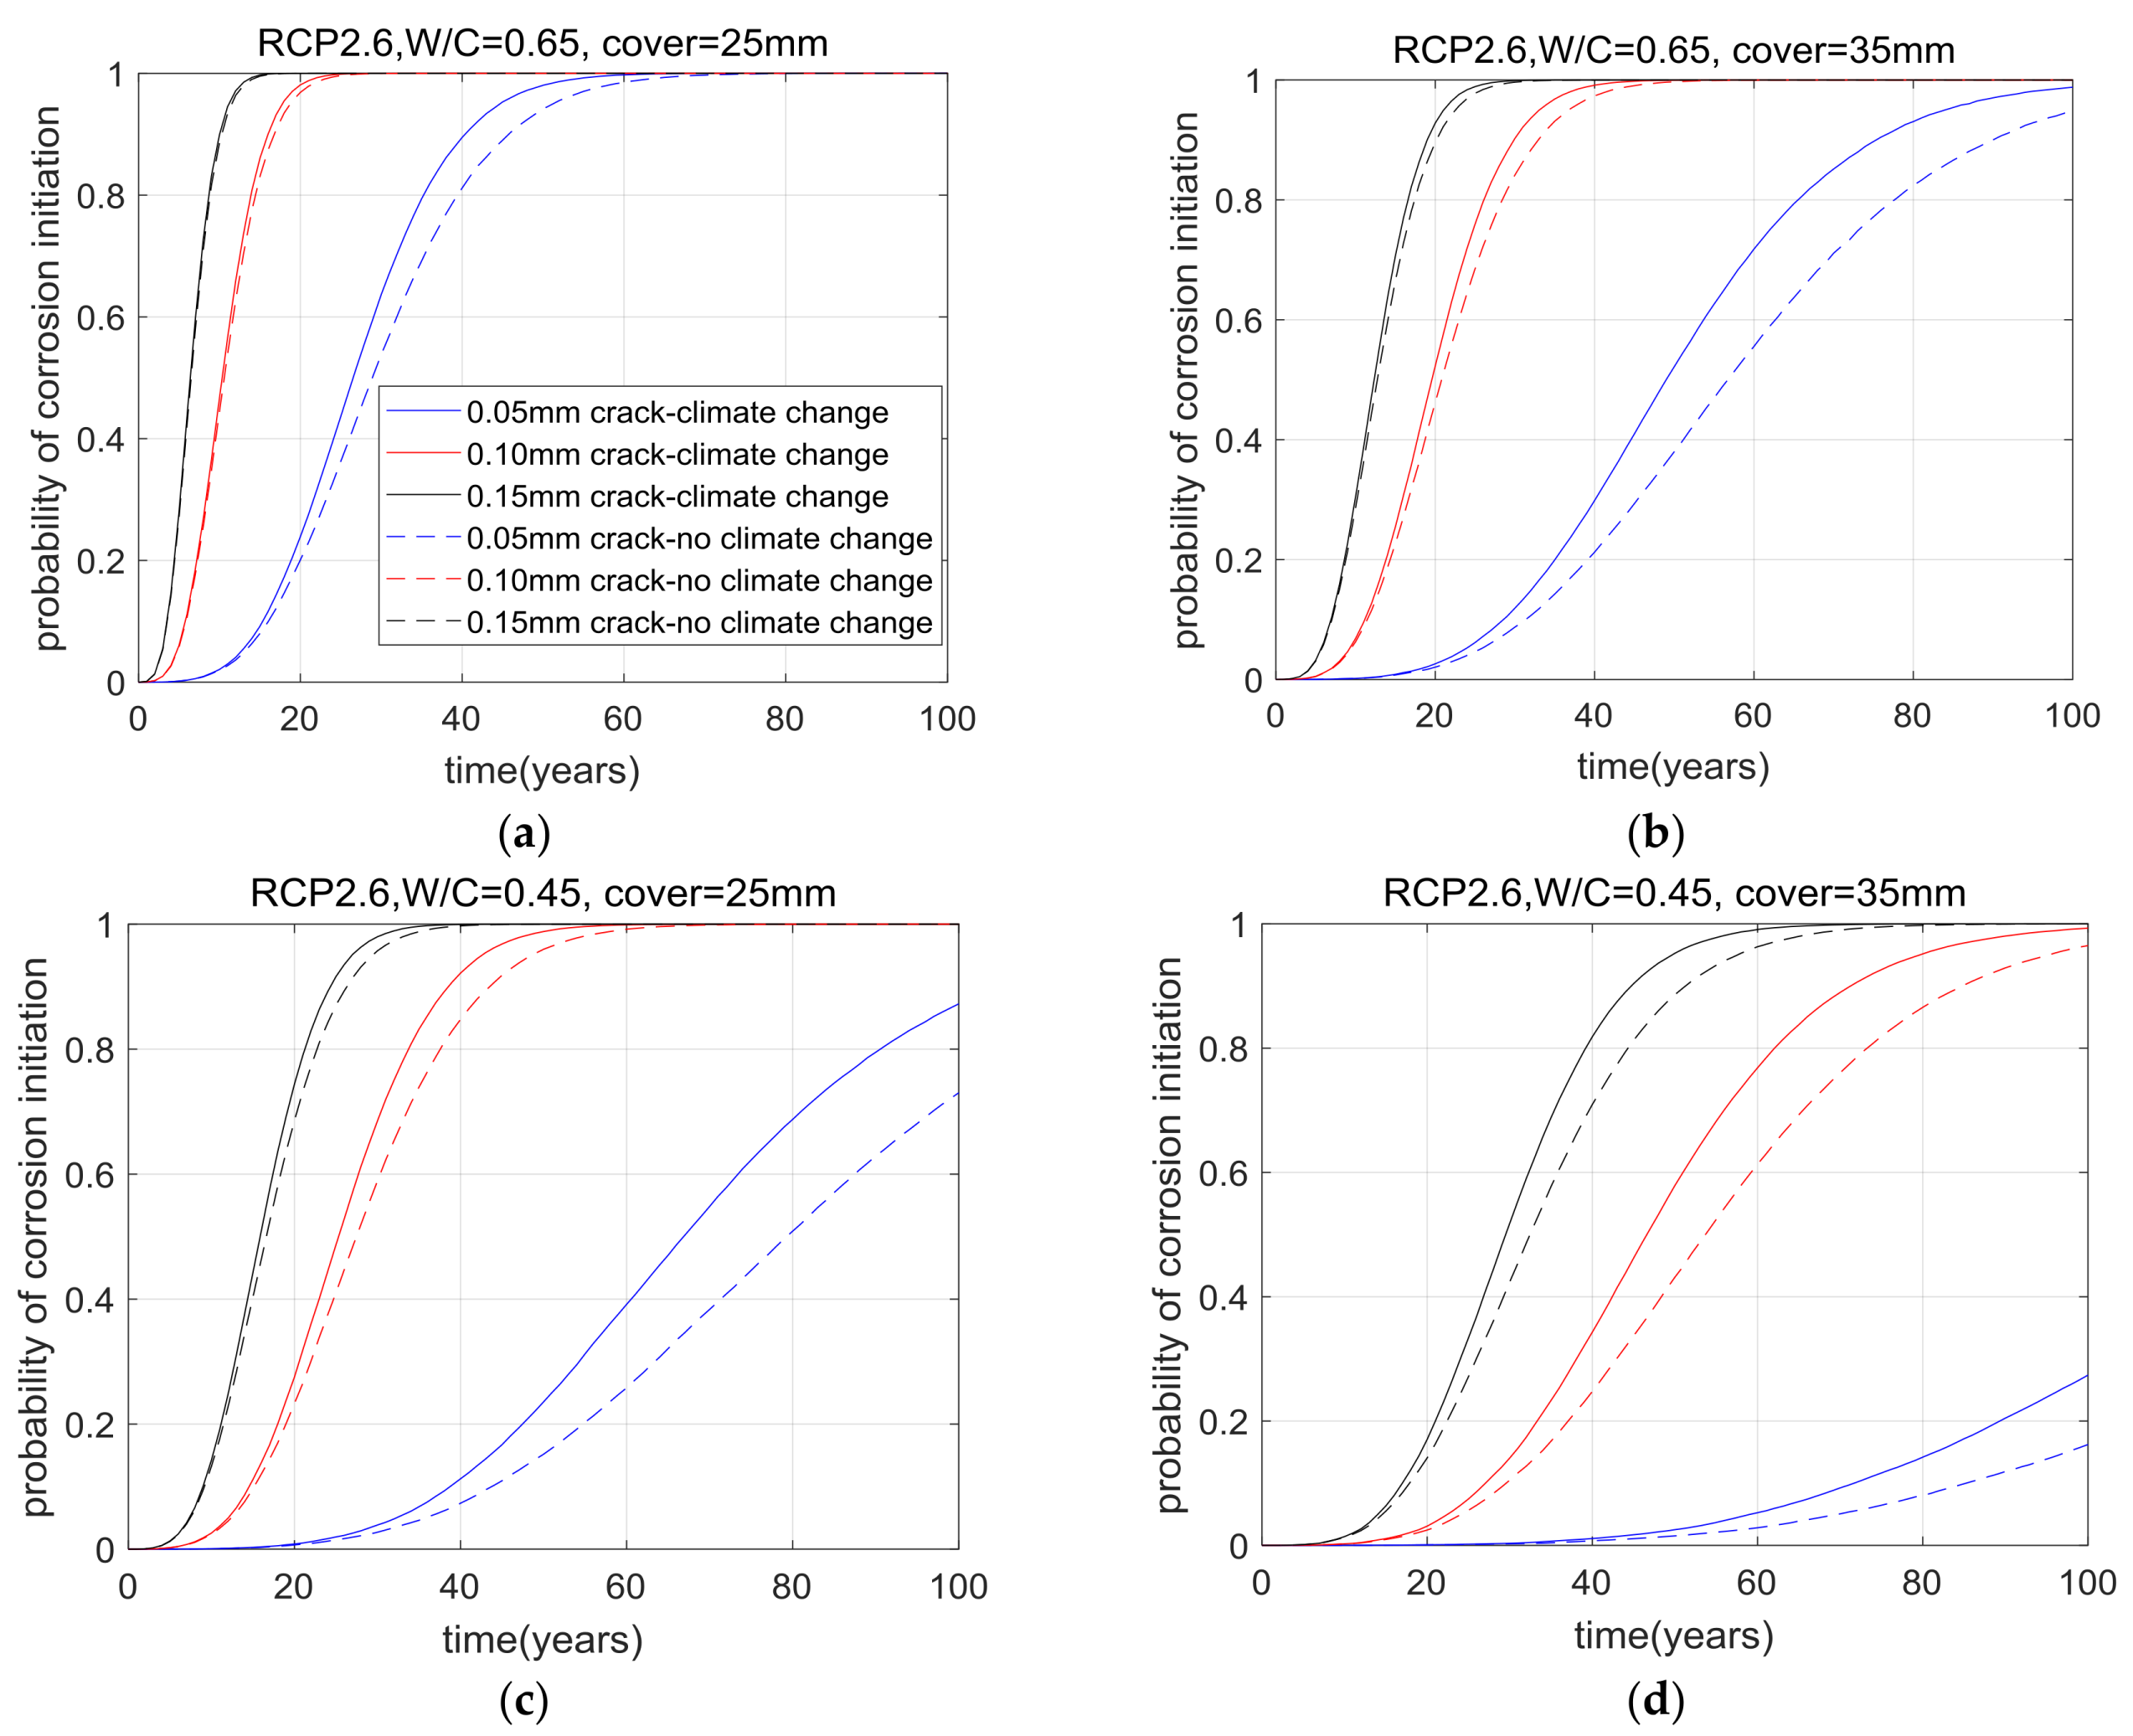
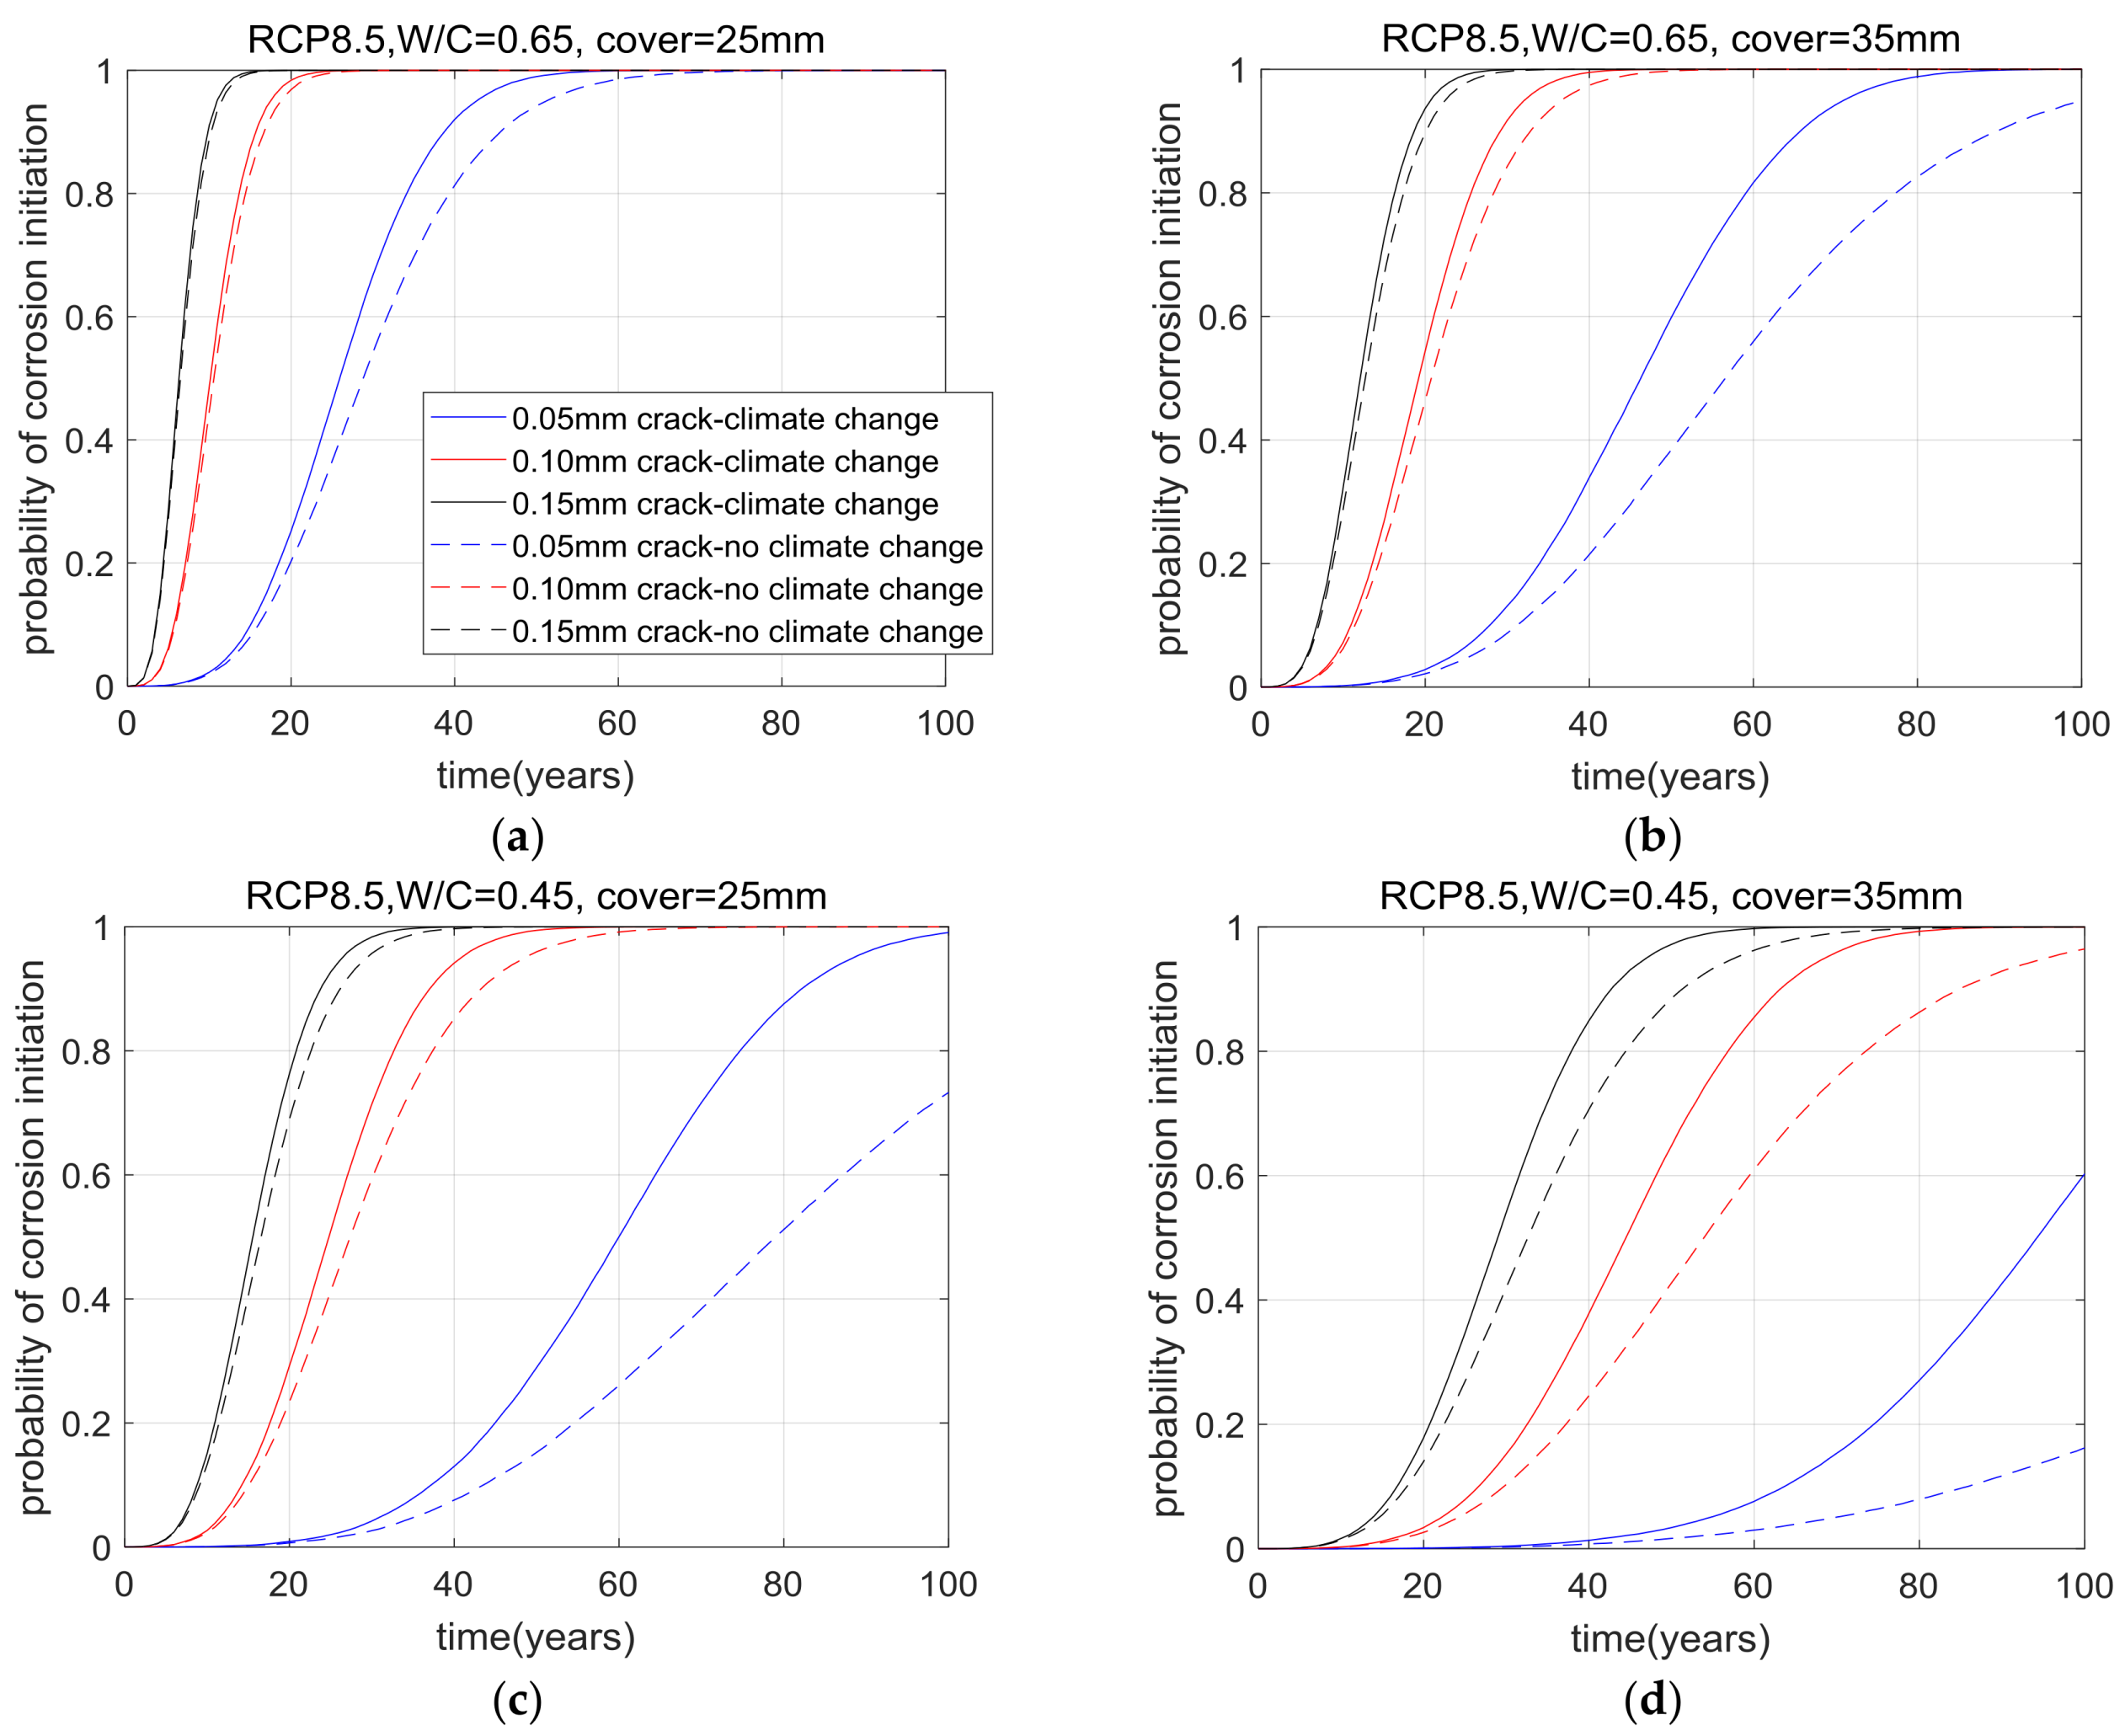
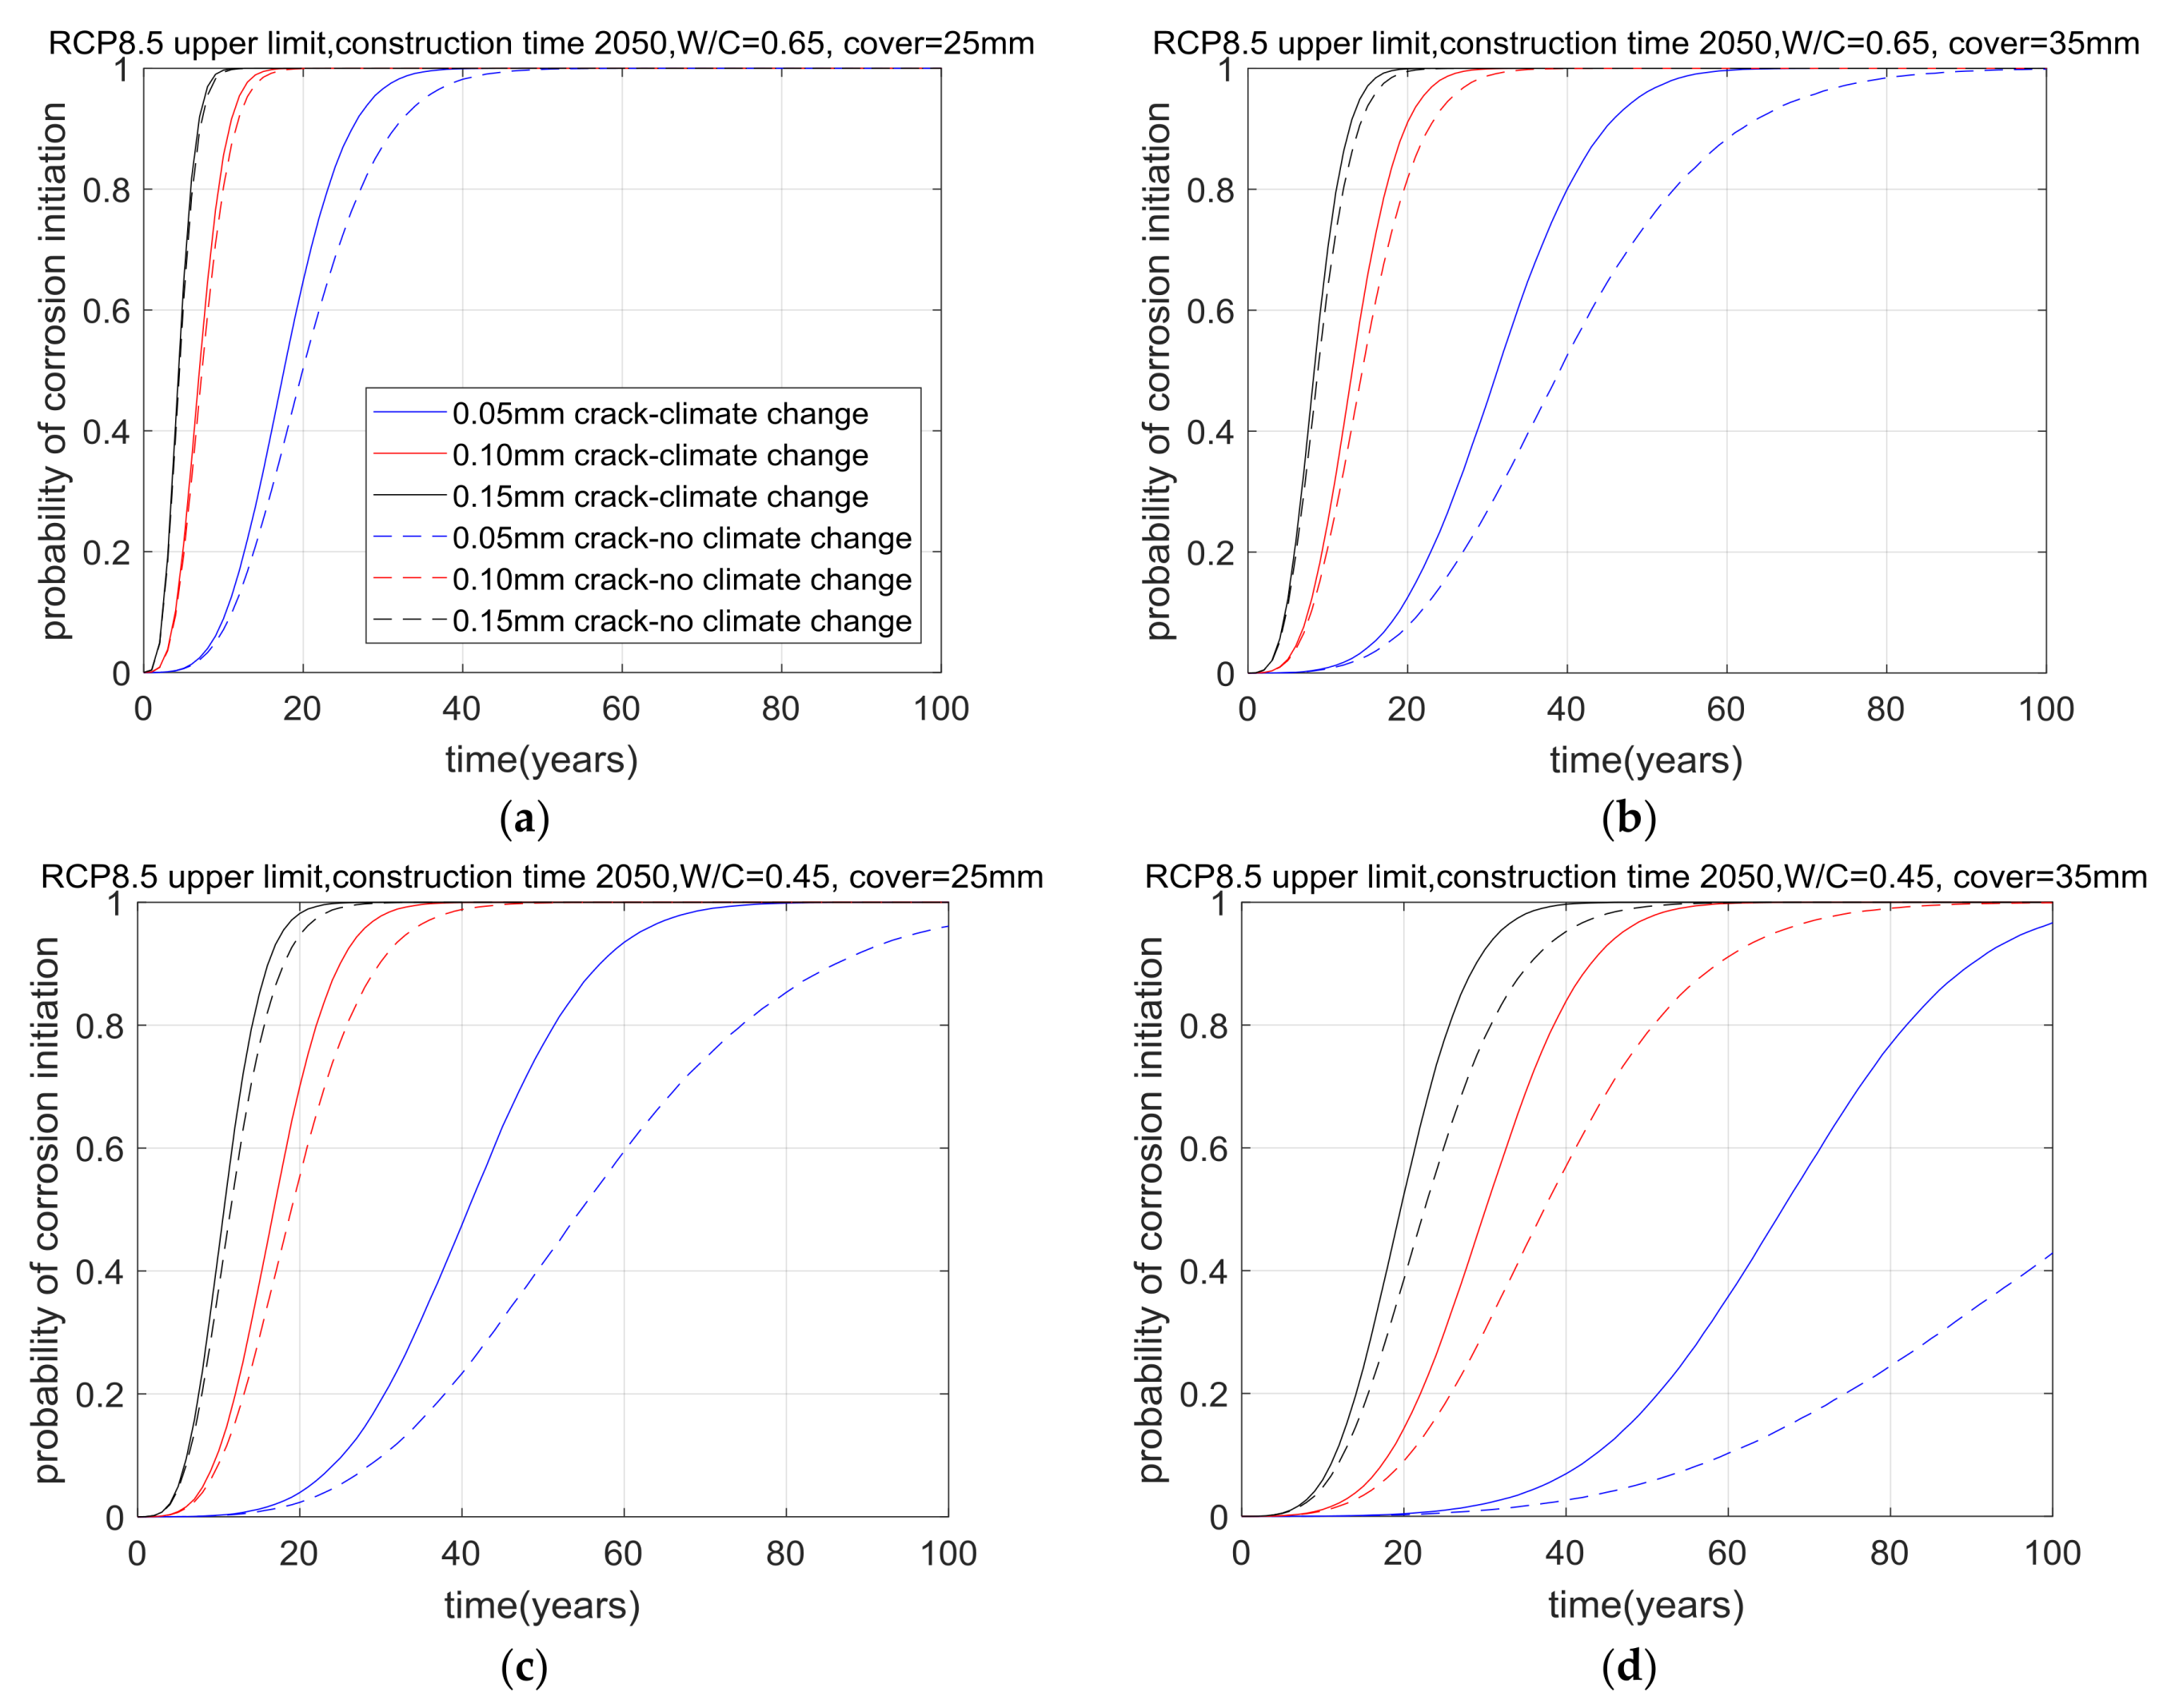
Based on the concrete hydration-carbonation integrated model, the carbonation depth of concrete could be calculated. Furthermore, by using the Monte Carlo method, the probability of corrosion initiation was determined. The probability of corrosion initiation for the analysis cases is shown in Figure 8, Figure 9, Figure 10, Figure 11, Figure 12 and Figure 13. With the increase in cover depth (seen in a comparison between Figure 8a,b and between Figure 8c,d), the probability of corrosion initiation decreased. With the decrease in water-to-cement ratio (based on a comparison between Figure 8a,c and between Figure 8b,d, the probability of corrosion initiation also decreased. Higher W/C with a lower crack width may present a lower probability of corrosion than a lower W/C with a higher crack width. In this study, we treated the water-to-cement ratio and crack width separately and did not consider the effect of water content on the chance of cracking.
When cracks increased from 0.05 mm to 0.15 mm, the service life of concrete reduced significantly. As the service life reduced, the changing extent of the climate scenario during service life became smaller and the effect of climate change on the cumulative probability function became much weaker. Hence, the cumulative probability functions with cracks of 0.15 mm were very similar, regardless of climate change and the cumulative probability functions with cracks of 0.05 mm were quite different. For concrete with 0.05mm cracks, different climate change scenarios and time slices lead to different probabilities, especially when the probability exceeds 0.8.
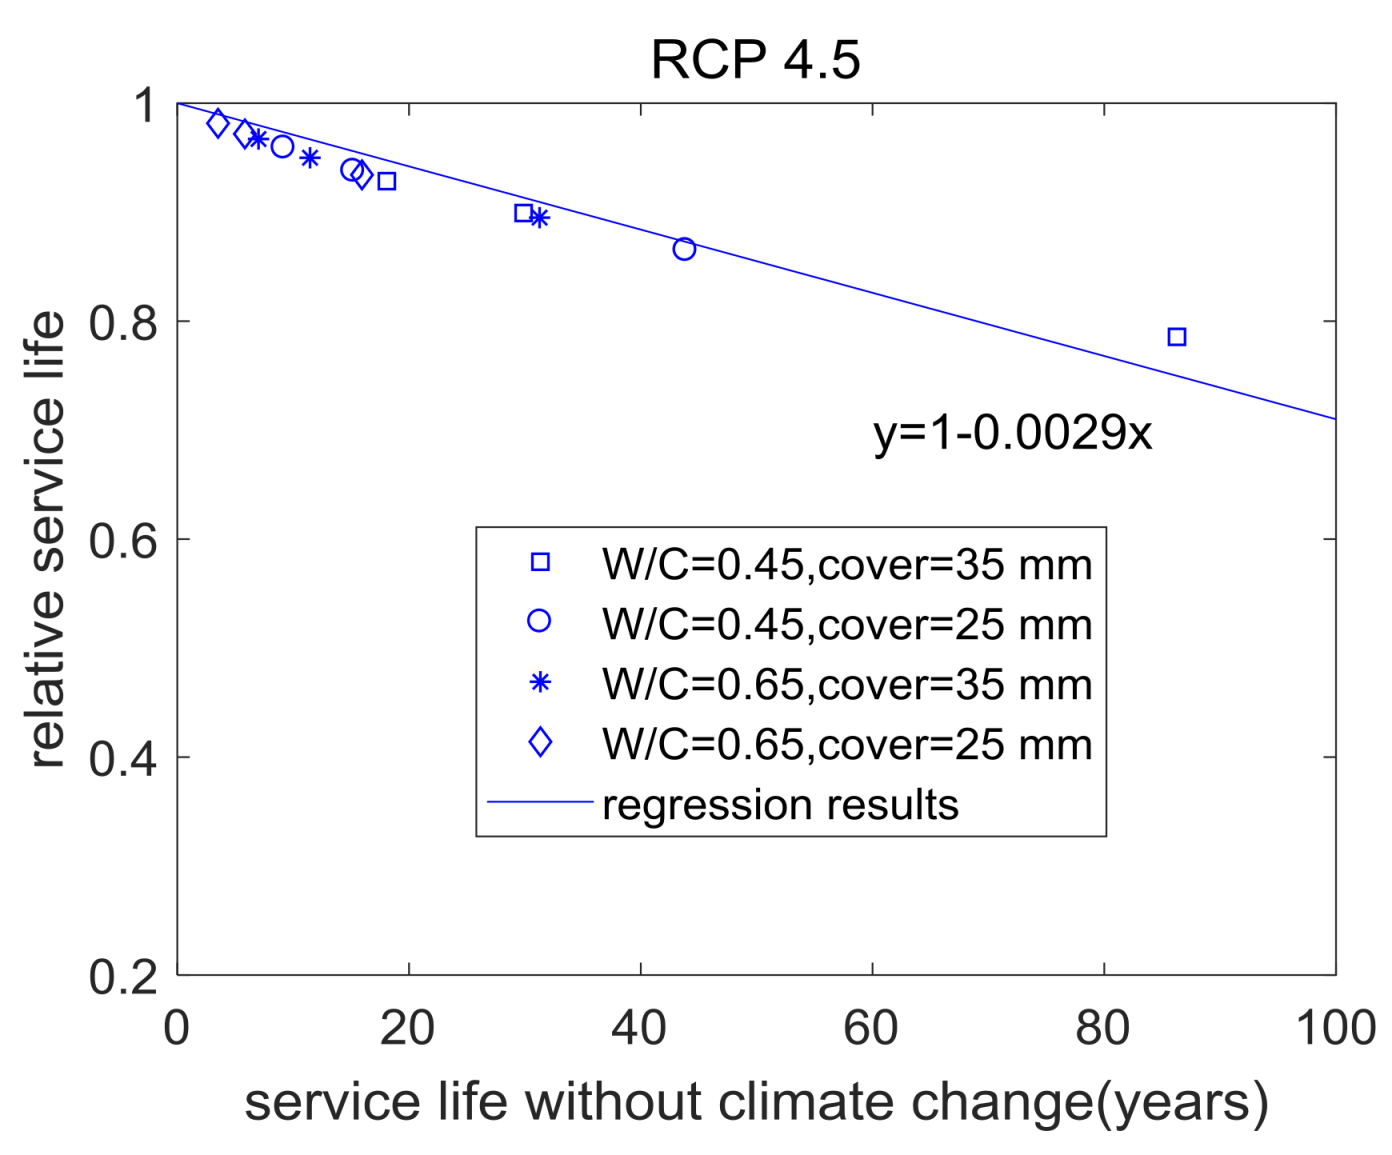
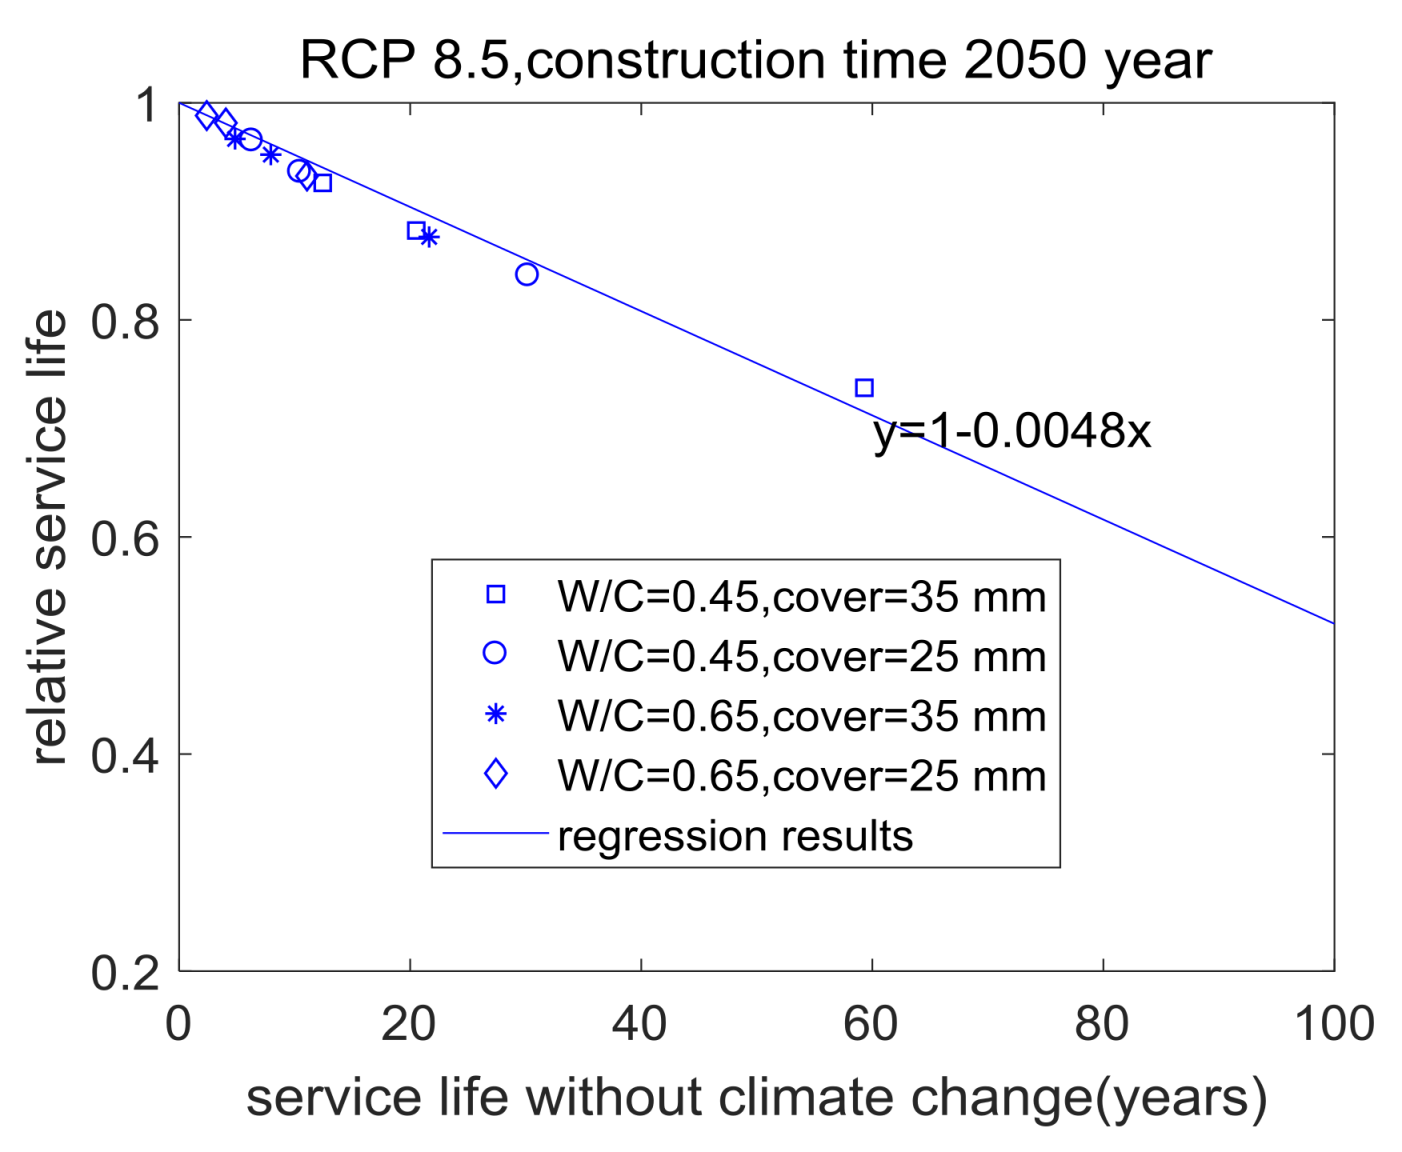
In this study, the former service life was defined as the service life of concrete for the condition of no climate change; the modified service life was the service life of concrete after considering climate change and the relative service life was defined as the ratio of modified service life to former service life. Based on the interpolation between the probability of corrosion initiation and time (shown in Figure 8, Figure 9, Figure 10, Figure 11, Figure 12 and Figure 13), the former service life and revised service life could be determined. Furthermore, the relative service life of concrete was calculated. Table 4, Table 5, Table 6, Table 7, Table 8 and Table 9 show the former service life, revised service life and relative service life of concrete of each analysis case. It shows that with an increase in former service life after considering climate change, reductions on the former service life also increased.
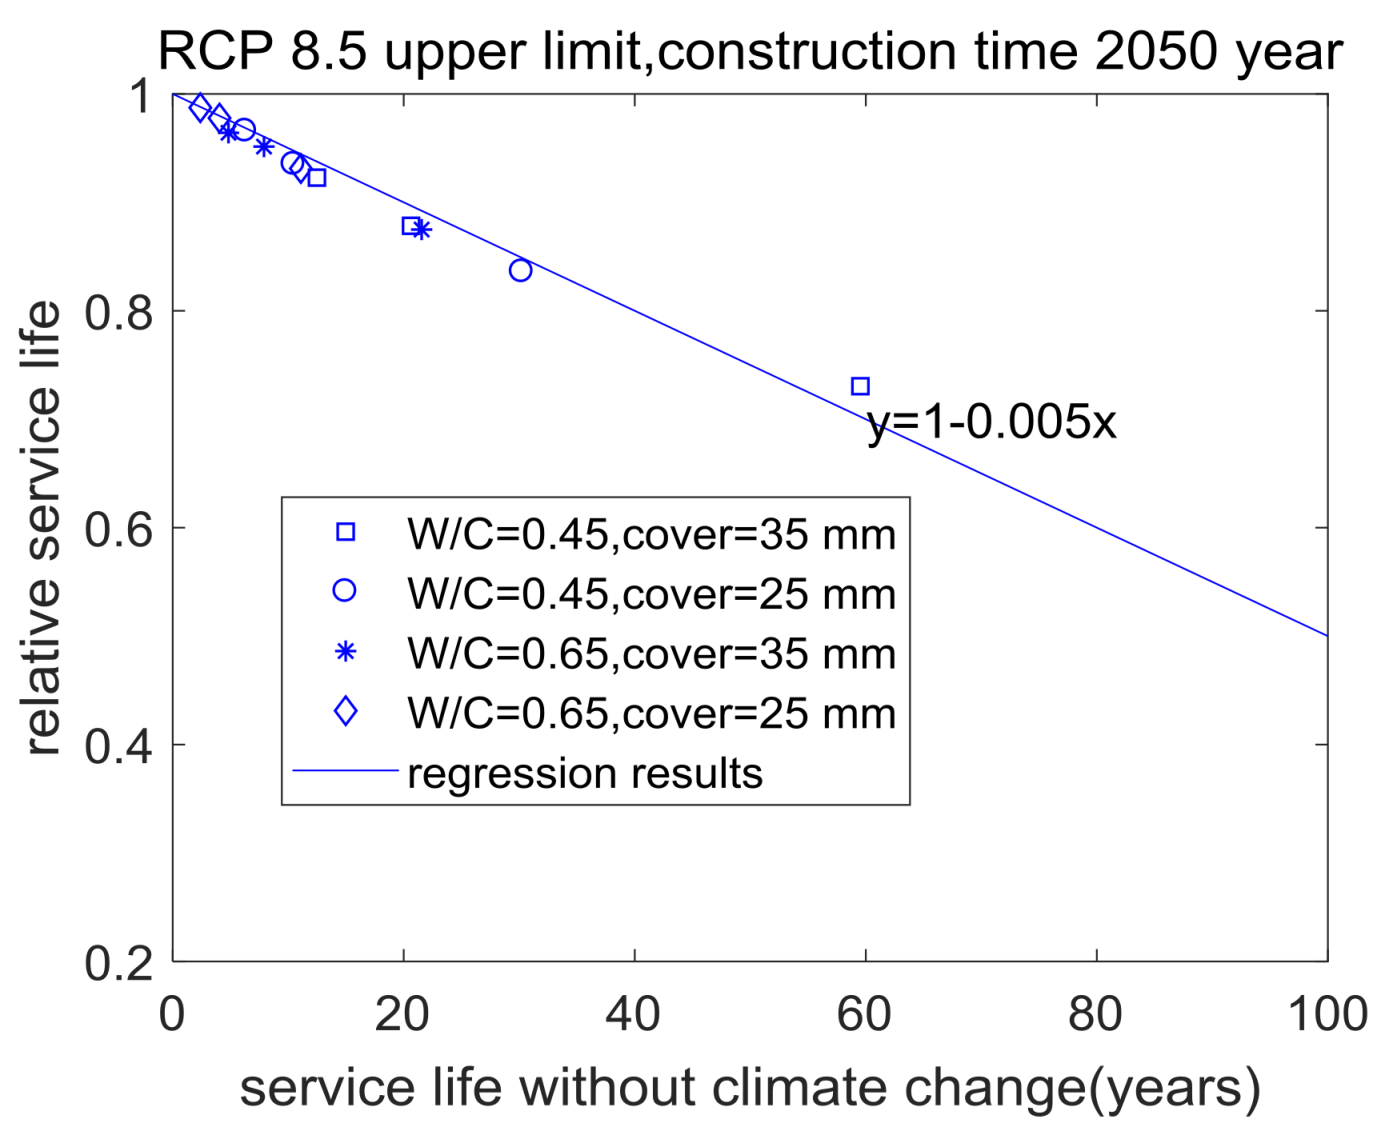
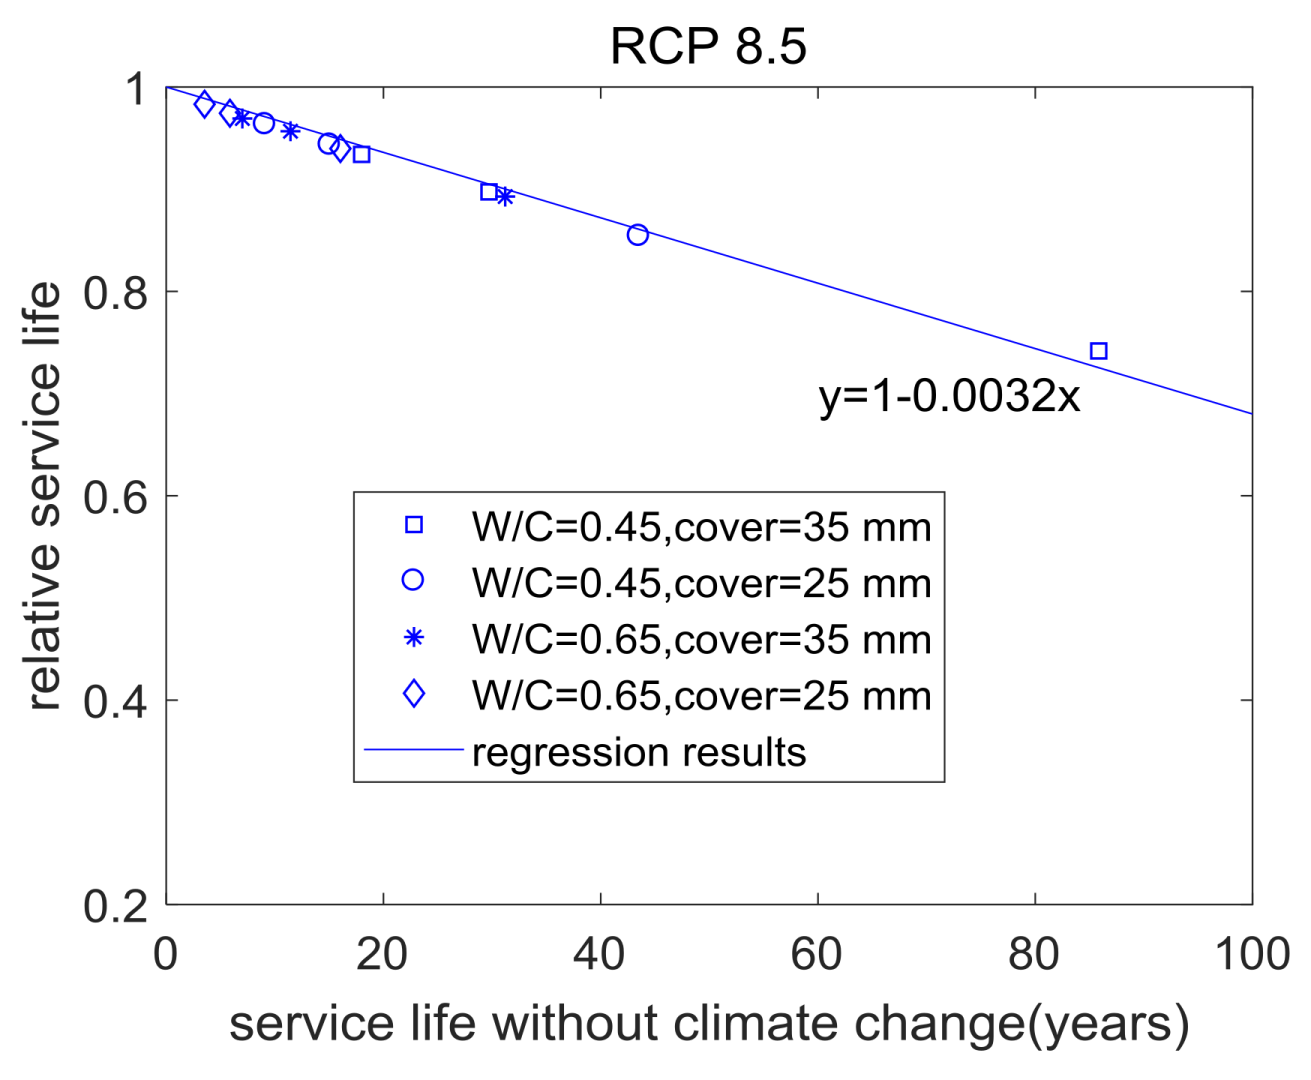
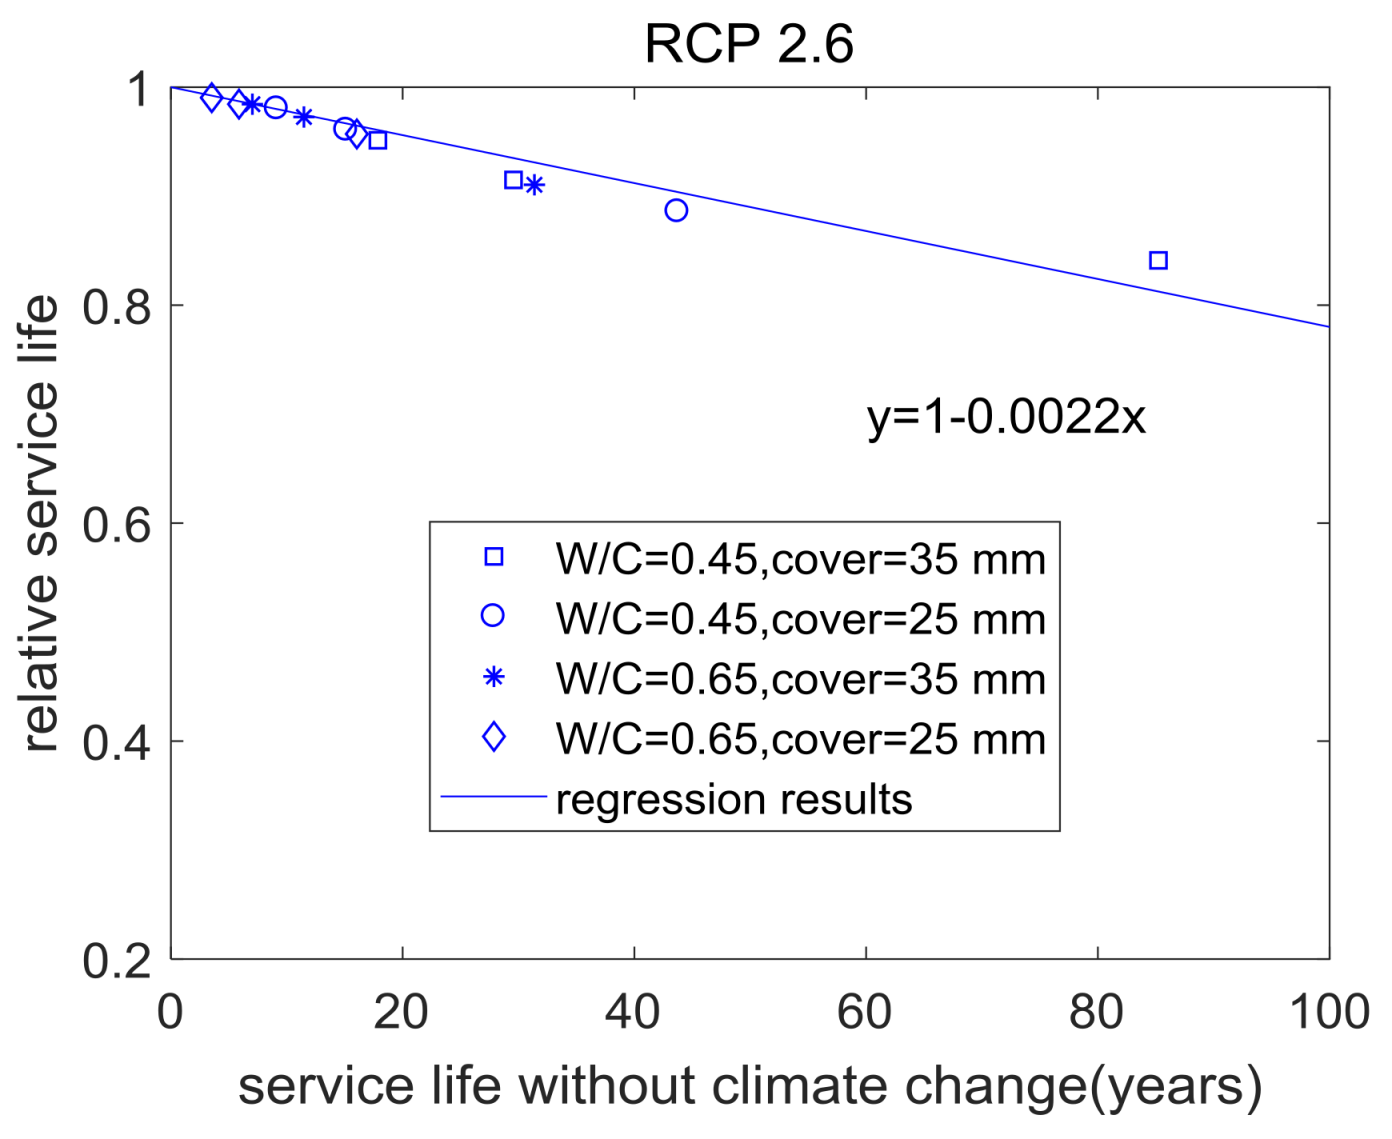
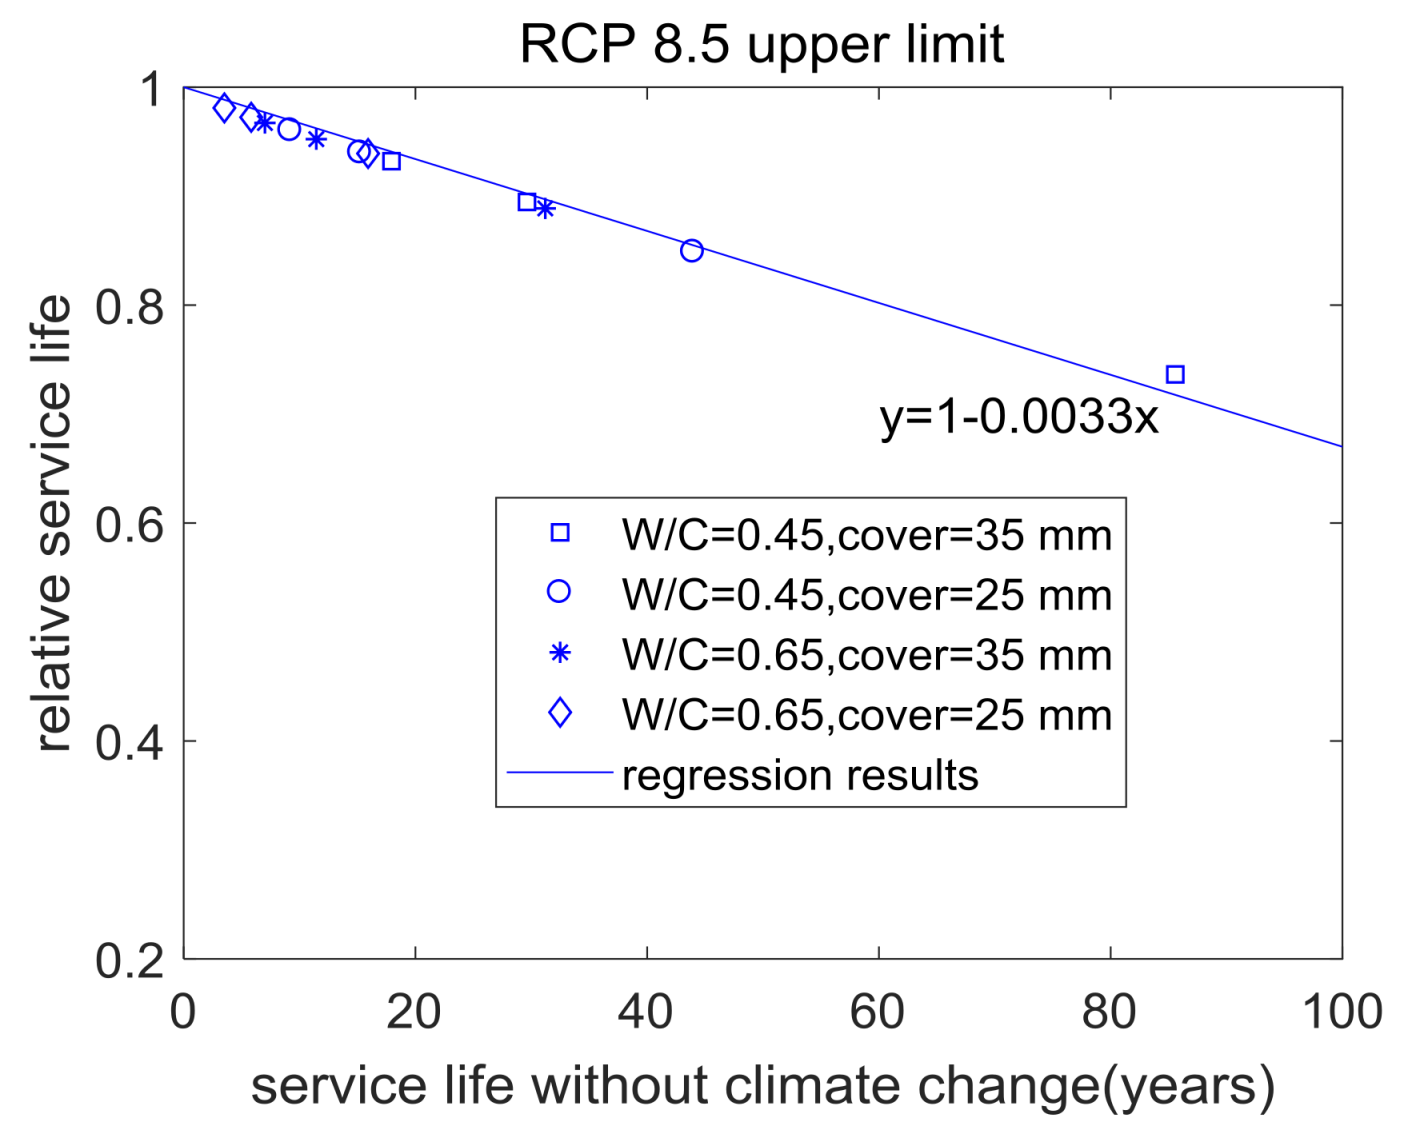
Figure 14, Figure 15, Figure 16, Figure 17, Figure 18 and Figure 19 show the relative service life for each case. Relative service life is expressed as a function of former service life. Given a certain analysis case, for concrete with different water-to-cement ratios, different cover depths and different crack widths, the relationships between relative service life and former service life were similar. When former service life increased, relative service life also almost linearly decreased. Hence, climate change presents more significant influence on the service life of more durable concrete.
The summary of the analysis results for various cases is shown as follows. First, in the RCP 8.5, RCP 4.5 and RCP 2.6 climate change scenarios for concrete structures with a time slice 2000 and a 50-year service life, after considering climate change, service life will reduce by 16%, 14.5% and 11%, respectively. The reduction trend of service life was similar to the increase trends of CO2 concentration and global temperature. Second, with a time slice 2000, as the climate change scenario changed from RCP 8.5 to RCP 8.5 upper 90% confidence interval, service life loss slightly increased from 16% to 16.5%. This was due to the increase in global temperature. While with a time slice 2050, as the climate change scenario changed from RCP 8.5 to RCP 8.5 upper 90% confidence interval, service life loss slightly increased from 24% to 25%. The service life loss may have more uncertainty in the near future than in the present. Third, in the case of the RCP 8.5 climate change scenario, for concrete structures with a 50-year service life, when the time slice changed from 2000 to 2050, service life loss increased from 16% to 24%. This was because the increase of CO2 concentration and temperature were much higher in the 2050–2100 range than the 2000–2050 range of RCP 8.5. In addition, as shown in Table 4 and Table 8, when the time slice changed from 2000 to 2050, the service life was reduced because of the increase in CO2 concentration and temperature.
The proposed model considered the influences of material properties (mixing proportions and curing periods), crack characteristics (crack width and crack interspace) and environmental conditions (CO2 concentration, temperatures and relative humidity) on carbonation resistance and the service life of concrete structures. The calculated results regarding corrosion initiation time and service life can be combined with structural health monitoring technology for the design and maintenance of concrete structures [18,19]. However, the proposed model has its limitations. First, the CO2 diffusivity in the cracked zone was not analyzed in detail. The crack geometry shape such as equal width cracks or tapered cracks were not taken into account [5]. Second, the interaction between moisture diffusion, thermal diffusion, carbonation reaction and CO2 diffusion were also not taken into account [20]. In this study, only a simplified equation (Equation (4)) was employed to calculate the carbonation depth of concrete. Third, the defined service life in this study was too conservative. The corrosion propagation period should be included in the service life of concrete structures [21]. In addition, the effect of other atmospheric variables on carbonation such as wind pressure, especially at the surface of concrete buildings, should also be considered in further studies [22]. By combining the penetration-reaction carbonation model [22] with the Monte Carlo method, the influence of wind pressure on carbonation service life can be found.

4. Conclusions

This study presented an analytical technique for predicting the service life of cracked concrete structures under carbonation and climate change.
First, by using a kinetic hydration model, the degree of hydration of cement was calculated. The hydration related properties such as the amount of carbonatable substances and porosity were calculated through the degree of hydration and concrete mixing proportions. The calculated results from the hydration model were used as input parameters for the carbonation model. The carbonation depth for sound concrete was evaluated by considering the concrete material properties and the environmental conditions. By using a difference scheme of carbonation model, the effects of climate change on carbonation such as increased CO2 concentration and environmental temperature were considered.
Second, the influence of cracks on equivalent CO2 diffusivity and carbonation depth was analyzed. With the decrease of water-to-cement ratios and increase of crack width, the ratio of CO2 diffusivity between cracked concrete and sound concrete increased. High strength concrete with a lower water-to-cement ratio is more vulnerable to cracks than low strength concrete with a higher water-to cement ratio. With the increase of water-to-cement ratio and crack width, the carbonation depth of concrete increased.
Third, different climate change scenarios (such as RCP 2.6, RCP 4.5, RCP 8.5 and upper 90% confidence interval of RCP 8.5) and time slices (such as 2000 and 2050) were considered for case studies. By utilizing the Monte Carlo method, the influences of various climate change scenarios on the service life loss of concrete structures were highlighted. For cases involving the RCP 8.5, RCP 4.5 and RCP 2.6 climate change scenarios, concrete structures with a time slice 2000 and a 50-year service life, after considering climate change had their service life reduced by 16%, 14.5% and 11%, respectively. With a time slice in 2000, as the climate change scenario changed from RCP 8.5 to RCP 8.5 upper 90% confidence interval, service life loss slightly increased from 16% to 16.5%. While with a time slice 2050, as the climate change scenario changed from RCP 8.5 to RCP 8.5 upper 90% confidence interval, service life loss slightly increased from 24% to 25%. The service life loss may have more uncertainty in the near future than in the present. In the case of the RCP 8.5 climate change scenario, service life loss increased from 16% to 24% for concrete structures with a 50-year service life when the time slice changed from 2000 to 2050. This showed that with increases in former service life, the reduction ratio regarding former service life also increased after considering climate change. Climate change presented a more significant influence on the service life of more durable concrete.
In addition, the outcome of the current study cannot be generalized for all concrete structures. When the concrete material properties, environmental conditions and crack conditions are different from those shown in the current study, the service life loss may be different.

Acknowledgements

This research was supported by the Basic Science Research Program through the National Research Foundation of Korea (NRF) funded by the Ministry of Science, ICT & Future Planning (No. 2015R1A5A1037548) and a NRF grant (NRF-2017R1C1B1010076).

Conflicts of Interest

The authors declare no conflict of interest.

References

  1. Wang, X.Y.; Lee, H.S. Modeling the hydration of concrete incorporating fly ash or slag. Cem. Concr. Res. 2010, 40, 984–996. [Google Scholar] [CrossRef]
  2. Papadakis, V.G. Effect of supplementary cementing materials on concrete resistance against carbonation and chloride ingress. Cem. Concr. Res. 2000, 30, 291–299. [Google Scholar] [CrossRef]
  3. Ann, K.Y.; Pack, S.W.; Hwang, J.P.; Song, H.W.; Kim, S.H. Service life prediction of a concrete bridge structure subjected to carbonation. Constr. Build. Mater. 2010, 24, 1494–1501. [Google Scholar] [CrossRef]
  4. Marques, P.F.; Costa, A. Service life of RC structures: Carbonation induced corrosion. Prescriptive vs. performance-based methodologies. Constr. Build. Mater. 2010, 24, 258–265. [Google Scholar] [CrossRef]
  5. Song, H.W.; Kwon, S.J.; Byun, K.J.; Park, C.K. Predicting carbonation in early-aged cracked concrete. Cem. Concr. Res. 2006, 36, 979–989. [Google Scholar] [CrossRef]
  6. Tao H,Fu, X.Y.; Jin, N.G. Numerical calculation of crack on concrete carbonation. Concrete 2013, 279, 13–17. [Google Scholar] [CrossRef]
  7. Kwon, S.J.; Na, U.J. Prediction of Durability for RC Columns with Crack and Joint under Carbonation Based on Probabilistic Approach. Int. J. Concr. Struct. Mater. 2011, 5, 11–18. [Google Scholar] [CrossRef]
  8. Gruyaert, E.; den Heede, P.V.; De Belie, N. Carbonation of slag concrete: Effect of the cement replacement level and curing on the carbonation coefficient - Effect of carbonation on the pore structure. Cem. Concr. Compos. 2013, 35, 39–48. [Google Scholar] [CrossRef]
  9. Lee, H.S.; Wang, X.Y. Evaluation of compressive strength development and carbonation depth of high volume slag-blended concrete. Constr. Build. Mater. 2016, 124, 45–54. [Google Scholar] [CrossRef]
  10. Yoon, I.S.; Copuroglu, O.; Park, K.B. Effect of global climatic change on carbonation progress of concrete. Atmos. Environ. 2007, 41, 7274–7285. [Google Scholar] [CrossRef]
  11. Stewart, M.G.; Wang, X.M.; Nguyen, M.N. Climate change impact and risks of concrete infrastructure deterioration. Eng. Struct. 2011, 33, 1326–1337. [Google Scholar] [CrossRef]
  12. Stewart, M.G.; Wang, X.M.; Nguyen, M.N. Climate change adaptation for corrosion control of concrete infrastructure. Struct. Saf. 2012, 35, 29–39. [Google Scholar] [CrossRef]
  13. Talukdar, S.; Banthia, N.; Grace, J. Modelling the effects of structural cracking on carbonation front advance into concrete. Int. J. Struct. Eng. 2015, 6, 73–87. [Google Scholar] [CrossRef]
  14. Talukdar, S.; Banthia, N. Carbonation in Concrete Infrastructure in the Context of Global Climate Change: Model Refinement and Representative Concentration Pathway Scenario Evaluation. J. Mater. Civ. Eng. 2016, 28, 1–7. [Google Scholar] [CrossRef]
  15. Intergovernmental Panel on Climate Change (IPCC). Climate Change 2014 Synthesis Report; IPCC: Geneva, Switzerland, 2014; Available online: http://www.ipcc.ch/report/ar5/syr/ (accessed on 18 March 2018).
  16. Wang, X.; Stewart, M.G.; Nguyen, M. Impact of climate change on corrosion and damage to concrete infrastructure in Australia. Clim. Chang. 2012, 110, 941–957. [Google Scholar] [CrossRef]
  17. Peng, L.; Stewart, M.G. Climate change and corrosion damage risks for reinforced concrete infrastructure in China. Struct. Infrastruct. Eng. 2016, 12, 499–516. [Google Scholar] [CrossRef]
  18. Mao, J.H.; Chen, J.Y.; Cui, L.; Jin, W.L.; Xu, C.; He, Y. Monitoring the Corrosion Process of Reinforced Concrete Using BOTDA and FBG Sensors. Sensors 2015, 15, 8866–8883. [Google Scholar] [CrossRef] [PubMed]
  19. Perry, M.; McAlorum, J.; Fusiek, G.; Niewczas, P.; McKeeman I and Rubert, T. Crack Monitoring of Operational Wind Turbine Foundations. Sensors 2017, 17, 1925–1945. [Google Scholar] [CrossRef] [PubMed]
  20. Younsi, A.; Turcry, P.; Ait-Mokhtar, A.; Staquet, S. Accelerated carbonation of concrete with high content of mineral additions: Effect of interactions between hydration and drying. Cem. Concr. Res. 2013, 43, 25–33. [Google Scholar] [CrossRef]
  21. Demis, S.; Efstathiou, M.P.; Papadakis, V.G. Computer-aided modeling of concrete service life. Cem. Concr. Compos. 2014, 47, 9–18. [Google Scholar] [CrossRef]
  22. Zou, D.J.; Liu, T.J.; Du, C.C.; Teng, J. Influence of Wind Pressure on the Carbonation of Concrete. Materials 2015, 8, 4652–4667. [Google Scholar] [CrossRef] [PubMed]
Figure 1. Flowchart of proposed model. CH: calcium hydroxide; R C H C E : mass of CH from the hydration of 1-unit mass cement; C 0 : cement content; α: degree of cement hydration; CSH: calcium silica hydrate; f S , C : silica weight fraction in cement; ɛ: porosity of concrete; W : water content in concrete; ρ W : density of water; Δ ε C : porosity reduction due to the carbonation of concrete; d x c : increase of carbonation depth in time increment d t ; C R : carbonation rate parameter; Deq: equivalent diffusion coefficient; g ( t ) : durability failure criteria; C V : cover depth of concrete; p f : probability of carbonation durability failure; n ( g ( t ) < 0 ) : number of carbonation durability failures out of a total N trials.
Applsci 08 00572 g001
Figure 2. Hydration related properties of concrete. (a) degree of hydration; (b) CH content; (c) CSH content; (d) porosity of concrete.
Applsci 08 00572 g002
Figure 3. Carbonation depth of sound concrete.
Applsci 08 00572 g003
Figure 4. Ratio of D e q D vs. crack width for different W/C ratios. (a) crack interspace 100 mm; (b) crack interspace 150 mm.
Applsci 08 00572 g004
Figure 5. Carbonation depth of cracked concrete. (a) W/C 0.65; (b) W/C 0.55; (c) W/C 0.45.
Applsci 08 00572 g005
Figure 6. Global averaged CO2 concentration rise. RCP: Representative Concentration Pathways.
Applsci 08 00572 g006
Figure 7. Global averaged temperature rise.
Applsci 08 00572 g007
Figure 8. Probability of corrosion initiation-RCP 8.5, time slice 2000. (a) W/C: 0.65, Cover depth: 25 mm; (b) W/C: 0.65, Cover depth: 35 mm; (c) W/C: 0.45, Cover depth: 25 mm; (d) W/C: 0.45, Cover depth: 35 mm.
Applsci 08 00572 g008
Figure 9. Probability of corrosion initiation-RCP 4.5, time slice 2000. (a) W/C: 0.65, Cover depth: 25 mm; (b) W/C: 0.65, Cover depth: 35 mm; (c) W/C: 0.45, Cover depth: 25 mm; (d) W/C: 0.45, Cover depth: 35 mm.
Applsci 08 00572 g009
Figure 10. Probability of corrosion initiation-RCP 2.6, time slice 2000. (a) W/C: 0.65, Cover depth: 25 mm; (b) W/C: 0.65, Cover depth: 35 mm; (c) W/C: 0.45, Cover depth: 25 mm; (d) W/C: 0.45, Cover depth: 35 mm.
Applsci 08 00572 g010
Figure 11. Probability of corrosion initiation-RCP 8.5 upper 90% confidence interval, time slice 2000. (a) W/C: 0.65, Cover depth: 25 mm; (b) W/C: 0.65, Cover depth: 35 mm; (c) W/C: 0.45, Cover depth: 25 mm; (d) W/C: 0.45, Cover depth: 35 mm.
Applsci 08 00572 g011
Figure 12. Probability of corrosion initiation-RCP 8.5, time slice 2050. (a) W/C: 0.65, Cover depth: 25 mm; (b) W/C: 0.65, Cover depth: 35 mm; (c) W/C: 0.45, Cover depth: 25 mm; (d) W/C: 0.45, Cover depth: 35 mm.
Applsci 08 00572 g012
Figure 13. Probability of corrosion initiation-RCP 8.5 upper 90% confidence interval, time slice 2050. (a) W/C: 0.65, Cover depth: 25 mm; (b) W/C: 0.65, Cover depth: 35 mm; (c) W/C: 0.45, Cover depth: 25 mm; (d) W/C: 0.45, Cover depth: 35 mm.
Applsci 08 00572 g013
Figure 14. Relative service life of cracked concrete-RCP 8.5, time slice 2000.
Applsci 08 00572 g014
Figure 15. Relative service life of cracked concrete-RCP 4.5, time slice 2000.
Applsci 08 00572 g015
Figure 16. Relative service life of cracked concrete-RCP 2.6, time slice 2000.
Applsci 08 00572 g016
Figure 17. Relative service life of cracked concrete-RCP 8.5 upper 90% confidence interval, time slice 2000.
Applsci 08 00572 g017
Figure 18. Relative service life of cracked concrete-RCP 8.5, time slice 2050.
Applsci 08 00572 g018
Figure 19. Relative service life of cracked concrete-RCP 8.5 upper 90% confidence interval, time slice 2050.
Applsci 08 00572 g019
Table 1. Mixing proportions of concrete.
W/CWater (kg/m3)Cement (kg/m3)Sand (kg/m3)Coarse Aggregate (kg/m3)
0.451914246681058
0.551843357621058
0.651822808291041
W/C: water-to-cement ratio
Table 2. Statistical parameters.
ParameterMeanCoefficient of VarianceDistribution
Cover depth25 mm0.2 [3]Normal [11]
35 mm
Carbonation rate parameter C R = 2 [ C O 2 ( t ) ] 0 D e q 0 ( t ) [ CH ] + 3 [ CSH ] 0.15 [3]Normal [11]
CO2 concentration [ C O 2 ( t ) ] COVmax(t) = 0.06 [11]Normal [11]
Temperature25+ Δ T COVmax(t) = 0.06 [11]Normal [11]
Table 3. Summary of analysis cases.
Climate ScenariosTime Slices
RCP 8.52000
RCP 4.52000
RCP 2.62000
RCP 8.5-upper 90% confidence interval2000
RCP 8.52050
RCP 8.5-upper 90% confidence interval2050
Table 4. Service life of cracked concrete-RCP 8.5, time slice 2000.
W/CCover Depth (mm)Crack Width (mm)Service Life (Years)
No Climate ChangeWith Climate ChangeRelative Ratio
0.65250.0516.03315.0670.940
0.155.8665.7150.974
0.253.5303.4710.983
350.0531.20327.8580.893
0.1511.44010.9440.957
0.257.0096.7930.969
0.45250.0543.53537.1840.854
0.1515.07414.2210.943
0.259.1158.7820.963
350.0585.84763.6720.742
0.1529.71326.6640.897
0.2517.98816.8020.934
Table 5. Service life of cracked concrete-RCP 4.5, time slice 2000.
W/CCover Depth (mm)Crack Width (mm)Service Life (Years)
No Climate ChangeWith Climate ChangeRelative Ratio
0.65250.0515.93814.8900.934
0.155.8345.6690.972
0.253.5173.4520.982
350.0531.26527.9810.895
0.1511.45510.8810.950
0.257.0096.7790.967
0.45250.0543.88337.9580.865
0.1515.20414.2580.938
0.259.1958.8180.959
350.0586.27667.7780.786
0.1529.88926.8760.899
0.2518.08616.7930.929
Table 6. Service life of cracked concrete-RCP 2.6, time slice 2000.
W/CCover Depth (mm)Crack Width (mm)Service Life (Years)
No Climate ChangeWith Climate ChangeRelative Ratio
0.65250.0516.04515.3560.957
0.155.8775.7850.984
0.253.5263.4920.990
350.0531.37228.5630.910
0.1511.48111.1680.973
0.257.0336.9230.984
0.45250.0543.73938.7480.886
0.1515.15014.5540.961
0.259.1638.9830.980
350.0585.22871.6840.841
0.1529.57027.0540.915
0.2517.86516.9940.951
Table 7. Service life of cracked concrete-RCP 8.5 upper 90% confidence interval, time slice 2000.
W/CCover Depth (mm)Crack Width (mm)Service Life (Years)
No Climate ChangeWith Climate ChangeRelative Ratio
0.65250.0515.91214.9440.939
0.155.8265.6650.972
0.253.5113.4440.981
350.0531.20327.7320.889
0.1511.44310.8970.952
0.257.0106.7800.967
0.45250.0543.97837.3260.849
0.1515.24414.3270.940
0.259.2238.8560.960
350.0585.57863.0180.736
0.1529.62826.5070.895
0.2517.93316.7150.932
Table 8. Service life of cracked concrete-RCP 8.5, time slice 2050.
W/CCover Depth (mm)Crack Width (mm)Service Life (Years)
No Climate ChangeWith Climate ChangeRelative Ratio
0.65250.0510.96910.2570.935
0.154.0223.9280.977
0.252.3792.3500.988
350.0521.31718.7790.881
0.157.8307.4680.954
0.254.7884.6310.967
0.45250.0530.19225.3860.841
0.1510.4569.7980.937
0.256.2986.0880.967
350.0559.71044.0260.737
0.1520.70918.2640.882
0.2512.51711.5830.925
Table 9. Service life of cracked concrete-RCP 8.5 upper 90% confidence interval, time slice 2050.
W/CCover Depth (mm)Crack Width (mm)Service Life (Years)
No Climate ChangeWith Climate ChangeRelative Ratio
0.65250.0511.09210.3290.931
0.154.0533.9620.978
0.252.3882.3580.987
350.0521.55118.8560.875
0.157.9047.5210.951
0.254.8304.6570.964
0.45250.0530.23925.2830.836
0.1510.4799.8000.935
0.256.3006.0850.966
350.0559.53343.4870.730
0.1520.63318.1240.878
0.2512.48611.5220.923

