Abstract
Considering the potential applications of continuously rotating detonation (CRD) combustors in gas turbines, this paper performed a numerical investigation into the pressure gain performance of CRD combustors, using methane–air as a reactive mixture and under the operating conditions of a micro gas turbine. To analyze the formation process of CRD waves, the variation characteristics of several typical thermodynamic parameters involving thermal efficiency, pressure ratio, and available energy loss were discussed in terms of time and space scales. Numerical results showed that the pressure gain characteristics of the CRD combustors was associated with the corresponding change in Gibbs free energy. Compared to approximate constant pressure-based combustors, usually used in the gas turbines studied, CRD combustors with lower Gibbs free energy loss could offer a significant advantage in terms of pressure ratio. It was found that detonation waves played an important role in increasing pressure ratios but that oblique shock waves caused the loss of extra Gibbs free energy. Due to the changing oblique shock wave height, the effects of CRD combustor axial length on pressure ratios and Gibbs free energy loss were more significant than the effects on detonation wave propagating characteristics and combustion thermal efficiency. When the axial length was changed from 200 mm to 100 mm, the pressure ratio increased by approximately 15.8%.
1. Introduction
Due to obvious advantages in size, weight, and maneuverability, gas turbines play a crucial role in fields such as industry, marine, and aerospace. Nowadays, faced the rising demands for energy conservation and emissions reduction, the development of high-performance gas turbines with low fuel consumption and low pollutant emission is attracting growing attention [1]. Therefore, how to improve the overall thermal cycle performance of gas turbines is a very important challenge for both academia and industry.
Simple cycle-based gas turbines usually follow the classic Brayton cycle theory and their thermal cycle performance directly depends on the thermodynamic processes of components, such as compressors, combustors, and turbines. In general, Brayton cycle-based gas turbines burn fuel in a limited space and steady state combustor at an approximate constant pressure (commonly called an approximate constant pressure combustion process) [2]. Due to complex chemistry reactions, heat transfer, and turbulent flow, this kind of combustion process can generate a large amount of entropy that is usually higher than that of the compressor and turbine. Additionally, because the pressure gain in Brayton cycle-based gas turbines is mainly or only obtained by compressors, which are driven by turbines, the enhancement degree of gas turbine cycle efficiency can be further restrained by the thermodynamic performance of the combustor. In order to break through the bottleneck of constant pressure combustors on the thermal cycle performance of gas turbines, many advanced pressure gain and low entropy generation combustion technologies have been developed in recent decades, including resonant pulse [3], wave rotor [4,5,6,7], shockless explosion [8], and detonation [9].
As a kind of advanced detonation and combustion mode strong coupling of shock waves and chemical reactions, continuously rotating detonation (CRD) combustion has many potential advantages (such as self-pressure gain, fast heat release, low entropy generation, easy operation, and control) in comparison with conventional approximate constant pressure combustion and many other pressure gain combustion types [10]. In recent years, many studies have been published into the potential application values of CRD combustion across various fields. Most of the available results indicate that the rapid development of CRD combustors could provide an effective way to improve the thermal cycle performance of gas turbines. For example, researchers from a U.S. naval research laboratory reported that CRD-based engines had the potential to meet 10% increased power requirements, as well as reduce future fuel use by 25%, which could save approximately 300 to 400 million dollars a year [11]. Gray et al. [12] and Sousa et al. [13] quantitatively evaluated the thermodynamic benefits of gas turbines equipped with CRD combustors versus conventional technology using constant pressure combustion, under different operating conditions. Their analyses consistently demonstrated the significant promise of CRD combustors at relatively low compressor pressure ratios. In past research [14], the present authors investigated the effects of different factors on the performance enhancement of marine gas turbines using CRD combustors. The results also indicated that CRD combustors could significantly improve the thermodynamic performance of marine gas turbines under various conditions. When the compression ratio ranged from 13 to 30, both thermal cycle efficiency and specific power enhancements were about 20~27%.
Over the past decades, various studies have also been carried out to analyze how and why CRD combustors could affect engine performance. Kaemming et al. [15] developed a reduced-order model to study the characteristics of streamline and thermodynamic paths in CRD combustors, which provided a good zero-dimensional tool to analyze the T–S diagram of the CRD cycle. Nordeen et al. [16] modified a one-dimensional detonation thermodynamic cycle by using velocity triangles. Based on the changing rothalpy in the rotating reference, they also described the energy transfer mechanisms of CRD combustors. Zhou et al. [17] and Yao et al. [18], respectively, investigated the flow particle paths of three different combustion processes using two-dimensional and three-dimensional numerical models. Both of their results showed that, unlike the deflagration wave, detonation waves could obviously affect flow particles paths, which is considered an important mechanism for increasing the thermodynamic performance of CRD combustor-based engines. In addition, considering the complex effects of various parameters on CRD combustor performance, Roy et al. [19] carried out an experiment investigation to discuss the flow characteristics and startup performance of a CRD combustor under the operating conditions of preheat and back pressure. As shown in their study, a higher detonation wave number and lower equivalence ratio could be conducive to improve the operating stability and performance of CRD combustors. Yi et al. [20,21] investigated the effects of inlet total pressure, inlet total temperature, and chamber axial length on CRD combustor performance using a one-step hydrogen–oxygen chemical reaction model. They found that inlet total temperature played a more important role than the other two parameters. Fotia et al. [22] experimentally analyzed the pressure gain and distribution characteristics of CDR combustors and found that the pressure gain degree was a function of the equivalence ratio. Recently, Paxson et al. [23,24,25] published a series of studies analyzing the outlet parameters of CRD combustors and their effect on turbines. They found that by increasing the inlet area and decreasing the axial length of a combustor, the pressure gain in the outlet was obvious. On this basis, they defined a ‘highest entropy flow’ region to discuss the thermodynamic processes of combustors.
To the best of our knowledge, although researchers have published many papers investigating the performance of CRD combustors and gas turbines under different operating conditions, very limited research has fully presented detailed analysis of the thermodynamic mechanisms of CRD combustors. The purpose of this paper is to investigate the thermodynamic parameters and pressure gain characteristics of CRD combustors under the operating conditions of a micro gas turbine. By using a two-dimensional numerical simulation, the following three aims will be explored: (1) explaining the pressure gain characteristics of CRD combustors from a thermodynamic perspective; (2) analyzing the changing thermodynamic parameters of the axial cross-section and along the flow paths to further our understanding of the pressure gain and available energy loss in CRD combustors; (3) investigating the effects of CRD combustor axial length on pressure gain and available energy loss.
2. Numerical Model and Methods
2.1. Physical Model and Computational Domain
According to the propagation characteristics of CRD waves in an annular premixed combustor, Figure 1a presents the simple three-dimensional geometry configuration of CRD combustors that were numerically analyzed in this study. The fully premixed methane–air, with an equivalence ratio of one, was directly injected into the annular combustor channel without the complex inlet structures. Additionally, to initiate detonation in the annular combustor channel, a virtual initiator was used to generate the Chapman–Jouquet (CJ) ignition kernel in the right direction. After a CRD wave was formed, it could be self-sustainingly propagated along the direction of the CJ ignition kernel.
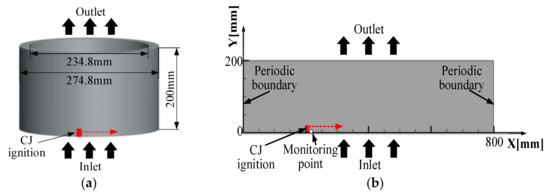
Figure 1.
(a) Three-dimensional geometric model; and (b) Two-dimensional computational domain of CRD combustors. CJ, Chapman–Jouquet.
To study the application of CRD combustors in gas turbines, the basic sizes of CRD combustors were determined according to the performance parameters of a 100 kW micro gas turbine, with an outside diameter of 274.8 mm, inside diameter of 234.8 mm, and axial length of 200 mm. To consider the effects of axial length on CRD combustor performance, including propagation stability, wave characteristics and outlet parameters for the other different axial lengths (175 mm, 150 mm, 125 mm, and 100 mm) were also discussed in this study.
To comprehensively consider the axisymmetric characteristics of CRD combustors and their numerical complexity, the two-dimensional rectangular model shown in Figure 1b was selected as the computational domain in this study and was derived by expanding the three-dimensional CRD combustors along the generatrix, in the circle of the middle diameter. Wu et al. [26] and Tsuboi et al. [27] have verified the effectiveness of this simplified method in the numerical simulation of CRD waves.
2.2. Numerical Method
In this study, the numerical simulations were performed using commercial software, namely ANSYS Fluent (14.0, ANSYS, Pittsburgh, Commonwealth of Pennsylvania, US, 2011). Considering the complex chemistry reaction with detonation and the basic assumptions of compressible ideal gas, the density based Navier–Stokes solver was applied to solve the two-dimensional unstable Euler Equation (1). Viscosity and thermal diffusion were ignored. Many past papers [15,16,17,18,28,29] have verified the applicability of the Euler solution in numerical simulations of detonation waves.
where the dependent variable vector , the convective flux vectors and , and the source vector are respectively defined as:
where is the density of the premixture; is the density of the species ; and is, respectively, velocity in the X and Y direction; is the pressure that can be calculated by the thermal equation of state for a perfect gas; ; is molecular weight; and is the gas constant. Moreover, the total internal energy is defined as,
where the caloric equation of state for the internal energy of the reacting mixture is, .
Since viscosity was ignored in this study, a laminar finite rate model is acceptable for combustion with relatively small turbulence-chemistry interactions (such as detonation) according to the author’s experience. Additionally, the numerical results of Wang [30], Xisto et al. [31], and Liu et al. [32] indicate that a laminar finite rate model can effectively describe many fundamental combustion and detonation phenomena. Therefore, a laminar finite rate model was selected as the chemical reaction model in this study. The production rate of each chemical species, , was calculated by combining the elementary chemical reactions in the kinetic model.
where and , respectively, represent the stoichiometric coefficient of species in forward and backward reactions ; represents the total number of the reactions; represents the total numbers of the species; represents the molar concentration of the species ; and , respectively, represents the forward and backward reaction rate constant for reaction ; and the reaction rate constant is calculated by the following Arrhenius formula.
where , and , respectively, represent the pre-exponential factor, temperature exponent, and activation energy in the reaction .
In addition, to effectively capture the shock and detonation waves, the flux term was dispersed by the advection upstream splitting method (AUSM) [33]. The convective term and time term were, respectively, dispersed in the third-order upwind scheme and using the four-step Runge–Kutta method with second-order accuracy [34]. The simulation time of every numerical case was 9000 μs.
2.3. Boundary Conditions
As presented in Figure 1b, the following boundary conditions were used to solve the above numerical equations:
- Inlet: mass flow inlet boundary. The injection total pressure of 0.3 MPa and total temperature of 430 K were fixed and remained constant in this study. The detailed injection principle and setup of this boundary can be found in [35].
- Outlet: pressure outlet boundary. The back pressure of the outlet was 0.1 MPa.
- Left and right sides: periodic boundary.
- Ignition region: CJ ignition kernel. As mentioned above, an instantaneous CJ ignition kernel was used to initiate detonation in the combustor channel.
3. Independence Test and Model Validation
For the numerical investigation, selection of the appropriate grid size and time step was important to improve numerical efficiency without decreasing accuracy. Table 1 and Table 2, respectively, compare the effects of grid size (ranging from 0.25 mm to 2.0 mm) and time step (ranging from 0.05 μs to 0.4 μs) on the key parameters (propagating period of detonation wave , average outlet total pressure , and average outlet total temperature ) of the CRD combustor. The tables show that the numerical results were independent, with a of 1.0 mm and of 0.2 μs.

Table 1.
Grid size independence validation (time step of 0.2 µs).
Table 2.
Time step independence validation (grid size of 1 mm).
On this basis, to evaluate the calculation accuracy of the present numerical method, Figure 2 qualitatively compared the experimental results of Bykovskii [36], the numerical results of Schwer [37], and the numerical results obtained in this study. The comparisons show that the present numerical results effectively describe the basic characteristics of CRD waves, including complex waves (such as detonation wave A and oblique shock wave B) and typical combustion field composition (such as mixing region C, expansion region D, discontinuity region E between fresh premixture and product [38], blocking region F, and fresh premixture region G) and are in good agreement with the published results. Figure 3 shows variation in static pressure over time, at the monitoring point shown in Figure 1b. It can be seen that when a CJ ignition kernel was initiated at time 0 μs, pressure at the monitoring point increased quickly. After a short time of detonation wave self-adjusting process (about 1000 μs), CRD waves propagated steadily and periodically. Under the stable propagation condition, the propagation period and speed of CRD waves was 448.0 μs and 1785.7 m/s, respectively. According to the CJ theory, the theoretical propagation velocity of detonation waves should be 1808.0 m/s in this working condition. There was only an error of 1.2% between the theory value and the numerical data, which further verifies the validity of the present numerical method.
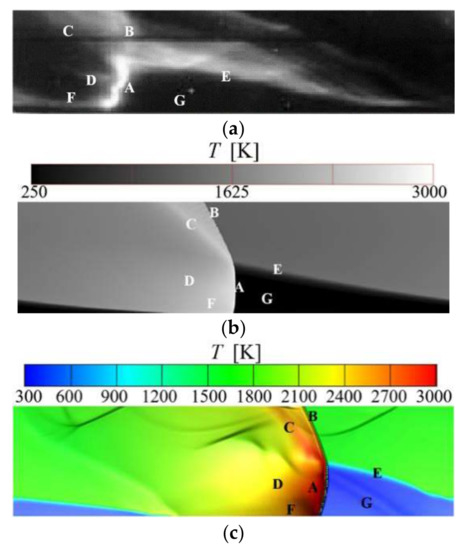
Figure 2.
Comparisons of the results from (a) Bykovskii [36]; (b) Schwer; Reproduced with permission from [37], Elsevier, 2012; and (c) The present study.
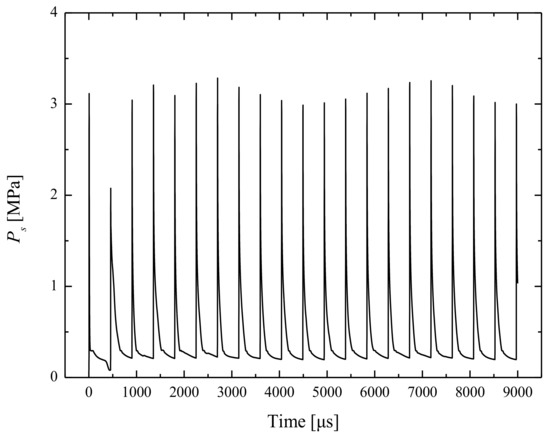
Figure 3.
Variation in static pressure over time at the monitoring point of (215, 1).
4. Results and Discussion
4.1. Formation and Evolution Process of Continuously Rotating Detonation (CRD) Waves
Figure 4 shows the changing characteristics of temperature field shadowgraphs, with time in the computational domain shown in Figure 1b. It can be seen in Figure 4a that when t = 0 μs, a transient CJ detonation wave, with a rightward direction, was triggered in the CRD combustor and then began to propagate throughout the entire region filled with reactive mixtures. Affected by the distribution of reactive mixtures, two sets of flame and pressure fronts were generated in opposite directions. As shown in Figure 4b, the main detonation wave that coupled the leading shock wave and the detonation flame front propagated towards the right. Meanwhile, a weak pressure wave Ⓐ and a deflagration flame front Ⓑ were formed and propagated in the opposite direction to the main detonation wave. Since detonation combustion processes have a high chemical reaction rate, high flame propagation speed, and high pressure, the main detonation wave moved quickly toward the reverse pressure wave Ⓐ and flame front Ⓑ, as depicted in Figure 4c. After this, with the collision and interaction between complex waves, the flow flied and parameters of the combustor were unstable. This can be seen in Figure 4d and Figure 5 (the changing of the average outlet parameters of the CRD combustor). Additionally, the region that was far away from the detonation wave had a lower pressure so part of the fresh premixture could enter the CRD combustor and burn, with the effect of the detonation wave. According to the injection depth of the fresh premixture, the detonation wave was divided into two parts (part I and part II), as shown in Figure 4e. For part I, near the inlet, the detonation wave was in contact with the fresh premixture and continued to propagate forward. However, for part II, the detonation wave degenerated to an oblique shock wave after colliding with the deflagration flame front. With the further development of various waves, the flow field and parameters of the CRD combustor were stable and changed periodically, as presented in Figure 4f and Figure 5.
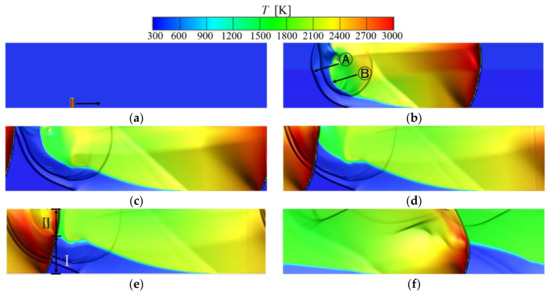
Figure 4.
Temperature shadowgraphs of the CRD wave at different times: (a) t = 0 μs; (b) t = 200 μs; (c) t = 320 μs; (d) t = 370 μs; (e) t = 400 μs; (f) t = 6920 μs.

Figure 5.
Variations of (a) and (b) , with time in the CRD combustor.
4.2. Thermodynamic Parameter Characteristic of CRD Combustors
For modern gas turbines, the combustion thermal efficiency and pressure ratio of combustors are very important indexes for improving the thermal cycle performance. Based on the following equations and the average outlet parameters of the CRD combustor under stable operating conditions (during the three periods shown in Figure 5), it was calculated that the combustion thermal efficiency and pressure ratio of the CRD combustor was 99.715% and 2.0664, respectively. However, for the traditional approximate constant pressure method used in the present gas turbine, the corresponding values were only 99.5% and 0.95%, respectively, using the same inlet parameters. The comparison results indicated that the CRD combustor had a significant advantage in pressure gain compared to the approximate constant pressure combustor.
where and are the average outlet total enthalpy and the average inlet total enthalpy of the CRD combustor; and represent the heat release of fuel.
In an open system of combustion processes, the steady flow energy equation is usually defined as:
For ideal constant pressure or constant volume combustion, it can be simplified to the following, due to the internal work of 0:
where represents the variation of static enthalpy; represents the variation in mechanical energy; represents the internal work; and and represent the outlet total enthalpy and the inlet total enthalpy of the combustor.
According to the above equations, we can see that for the combustors using different combustion processes (including approximate constant pressure, CRD, ideal constant pressure, and ideal constant volume) but the same inlet parameters, there will be little difference in outlet total temperature or combustion thermal efficiency. For gas turbines, combustor performance (potential power of outlet working fluid) is usually directly reflected by the output power of the turbine, which can be calculated using Equations (13) and (14). These equations show that when other parameters are consistent, the average outlet total pressure or the pressure ratio effectively reflects the potential power of the combustors. Figure 6 compares the pressure ratio of combustors using four typical combustion processes under the present numerical condition parameters. As shown in Figure 6, although both the ideal constant volume-based combustor and the CRD-based combustor have similar pressure gain characteristics, the latter obtains a much smaller pressure gain than that of the former.
where represents the output work of turbine; represents the specific heat ratio; represents the gas constant; represents the pressure ratio; represents the turbine efficiency, and represents the outlet total pressure of the turbine.
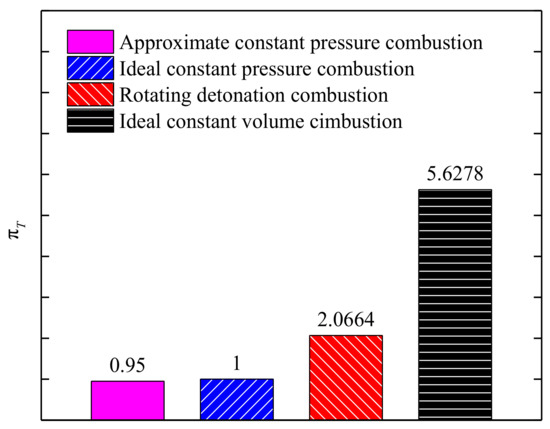
Figure 6.
Pressure ratios using different combustors.
In terms of thermodynamics, entropy generation leads to the loss of available energy, and Gibbs free energy is the available part in the system inner energy decrement. Therefore, Gibbs free energy loss directly affects the potential power of combustors. As mentioned above, the potential power of the different combustors can be effectively reflected by the pressure ratio. This means that Gibbs free energy and the pressure ratio are related. In order to understand the pressure gain characteristics of CRD combustors, Figure 7 compares the entropy generation and Gibbs free energy increment of different combustors. It is clearly shown in Figure 7a that the of the CRD combustor (2080.6 J/kg·K) was higher than that of the ideal constant volume-based combustor (1782.6 J/kg·K). However, compared to the other two types of combustors, the CRD combustor had a low and the decrement was about 10.0%. Additionally, a similar variation in is shown in Figure 7b. With the same inlet parameters, the Gibbs free energy loss of the four combustors, approximate constant pressure combustion, CRD combustion, ideal constant pressure combustion, and ideal constant volume combustion, was 5224.9 kJ/kg, 4668.8 kJ/kg, 5207.4 kJ/kg and 3949.3 kJ/kg, respectively. All of the above results indicated that the pressure gain characteristics were determined by the change in Gibbs free energy. Due to the high pressure gain and low Gibbs free energy loss, the CRD combustor has obvious potential to greatly improve the thermal cycle performance of gas turbines.
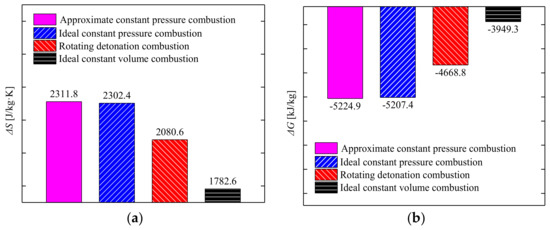
Figure 7.
(a) and (b) using different combustors.
4.3. Parameter Analysis of Flow Path in CRD Combustors
Due to the coupled interaction between the chemistry reaction, detonation wave, shear wave, and oblique shock wave, amongst other factors, understanding the detailed variation and distribution of various thermodynamic parameters in CRD combustors is very complex, which hinders our understand of the pressure gain mechanism of CRD.
Figure 8 shows the variation in pressure (average total pressure and average static pressure ) and temperature (average total temperature and average static temperature ) of the CRD combustor cross-section in the axial direction at t = 6920 μs, which corresponds to the temperature field shadowgraph in Figure 4f. Figure 8 shows that due to the existence of chemical reactions between the range of 0–100 mm, both and increased continuously, to a maximum point of 2419.3 K and 2019.7 K, respectively. Then, the above two parameters remained relatively stable when the combustion ended and the oblique shock appeared. For and , there was an initial increase due to the detonation wave. As the detonation combustion ended, the maximum of was obtained at the axial distance of about 80 mm. Then, in the transition region (combining deflagration, detonation, and shock) between the detonation wave and the oblique shock, began to drop due to the influence of several different states. Since combustion remained in the transition region, there was a distance difference between the maximum pressure and maximum temperature. Combined, the above results and the temperature field shadowgraphs in Figure 4f demonstrate that the height of the detonation wave and oblique shock wave was, respectively, about 80 mm and 100 mm. The transition region between the detonation wave and the oblique shock was about 20 mm. Moreover, Figure 9 shows the variations in and in the axial direction. The inlet parameters were used as baselines in the calculation of and . The results showed that increased somewhat linearly during the distance of 0–100 mm, which meant that dropped rapidly. However, after combustion progress, both variables were continuously produced at a low rate due to the influence of the oblique shock wave.
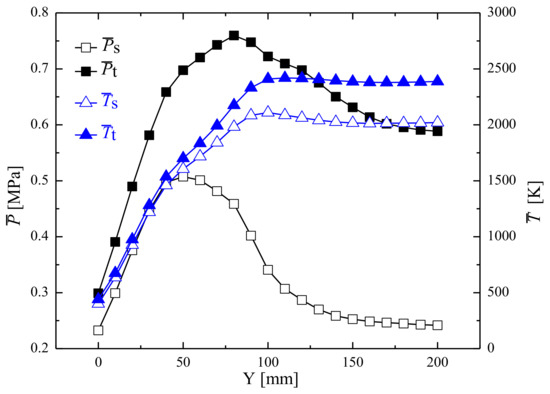
Figure 8.
Pressure and temperature of CRD combustor cross-section in the axial direction.
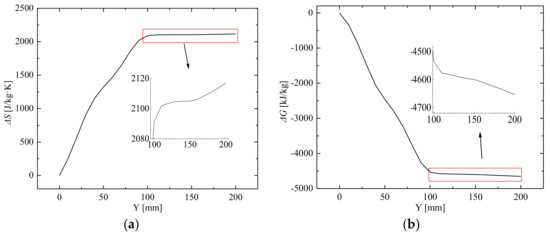
Figure 9.
(a) and (b) of the CRD combustor cross-section in the axial direction.
To further study the variation and distribution of various thermodynamic parameters in CRD combustors, Figure 10 presents temperature and entropy shadowgraphs containing typical streamlines. The streamlines were gained in a rotating coordinate system. When the flow field was stable in the rotating coordinate system, the streamlines coincided with the path lines, so the parameters along the path line can be represented by those along the streamline in the rotating coordinate system. This approach was applied and explained in more detail in [15,16]. As the left and right sides of computational domain were periodic boundaries, one streamline could be divided into two parts with the same streamline number, as shown in Figure 10. In Figure 10a, all the streamlines passed through the detonation wave. Streamline ① reached the outlet when it was about to pass through the oblique shock. Streamline ② passed through the oblique shock wave beside the detonation wave. Streamline ③ passed through the lowest portion of the detonation wave and Streamline ④ passed through the highest portion of the detonation wave in the axial direction. From the inlet direction, the working fluid from region III passed through the detonation wave initially, then through the oblique shock wave. The working fluid from region IV passed through the mixing and deflagration regions. Considering the complexity and non-determinacy of the mixing, there was no further analysis done for this part in this study. From Figure 10b, the following phenomena can be seen. Firstly, the entropy of working fluid increased abruptly after passing through the detonation wave. Secondly, the second entropy generation occurred when the working fluid passed though the oblique shock wave. Thirdly, there was a deflagration area around the discontinuity region between the fresh premixture and product. However, due to the incomplete reaction, the entropy in this region increased slowly. Finally, the mixing region of the detonation product and deflagration product was the highest entropy region.
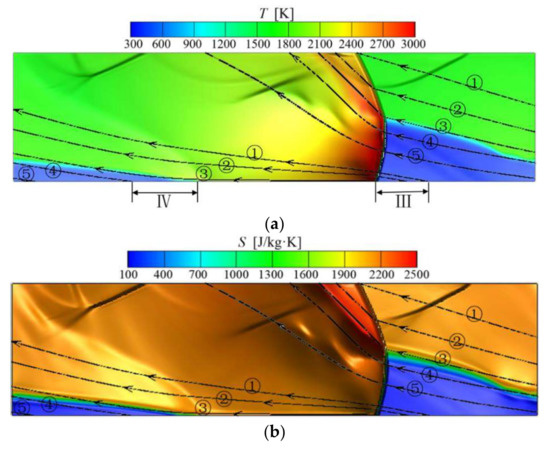
Figure 10.
(a) Temperature and (b) entropy shadowgraphs of the CRD combustor at a time of 6920 μs.
Figure 11 shows the variation in pressure and temperature along the three typical streamlines ①, ②, and ⑤. The results showed that when the working fluid passed through the detonation wave, there was only one jump in pressure and temperature along streamlines ① and ⑤. After that, the values of pressure and temperature decreased abruptly and, finally, were stable. However, along streamline ②, there are two jumps due to the combined effects of the detonation wave and the oblique shock wave. The maximum value of total pressure of the working fluid along streamline ① reached 4.3316 MPa, which was over fourteen times higher than the inlet total pressure. For the working fluid along the other two streamlines, maximum total pressure was only 3.6304 MPa and 2.4374 MPa, respectively. In addition, it was discovered that the maximum total temperature of the working fluid along the three streamlines was very close (potentially over 3000 K), which aligns with the CJ theory.
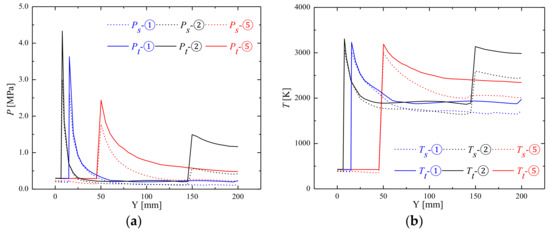
Figure 11.
Variations of (a) pressure and (b) temperature along the three typical streamlines.
Figure 12 also shows variations in along the three typical streamlines outlined above. Because there was little effect on potential power in the circumferential changing of entropy generation, change in entropy generation is only presented in the axial direction. Using the same pressure and temperature analysis as above, there was only one jump in entropy generation along streamline ① and streamline ⑤ and there were two jumps of entropy generation along streamline ②. At the position of the detonation wave, entropy generation was about 2050.0 J/kg·K along the three streamlines. However, at the position of the oblique shock wave, the change in entropy generation was only 187.8 J/kg·K along streamline ②. The major entropy generation roots in the detonation region and the second entropy generation was about 9.2% of that at the position of detonation wave. As the entropy generation of the detonation was smallest in the combustion modes of this study, the major part of entropy generation could not be decreased. Figure 13 shows variations in along the three typical streamlines in the axial direction. There were large losses in Gibbs free energy at the position of the detonation wave and the oblique shock wave. Along streamline ②, Gibbs free energy loss reached 922.8 kJ/kg at the position of oblique shock wave (20.9% of that at the position of detonation wave). Compared to streamline ① and streamline ⑤, there was, respectively, about a 20.9% and 12.9% increase in along streamline ②. This means that the oblique shock wave led to extra available energy loss and had a negative influence on pressure gain characteristics.
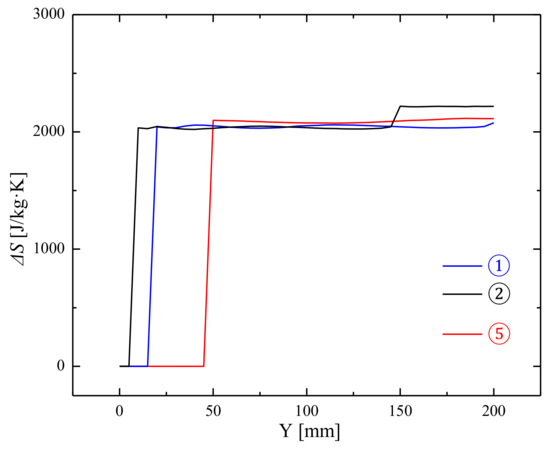
Figure 12.
Variations in along the three typical streamlines in an axial direction.
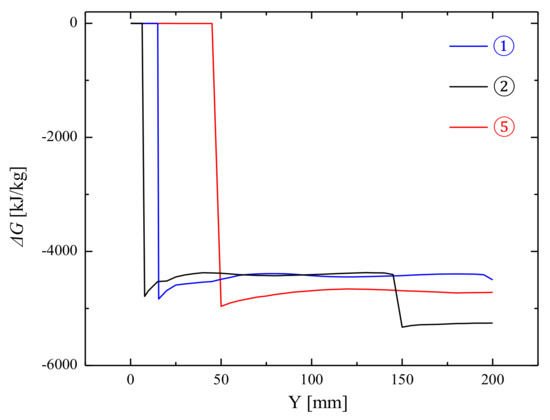
Figure 13.
Variations in increment along the three typical streamlines in an axial direction.
4.4. Effect of CRD Combustor Axial Length on Pressure Gain Performance
As the oblique shock wave moved to the downstream region of the CRD combustor, the axial length of the CRD combustor L had an important influence on the oblique shock wave. This is a crucial factor affecting CRD combustion characteristics, including propagation stability, wave characteristics, and outlet parameters.
Figure 14 and Figure 15, respectively, present detonation wave characteristics and CRD combustor thermodynamic parameters as a function of L. The results in Figure 14 indicate that with constant inlet parameters, and showed no obvious change as L decreased, and had values of 448.0 μs and 1785.7 m/s, respectively. Additionally, it can be seen from Figure 15a that when L decreased from 200 mm to 125 mm, and were approximately 2497.6 K and 99.797%, with only little fluctuation. However, at the L of 100 mm, and decreased to 2491.1K and 99.474%. This was because for the CRD combustor with L of 100 mm, the mixing region for detonation and deflagration was close to the combustor outlet, which can cause this part of the injection fuel to not combust fully due to the limited space. Analyzing the curves in Figure 15b, it can be seen that, unlike the above parameters, both and increased linearly with the decrease in L. One of the most important reasons for this phenomenon was the decrease in oblique shock wave height (as shown in Figure 16). According to the temperature contours and streamline distribution that appeared in Figure 16, we found that for the region , which was the origin width of the streamlines passing the detonation and oblique shock waves, it decreased as L decreased. This further led the inlet mass flow ratio of the working fluids (the inlet mass flow rate of divided by that of the whole combustor) to decrease, as shown in Figure 17. For example, when L changed from 200 mm to 100 mm, the decrement in was about 14%. In addition, it should be mentioned that the different axial lengths had little change on the average mass flux of the CRD combustors, as all were about 4.75 kg/s.
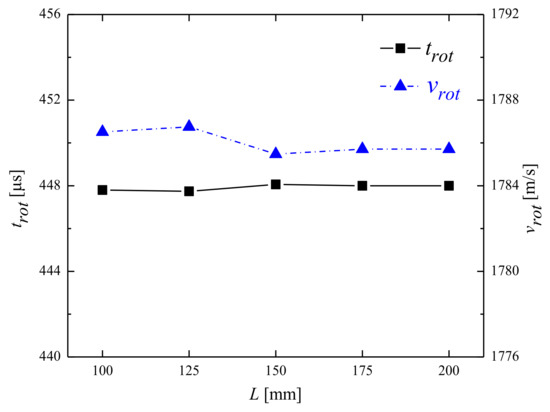
Figure 14.
Variations in and with different axial lengths.
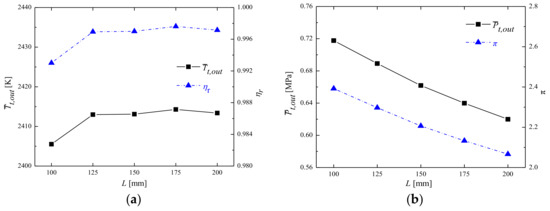
Figure 15.
Variations in (a) , and (b) , with different axial lengths.
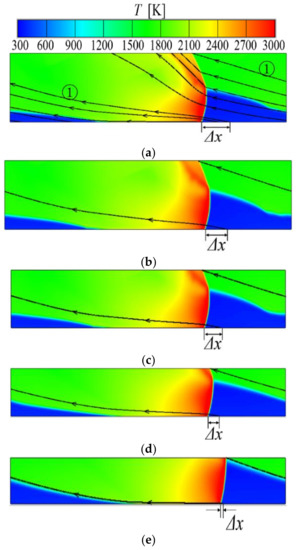
Figure 16.
Temperature contours of CRD combustors with different axial lengths: (a) L = 200 mm; (b) L = 175 mm; (c) L = 150 mm; (d) L = 125 mm; and (e) L = 100 mm at time of 6920 μs.
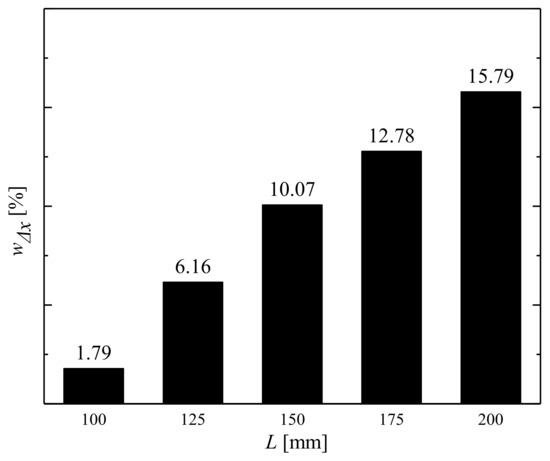
Figure 17.
Variation in with different axial lengths.
On this basis, and were also calculated to analyze the available energy loss of CRD combustors with different L. As shown in Figure 18, due to the decrease in the oblique shock wave height, loss of the CRD combustor decreased. This explains the variation trend in above and demonstrates greater potential with smaller axial lengths.
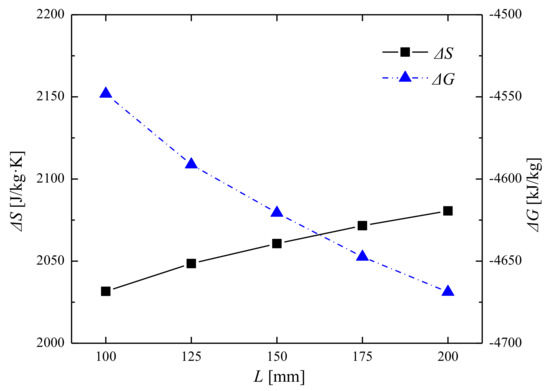
Figure 18.
Variations in and with different axial lengths.
5. Conclusions
In this paper, two-dimensional numerical studies were conducted to investigate the pressure gain characteristics of premixed CRD combustors using a methane–air mixture. The main conclusions are as follows:
- (1)
- From the perspective of potential power, pressure gain characteristics were associated with a change in Gibbs free energy. For the constant inlet parameters, the CRD combustor had a higher pressure ratio and lower Gibbs free energy loss than the approximate constant pressure-based combustor, which is usually used in the gas turbine studied. However, due to the complex effects of detonation waves, oblique shock waves and other factors, the performance of the CRD combustor was inferior to that of the ideal constant volume-based combustor.
- (2)
- With the CRD combustor, the detonation wave was the main factor that significantly increased pressure, temperature, entropy generation, and Gibbs free energy loss. Gibbs free energy loss in the detonation region was similar along different streamlines and the oblique shock led to an extra Gibbs free energy loss of 20.9% along the second streamline.
- (3)
- As the CRD combustor axial length decreased, there was no noticeable change in both the detonation wave propagating characteristics and combustion thermal efficiency. However, due to the effects of oblique shock wave height, the parameters of pressure ratio and Gibbs free energy loss, were affected by combustor axial length. When the axial length of the combustor varied from 200 mm to 100 mm, the above two parameters changed from 2.0664 to 2.3922 and 4668.8 kJ/kg to 4548.2 kJ/kg, respectively.
- (4)
- According to the present numerical results, it was found that the oblique shock waves did not directly disappear at the back of the CRD combustor when the axial length was decreased only. Therefore, how to effectively weaken and even eliminate oblique shock waves is the key to designing a connected structure between a CRD combustor and turbine. This is an important problem that should be urgently remedied if we are to realize the application of CRD combustion in gas turbines.
Acknowledgments
The authors would like to acknowledge the National Nature Science Foundation of China (Grant No. 51709059) and the Province Nature Science Foundation of Heilongjiang (Grant No. QC2017045) for supporting this work. We acknowledge and give thanks for the financial support from the China Scholarship Council (CSC No. 201706685040) to visit Princeton University.
Author Contributions
Hongtao Zheng was responsible for the numerical approach and results analysis. Lei Qi performed the numerical simulation of the CRD combustors. Ningbo Zhao discussed the evolution characteristics of CRD waves and wrote the main parts of paper. Zhiming Li provided the investigation into the thermodynamic parameters of CRD combustors. Xiao Liu did the model validation.
Conflicts of interest
The authors declare no conflict of interest.
Nomenclature
| A | pre-exponential factor |
| E | activation energy |
| e | internal energy |
| G | Gibbs free energy |
| Gibbs free energy increment | |
| Gibbs free energy loss | |
| H | enthalpy |
| average enthalpy | |
| grid size | |
| j | the label of species |
| k | specific heat ratio |
| L | axial length of CRD combustor |
| M | molecular weight |
| average mass flux | |
| Nn | total numbers of the reactions |
| Ns | total numbers of the species |
| P | pressure |
| average pressure | |
| Q | heat release of fuel |
| R | universal gas constant |
| S | entropy |
| entropy generation | |
| T | temperature |
| average temperature | |
| t | time |
| trot | propagating period of detonation wave |
| time step | |
| u | velocity in X direction |
| v | velocity in Y direction |
| vrot | propagation velocity of detonation wave |
| Wi | internal work |
| WT | output work of turbine |
| variation of mechanical energy | |
| inlet mass flow rate of divided that of whole combustor | |
| origin width of the streamlines passing detonation wave and oblique shock wave | |
| Greek letters | |
| temperature exponent | |
| the label of reaction | |
| combustion thermal efficiency | |
| turbine efficiency | |
| reaction rate constant | |
| pressure ratio | |
| expansion ratio | |
| density | |
| stoichiometric coefficient | |
| production rate | |
| molar concentration | |
| Superscripts | |
| ‘ | backward reaction |
| “ | forward reaction |
| Subscripts | |
| in | inlet of combustor |
| out | outlet of combustor |
| out-T | outlet of turbine |
| s | static |
| t | total |
References
- Liu, Y.; Sun, X.; Sethi, V.; Nalianda, D.; Li, Y.G.; Wang, L. Review of modern low emissions combustion technologies for aero gas turbine engines. Prog. Aerosp. Sci. 2017, 94, 12–45. [Google Scholar] [CrossRef]
- Andriani, R.; Ingenito, A.; Agresta, A. Thermal analysis and performance of a pressure gain combustion system. In Proceedings of the 7th European Conference for Aeronautics and Space Sciences (EUCASS), Milan, Italy, 3–6 July 2017. [Google Scholar]
- Lisanti, J.C.; Roberts, W.L. Design of an actively valved and acoustically resonant pulse combustor for pressure-gain combustion applications. In Proceedings of the 54th AIAA Aerospace Sciences Meeting, San Diego, CA, USA, 4–8 January 2016. [Google Scholar]
- Chan, S.; Liu, H. Mass-based design and optimization of wave rotors for gas turbine engine enhancement. Shock Waves 2017, 27, 313–324. [Google Scholar] [CrossRef]
- Akbari, P.; Nalim, R.; Mueller, N. A review of wave rotor technology and its applications. J. Eng. Gas Turbines Power 2006, 128, 717–735. [Google Scholar] [CrossRef]
- Nalim, R.; Li, H.; Akbari, P. Air-standard aerothermodynamic analysis of gas turbine engines with wave rotor combustion. J. Eng. Gas Turbines Power 2009, 131, 445–456. [Google Scholar] [CrossRef]
- Akbari, P.; Nalim, R. Review of recent developments in wave rotor combustion technology. J. Eng. Gas Turbines Power 2009, 25, 833–844. [Google Scholar] [CrossRef]
- Bobusch, B.C.; Berndt, P.; Paschereit, C.O.; Klein, R. Shockless explosion combustion: An innovative way of efficient constant volume combustion in gas turbines. Combust. Sci. Technol. 2014, 186, 1680–1689. [Google Scholar] [CrossRef]
- Lu, F.K.; Braun, E.M. Rotating detonation wave propulsion: Experimental challenges, modeling, and engine concepts. J. Propuls. Power 2011, 30, 1–18. [Google Scholar]
- Wolański, P. Detonative propulsion. Proc. Combust. Inst. 2013, 34, 125–158. [Google Scholar] [CrossRef]
- News Releases 2012. Available online: https://www.nrl.navy.mil/media/news-releases/2012/ (accessed on 10 January 2018).
- Gray, J.; Vinkeloe, J.; Moeck, J.; Paschereit, C.O. Thermodynamic evaluation of pulse detonation combustion for gas turbine power cycles. In Proceedings of the Turbomachinery Technical Conference and Exposition, ASME Turbo Expo, Seoul, Korea, 13–17 June 2016. [Google Scholar]
- Sousa, J.; Paniagua, G.; Morata, E.C. Thermodynamic analysis of a gas turbine engine with a rotating detonation combustor. Appl. Energy 2017, 195, 247–256. [Google Scholar] [CrossRef]
- Zhao, N.B.; Zheng, H.T.; Wen, X.Y.; Zhao, N.B.; Zheng, H.T.; Wen, X.Y.; Xiao, D.M. Thermodynamic performance enhancement of marine gas turbine by using detonation combustion. In Proceedings of the ASME Turbo Expo 2017: Turbomachinery Technical Conference and Exposition, ASME, Oslo, Norway, 11–15 June 2018; GT2018-75493. 2018. [Google Scholar]
- Kaemming, T.; Fotia, M.L.; Hoke, J.; Schauer, F. Thermodynamic modeling of a rotating detonation engine through a reduced-order approach. J. Propuls. Power 2017, 33, 1–9. [Google Scholar] [CrossRef]
- Nordeen, C.; Schwer, D.; Schauer, F.; Hoke, J.; Barber, T.; Cetegen, B. Energy transfer in a rotating detonation engine. In Proceedings of the 47th AIAA/ASME/SAE/ASEE Joint Propulsion Conference & Exhibit, AIAA 2011-6045, San Diego, CA, USA, 31 July–3 August 2011. [Google Scholar]
- Zhou, R.; Wang, J.P. Numerical investigation of flow particle paths and thermodynamic performance of continuously rotating detonation engines. Combust. Flame 2012, 159, 3632–3645. [Google Scholar] [CrossRef]
- Yao, S.; Tang, X.; Wang, J.P.; Shao, Y.; Zhou, R. Three-dimensional numerical study of flow particle paths in rotating detonation engine with a hollow combustor. Combust. Sci. Technol. 2017, 189, 965–979. [Google Scholar] [CrossRef]
- Roy, A.; Ferguson, D.H.; Sidwell, T.; O’Meara, B.; Strakey, P.; Bedick, C.; Sisler, A. Experimental study of rotating detonation combustor performance under preheat and back pressure operation. In Proceedings of the 55th AIAA Aerospace Sciences Meeting, AIAA SciTech Forum, AIAA 2017-1065, Grapevine, TX, USA, 9–13 January 2017. [Google Scholar]
- Yi, T.H.; Lou, J.; Turangan, C. Effect of nozzle shapes on the performance of continuously rotating detonation engine. In Proceedings of the 48th AIAA Aerospace Sciences Meeting Including the New Horizons Forum and Aerospace Exposition, AIAA 2010-152, Orlando, FL, USA, 4–7 January 2010. [Google Scholar]
- Yi, T.-H.; Lou, J.; Turangan, C.; Choi, J.Y.; Wolanski, P. Propulsive performance of a continuously rotating detonation engine. J. Propuls. Power 2011, 27, 171–181. [Google Scholar] [CrossRef]
- Fotia, M.; Kaemming, T.A.; Hoke, J.; Schauer, F. Study of the experimental performance of a rotating detonation engine with nozzled exhaust flow. In Proceedings of the 53rd AIAA Aerospace Sciences Meeting, AIAA 2015-0631, Kissimmee, FL, USA, 5–9 January 2015. [Google Scholar]
- Paxson, D.E. Numerical analysis of a rotating detonation engine in the relative reference frame. In Proceedings of the 52nd Aerospace Sciences Meeting, National Harbor, MD, USA, 13–17 January 2014. [Google Scholar]
- Paxson, D.E.; Fotia, M.; Hoke, J.; Schauer, F. Comparison of numerically simulated and experimentally measured performance of a rotating detonation engine. In Proceedings of the 53rd AIAA Aerospace Sciences Meeting, AIAA 2015-1101, Kissimmee, FL, USA, 5 January 2015. [Google Scholar]
- Paxson, D.E.; Naples, A. Numerical and analytical assessment of a coupled rotating detonation engine and turbine experiment. In Proceedings of the 55th AIAA Aerospace Sciences Meeting, AIAA 2017-1746, Grapevine, TX, USA, 9–13 January 2017. [Google Scholar]
- Wu, D.; Liu, Y.; Liu, Y.S.; Wang, J. Numerical investigations of the restabilization of hydrogen-air rotating detonation engines. Int. J. Hydrogen Energy 2014, 39, 15803–15809. [Google Scholar] [CrossRef]
- Tsuboi, N.; Watanabe, Y.; Kojima, T.; Hayashi, A.K. Numerical estimation of the thrust performance on a rotating detonation engine for a hydrogen–oxygen mixture. Proc. Combust. Inst. 2015, 35, 2005–2013. [Google Scholar] [CrossRef]
- Oran, E.S.; Weber, J.W., Jr.; Stefaniw, E.I.; Lefebvre, M.H.; Anderson, J.D., Jr. A Numerical study of a two-dimensional H2-O2-Ar detonation using a detailed chemical reaction model. Combust. Flame 1998, 113, 147–163. [Google Scholar] [CrossRef]
- Nordeen, C.; Schwer, D.; Schauer, F.; Hoke, J.; Cetegen, B.; Barber, T. Thermodynamic modeling of a rotating detonation engine. In Proceedings of the 49th AIAA Aerospace Sciences Meeting including the New Horizons Forum and Aerospace Exposition, AIAA 2011-803, Orlando, FL, USA, 4–7 January 2011. [Google Scholar]
- Wang, Y.H. Rotating detonation in a combustor of trapezoidal cross section for the hydrogen-air mixture. Int. J. Hydrogen Energy 2016, 41, 5605–5616. [Google Scholar] [CrossRef]
- Xisto, C.; Ali, F.; Petit, O.; Grönstedt, T.; Rolt, A.; Lundbladh, A. Analytical model for the performance estimation of pre-cooled pulse detonation turbofan engines. In Proceedings of the Turbomachinery Technical Conference and Exposition. American Society of Mechanical Engineers, ASME Turbo Expo 2017, Charlotte, NC, USA, 26–30 June 2017. [Google Scholar]
- Liu, L.; Zhang, Q.; Shen, S.; Li, D.; Lian, Z.; Wang, Y. Evaluation of detonation characteristics of aluminum/JP-10/air mixtures at stoichiometric concentrations. Fuel 2016, 169, 41–49. [Google Scholar] [CrossRef]
- Uemura, Y.; Hayashi, A.K.; Asahara, M.; Tsuboi, N.; Yamada, E. Transverse wave generation mechanism in rotating detonation. Proc. Combust. Inst. 2013, 34, 1981–1989. [Google Scholar] [CrossRef]
- Graf, A.P.; Riedel, U. Numerical simulation of supersonic reactive flows using explicit Runge–Kutta methods. In Proceedings of the 38th Aerospace Sciences Meeting and Exhibit, AIAA 2000-0438, Reno, NV, USA, 10–13 January 2000. [Google Scholar]
- Wu, D.; Zhou, R.; Liu, M.; Wang, J. Numerical investigation of the stability of rotating detonation engines. Combust. Sci. Technol. 2014, 186, 1699–1715. [Google Scholar] [CrossRef]
- Bykovskii, F.A.; Vedernikov, E.F. Continuous detonation of a subsonic flow of a propellant. Combust. Explos. Shock Waves 2003, 39, 323–334. [Google Scholar] [CrossRef]
- Schwer, D.; Kailasanath, K. Fluid dynamics of rotating detonation engines with hydrogen and hydrocarbon fuels. Proc. Combust. Inst. 2013, 34, 1991–1998. [Google Scholar] [CrossRef]
- Schwer, D.; Kailasanath, K. Numerical investigation of the physics of rotating-detonation-engines. Proc. Combust. Inst. 2011, 33, 2195–2202. [Google Scholar] [CrossRef]
© 2018 by the authors. Licensee MDPI, Basel, Switzerland. This article is an open access article distributed under the terms and conditions of the Creative Commons Attribution (CC BY) license (http://creativecommons.org/licenses/by/4.0/).