Article

3-D People Counting with a Stereo Camera on GPU Embedded Board

Department of Electrical Engineering, Kwangwoon University, 20 Kwangwoon-ro, Nowon-gu, Seoul 01897, Korea
*
Author to whom correspondence should be addressed.
Appl. Sci. 2018, 8(11), 2017; https://doi.org/10.3390/app8112017
Submission received: 28 September 2018 / Revised: 16 October 2018 / Accepted: 19 October 2018 / Published: 23 October 2018

Abstract

:
People counting in surveillance cameras is a key technology for understanding the flow population and generating heat maps. In recent years, people detection performance has been greatly improved with the development of object detection algorithms using deep learning. However, in places where people are crowded, the detection rate is low as people are often occluded by other people. We proposed a people-counting method using a stereo camera to resolve the non-detection problem due to the occlusion. We applied stereo matching to extract the depth image and convert the camera view to top view using depth information. People were detected using a height map and an occupancy map, and people were tracked and counted using a Kalman filter-based tracker. We operated the proposed method on the NVIDIA Jetson TX2 to check the real-time operation possibility on the embedded board. Experimental results showed that the proposed method had higher accuracy than the existing methods and that real-time processing is possible.

1. Introduction

Surveillance cameras play an important role in the development of industry and security in modern society such as in crime prevention, arresting criminals, and collecting large amounts of data for marketing purposes. The surveillance camera industry is not only growing quantitatively, but is also growing qualitatively such as through increasing camera resolution and shooting distance. In recent years, the intelligent surveillance camera industry has attracted much attention in the product intelligence trend, which is one of the keywords of the fourth industrial revolution. An intelligent surveillance camera not only captures images, but these cameras also include automation technology that allows the camera to determine the identity of a person or the number of people. With the development of intelligent surveillance camera technology, the reliance on human resources for image analysis has been greatly reduced.
People-counting technology is a technique that analyzes images to determine how many people have crossed the counting line [1]. The results of this technology can be used as important data to understand the conversion rate of purchases, analysis of visitors, and the movement of visitors to operate stores and large shopping malls. As long as the history of surveillance cameras is old, there have been various people-counting methods. Zeng [2] used Histogram of Oriented Gradients (HoG) [3] to detect head-shoulder and Principal Component Analysis (PCA) [4] to improve detection performance. Ren [5] detected a person using You Only Look Once—People Counting (YOLO-PC), which extended the original YOLO [6] by using a deep-running approach to obtain more accurate people counting. Noone [7] used two Impulse Radio Ultra-Wideband (IR-UWB) radars to detect a person’s direction of movement. However, since the above methods are designed based on a mono camera, the detection rate is lower when people are occluded by people. The Red-Green-Blue (RGB)-based method is also sensitive to illumination changes and shadows. One way to overcome these challenges is to use depth image. Lin [8] defined human characteristics in a depth image using a single RGB-Depth (RGB-D) camera and then detected a person through supervised learning. Kristoffersen [9] detected a person by using a stereo thermal camera to reconstruct the image in three dimensions.
In this surveillance camera, the depth information could improve the performance when compared to the method using the mono camera by estimating not only the human silhouette information, but also the spatial structure around the camera. However, this method could not be practically operated due to the limitation of the hardware performance of the existing camera platform [10]. Recently, a high-performance embedded board with a Graphics Processing Unit (GPU) has been introduced, and these products have made it possible to substantially utilize algorithms with high computational complexity. Among them, the Jetson TX2 [11], launched by NVIDIA in CA, USA in 2017, was developed to run AI algorithms on embedded boards. This product had a Central Processing Unit (CPU) with a total of six cores, and a GPU with 256 cores was installed, enabling the parallel processing of algorithms using Compute Unified Device Architecture (CUDA).
The surveillance camera is divided into the side view and top view depending on the installation angle. The camera angle of the side view is diagonal and the angle of the top view is vertical. Since the depth image of the top-view is the closest distance between the head and the camera, the pixel corresponding to the head has the lowest value [12]. This feature facilitates people detection, and many people-counting products have been released. On the other hand, the side view cannot detect a person only by the top-view feature because the depth value differs according to the distance between the camera and the object.
In this paper, we proposed a people-counting system using a stereo camera from the side view. First, we installed two IMX 185 [13], launched by Sony in Japan in 2013, in Jetson TX2 to configure a stereo camera. A real-time stereo-matching algorithm should be applied in order to obtain the disparity map in real time. We applied Hernandez [14] to extract the disparity map in real time and used the disparity value to project the side view into the top view. To detect a person, we created an occupancy map, which means a projection ratio in view-projection [15]. We applied the Gaussian distribution to the height map and the occupancy map to generate a likelihood map and detect the person using the local-max filter [15]. The Kalman filter-based tracker [16] was used to track people and determine whether they were counted. The composition of this paper is as follows. Section 2 explains the proposed algorithm and Section 3 verifies the performance of the proposed method through experiments. Finally, Section 4 contains the conclusion.

2. Proposed Method

The schematic concept of this people-counting system is shown in Figure 1. The angle type of the camera was a side view and the angle was between 30 and 60 degrees. The height of the camera was between 3 and 5 m. We used two IMX 185 cameras [13] to construct a stereo camera. The camera was connected to the NVIDIA Jetson TX2 [11] and attached to the ceiling.
The flow chart of the proposed method is shown in Figure 2. The camera calibration process is a step used to acquire the camera parameters of each camera. The camera parameters were used in stereo rectification [17] and view projection. We applied the stereo-matching algorithm [18] to the rectified stereo image to obtain the disparity map and convert it to the depth map. The background subtraction algorithm was applied to the depth map to only extract the moving object. The height map and the occupancy map were obtained by projecting the moving object onto the top view [15]. By using these maps, we generated the likelihood map based on the Gaussian distribution and found the detected head using the local max filter [15]. The detected head was tracked using a Kalman filter-based tracker [16] and determined whether it had passed the counting line. We will describe the main algorithms of our method in this section.

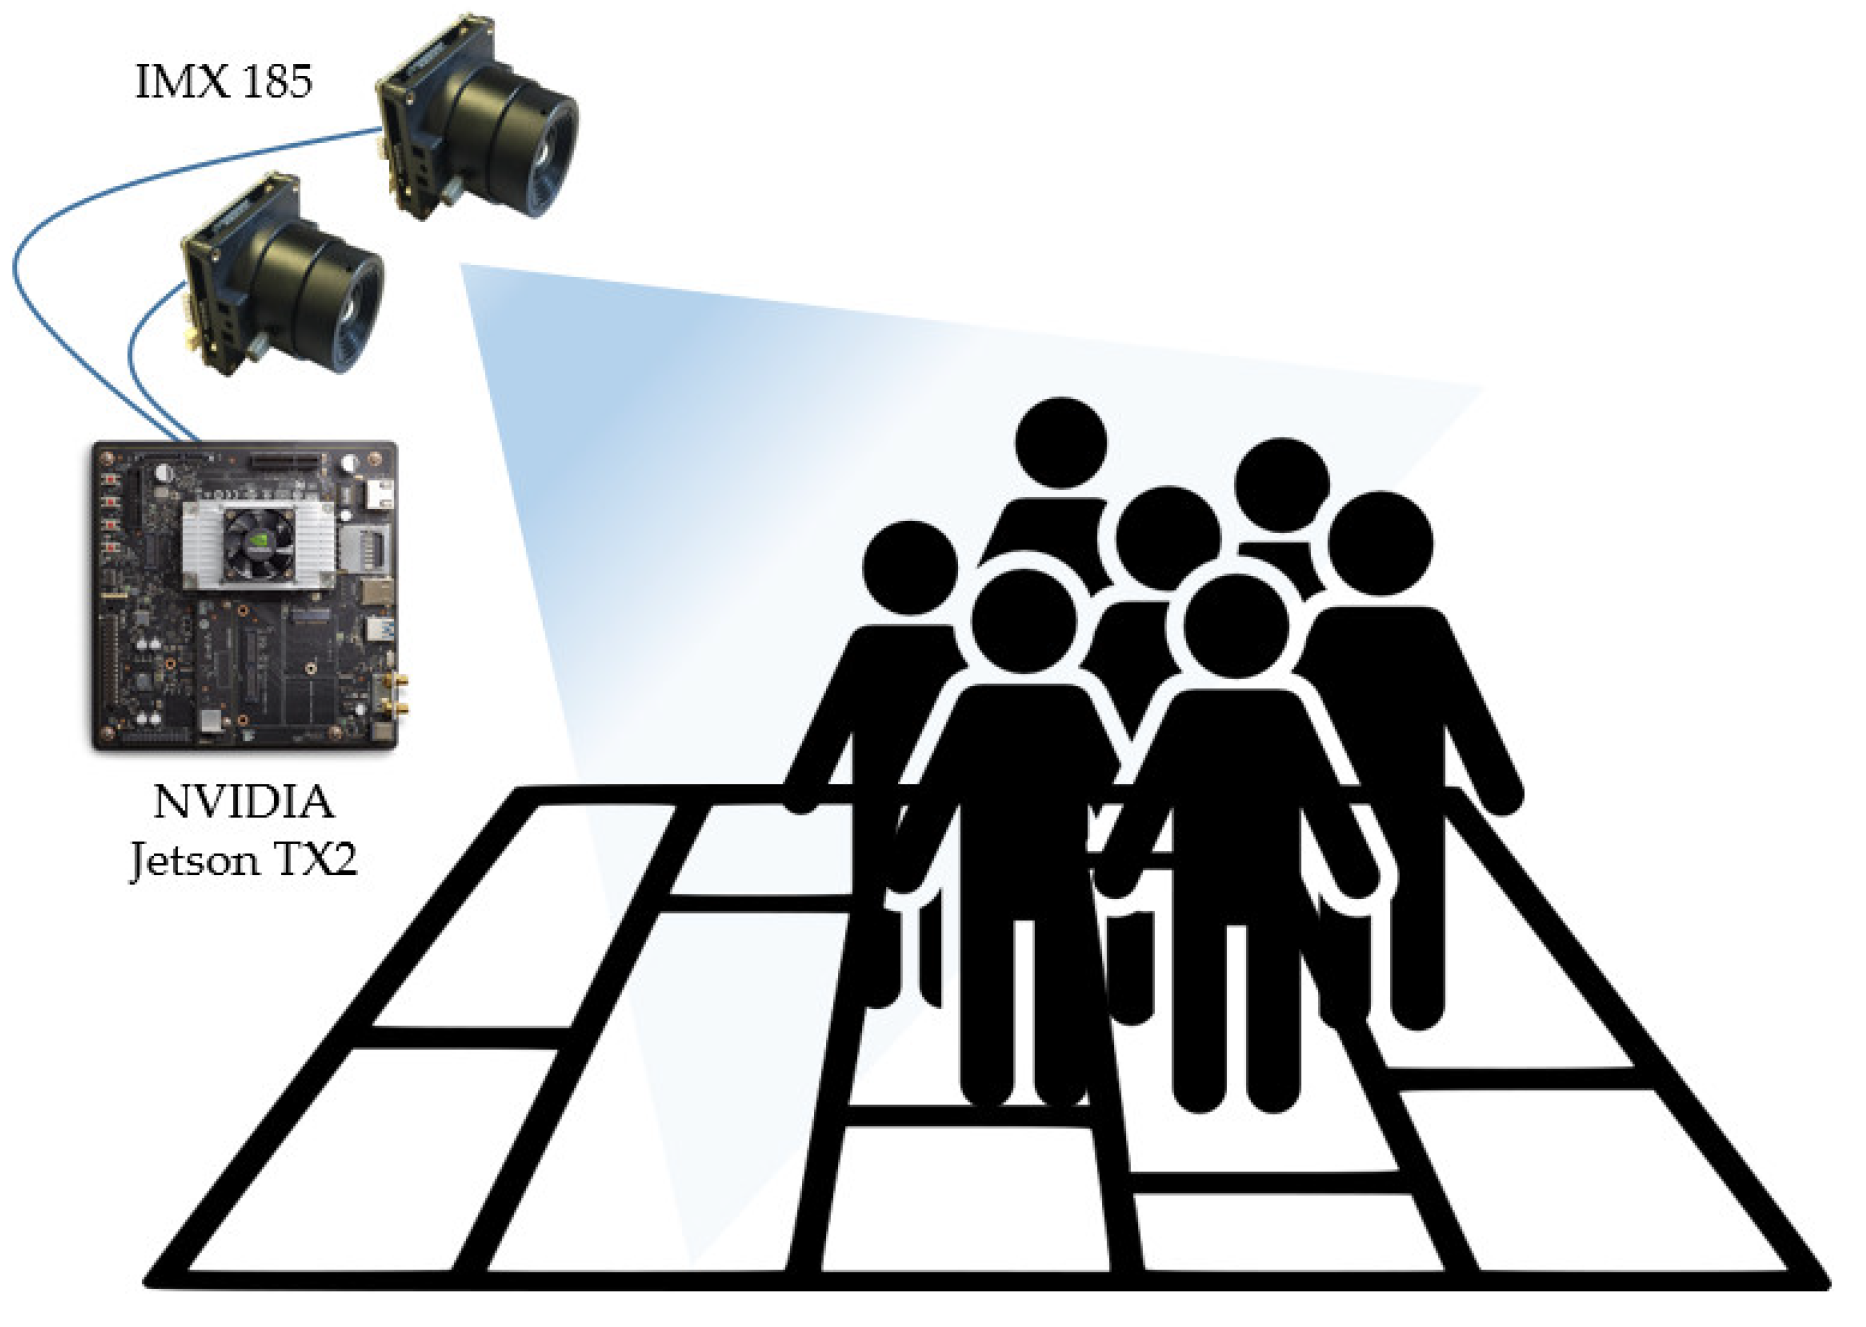
2.1. Stereo Camera Configuration

Two IMX 185 cameras were configured as stereo cameras as shown in Figure 3. When setting the positions of the two cameras, they should be installed as parallel as possible using the stereo rig. In the stereo rectification step, the two images are horizontally aligned; however, if the horizontal state of the two cameras is physically deviated, an error occurs in the stereo rectification.
The distance between the cameras was set according to the maximum distance to recognize the person. In general, the disparity of objects at a long distance can be extracted well because the disparity between the left and right images increases as the distance between the cameras increases. In the proposed method, we confirmed that depth images were extracted up to 10 m from the High Definition (HD) resolution when the distance between the cameras was 20 cm, and the distance was set as the distance between the cameras.
The stereo camera was then connected to the Jetson TX2. To obtain synchronized stereo images from the Jetson TX2, an embedded board connected with an I-PEX cable, launched by Leopard imaging in CA, USA in 2017, should be used. The length of the I-PEX cable [19] was relatively short, about 30 cm, so the Jetson TX2 should be mounted as close as possible to the stereo camera.

2.2. Camera Calibration

The image acquired from the camera is affected by the intrinsic camera parameters and the presence of distortion. The camera’s intrinsic parameters are the focal length and principal point. Generally, in order to perform image processing in a stereo camera system, it is necessary to correct the distortion by using the intrinsic camera parameters. In addition, the horizontal axis of the left and right images should be made the same as the extrinsic camera parameters. To obtain the depth map, stereo matching should be applied. If the horizontal axis of the left and right images are not matched, a disparity map of good quality cannot be obtained. The extrinsic camera parameter is the relationship between the camera coordinates and the world coordinates as a rotation and translation matrix. The process of acquiring camera parameters is called calibration. The calibration proceeds through Equation (1), which describes the pinhole camera model [20]:
s [ x y 1 ] = [ f x 0 u 0 0 f y v 0 0 0 1 ] [ r 1 r 2 r 3 t 1 r 4 r 5 r 6 t 2 r 7 r 8 r 9 t 3 ] [ X Y Z 1 ]
where fx and fy denote the camera focal distances with respect to the x-axis and y-axis, respectively, and u0 and v0 denote the principal points of the camera with respect to the x-axis and the y-axis, respectively. r and t denote the elements of the rotation matrix and the translation matrix, respectively, and are the external parameters of the camera. X, Y, and Z denote points in the world coordinates, and x and y denote points in the image coordinates.
In Equation (1), the pair of coordinates from the image coordinates and the corresponding points of the world coordinates make it possible to acquire the intrinsic camera parameters. To obtain the position of the point for each coordinate system, we used a uniform chess board as shown in Figure 4. The corner point of a chess board is easy to extract because its characteristics are clear. The coordinates of the corner points extracted from the image are image coordinates, and the distance between the actual corner points of the chessboard is the world coordinate. Substituting these pairs of coordinates into Equation (1), an intrinsic parameter can be obtained. We obtain an undistorted image pair by correcting the distorted image using the intrinsic parameters [21].
Stereo matching is a method of obtaining a disparity map by calculating the distances of corresponding points in left and right images. In stereo matching, if the external factors are unified except for the distance between the cameras, that is, if the two images are perfectly horizontal, the problem of finding the corresponding point becomes one-dimensional, such that the corresponding point can be found easier. However, even if two cameras are installed in parallel, there is a slight physical difference. Therefore, it makes the two images parallel via software [22].
Figure 5 shows the result of rectifying the stereo image. Figure 5a shows the left image and right image before. The positions of the corresponding points on the horizontally drawn orange line were different. Figure 5b shows the left and right images after stereo rectification and it can be clearly seen that the positions of corresponding points on the orange line were the same.
After stereo rectification, the counting line was drawn. When a person crosses the counting line, the number in the crossing direction is counted. Mono cameras only have two-dimensional image coordinates. Therefore, whether or not a person actually crosses the counting line spatially cannot be judged. This results in the case where a person who has been judged to have passed though the counting line has not actually passed. This reduces the accuracy of the counting. On the other hand, since the proposed method uses depth information, three-dimensional information about the counting line can be known. In other words, the proposed method produces more accurate counting as it can determine if a person has crossed a counting line in space. Figure 6 shows an example of a counting line. It counts only when a person crosses the counting line in space.

2.3. Disparity Map Extraction Using Stereo Matching

The disparity map was extracted from the rectified stereo image using Hernandez’s method [14], i.e., stereo matching based on Semi-Global Matching (SGM) [23]. This method uses the census transform [24] in the matching cost process to determine the matching block. The census transform is more accurate than block matching using only color information because it determines structurally similar blocks as matching blocks. In the cost aggregation process, optimal path disparity is searched for by combining the path costs for eight directions. Equation (2) shows the calculation of the path cost:
L r ( p , d ) = C ( p , d ) + min [ L r ( p r , d ) L r ( p r , d 1 ) + P 1 L r ( p r , d + 1 ) + P 1 m i n L r ( p r , i ) + P 2   ] m i n L r ( p r , l )
where r is the direction, p is a pixel, d is the disparity, and C is the matching cost. P1 is a penalty when the disparity difference is 1, and P2 is a penalty for the disparity difference is greater than 1.
SGM can acquire disparity with high accuracy and the algorithm structure is suitable for parallel processing. The Hernandez’s method runs in real-time at an HD resolution through CUDA parallel programming. Figure 7b shows the disparity map extracted using Hernandez’s method [24]. The object closer to the camera had a larger disparity, so the brightness of the image became brighter. The disparity map was transformed into a depth map through Equation (3) obtained through a pinhole camera model after stereo rectification [25]:
z = b · f d
where b is the distance between cameras, f is the focal length, d is the disparity, and z is the depth value. Unlike the disparity map, the closer the object to the camera, the darker the image.

2.4. Moving Object Detection

This is difficult to operate in real time because of the large amount of computation if all areas of the depth map are projected onto the top view. Therefore, the moving object is detected and only the area is projected onto the top view. Generally, in a mono camera, a moving object is detected by applying a background subtraction algorithm [26] to a color image. However, since color images are sensitive to illumination, shadows may be detected. On the other hand, when background subtraction is applied to the depth map, the moving object cannot be detected accurately when compared to the color image, but the shadow does not occur [27]. Since the proposed method does not need to detect moving objects in detail, we applied the background subtraction method to the depth map. In the depth map, errors that occur near the boundaries of an object are often detected as moving objects. Additionally, since the disparity value for the non-feature region was not uniform, it may be detected as a moving object when background subtraction is applied. These regions calculate the size and filter out the region above the threshold.
Background subtraction is a common technique, and various methods exist. In the proposed method, we used a Gaussian mixture model [28], which sped up and updated the background. In addition, the size of the input image was downsampled to the Quarter Video Graphics Array (QVGA) resolution level in order to reduce the calculation amount. Figure 8 shows the results of the background subtraction. Noise was detected in addition to moving objects, but only objects were detected through size filtering.

2.5. View Projection

Moving objects are projected onto the top view using depth maps and camera parameters. What is required for the view projection is the rotation and translation matrix of the camera relative to the ground. Before calculating the matrices, the world coordinates corresponding to the image coordinates that correspond to the actual ground are required.
The side view is characterized by the fact that it contains a lot of ground as it is a viewpoint in a diagonal direction. When the image is divided in half in the horizontal direction, the bottom area contains more ground than the top area. Therefore, the center of the ground in the bottom area is defined as the origin of the world coordinate system. Then, the camera coordinates are converted into the camera coordinates through Equation (4):
Z c a m = b · f x d X c a m = Z c a m ( j c x ) f x Y c a m = Z c a m ( i c y ) f y
where Xcam, Ycam, and Zcam denote the x-axis, y-axis, and z-axis of the camera coordinates, respectively. i and j are the image coordinates, b is the distance between the cameras, fx is the focal length, cx and cy are the camera principal points, and d is the disparity. Fifty points excluding the origin were randomly selected from the ground, and the camera coordinates were acquired through Equation (4) for each point. Since the origin and 50 points were on the same ground, the Z-axis value in the world coordinate was zero. The X-axis and Y-axis values of the world coordinates for 50 points are expressed as the distance between the camera coordinates of the origin and the camera coordinates of the 50 points as shown in Equation (5):
Z w o r l d = 0 X w o r l d = X c a m X c a m Y w o r l d = Y c a m Y c a m
where Xworld, Yworld, and Zworld represent the X, Y, and Z values of the world coordinate, respectively. X′cam and Y′cam indicates the camera coordinate value of the origin.
The camera rotation matrix and the translation matrix for the ground were obtained using the image coordinates and world coordinates for the 50 points. The reason for extracting the 50 points randomly is that an incorrect matrix value can be obtained when an inaccurate depth value is referred to in a depth image. It is possible to obtain a matrix with high reliability by referring to a large number of points, but we could obtain good results by referring to about 50 through experiments.
After obtaining the camera rotation matrix and the translation matrix, the world coordinate value is obtained through Equation (6) for the foreground obtained in the background subtraction:
P w = R T ( C T )
where R and T are the camera rotation matrix and translation matrix, respectively, C is the camera coordinate of each point, and Pw is the world coordinate value.
The world coordinate value of the foreground is for the previously set origin. These values were used to construct a height map. The x-axis value of the height map was created using the world coordinate X value of the foreground. In the same way, the y-axis value of the height map was created using the world coordinate Y value of the foreground. The value of each pixel in the height map was the world coordinate Z value of the foreground. The Z-axis value refers to the height of the ground since the origin was set to the ground. Figure 9b shows the generation of the height map using the color and depth images. The more reddish the color in the height map, the higher the height.
The height map is noisy due to errors in the depth value. In addition, since only the height of the object is expressed, additional indicators are needed to detect a person. Thus, an occupancy map expressing how many pixels were projected in the coordinates of the height map was generated using Equation (7) [15]:
O ( x , y ) = Z c a m 2 f 2
where Zcam is the Z-axis value of the camera coordinate system, O is the occupancy map, and f is the focal length. Figure 9c shows the occupancy map. The brighter the color, the more projected the point. This shows that a large number of pixels were mainly projected around the head.
The height map and occupancy map can be used to generate a likelihood map modeled as a Gaussian distribution, as shown in Equation (8) [15]. The likelihood map represents the pixel with the highest probability considering the Gaussian distribution of height and the Gaussian distribution of occupancy. When generating a likelihood map, the average of the Gaussian distribution for height was set to a person’s average height of 160 cm, and the standard deviation was set to 40 cm. In a likelihood map, a pixel with a corresponding height and deviation has a high probability value. The average and variance of the Gaussian distribution for the occupancy were set to 2500 and 100, respectively, which were the optimal values through experiments.
L ( x , y ) = exp ( ( ( O ( x , y ) μ o ) 2 2 σ o 2 + ( H ( x , y ) μ h ) 2 2 σ h 2 ) ) 2 π σ o σ h
where O and H are the occupancy map and height map, respectively, μ is the mean, and σ is the standard deviation. Figure 9d shows the likelihood map. It shows the head with the highest value and that the farther away from the head, the more the value decreases. The likelihood map is scanned in a rectangular unit of a certain size, and the head was detected when the center value of the rectangle was the local maximum value. Figure 9e shows the results of the head detection.

2.6. Object Tracking and People Counting

The person detected in the top view was tracked using the object tracker. The object tracker also has a long history where various algorithms exist. The proposed method required a tracker with low computational complexity because it was intended to be driven by the Jetson TX2, which is an embedded board. In addition, because of the characteristic of the top view, only the head was displayed, so a tracker using color information cannot be used. Therefore, we tracked the detected head by applying the Kalman tracker [16] and satisfying the above two conditions. Since the Kalman tracker uses only positional information without using color information, the amount of computation is smaller than that of other tracking algorithms.
In order to count a person, it is necessary to define the relationship between the counting line and the trajectory of the object. In the proposed method, the direction of the object was calculated when the trajectory of the object and the counting line intersected. Figure 10 shows two cases where the trajectory of the object crossed the counting line. Figure 10a shows the direction in which the object’s last position and the counting line draw was clockwise. Figure 10b shows the counterclockwise direction in the same way. We used this method to calculate which direction the object crossed the counting line and increased the count for that direction.
Figure 11 shows the User Interface (UI) of the proposed people counting system. After projecting the side view onto the top view, the head was detected and tracked to determine whether to count it or not.

3. Experimental Results

The stereo camera used in the experiment was a LI-JETSON-KIT-IMX185CS-D [29] released by Leopard imaging. It consisted of two IMX 185 image sensors from Sony and an adapter board for synchronizing the cameras. The IMX 185 and its board are connected by a 30 cm long I-PEX cable [19]. The board is only available in the Jetson TX series and could be connected to the camera input of the Jetson TX2 [11] to acquire real-time synchronized stereo images. Table 1 shows the specifications of the IMX 185 sensor.
To measure the people-counting performance of the proposed method, the camera was installed in a place with a lot of floating population. The experimental sequence was in HD resolution, consisting of 23 videos in five minutes. The counting line was set on a major route that passed a lot of people, as shown in Figure 6. Updating the counting number every time a person crossed the counting line caused the counting number to increase abnormally, for example, a person hanging around near a counting line. Therefore, we set a benchmark to count the first time a person crossed a counting line and created a ground truth.
Table 2 shows the counting accuracy of the proposed method. Up can be seen in Figure 10 as when a person crossed up over the counting line and down was when a person crossed down the counting line. The accuracy is measured using Equation (9):
| U p G T U p m | + | D o w n G T D o w n m | U p G T + D o w n G T
where GT means ground truth and m means the value measured in the proposed method.
More than 95% accuracy was measured in most of the experimental sequences, and the overall accuracy was measured as 98.95%. In the second experimental sequence, a very low accuracy of 28.57% was measured. In this sequence, a person held a large load and hung around near the counting line. Since the proposed method detects a person using the height of the object, the load was detected as a person, which was the cause of the resulting low accuracy.
Table 3 shows the results of a comparison between the proposed method and the deep learning-based methods. The experiments were performed on the experimental sequences used in Table 2. For each method, the accuracy of the measured values against the up and down ground truths of the entire sequence was obtained through Equation (3). GoogleNet-Single Shot Detector (SSD) and MobileNet-SSD were trained with GoogleNet [30] and MobileNet [31], respectively, and then used SSD [32] to detect people. The detected objects were tracked and counted using a Kernelized Correlation Filter (KCF) tracker. The KCF tracker is more accurate than the Kalman tracker as it uses the correlation information of the detected object. Since methods using deep learning detect objects in the side view, using a KCF tracker [33] can obtain a higher accuracy. Nevertheless, the experimental results showed that the average counting accuracy of the two techniques was 79.6%, while the accuracy of the proposed technique was 98.9%. The two techniques using deep learning had the problem that the tracker could not track the object to the end when occlusion occurred. On the other hand, the proposed technique solved the occlusion problem by projecting the side view onto the top view. The reason for the poor performance of the proposed method in VGA resolution was that the lower the resolution, the more the stereo matching could not express the long distance.
Table 4 shows the Frame Per Second (FPS) and resource occupancy per resolution of the proposed method on the NVIDIA Jetson TX2. The QVGA and VGA resolutions were operated only on the CPU due to the small amount of computation. Since HD and FHD resolution have a large amount of computation, it cannot be operated in real time by using the CPU alone. Therefore, we used CUDA, a parallel processing program using a GPU. GPU occupancy was measured using the tegrastats application provided by the Jetson TX2. The experimental results showed that the QVGA and VGA resolutions were 15.4 FPS and 9.6 FPS, respectively. In general, in the field of surveillance cameras, the fact that an algorithm operates in real time means that it operates above 10 FPS. Therefore, the proposed method worked in real time in the QVGA, VGA, and HD resolutions. On the other hand, the FHD resolution worked at 5.4 FPS even though GPU was used. The portion that occupied most of the computation amount was stereo matching. In general, however, most applications did not require stereo matching at FHD resolution. In the QVGA and VGA resolutions, the CPU occupied about 25% and the HD and FHD resolutions took up about 20%. The proposed method did not require a high occupancy, so there were enough resources to port other applications in the future.

4. Conclusions

In this paper, we proposed a people-counting method using a stereo camera in a NVIDIA Jetson TX2. The people-counting method using a mono camera is problematic as the counting accuracy is low given that detection is not performed due to occlusion. In the proposed method, two IMX 185 cameras were used to acquire 3-D information. The problem of non-detection due to occlusion was solved by projecting the side-view onto the top-view using this three-dimensional information. The detected person was tracked using the Kalman filter-based tracker to determine whether the person crossed the counting line. Compared with other methods, the proposed method showed a higher counting accuracy. Furthermore, it showed that the proposed method could operate real-time processing with rapid measurements. In the future, we will study ways to exclude user input at the initial stage by automatically estimating the ground. In addition, we will increase the number of counting lines to four to consider various directions.

Author Contributions

Conceptualization, G.-c.L. and J.Y.; Methodology, G.-c.L.; Software, G.-c.L. and S.-h.L.; Validation, G.-c.L.; Formal Analysis, G.-c.L.; Investigation, G.-c.L. and S.-h.L.; Resources, J.Y.; Data Curation, G.-c.L.; Writing—Original Draft Preparation, G.-c.L.; Writing—Review & Editing, G.-c.L.; Visualization, G.-c.L.; Supervision, J.Y.; Project Administration, J.Y.

Funding

This research received no external funding.

Conflicts of Interest

The authors declare no conflict of interest.

References

  1. Liu, X.; Tu, P.H.; Rittscher, J.; Perera, A.; Krahnstoever, N. Detecting and counting people in surveillance applications. In Proceedings of the IEEE Conference on Advanced Video and Signal Based Surveillance 2005 (AVSS 2005), Como, Italy, 15–16 September 2005. [Google Scholar]
  2. Zeng, C.; Ma, H. Robust head-shoulder detection by pca-based multilevel hog-lbp detector for people counting. In Proceedings of the 2010 20th International Conference on Pattern Recognition (ICPR 2010), Istanbul, Turkey, 23–26 August 2010. [Google Scholar]
  3. Dalal, N.; Triggs, B. Histograms of oriented gradients for human detection. In Proceedings of the 2005 IEEE Computer Society Conference on Computer Vision and Pattern Recognition (CVPR 2005), San Diego, CA, USA, 20–25 June 2005. [Google Scholar]
  4. Jolliffe, I. Principal component analysis. In International Encyclopedia of Statistical Science; Springer: Berlin/Heidelberg, Germany, 2011. [Google Scholar]
  5. Ren, P.; Fang, W.; Djahel, S. A novel YOLO-Based real-time people counting approach. In Proceedings of the 2017 International Smart Cities Conference (ISC2 2017), Wuxi, China, 14–17 September 2017. [Google Scholar]
  6. Redmon, J.; Divvala, S.; Girshick, R. You only look once: Unified, real-time object detection. In Proceedings of the 2016 IEEE Conference on Computer Vision and Pattern Recognition (CVPR 2016), Las Vegas, NV, USA, 27–30 June 2016. [Google Scholar]
  7. Noone, D.R.; Bergman, A.S.; Lynch, R.K. Method and System for People Counting Using Passive Infrared Detectors. U.S. Patent No. 9,183,686, 10 November 2015. [Google Scholar]
  8. Liu, J.; Liu, Y.; Zhang, G.; Zhu, P.; Chen, Y.Q. Detecting and tracking people in real time with RGB-D camera. Pattern Recognit. Lett. 2015, 53, 16–23. [Google Scholar] [CrossRef]
  9. Kristoffersen, M.S.; Dueholm, J.V.; Gade, R.; Moeslund, T.B. Pedestrian counting with occlusion handling using stereo thermal cameras. Sensors 2016, 16, 62. [Google Scholar] [CrossRef] [PubMed]
  10. Nalpantidis, L.; Sirakoulis, G.C.; Gasteratos, A. Review of stereo matching algorithms for 3D vision. In Proceedings of the 16th International Symposium on Measurement and Control in Robotics, Warsaw, Poland, 21–23 June 2007. [Google Scholar]
  11. Jetson TX2 Module. Available online: https://developer.nvidia.com/embedded/buy/jetson-tx2 (accessed on 7 September 2018).
  12. Zhang, X.; Yan, J.; Feng, S.; Lei, Z.; Yi, D. Water filling: Unsupervised people counting via vertical kinect sensor. In Proceedings of the 2012 IEEE Ninth International Conference on Advanced Video and Signal-Based Surveillance (AVSS 2012), Beijing, China, 18–21 September 2012. [Google Scholar]
  13. LI-IMX185-MIPI-M12. Available online: https://www.mouser.com/ProductDetail/Leopard-Imaging/LI-IMX185-MIPI-M12?qs=AQlKX63v8Rv6fHaveNakhw==&gclid=CjwKCAjw2rjcBRBuEiwAheKeLxB1YNpcw85c-47urgTP1Vyi1rv8OaUU-UpCNeK7DrzPtb1KqK9dnBoCw_IQAvD_BwE (accessed on 7 September 2018).
  14. Hernandez-Juarez, D.; Chacón, A.; Espinosa, A.; Vázquez, D. Embedded real-time stereo estimation via semi-global matching on the GPU. Procedia Comput. Sci. 2016, 80, 143–153. [Google Scholar] [CrossRef]
  15. Harville, M. Stereo person tracking with adaptive plan-view templates of height and occupancy statistics. Image Vis. Comput. 2004, 22, 127–142. [Google Scholar] [CrossRef]
  16. Comaniciu, D.; Ramesh, V.; Meer, P. Kernel-based object tracking. IEEE Trans. Pattern Anal. Mach. Intell. 2003, 25, 564–577. [Google Scholar] [CrossRef] [Green Version]
  17. Su, H.; He, B. A simple rectification method of stereo image pairs with calibrated cameras. In Proceedings of the 2010 2nd International Conference on Information Engineering and Computer Science (ICIECS 2010), Wuhan, China, 25–26 December 2010. [Google Scholar]
  18. Sun, J.; Li, Y.; Kang, S.B.; Shum, H.Y. Symmetric stereo matching for occlusion handling. In Proceedings of the 2005 IEEE Computer Society Conference on Computer Vision and Pattern Recognition (CVPR 2005), San Diego, CA, USA, 20–25 June 2005. [Google Scholar]
  19. PEX Connectors. Available online: https://www.i-pex.com/ (accessed on 7 September 2018).
  20. Martins, H.A.; Birk, J.R.; Kelley, R.B. Camera models based on data from two calibration planes. Comput. Graph. Image Process. 1981, 17, 173–180. [Google Scholar] [CrossRef]
  21. Alghoniemy, M.; Tewfik, A.H. Geometric distortion correction through image normalization. In Proceedings of the 2000 IEEE International Conference on Multimedia and Expo (ICME 2000), New York, NY, USA, 30 July–2 August 2000. [Google Scholar]
  22. Abraham, S.; Förstner, W. Fish-eye-stereo calibration and epipolar rectification. ISPRS J. Photogramm. Remote Sens. 2005, 59, 278–288. [Google Scholar] [CrossRef]
  23. Hirschmuller, H. Accurate and efficient stereo processing by semi-global matching and mutual information. In Proceedings of the 2005 IEEE Computer Society Conference on Computer Vision and Pattern Recognition (CVPR 2005), San Diego, CA, USA, 20–25 June 2005. [Google Scholar]
  24. Zabih, R.; Woodfill, J. Non-parametric local transforms for computing visual correspondence. In Proceedings of the European Conference on Computer Vision, Stockholm, Sweden, 2–6 May 1994. [Google Scholar]
  25. Kuhl, A. Comparison of Stereo Matching Algorithms for Mobile Robots; Centre for Intelligent Information Processing System, The University of Western Australia: Crawley, Australia, 2005; pp. 4–24. [Google Scholar]
  26. Piccardi, M. Background subtraction techniques: A review. In Proceedings of the Systems, Man and Cybernetics 2004, Hague, The Netherlands, 10–13 October 2004. [Google Scholar]
  27. Fernandez-Sanchez, E.J.; Diaz, J.; Ros, E. Background subtraction based on color and depth using active sensors. Sensors 2013, 13, 8895–8915. [Google Scholar] [CrossRef] [PubMed]
  28. Zivkovic, Z. Improved adaptive Gaussian mixture model for background subtraction. In Proceedings of the 17th International Conference on Pattern Recognition (ICPR 2004), Cambridge, UK, 26 August 2004. [Google Scholar]
  29. LI-JETSON-KIT-IMX185-X. Available online: https://leopardimaging.com/product/li-jetson-kit-imx185-x/ (accessed on 7 September 2018).
  30. Zhong, Z.; Jin, L.; Xie, Z. High performance offline handwritten chinese character recognition using googlenet and directional feature maps. In Proceedings of the International Conference on Document Analysis and Recognition (ICDAR 2015), Nancy, France, 23–26 August 2015. [Google Scholar]
  31. Howard, A.G.; Zhu, M.; Chen, B.; Kalenichenko, D. Mobilenets: Efficient convolutional neural networks for mobile vision applications. arXiv, 2017; arXiv:1704.04861. [Google Scholar]
  32. Liu, W.; Anguelov, D.; Erhan, D.; Szegedy, C. SSD: Single shot multibox detector. In Proceedings of the 14th European Conference on Computer Vision (ECCV 2016), Amsterdam, The Netherlands, 8–16 October 2016. [Google Scholar]
  33. Henriques, J.F.; Caseiro, R.; Martins, P. High-speed tracking with kernelized correlation filters. IEEE Trans. Pattern Anal. Mach. Intell. 2015, 37, 583–596. [Google Scholar] [CrossRef] [PubMed]
Figure 1. The schematic concept of the proposed method.
Applsci 08 02017 g001
Figure 2. Flowchart of the proposed method.
Applsci 08 02017 g002
Figure 3. Stereo camera configuration of the proposed method.
Applsci 08 02017 g003
Figure 4. Feature point extraction using a chess board.
Applsci 08 02017 g004
Figure 5. Stereo rectification.
Applsci 08 02017 g005
Figure 6. Example of counting line.
Applsci 08 02017 g006
Figure 7. Depth map extraction: (a) color image, and (b) disparity map.
Applsci 08 02017 g007
Figure 8. Background subtraction result: (a) depth map, and (b) background subtraction result.
Applsci 08 02017 g008
Figure 9. Top-view projection results: (a) color image; (b) height map; (c) occupancy map; (d) likelihood map; and (e) detection result.
Applsci 08 02017 g009
Figure 10. Two cases where the trajectory of the object and the counting line intersect: (a) Case 1; and (b) Case 2.
Applsci 08 02017 g010
Figure 11. Proposed people counting system: (a) color image; and (b) top view of (a).
Applsci 08 02017 g011
Table 1. IMX 185 specification.
SensorSony Diagonal 8.58 mm Type 1/1.9 Complementary Metal Oxide Semiconductor (CMOS) Image Sensor IMX185LQJ
ResolutionMaximum 1937 × 1217
Pixel Size3.75 μm × 3.75 μm
ColorColor sensor
InterfaceMobile Industry Processor Interface (MIPI) output
Module Size38 mm × 38 mm
Weight56 g
Table 2. People counting accuracy of the proposed method.
SequenceGround TruthProposed MethodAccuracy
UpDownUpDown
Video1912121380.95
Video25915928.57
Video381171194.74
Video41440133996.30
Video551361394.44
Video68221020100.00
Video726925997.14
Video82123202295.45
Video914151415100.00
Video1016101610100.00
Video1129627694.29
Video122811241189.74
Video132219251895.12
Video142115211497.22
Video15634488.89
Video16413413100.00
Video171115111496.15
Video1814712790.48
Video1991181195.00
Video2073092997.30
Video211615151390.32
Video2251551695.00
Video231425122697.44
Sum31234931534398.95%
Total661658
Table 3. Performance comparison for counting accuracy.
ModelsMono CameraStereo Camera
GoogleNet–SSDMobileNet–SSDOurs (VGA)Ours (HD)Ours (FHD)
Accuracy76.2%83.0%95.59%98.95%98.55%
Table 4. FPS and resource occupancy per resolution of the proposed method.
ModeResolutionSide-View
FPSOccupancy (%)
CPUQVGA (320 × 240)15.421
VGA (640 × 480)9.627
GPUHD (1280 × 720)12.5 GPU: 63
CPU: 18
FHD (1920 × 1080)5.4GPU: 65
CPU: 19

