3.1. Spectra Information
The relationship information between the raw NIR spectra and the mixed soy content classes is shown in
Figure 1. The wavelength used here ranged from 400 to 2500 nm for dispersive NIR (
Figure 1a) and 1000 to 2500 nm for FT-NIR (
Figure 1b).
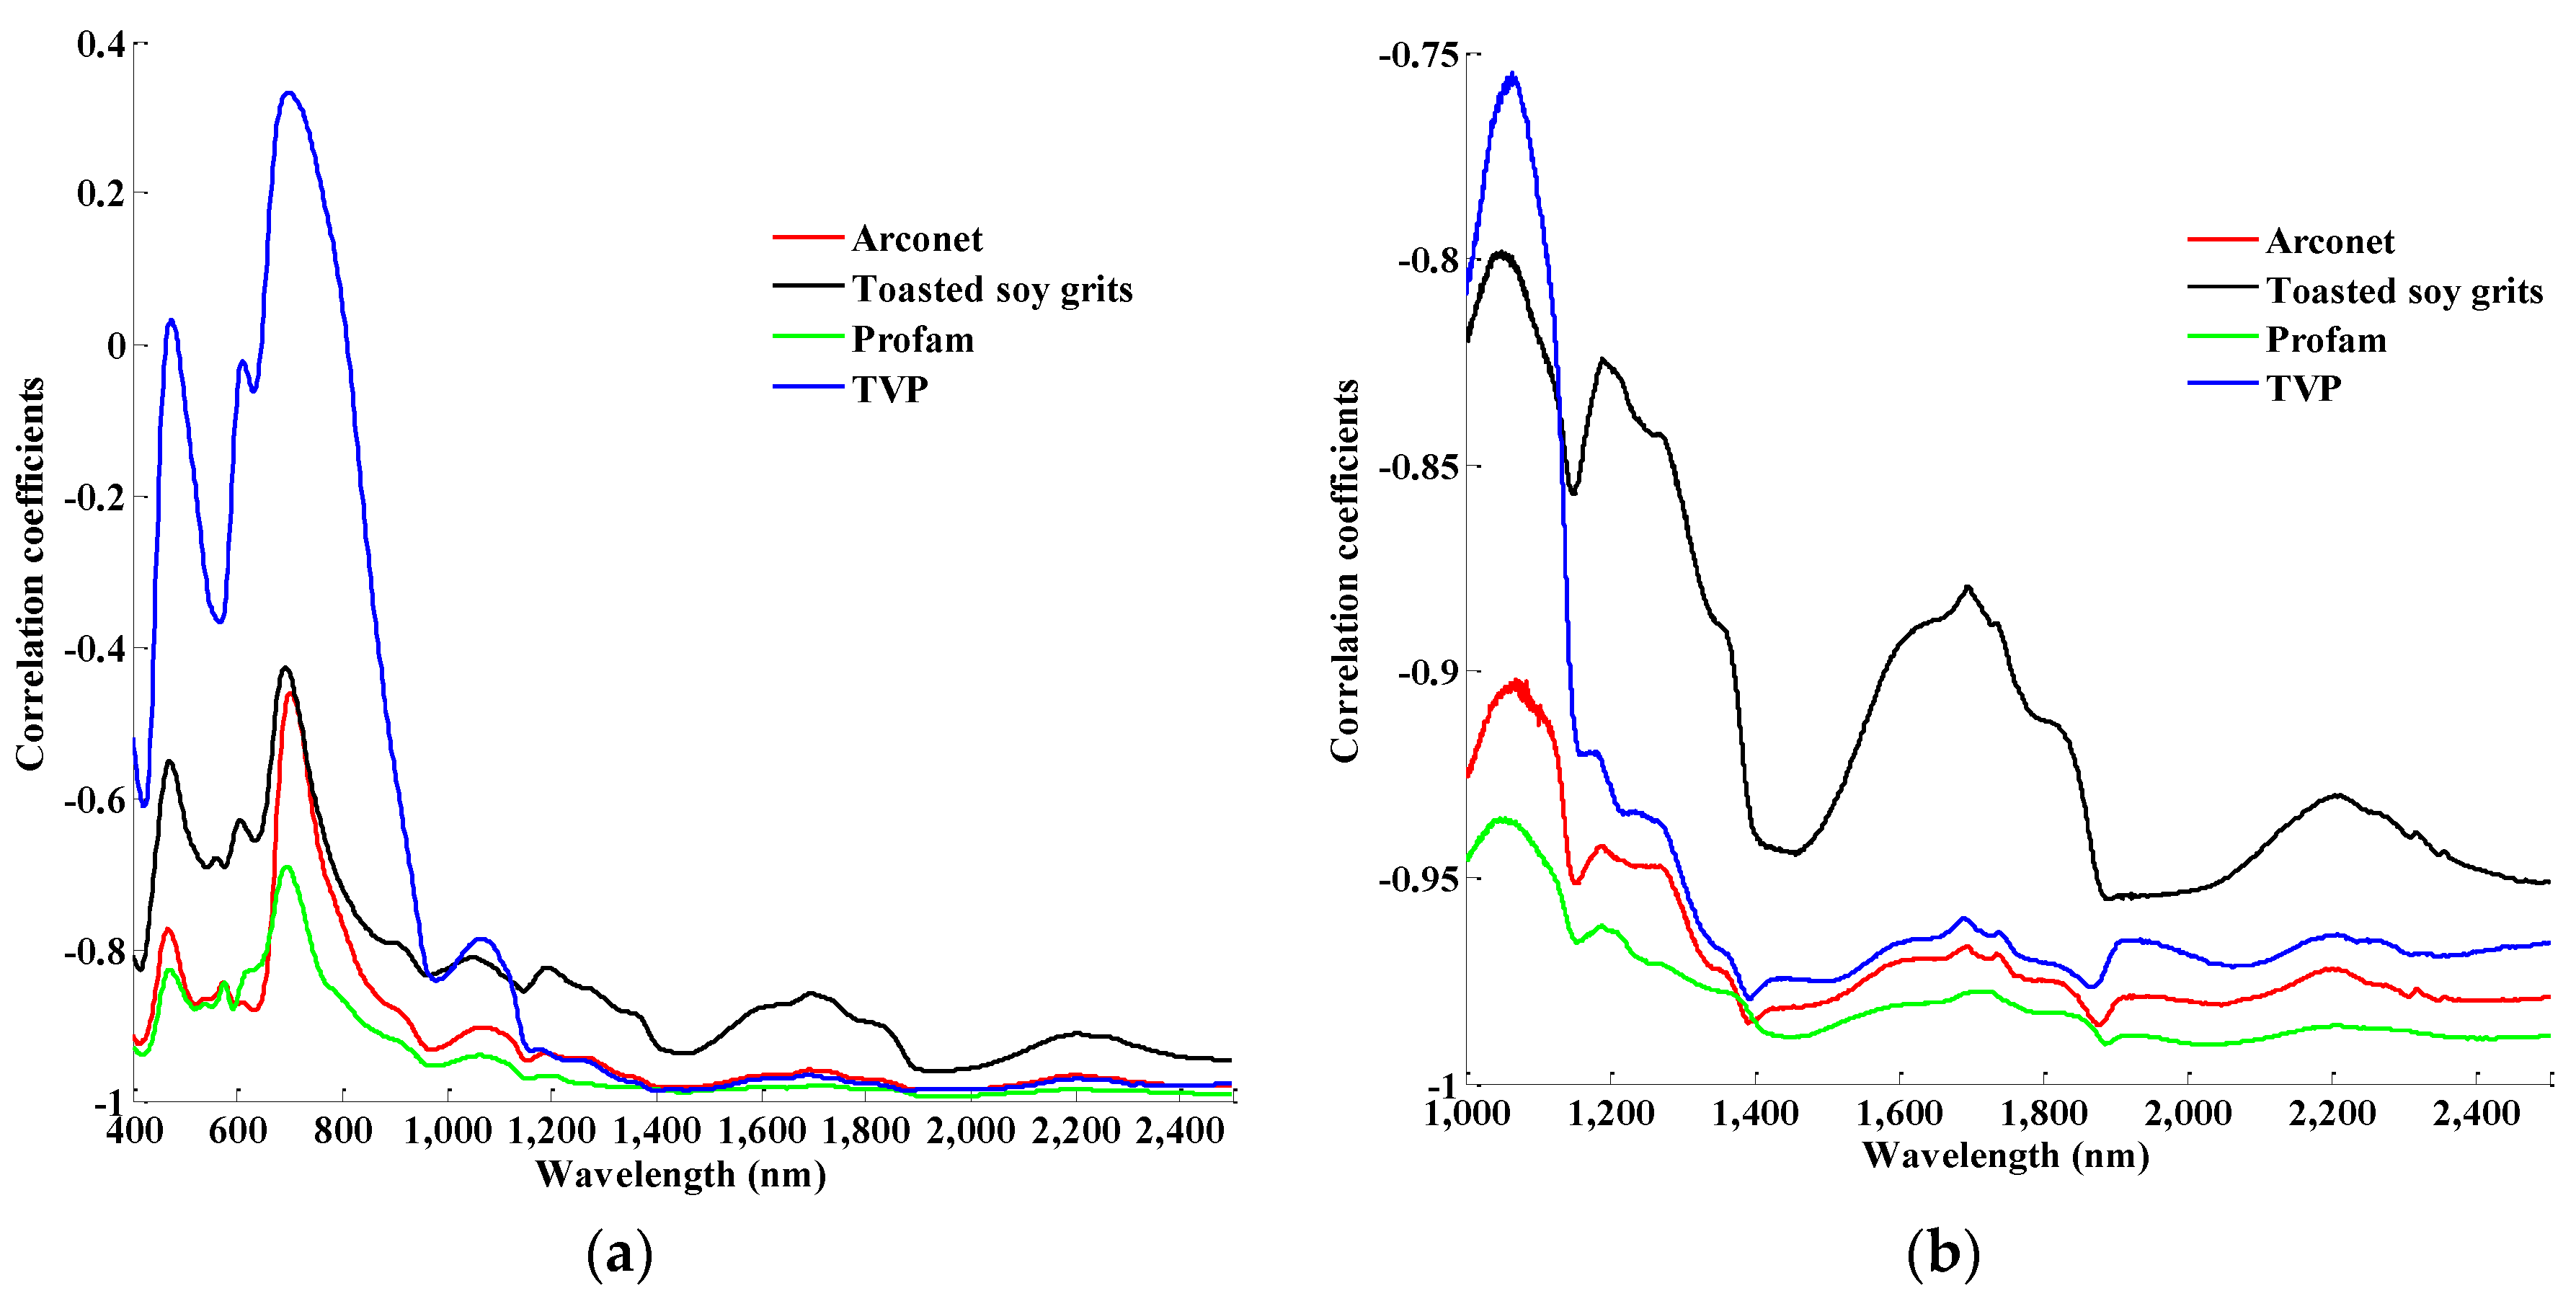
As for
Figure 1a, the curve patterns resembled each other for the four types of soy protein in the full waveband. However, in the section of the visible and part of the shortwave infrared wavelengths (400–1000 nm), the correlation coefficients showed a poor relationship compared to the rest of the wavebands regardless of soy type. This indicates that spectra between 400 and 1000 nm were less suitable for the prediction of soy contents by dispersive NIR methods. In the majority of the curves, the correlation was negative with a high absolute value (above 0.8) in the region of 1000–2500 nm, indicating that these spectra might provide a better prediction of soy contents. Overall, toasted soy grits showed a generally lower correlation than the other three soy protein types in this region, suggesting that the ability for determining contents quantitatively for toasted soy grits was slightly worse. In the case of Vis/NIR applications, the use of a set of optimal wavelengths that contains the most relevant information is desired [
9]. Thus, in this study, a data set of 1000–2500 nm for dispersive NIR spectra was chosen for quantitative analysis. Interestingly enough, the selected spectra were conducive to the same range measured with the FT-NIR method.
Figure 1b shows the correlogram between the spectra measured with the FT-NIR instrument and the contents of soy products in the mixtures. The spectral data revealed an obvious relationship with the mixed level by showing a high coefficient of correlation (|
r| > 0.75). Among the four soy products, toasted soy grits again showed the lowest correlation and greatest fluctuation overall. This is similar to the results shown in
Figure 1a. In the region of 1000 to 1200 nm, TVP also displayed a slightly poor relationship (|
r| < 0.8) compared with the other types. A similar pattern was also noticed in the same region for dispersive NIR spectra (
Figure 1a). Through comparison, it indicates that both NIR methods would provide similar predictions in general.
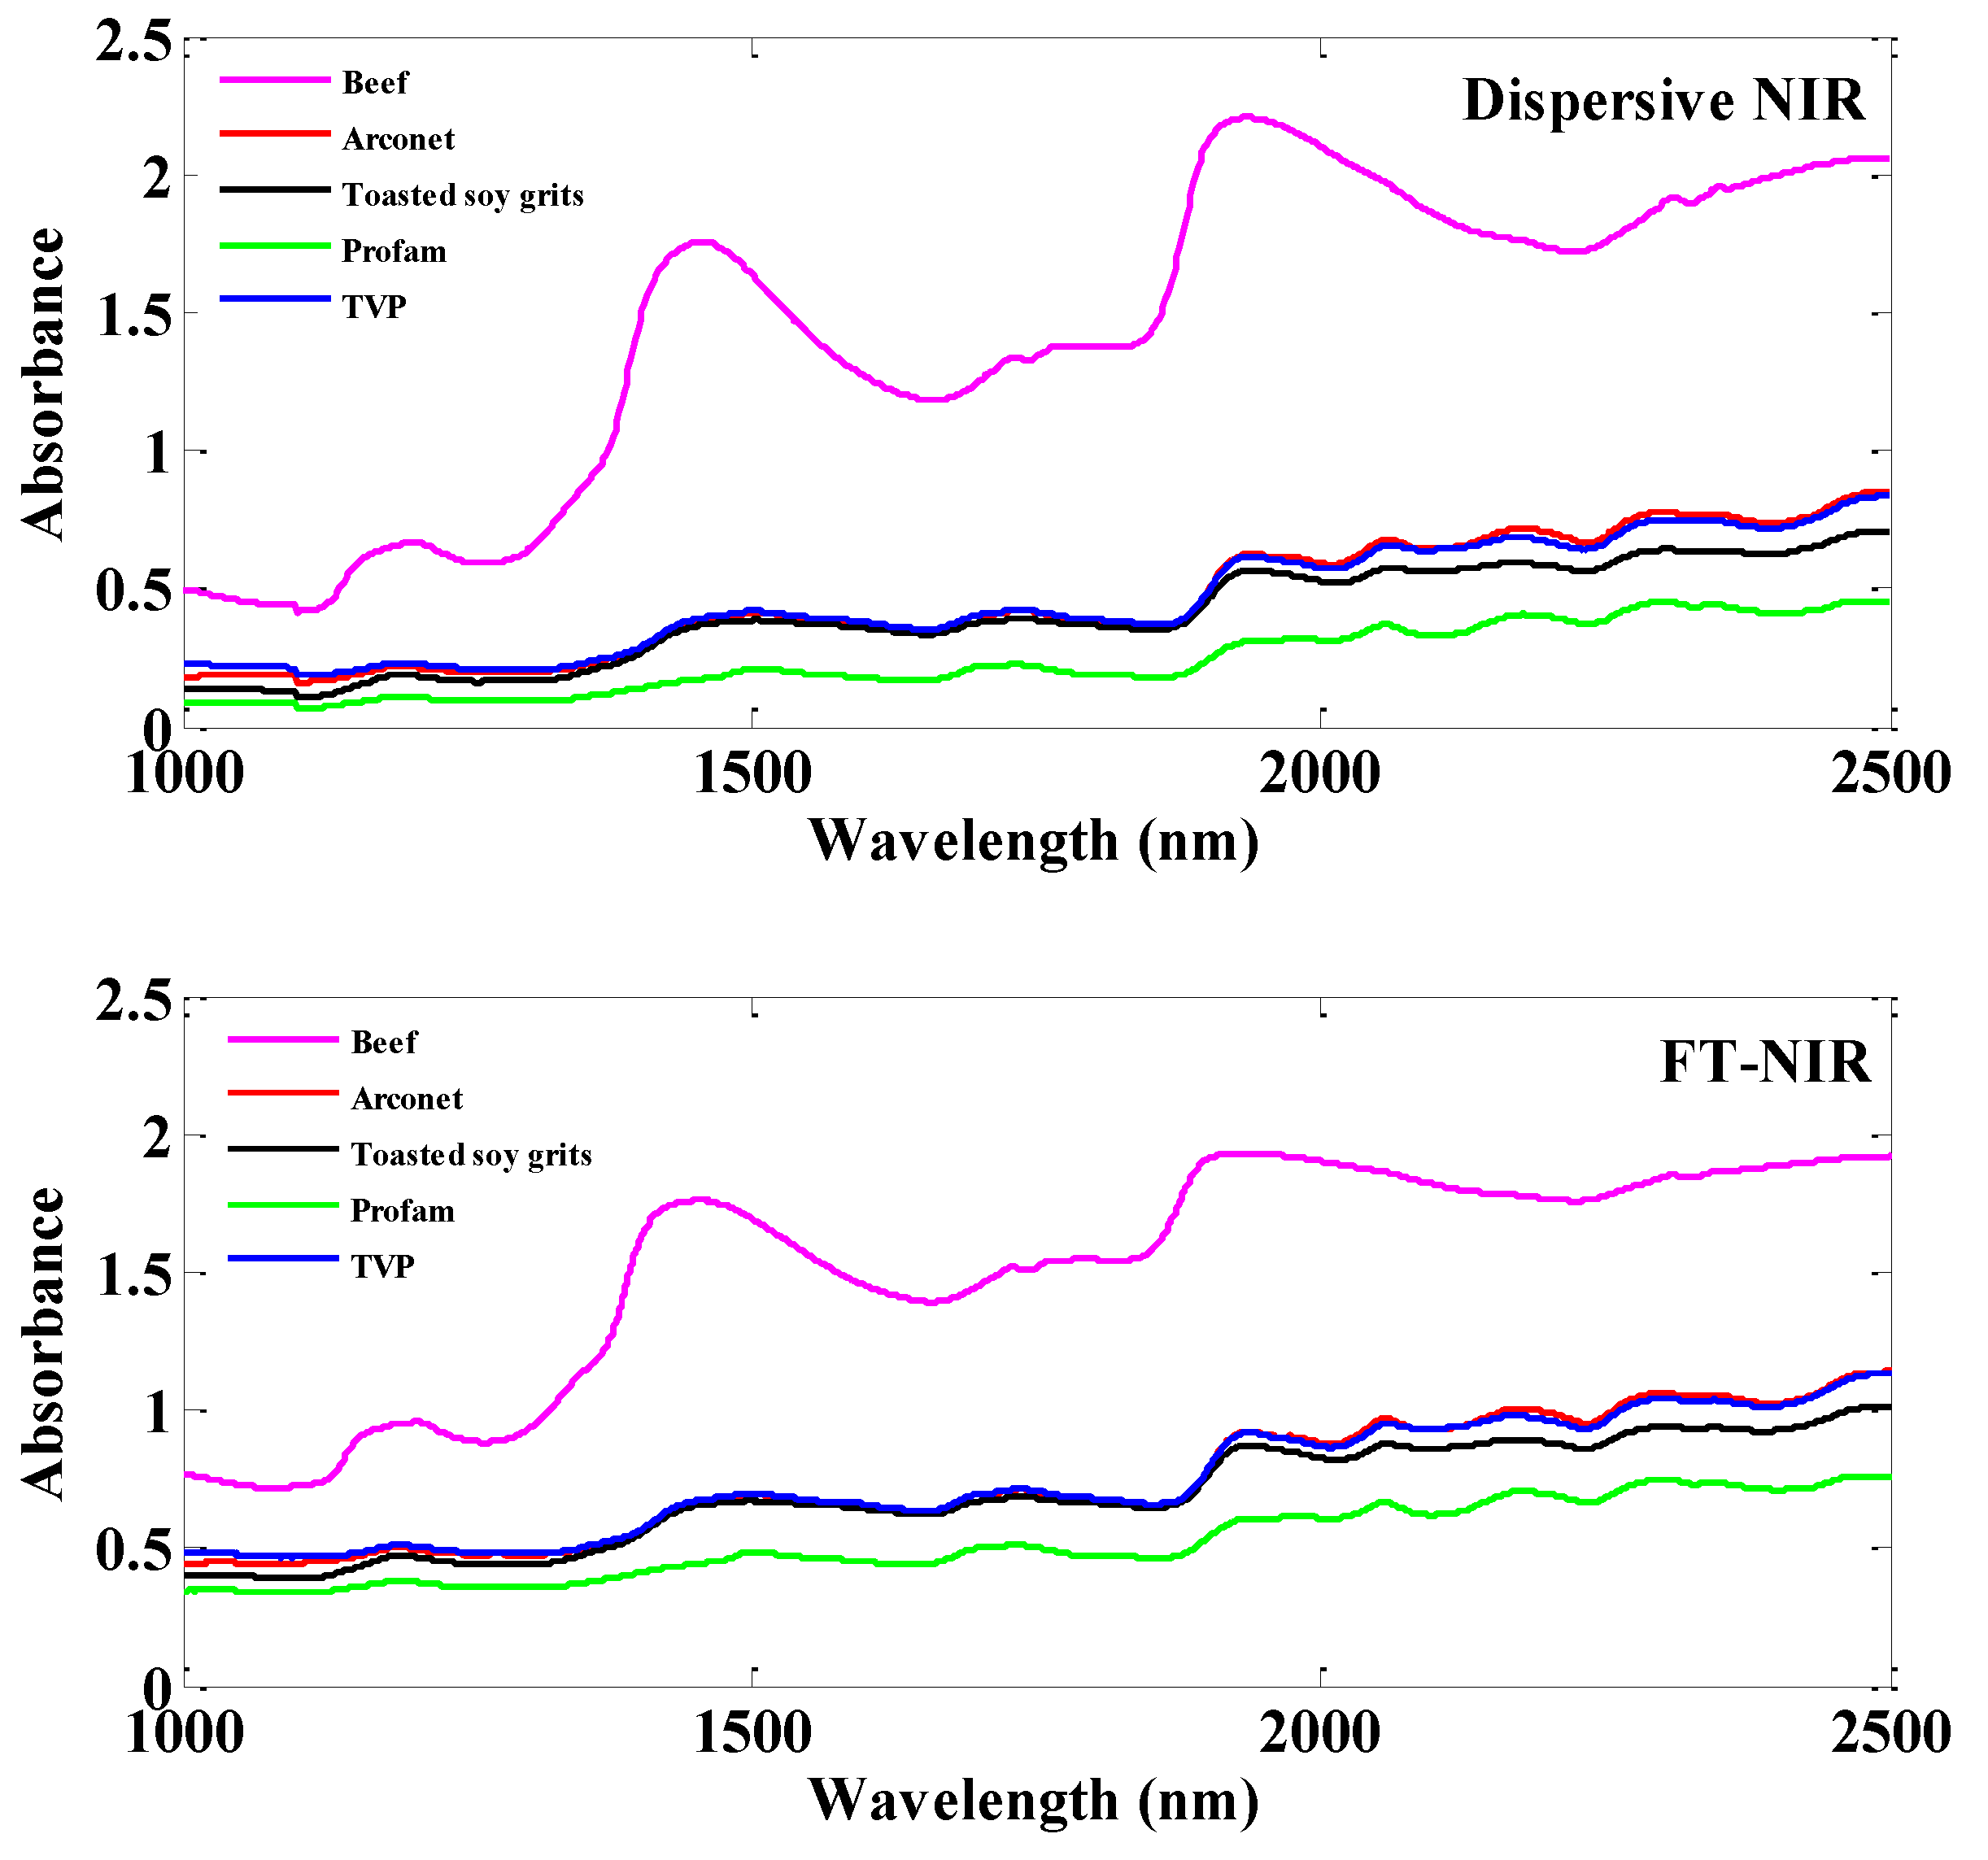
Figure 2 shows the average raw NIR spectra of ground beef and soy protein samples measured separately with the dispersive instrument (top) and the FT-NIR instrument (bottom). Due to the effect of the wavelength on the correlation coefficients (poor relationship at a wavelength less than 1000 nm) and for a better comparison between both spectral data sets (only 1000–2500 nm for FT-NIR spectra), only the region of 1000 to 2500 nm of the dispersive data was used for the analysis. The difference between the two spectra results from the different operational principle of light splitting by diffraction grating and Michelson interference of the two instruments. The results showed that there was some degree of differences between the two spectra, such as the locations of the absorbance peaks and the absorbance extent at different wavelengths.
3.2. Quantitative Analysis with PLS Regression
To quantify the soy protein contents in the mixtures, four models were developed corresponding to the four different soy products for each of two NIR spectra. The number of latent variables (LV) used in each model was chosen to optimize the model performance and minimize the model errors. The results of
Rc2,
Rcv2, RMSEC and RMSECV of different models developed by the dispersive and FT-NIR spectral data were compared in
Table 1 and
Table 2. Overall, the RMSEC are all low (<0.021) and all the predicted results had a high correlation of the calibration data (
Rc2 = 0.99). As expected, PLS regression with dispersive spectral data for toasted soy grits had the lowest
Rcv2 value (0.91) and the highest RMSECV value (0.1164). The reason is that toasted soy grits mixtures showed the lowest correlation with the dispersive spectra (
Figure 1a). Generally, the FT-NIR system gave better results for the four soy types than the dispersive system by showing a higher
Rcv2 (0.98–0.99) and lower RMSECV (0.013–0.057). Also, as
Figure 1b indicated, the results of toasted soy grits and TVP showed slightly worse values than the other two soy types.
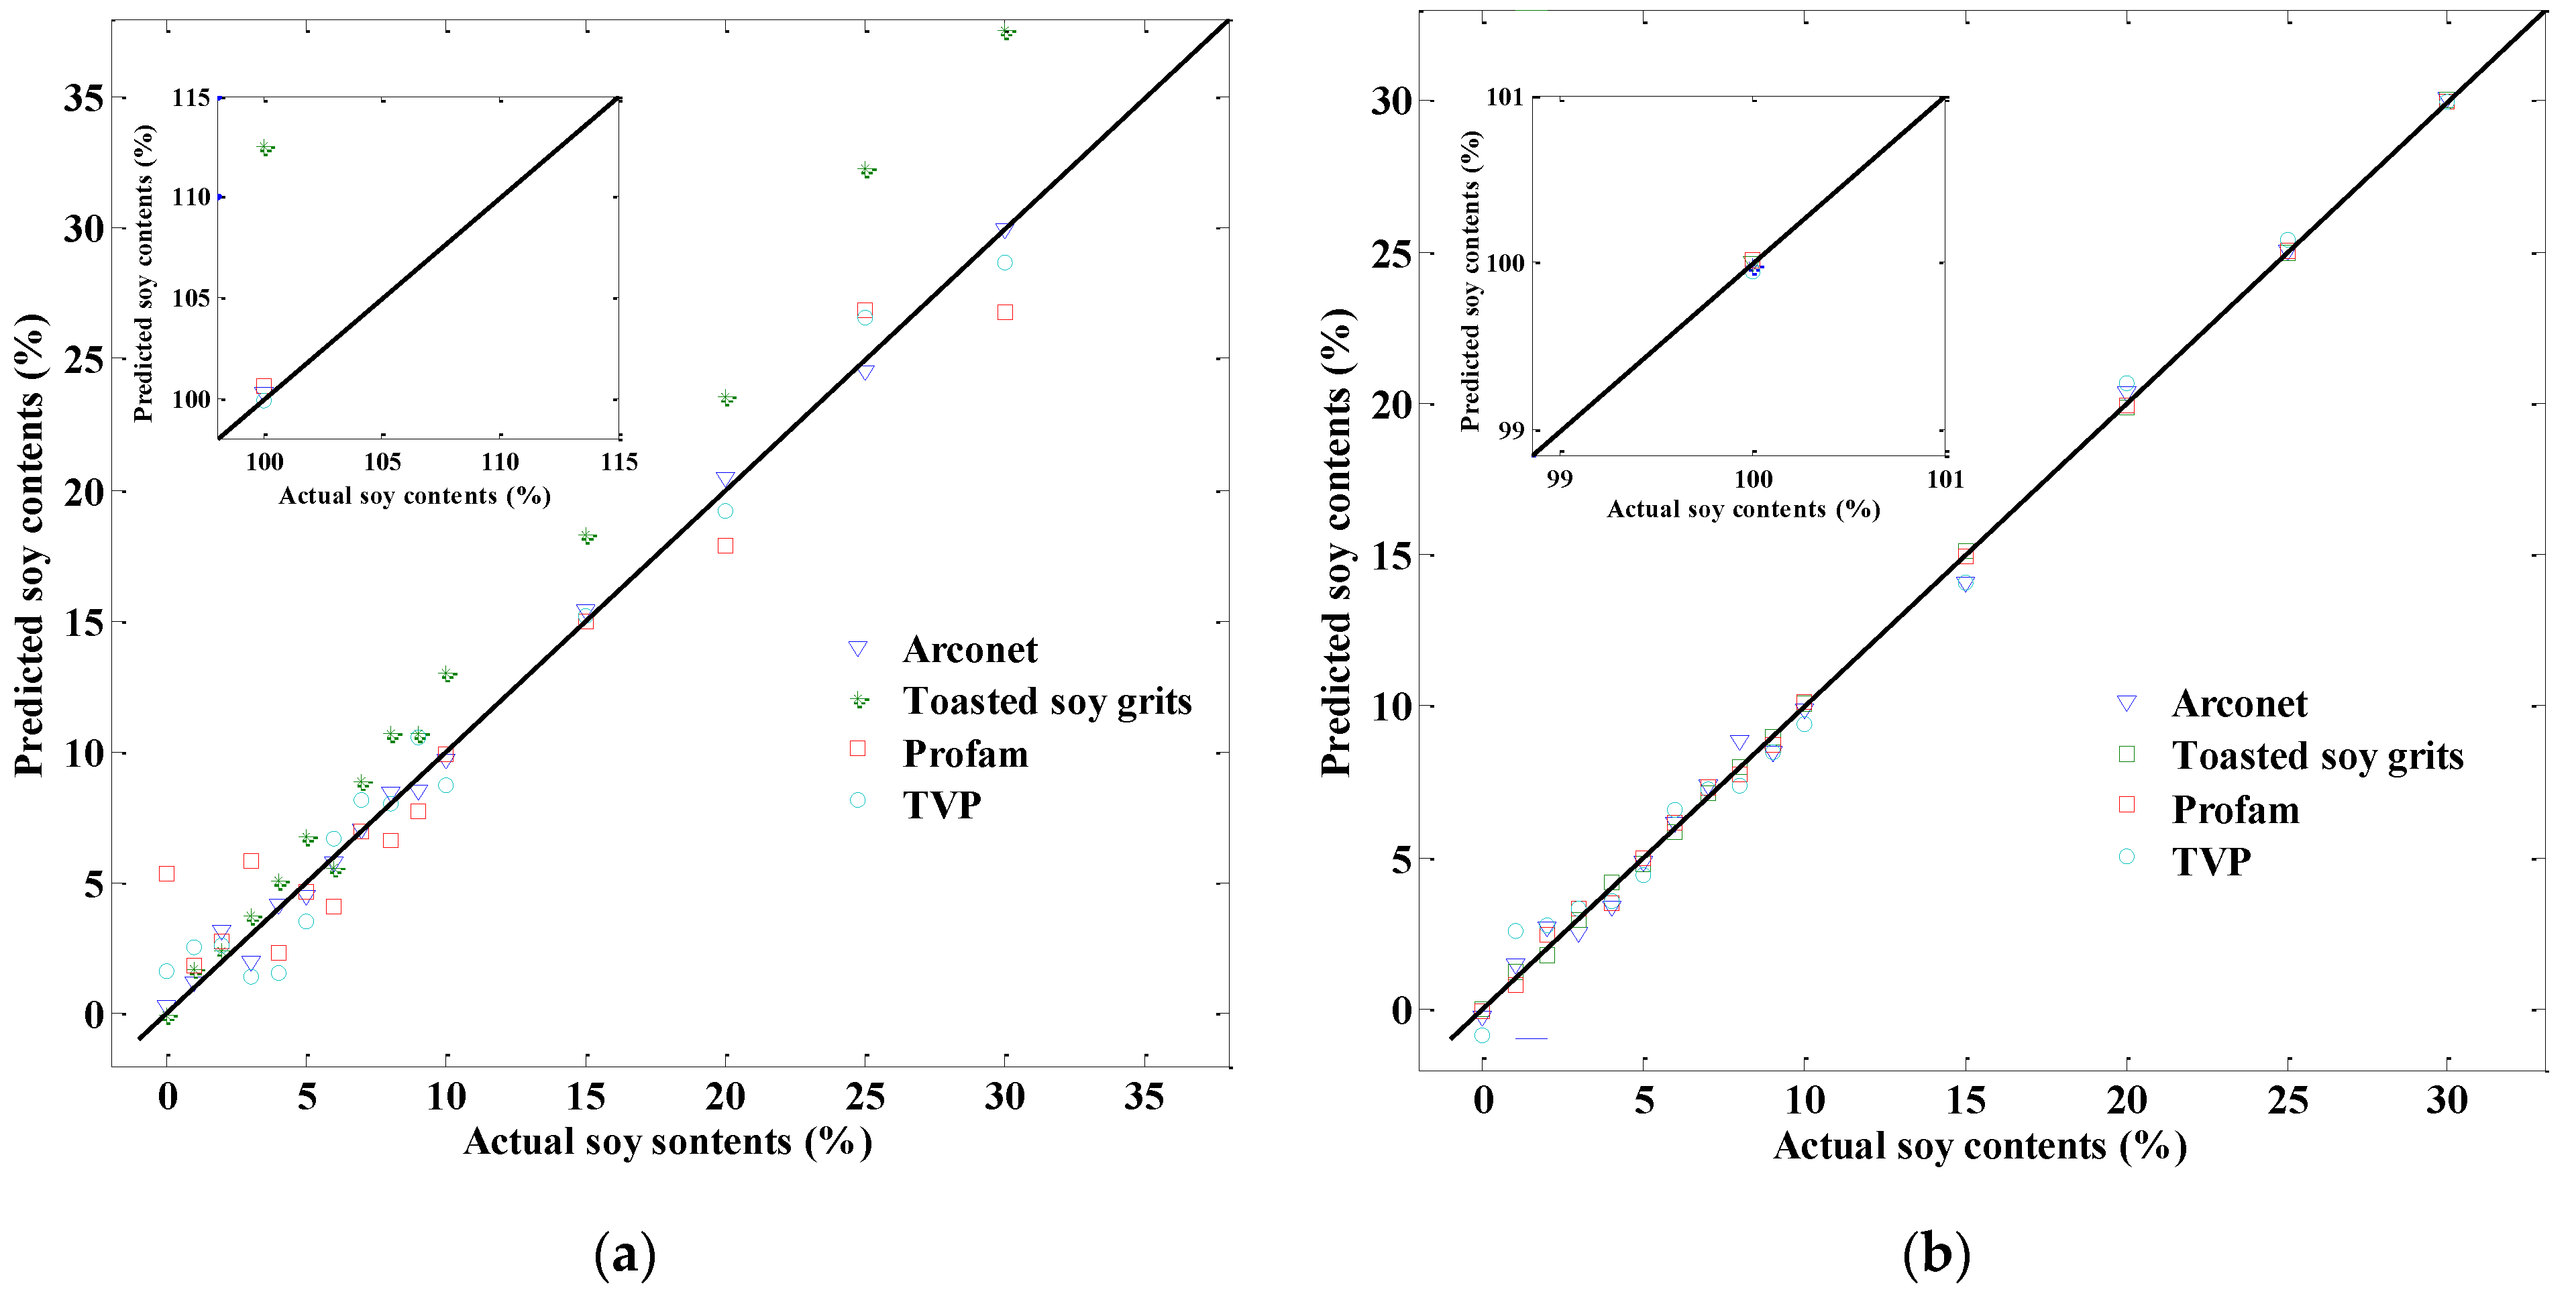
In order to compare the actual soy contents and predicted soy contents by cross-validated models,
Figure 3 reveals the quantitative ability of the two spectra visually.
Figure 3a,b presents the correlation diagram between actual soy contents and NIR-predicted soy contents for different types of soy products using models developed by dispersive NIR and FT-NIR spectra, respectively. As shown,
Figure 3b presents excellent prediction ability regardless of the soy product. Although the correlation coefficients for the two kinds of NIR models were both close to one, the FT-NIR spectra apparently worked better in the quantification of soy products content in ground beef.
3.3. Principal Component Analyses
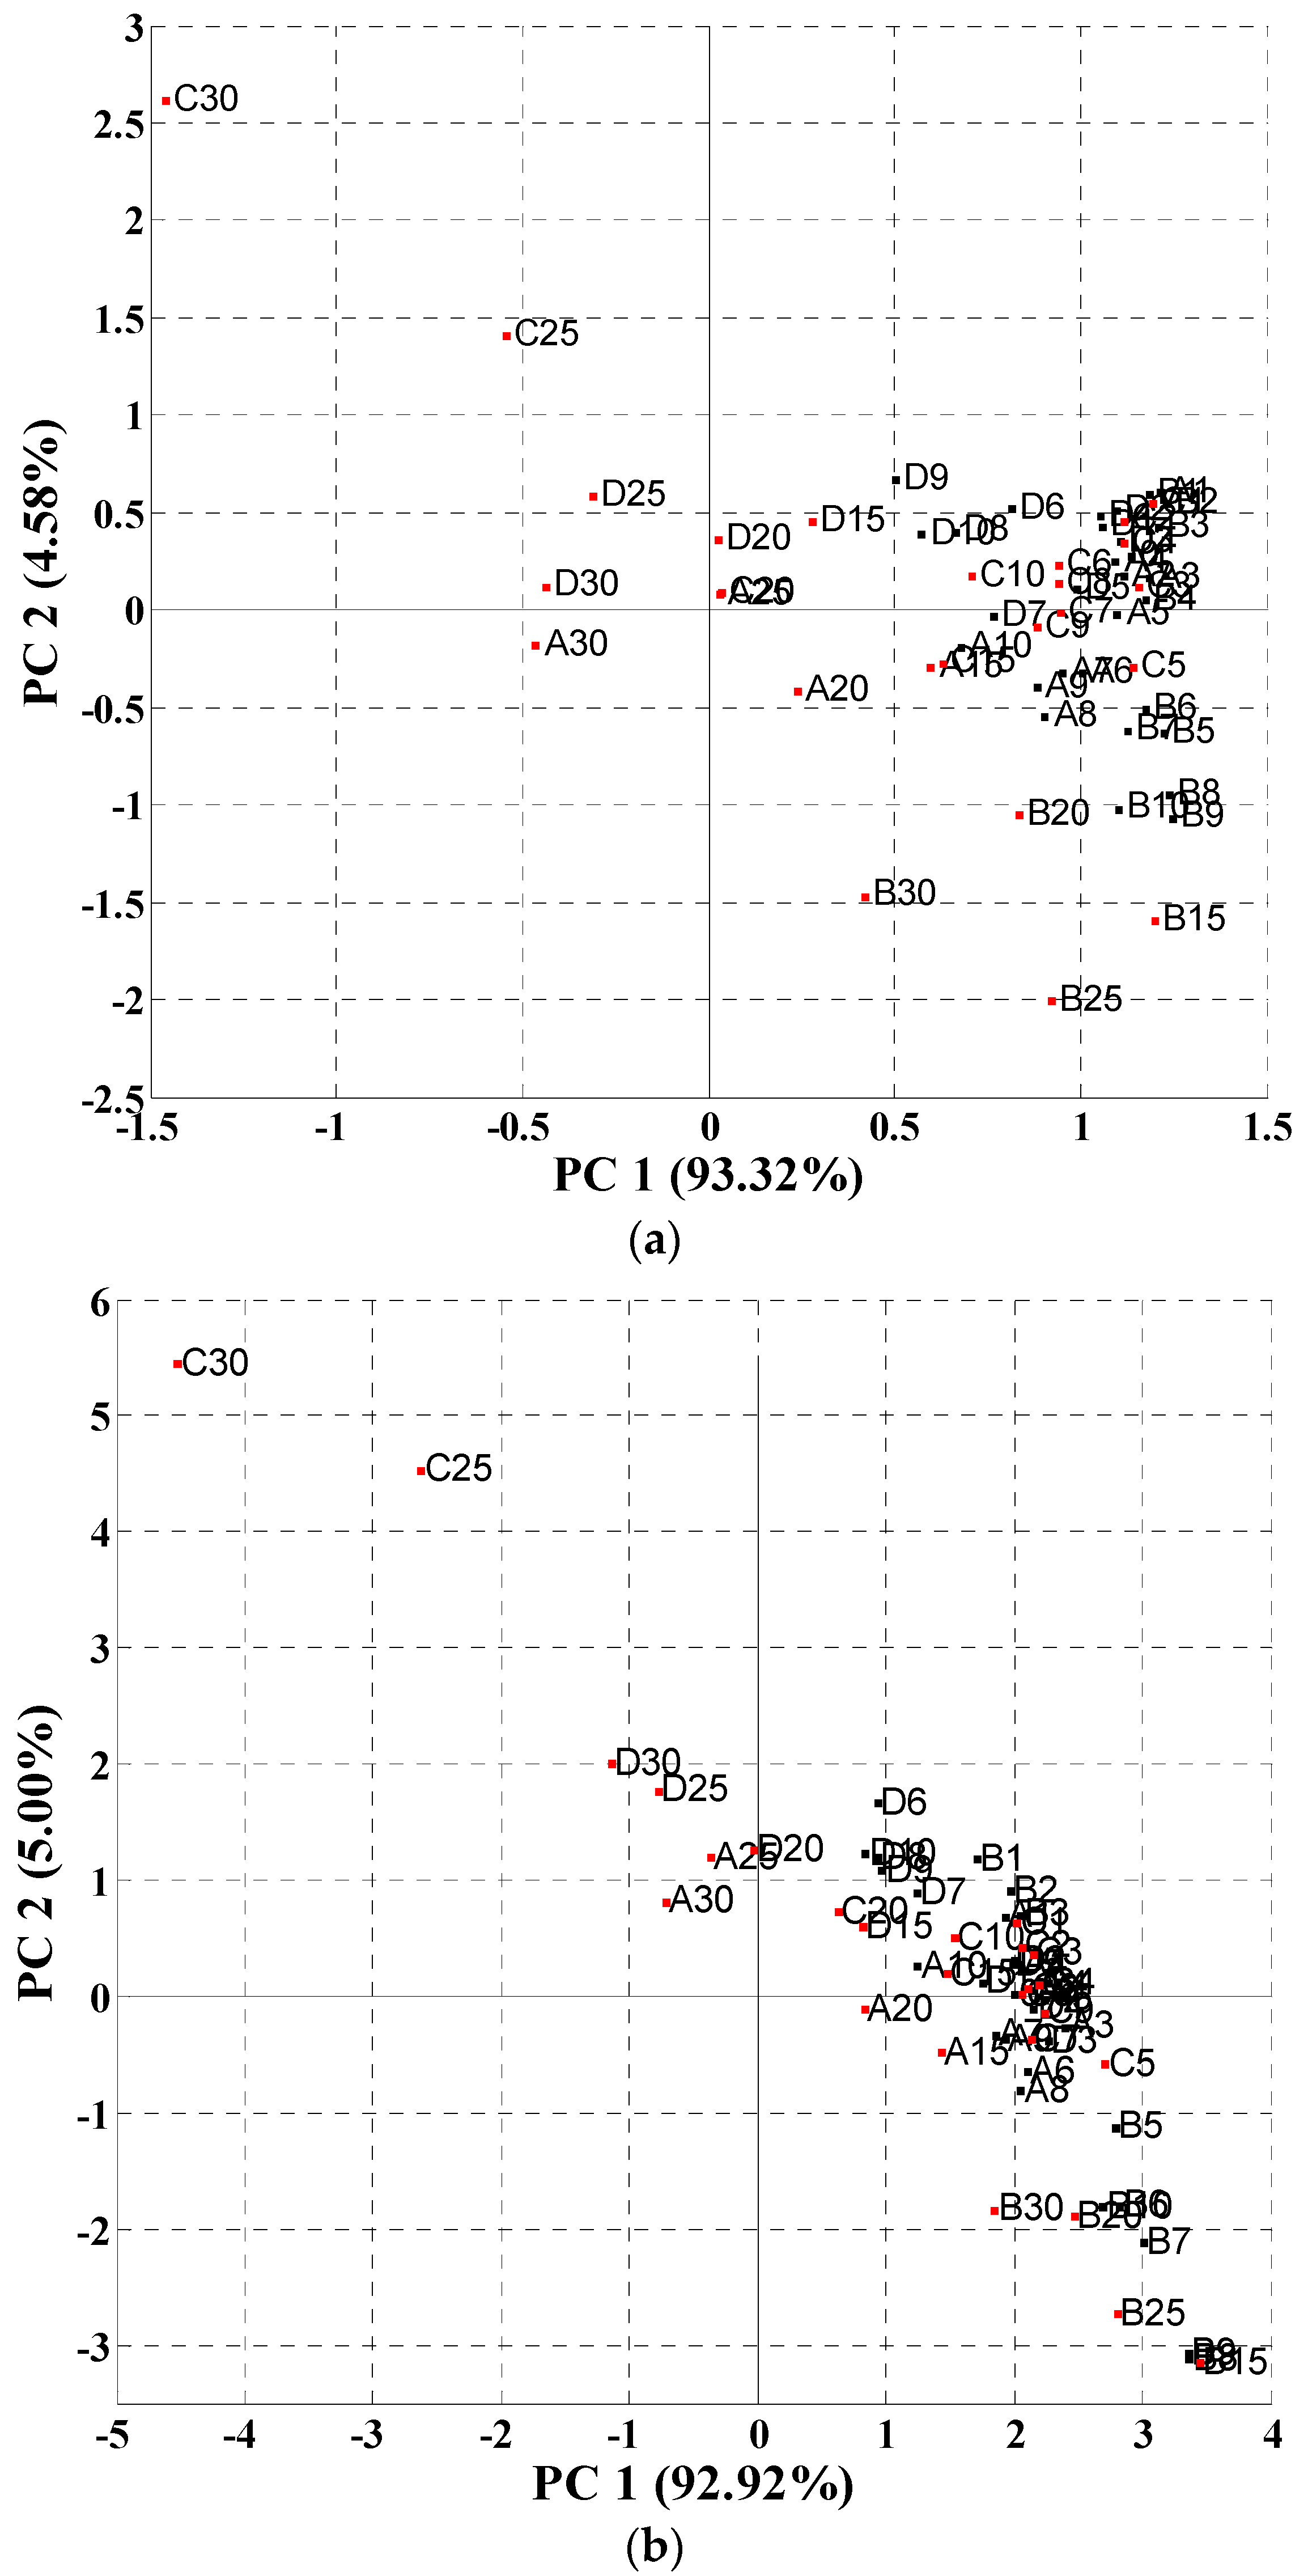
Firstly, the standard normal variate (SNV) preprocessing method was performed to centralize the data matrix before principal component analysis (PCA) was conducted. Then, the high level class (consisting of samples with higher than 10% soy contents) and the low level class (the rest of the samples) were divided. A two-dimensional PCA score plot of all 64 samples (
Figure 4) revealed that the samples could be segregated by high (in red) and low mixture content (in black). For dispersive NIR data (
Figure 4a), the first two principal components could account for 98.90% of the data variance, among which PC
1 and PC
2 held 93.32% and 4.58% individually. There seemed to be a trend (from negative to positive on the PC
1 axis) describing classes of mixed soy content, with samples belonging to high soy content on the left and 0% on the right. In addition,
Figure 4 shows that TVP and the Profam beef-soy mixture are located in the upper and middle region while Arconet and toasted soy grits are in the middle and lower region. On the basis of this observation, the first factor (PC
1) may contain information that describes the high and low soy content level in beef, whereas the second factor (PC
2) contains information differentiating soy product types. As for FT-NIR data (
Figure 4b), the PCA of this sample set also resulted in two PCs which accounted for 97.92% of the data variance, among which 92.92% was for PC
1 and 5.00% was for PC
2. The information contained in the two PCs was similar to the dispersive data, namely PC
1 was relevant for the soy mixture content in the mixtures and PC
2 was related to the soy type.
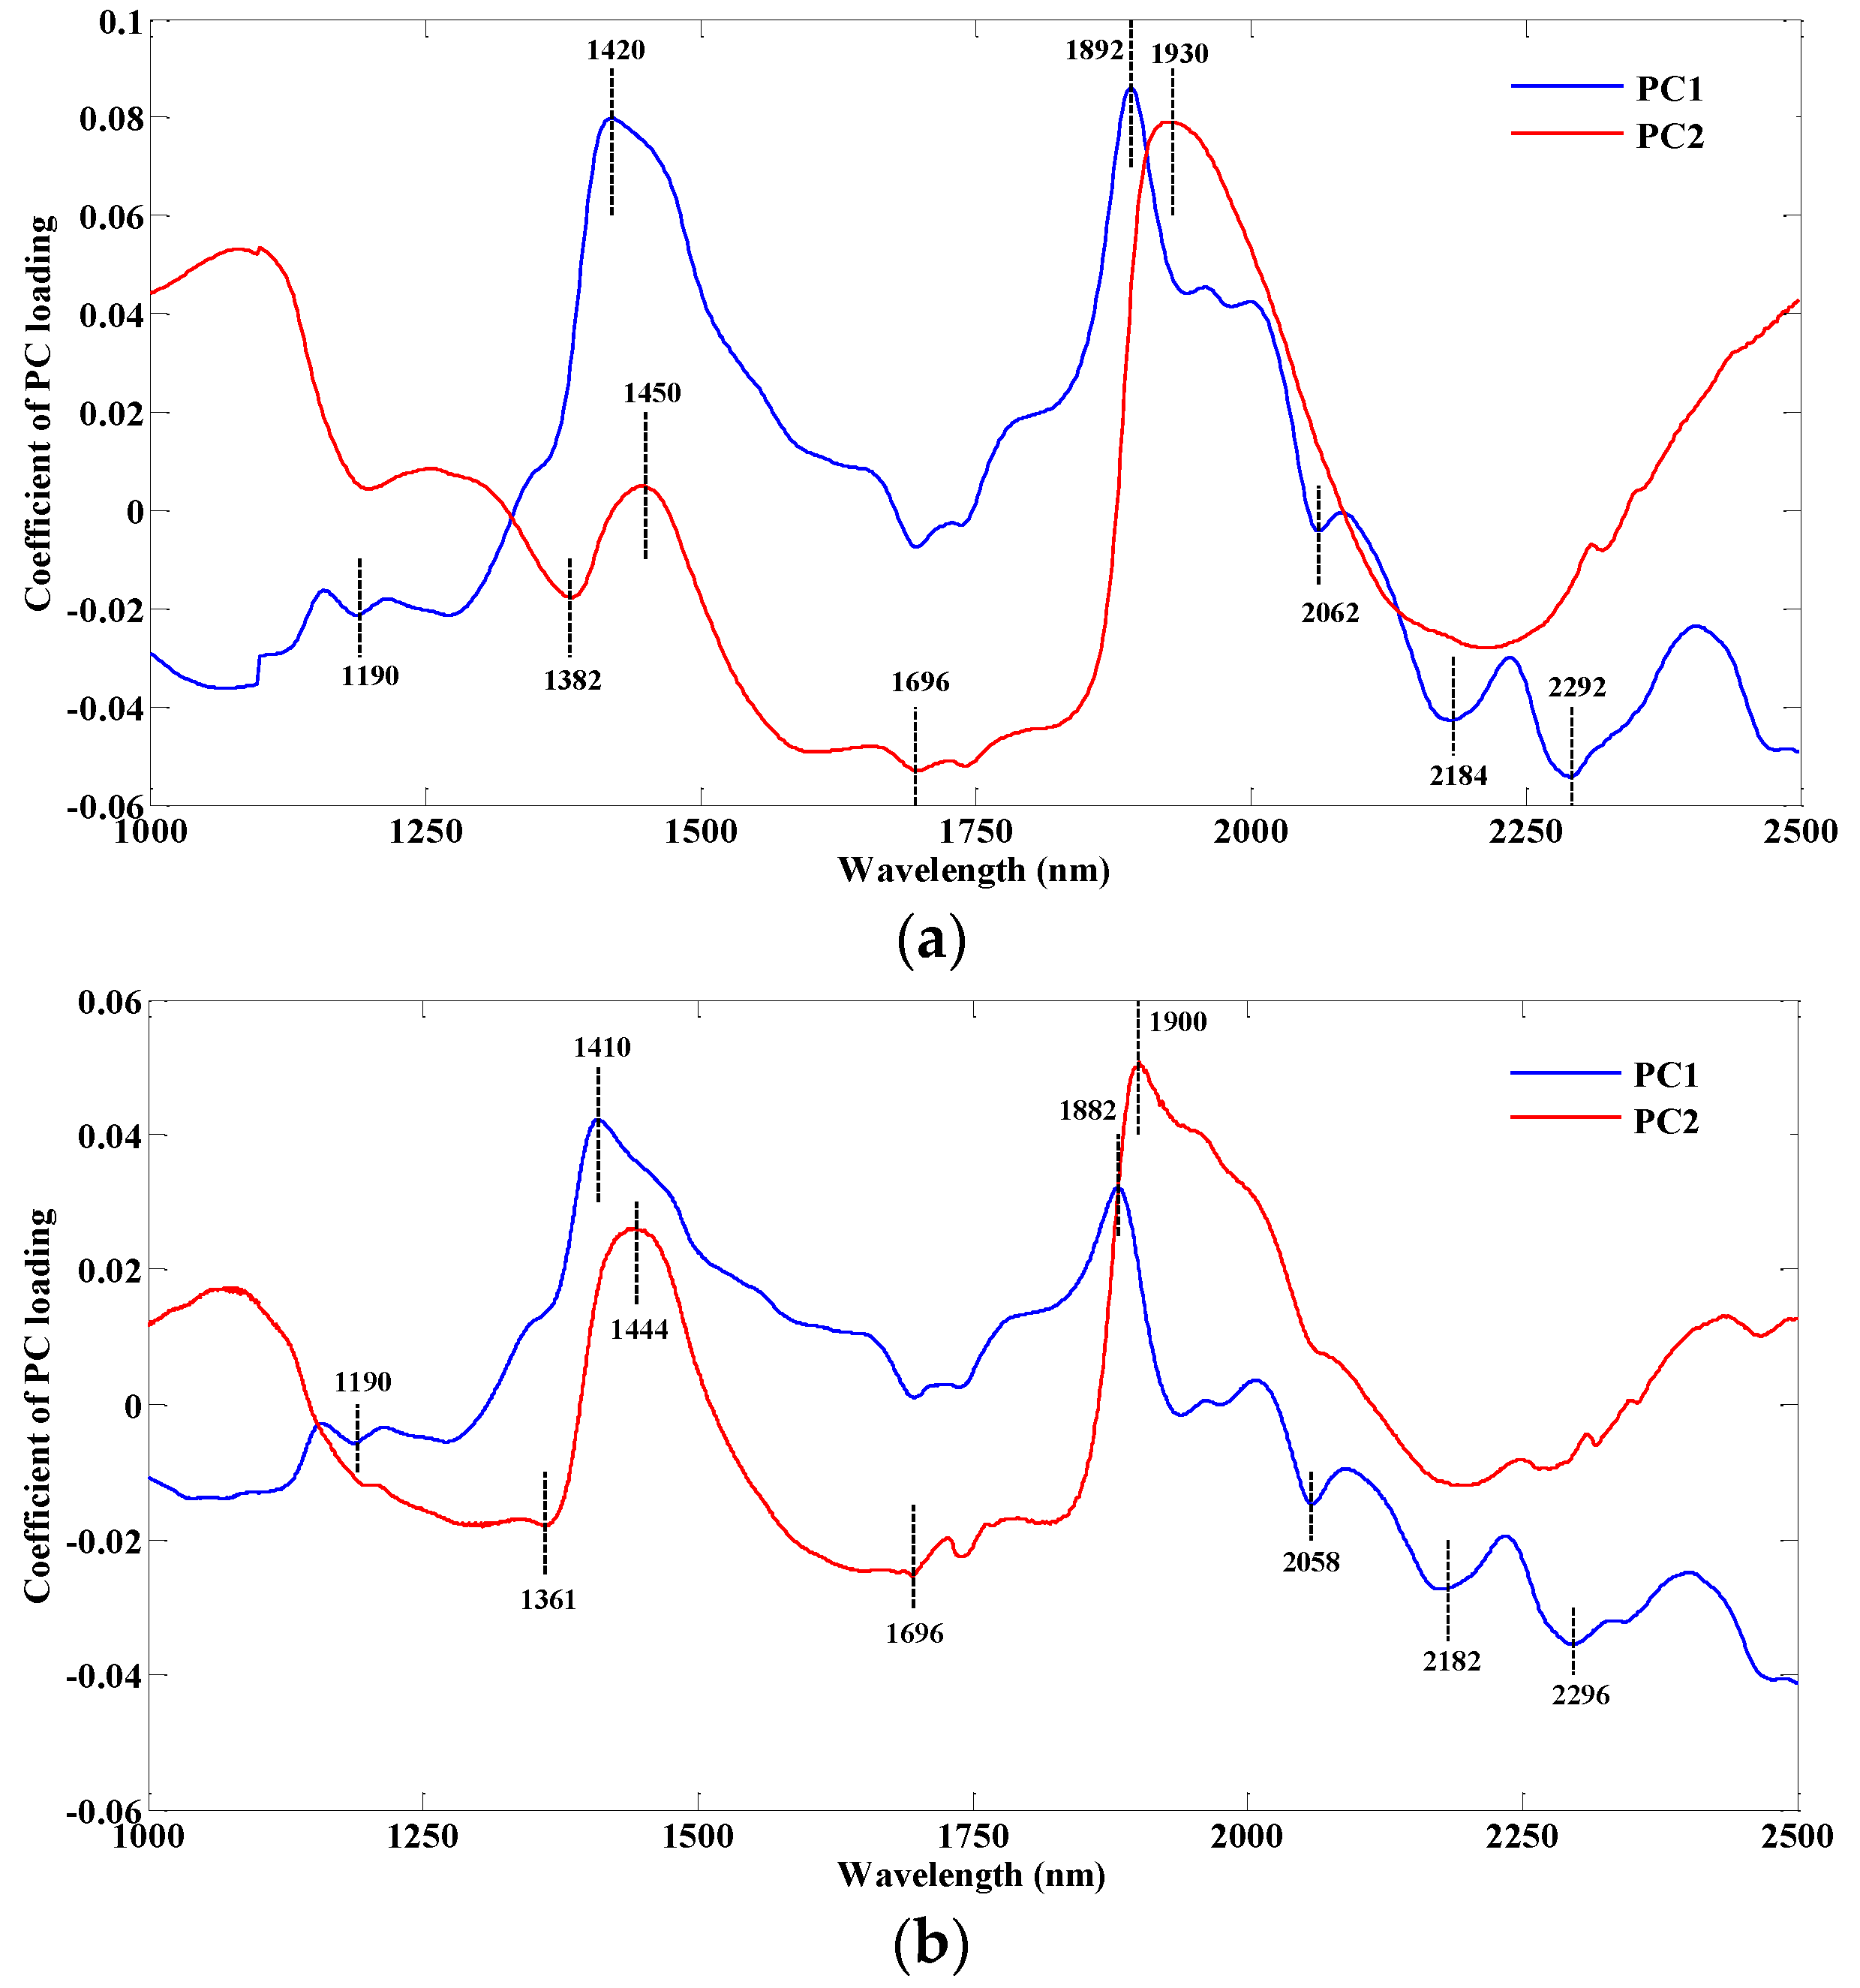
The loading charts were often used in the PCA analysis, and loading refers to a weighted importance of each variable for the particular principal component for demonstrating which variables were the most useful in the data to explain the data variance in the samples.
Figure 5a shows the loading chart of first two PCs based on dispersive NIR data while
Figure 5b is the loading chart based on FT-NIR data.
As for the PC
1 loading line in
Figure 5a, two key wavelengths are shown: 1420 nm, which is assigned to the O-H first overtone of hydrocarbon, and 1892 nm, which is attributed to the C=O stretch second overtone of fatty acids. The small peak at 1190 nm band likely corresponds to the overtones of the CH-stretching mode from lipid molecules [
8]. In addition, some other significant peaks were also found at wavelengths such as 2062, 2184 and 2292 nm. The band assignments may all be relevant to the protein; 2062 nm corresponds to the N-H stretch combination of protein, 2184 nm is attributed to the N-H bend second overtone of protein and 2292 nm likely corresponds to the C-H bend second overtone of protein. In the PC
2 loading line, the peak of 1450 nm could correspond to the O-H stretch first overtone of water [
8]. Moreover, the wavelength of 1930 nm is attributed to a stretching and bending combination for the band of water [
12]. The wavelengths of 1382 and 1696 nm are assigned to the C-H combination of -CH
2 and the C-H stretch first overtone of -CH
3, respectively. Hence, the characteristic wavelengths selected in the PC
1 loading line were likely relevant to the lipid and protein which might help to analyze the mixed soy content in meat. In addition the wavelengths in the PC
2 loading line were mainly related to water and hydrocarbon in samples.
As a comparison,
Figure 5b indicates the important wavelengths found in the PC loading lines based on the FT-NIR spectral data. The general trend of the PC
1 and PC
2 loading curves is similar to the PC loading lines in
Figure 5a. In addition, the two peaks of 1410 and 1882 nm correspond to the C-H combination and the -OH stretch of water, respectively. As expected, the bands of 1190, 2058, 2182, and 2296 nm are also seen in the PC
1 loading line. The peak at 1361 nm could be assigned to the C-H combination of -CH
3, and 1900 nm corresponds to the C=O stretch second overtone of fatty acids. The information of the other two wavelengths of 1444 and 1696 nm represented is consistent with the peaks of 1450 and 1696 nm in the PC
2 loading line in
Figure 5a.
3.4. Qualitative Analysis of Soy Product Types
The possibility to differentiate soy protein types in ground beef was also evaluated by a classification approach using support vector machine (SVM). In SVM, the classification decision function is fixed based on the structural risk minimum mistake instead of the minimum of the misclassification on the training set to avoid an over-fitting problem [
13]. In our work, SVM was selected because it is more suitable to grasp the nonlinear relationship between the data and features when the sample size is small. Samples of each type in various contents were all used in the calibration set. As for validation, eight samples for each soy type were randomly selected in the duplicate test to create a set of total 32 samples. The classified results from comparing the two models developed by dispersive and FT-NIR spectra are shown in
Table 3 and
Table 4. For dispersive spectral data, the evaluated model offered a very high discriminating ability, showing a total accuracy of 95% and 84.38% for calibration and validation. In the calibration set, only toasted soy grits was wrongly discriminated at low contents, which might due to it having the lowest correlation with the dispersive NIR spectra among the four types. The classification model developed by FT-NIR spectra data gave a result of a total of 83.33% and 78.13% recognition accuracy for the calibration and validation set, respectively. However, the low soy content (≤5%) classification performance was quite unsatisfactory, as there were incorrectly classified samples for Arconet, toasted soy grits, and Profam. Although better results were obtained by dispersive NIR data than by FT-NIR, low mixed soy protein contents (≤5%) cannot be detected using either method.


