Article

Vibration-Based Fault Identification in Compaction Equipment Using Feature Extraction Techniques

by
Carmen Nicoleta Debeleac
Research Center for Mechanics of Machines and Technological Equipment, Engineering and Agronomy Faculty in Braila, “Dunarea de Jos” University of Galati, 810017 Braila, Romania
Appl. Sci. 2026, 16(9), 4517; https://doi.org/10.3390/app16094517
Submission received: 31 March 2026 / Revised: 17 April 2026 / Accepted: 26 April 2026 / Published: 4 May 2026

Abstract

This paper focuses on the use of vibration analysis to monitor the technical condition of compaction equipment (such as vibratory plates), with the aim of identifying defects before they cause unplanned shutdowns. The author proposes methods and computational analysis techniques to pinpoint the sources of operational disturbances based on vibration signals collected for analysis (on an experimental stand) and simulation results. Thus, the dynamic behavior of a compactor is analyzed in relation to changes in the angular speed of the vibrator shaft, the wear of the bearings, and the impacts generated by the response of the terrain (soft, medium, or hard) to equipment action. The detailed analysis of these factors transforms raw vibration data into actionable information, essential for the modern, intelligent operation and maintenance of construction machinery.

1. Introduction

The analysis of the condition of a construction machine is a complex activity, often aimed at a specific purpose. In the field of compaction machinery, different types of forces (such as static or dynamic loads with varying frequencies and amplitudes) are applied to the material layer so that the small particles move relative to each other to achieve the final density and to increase the bearing capacity of the structure [1]. Generally, the wear and improper use of components in the construction of a mechanical system lead to changes in the operational dynamics by altering mass distribution, stiffness, and friction, which directly influence vibration frequencies and amplitudes. Thus, faults like imbalances, wear, or electrical issues generate additional forces that result in measurable vibrations with characteristic frequencies (in specific ranges), which can be periodic (e.g., from a rotating imbalance) or stochastic (e.g., from friction). By analyzing these vibrations, engineers can detect impending failures and schedule maintenance proactively, preventing machine breakdowns and increasing longevity. The faults that can be detected through vibration-based condition monitoring techniques in rotary machines are manifold; among them, looseness, eccentricity, unbalance, blade defects, misalignment, defective bearings, damaged gears, and cracked or bent shafts are some of the most investigated phenomena [2]. Therefore, in the case of technological equipment that uses vibrations in its operating mode (such as vibratory plate compactors), analyzing how this influence can be highlighted is of interest [3]. In this regard, analyzing vibration signals to detect changes in fundamental frequencies, observe harmonic spectral increases, and monitor overall magnitude and damping is an essential technique for assessing component functionality vibration analysis to assess structural integrity [4]. Thus, the deviations from a structure’s or component’s base vibrational characteristics—such as a decrease in natural frequencies or increased damping—are direct indicators of damage, wear, or structural weakness. There is a wide range of methods used for vibration signal processing, classified into three fundamental domains: time, frequency, and time–frequency. Spectral methods are mainly used for the diagnostics of bearings, gearboxes, or belt transmissions [5,6].
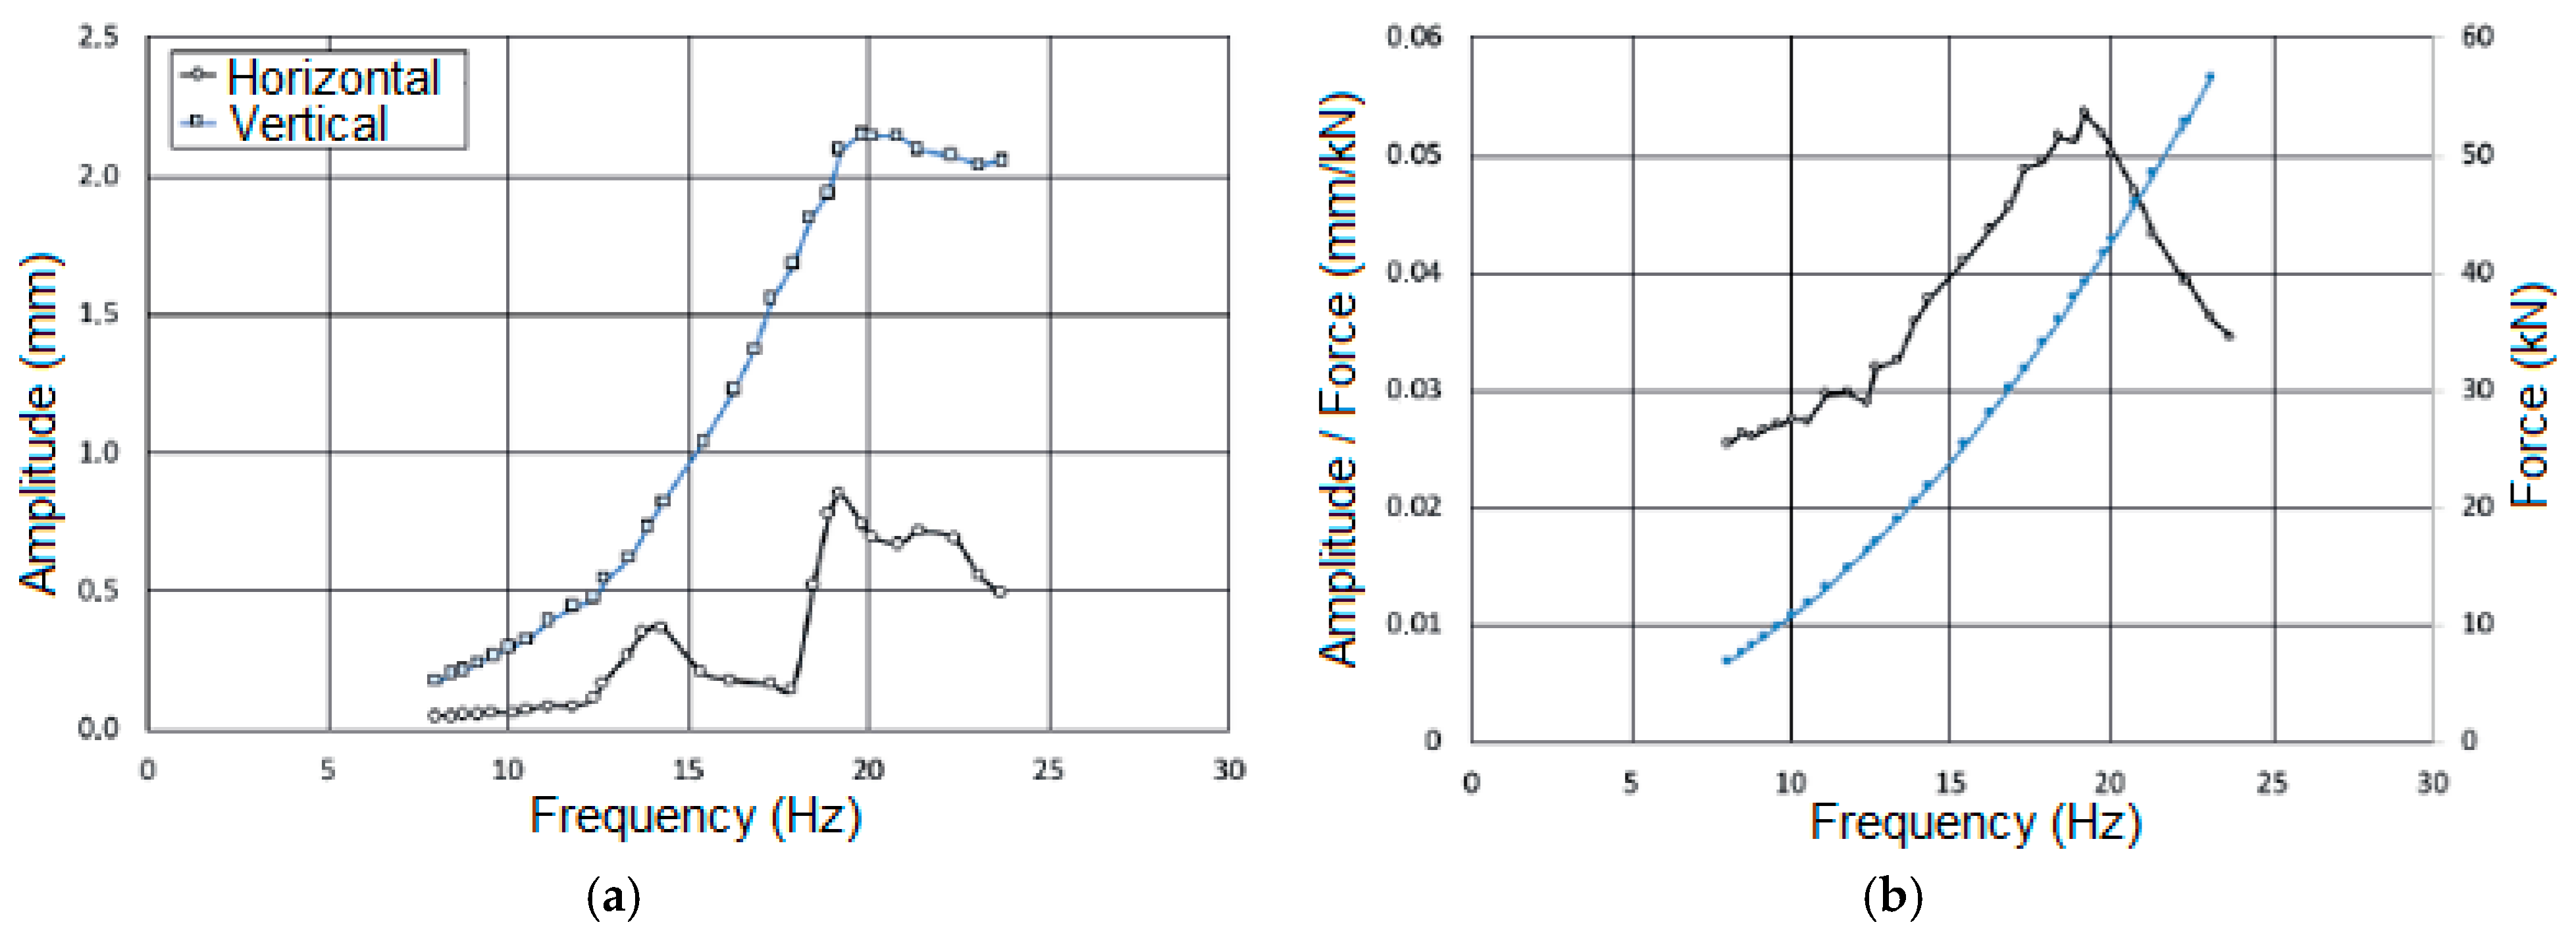
The dynamics of a vibrating plate compactor involve the generation of oscillatory motion due to the action of an eccentric mass set in rotation by an electric motor, which results in a disturbing force transmitted to the terrain by impact, thus leading to its compaction. The movement of the plate is influenced by the ratio between the excitation force and the machine’s weight, an aspect that affects the forward speed and the energy transmitted to the terrain. Disturbances in the operating mode of compaction equipment influence the wear rate and energy transfer in the driven mechanical system, reducing the performance and efficiency of the compaction process. The operating principle of plate compaction equipment in resonant mode has evolved over more than 50 years, but it only recently became applicable in practice, due to the development of advanced systems for monitoring and controlling vibration signals. Thus, by continuously monitoring and adjusting the specific parameters (vibration frequency and centrifugal force) of the dynamic working mode, resonant operation is pursued (where the machine frequency equals the natural frequency of the compacted soil). At this point, energy transfer to the soil is maximized and high-speed vibrations are no longer required. The graphs in Figure 1 provide a conceptual description of the resonance amplification effect of vibrations for a mechanical system that actively uses them (as is the case with vibratory compaction equipment). As resonance is approached, a sharp increase in the amplitude of the vibration is observed in the vertical direction, until the maximum level is reached (Figure 1a); simultaneously, the centrifugal force increases exponentially with frequency (Figure 1b). The horizontal component of the vibration has a much lower amplitude, which is ideal for compaction, since the energy is directed vertically into the soil, rather than through lateral sliding. While this mode of operation is recommended for compaction, not all equipment is equipped with in situ systems for monitoring and controlling soil vibration during the process.
However, resonance compaction is highly effective only under optimal operating conditions of the vibrating plate, provided that no additional vibration spectra appear to disrupt normal operation.
The technical literature highlights a significant interest in analyzing the compaction process, particularly in contexts controlled by technological factors. In the case of soil compaction through vibrations, research has been conducted to gain a better understanding of the influence of key technological factors, such as the following [8,9]:
  • Characteristics of compaction equipment (specific load, plate dimensions, frequency, and amplitude of vibrations).
  • Soil characteristics (density, moisture content, granularity).
  • Applied technology (working frequency, travel speed, number of passes, and layer thickness).
The study is of interest regarding the impact of the improper functioning of compaction equipment on the quality of the work performed. Thus, the technological capacity of vibratory machines is defined by specific dynamic parameters that ensure a prescribed performance level, determined by the targeted technological process (mandated by regulatory documents or commercial agreements between manufacturers and clients). Quality control of the compaction process is essential in foundation and road construction, especially when verifying the achievement of the required compaction degree [1]. Thus, monitoring and controlling all specified parameters are mandatory to ensure construction quality, improve structural performance, and meet technical standards for durability and safety.
The quality of compaction execution is intrinsically linked to the operational integrity and mechanical performance of the vibratory plate compactor. Achieving specified soil density depends not only on the operator’s technique but also on the machine’s ability to deliver consistent centrifugal forces and vibration frequencies. Consequently, any degradation in the equipment’s functional state—specifically transmission disturbances like belt slippage or structural failures such as bearing wear—can directly compromise the uniformity and depth of the compacted layers. Rather than isolating variables through single-defect analysis or idealized plate–soil models, this research investigates the coupled effects of these concurrent mechanical issues across different soil types. By analyzing this synergy, the study addresses a significant research gap regarding the multifaceted degradation patterns common in operational construction machinery under diverse geotechnical conditions.
The structure of this article is as follows: Section 1 provides a detailed presentation of the disturbing factors that influence the operation of the vibrating plate compactor. Section 2 provides a description of the materials and methods applied for the vibration analysis of the acquired signals. Section 3 presents the results of the dynamic behavior of the plate (based on real-time experimental data, supplemented with computational models), in various operating conditions, including simultaneous defects across different geotechnical categories of terrain. Finally, Section 4 analyzes the degraded operating state of the technological equipment, evaluated under various soil conditions (soft, medium, or hard) based on the results obtained. In this context, the following sections provide a detailed overview of the disturbing factors accounted for in the diagnostic methodology that is the subject of this study. By analyzing these variables, we highlight their specific influence on the operating conditions and overall performance of the vibratory plate compactor.

1.1. Disturbances Induced by Belt Operation

The correlation between belt slippage and engine speed fluctuation acts as a critical disturbing factor that leads to a decrease in vibration frequency, thus reducing compaction efficiency and causing premature wear of the transmission system. In this regard, research on belt drive vibration began in the 1960s, with the literature exploring the influence of the belt, the pulleys, belt–pulley contact, and the entire system on vibration transmission. Belt dynamics are studied using dynamic modeling of solids, discrete elements, and the finite element method. In this regard, linear [10,11], nonlinear [12,13], and viscoelastic [14,15] models have been developed. These models form the basis for understanding and mitigating unwanted vibrations in mechanical systems, identifying system parameters (such as natural frequencies, belt stiffness, and friction coefficients through experimental and analytical methods [16,17]), and managing energy management (stored and dissipated) through various modeling approaches that capture complex dynamic behaviors.
In belt transmission systems, the factors influencing equipment dynamics and stability are belt length, pulley eccentricity, the tensioning system, pulley diameter, and critical speed. All these factors significantly impact the overall dynamic behavior of the equipment by introducing vibrations in the longitudinal and transversal directions of the belt [2]. Thus, several representing the current state of research include the appearance of small free oscillations in the belt due to the large distance between the centers of the two pulleys and, implicitly, the large length of the belt without a tensioning mechanism [18]; the fact that large diameters of the belt pulleys influence the appearance of transverse vibrations in the belt [19]; transverse vibrations in the belt are maintained by the resonance frequencies of the tensioning mechanism and the belt, as well as by the critical speed of the belt [20]; and the instantaneous rotational speed of the motor undergoes certain fluctuations, which are responsible for the variability in the belt’s longitudinal velocity, being the direct cause of transverse belt vibrations [21].
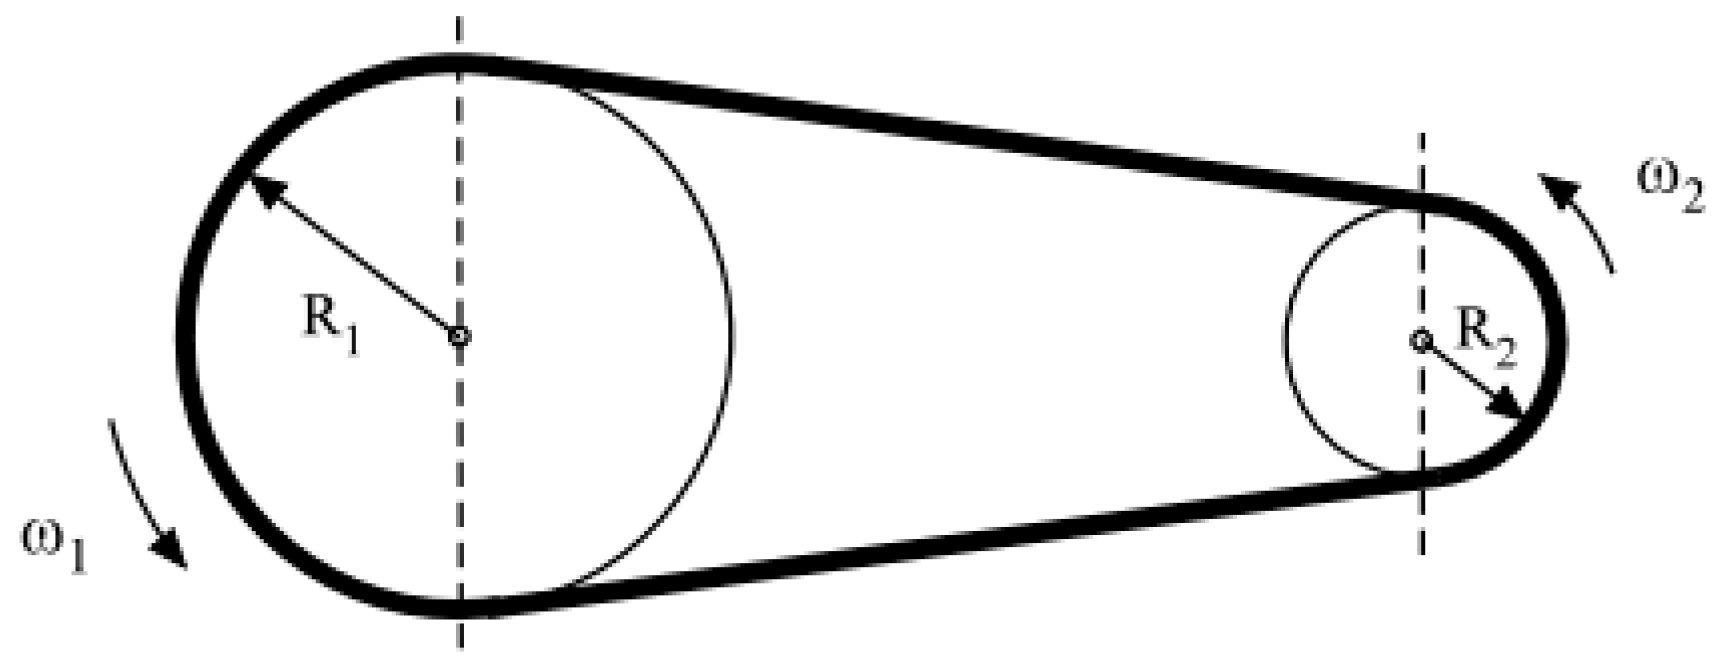
The theoretical approach begins with the fundamental parameters for analyzing a two-pulley belt transmission, including the driving engine’s power (P), the angular velocities of the driving (ω1) and driven (ω2) pulleys, the radii of the driving (R1) and driven (R2) pulleys, the distance between their centers (c), and the total length of the belt (L). All these variables (Figure 2) provide the basis for evaluating the system’s performance, such as speed (v) and torque (Mt) transfer. This is because, during transmission, the belt transfers energy from the drive pulley to the driven pulley due to the friction forces that occur between the belt and the pulleys.
To determine the natural frequency of the belt, second-order Lagrange equations are used, which have the following matrix expression [22]:
[M] + [C]q + [K]q = F(t),
where [M] is the mass matrix, [C] is the damping matrix, [K] is the stiffness matrix, q is the generalized coordinate, and F(t) is the vector of external forces. The natural frequencies (ω) are then found by solving the characteristic Equation (1), expressed as det([K] − ω2[M]) = 0, which yields the eigenvalues ω2. Neglecting the speed-dependent terms, the analytical expression for the belt’s natural pulsations is [22]
λ 2 = E I π 4 μ L 4 F π 2 μ L 2 ,
where E—longitudinal modulus of elasticity of the belt; I—geometric moment of inertia of the belt cross-section; μ—coefficient of friction between the belt and the driving pulley; F—tractive force of the belt; and L—length of the loaded belt, whose analytical evaluation is determined with the following relationship:
L = L 0 1 + F 0 E A ,
where F0—pretensioning force; L0—unloaded belt length; and A—cross-sectional area of the belt.
During the technological process, non-uniform belt movement is caused by the fluctuation in the driving pulley’s angular velocity. This variation can be analytically evaluated using the following specific relation [23]:
Δ ω = 1 2 F 0 R 1 M t + 2 k R 1 2 F 0 R 1 + M t + 2 k R 1 ω 1 ,
where Mt—motor torque; k—belt stiffness.
This theoretical approach enables the study of disturbing factors such as belt tension, transmission defects, and imbalance, providing a basis for developing predictive maintenance strategies and optimizing the efficiency and longevity of belt drive systems.

1.2. Disturbances Induced by Bearing Operation

Rolling element bearings of the vibratory plate compactor in optimal operation conditions generate vibrations due to the changing stiffness of the bearing assembly as the rolling elements rotate under loads during the technological process. Therefore, this varying compliance is a natural phenomenon, and this operation mode is not necessarily indicative of a bearing defect. Localized bearing faults, which are concentrated areas of damage on bearing surfaces, can occur on the outer race, the inner race, or the rolling elements. These faults typically originate as small pits or spalls and generate noticeable vibrations with distinct frequencies as the rolling elements pass over them [24,25].
Each of these faults is characterized by their natural frequency, which is usually specified by the manufacturer or calculated in the technical specification of the bearing. An outer race defect in a rotating machine generates a higher vibration amplitude at its specific defect frequency compared to other defects, like an inner race or rolling element defect, under similar conditions. This is because the impact of a rolling element hitting a fault on the stationary outer race creates a more significant, high-frequency pulse than an inner race or rolling element fault would. The characteristic defect frequency is determined by the specific location of the defect and can be used to diagnose the type and severity of the fault, although some techniques are more established for certain defect locations than others [26].
The characteristic defect frequencies can be calculated using formulas based on the bearing’s geometry, number of balls, and rotational speed, as given below [27]:
(a)
Ball Pass Frequency Outer Race (BPFO):
BPFO = n 2 · R P M 60 · 1 B d P d c o s β .
(b)
Ball Pass Frequency Inner Race (BPFI):
BPFI = n 2 · R P M 60 · 1 + B d P d c o s β .
(c)
Pass Frequency Rolling Element (BPFR):
BPFR = P d 2 B d · R P M 60 · 1 B d P d 2 c o s 2 β .
where Bd—ball diameter; Pd—pitch diameter; RPM—rotation per minutes; n—number of balls; and β—contact angle.
From a practical perspective, vibration analysis of a vibratory plate allows for the identification of these specific frequencies (and their harmonics) in the vibration spectrum. In the early stage, these defects are typically recognized by high-frequency signals; in contrast, advanced defects manifest as harmonics of the fundamental defect frequency, accompanied by high noise levels across the specific spectral range.

1.3. Detecting Operational Disturbances

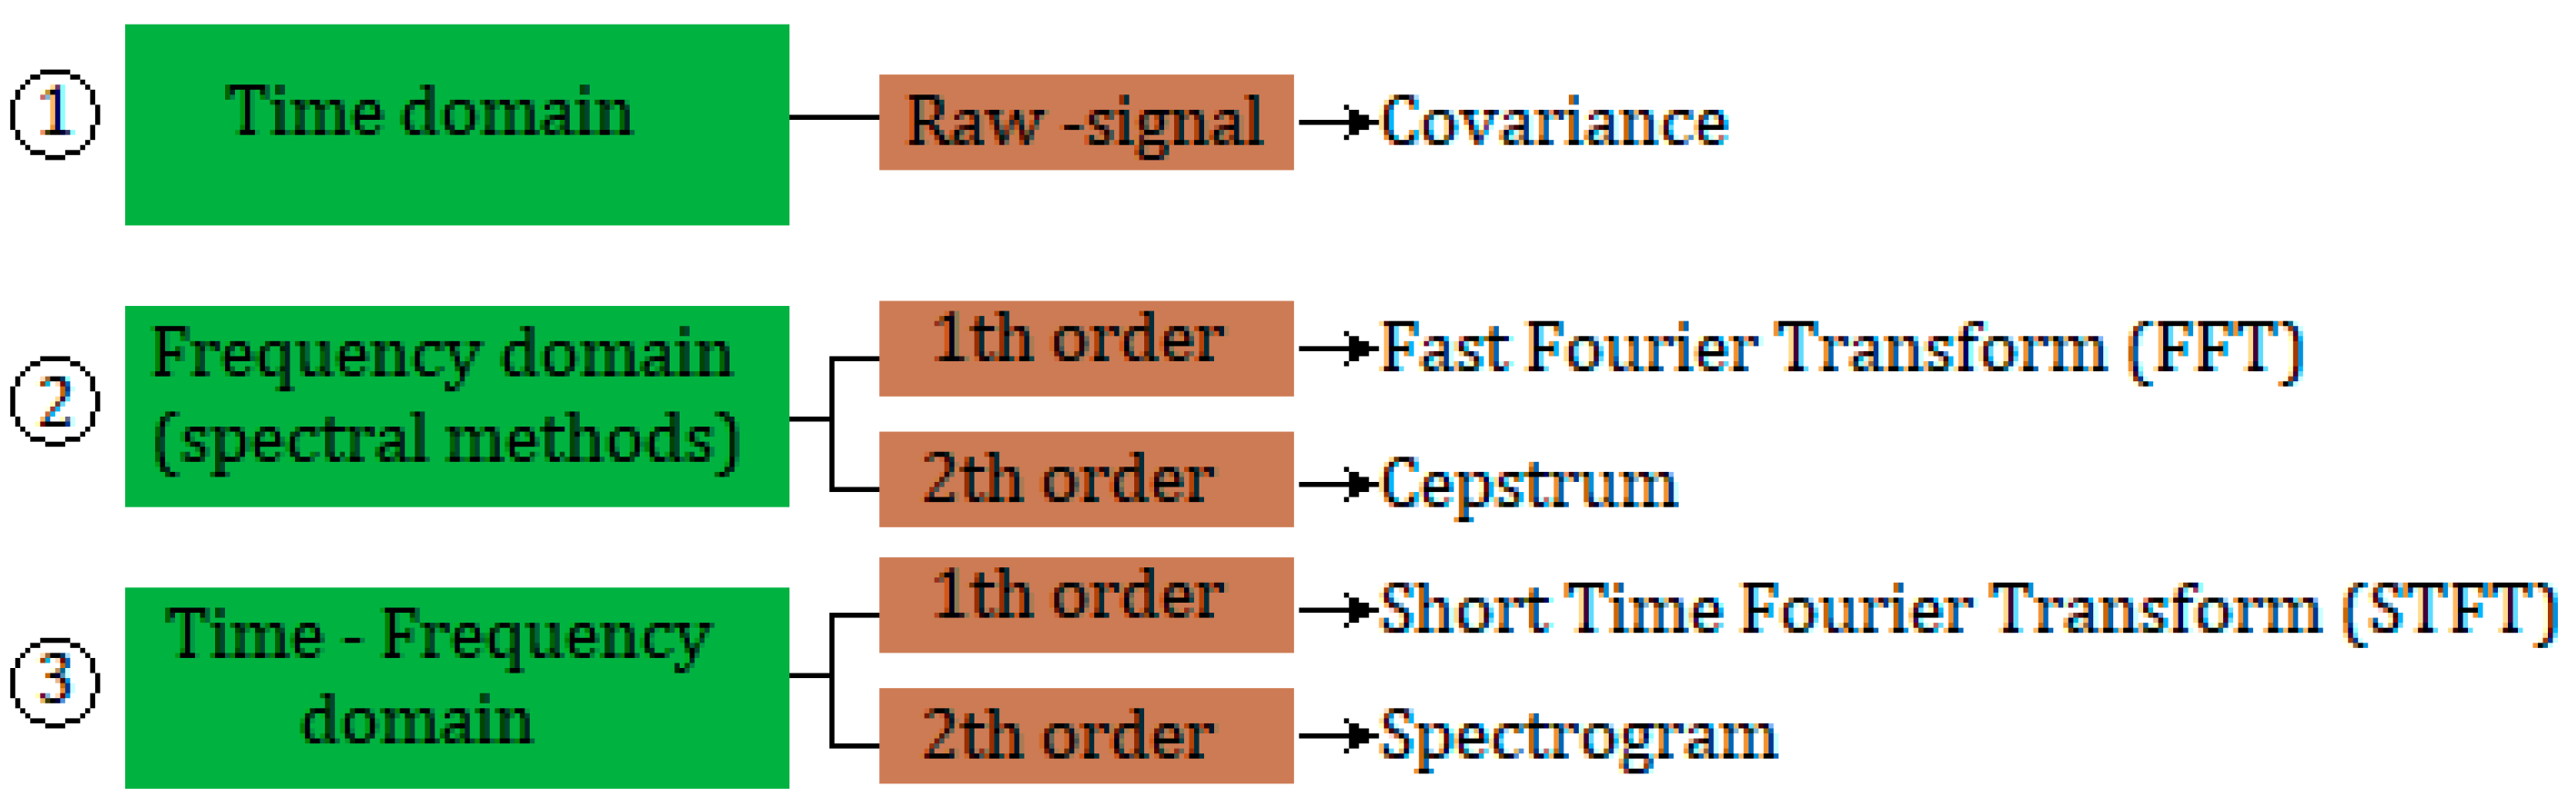
Detecting operational disturbances in a vibrating plate is primarily accomplished through vibration analysis, which monitors functional changes in the machine. Since each mechanical component—such as eccentric shafts, bearings, and belts—generates specific frequencies during normal operation, any deviation from these basic patterns serves as a diagnostic indicator of failure. In this regard, the specialized literature offers numerous theoretical and experimental case studies on the global and specific application of dynamic diagnosis and fault detection techniques. These approaches use signal analysis in time and frequency domains to identify deviations from normal operation. Current systems employ computational methods to extract time–frequency information for early detection or potential failures in the system components under testing [28,29]. The steps in signal acquisition and processing generally include acquiring the raw signal, converting it to a digital format (if necessary), filtering and conditioning the signal to remove noise or extract features, and finally analyzing the processed signal to extract useful information (Figure 3).
For example, Fast Fourier Transformation (FFT), short-time Fourier transformation (STFT), Wigner–Ville Distribution (WVD), and Wavelet Transformation (WT) are useful and widely used techniques for joint time–frequency analysis, allowing for the representation and study of signals that change over time. These methods provide a time–frequency representation, offering insights into how a signal’s frequency content evolves, which is crucial for analyzing nonstationary signals in various fields like structural health monitoring, signal denoising, and fault diagnosis [30,31]. Thus, processing a vibration signal transforms the raw data captured by sensors into useful information for diagnosing faults. First, the envelope a(t) and phase θ(t) are extracted from the analytical signal as follows:
a t = x 2 t + X ~ 2 t ,
θ t = t a n 1 x ^ t X t ,
where
x ^ t = 1 π + x ( t ) t τ d τ ,
X ~ t = X t + j x ^ t = a t e j θ t .
The notations depicted in Equations (8) and (9) are the next significations: x(t)—signal in time domain; x ^ (t)—Hilbert transform in frequency domain of x(t) signal; and X ~ (t)—complex signal of x(t) with values in time domain.
Therefore, the continuous-time Fourier transform of a signal x(t) is defined as
X ω = X e j ω = F x t = + x t e j ω t d t ,
transforms the signal from the time domain (t) to the frequency domain (ω). The signal spectrum is given by the squared magnitude function X ( t ) 2 , which describes the signal’s amplitude and phase across different frequencies.
While the full spectrum includes both magnitude and phase, the squared magnitude is frequently used to represent the power spectral density of a signal, indicating the distribution of signal power over frequency. This squared magnitude is especially useful in analyzing filters and understanding signal coherence. The combined application of the PSD algorithm and envelope analysis of the monitored signal has proven to be a highly effective signal processing technique for general vibration monitoring and, specifically, for diagnosing rolling bearing faults. This is particularly important for analyzing the impact loads of the plate, as it normalizes the power by the frequency bandwidth (g2/Hz), making the results independent of signal length. A logarithmic scale effectively visualizes differences in PSD magnitude across various frequency ranges, making it easier to discern how wear impacts overall vibration characteristics. This allows for a direct comparison of energy distribution across different soil types and ensures that the random vibration components are accurately quantified rather than being obscured by transient peaks.
Moreover, for the vibration analysis, we utilized the complex Cepstrum, which is defined as the inverse Fourier transform of the complex logarithm of the Fourier transform of the original signal [32,33].
x ̑ = 1 2 π π π log X e j ω e j ω n d ω .
Additionally, the short-time Fourier transform (STFT) method applies a windowing function to the signal, creating small overlapping sections that allow for a time-localized frequency analysis. The advantage of using this process is that it provides a time–frequency representation of the signal, where the result is a function of time and frequency, revealing how the frequency components change over time.
S T F T t , w = + x τ h t τ e j ω τ d τ ,
where h(tτ) is the window function, often represented by the shift parameter τ, applied to a segment of the original signal X(t) at different time intervals (τ). This process allows for the analysis of the signal’s frequency content over time by effectively analyzing short, shifted sections of the signal rather than the entire signal at once.
The autocovariance of the function C ^ x x τ is defined as a measure of the degree to which a time series X(t) at one time point is correlated with itself at another time point, reflecting the relationship between different points in the series [34]. Therefore, the autocovariance function can be thought of as measuring the memory or self-similarity of the deviation of a signal about its mean level. Therefore, autocovariance can be determined as
C ^ x x τ = 1 T τ 0 T τ x t μ ^ x   x t + τ μ ^ x d t ,   for   0 τ < T   and   zero   else ,
where μ ^ x represents the mean of the signal amplitude of x(t).
The use of any of the processing methods listed above provides specific information on the configuration and composition of the tested signals (e.g., belt slippage and engine speed fluctuation in the vibratory plate compactor). By combining these methods, the unique advantages of each were utilized to maintain high accuracy and minimize evaluation time, making the approach applicable to the diagnosis of complex technological equipment. This paper integrates the composite time–frequency transformation into a structured framework alongside power spectral density (PSD) estimation, Cepstrum analysis, and a set of stochastic estimators—including histograms, cumulative histograms, covariance, and error functions. This comprehensive approach allows for a more precise interpretation of how disturbances impact the operating conditions of the vibratory plate compactor.

2. Materials and Methods

2.1. Research Plan

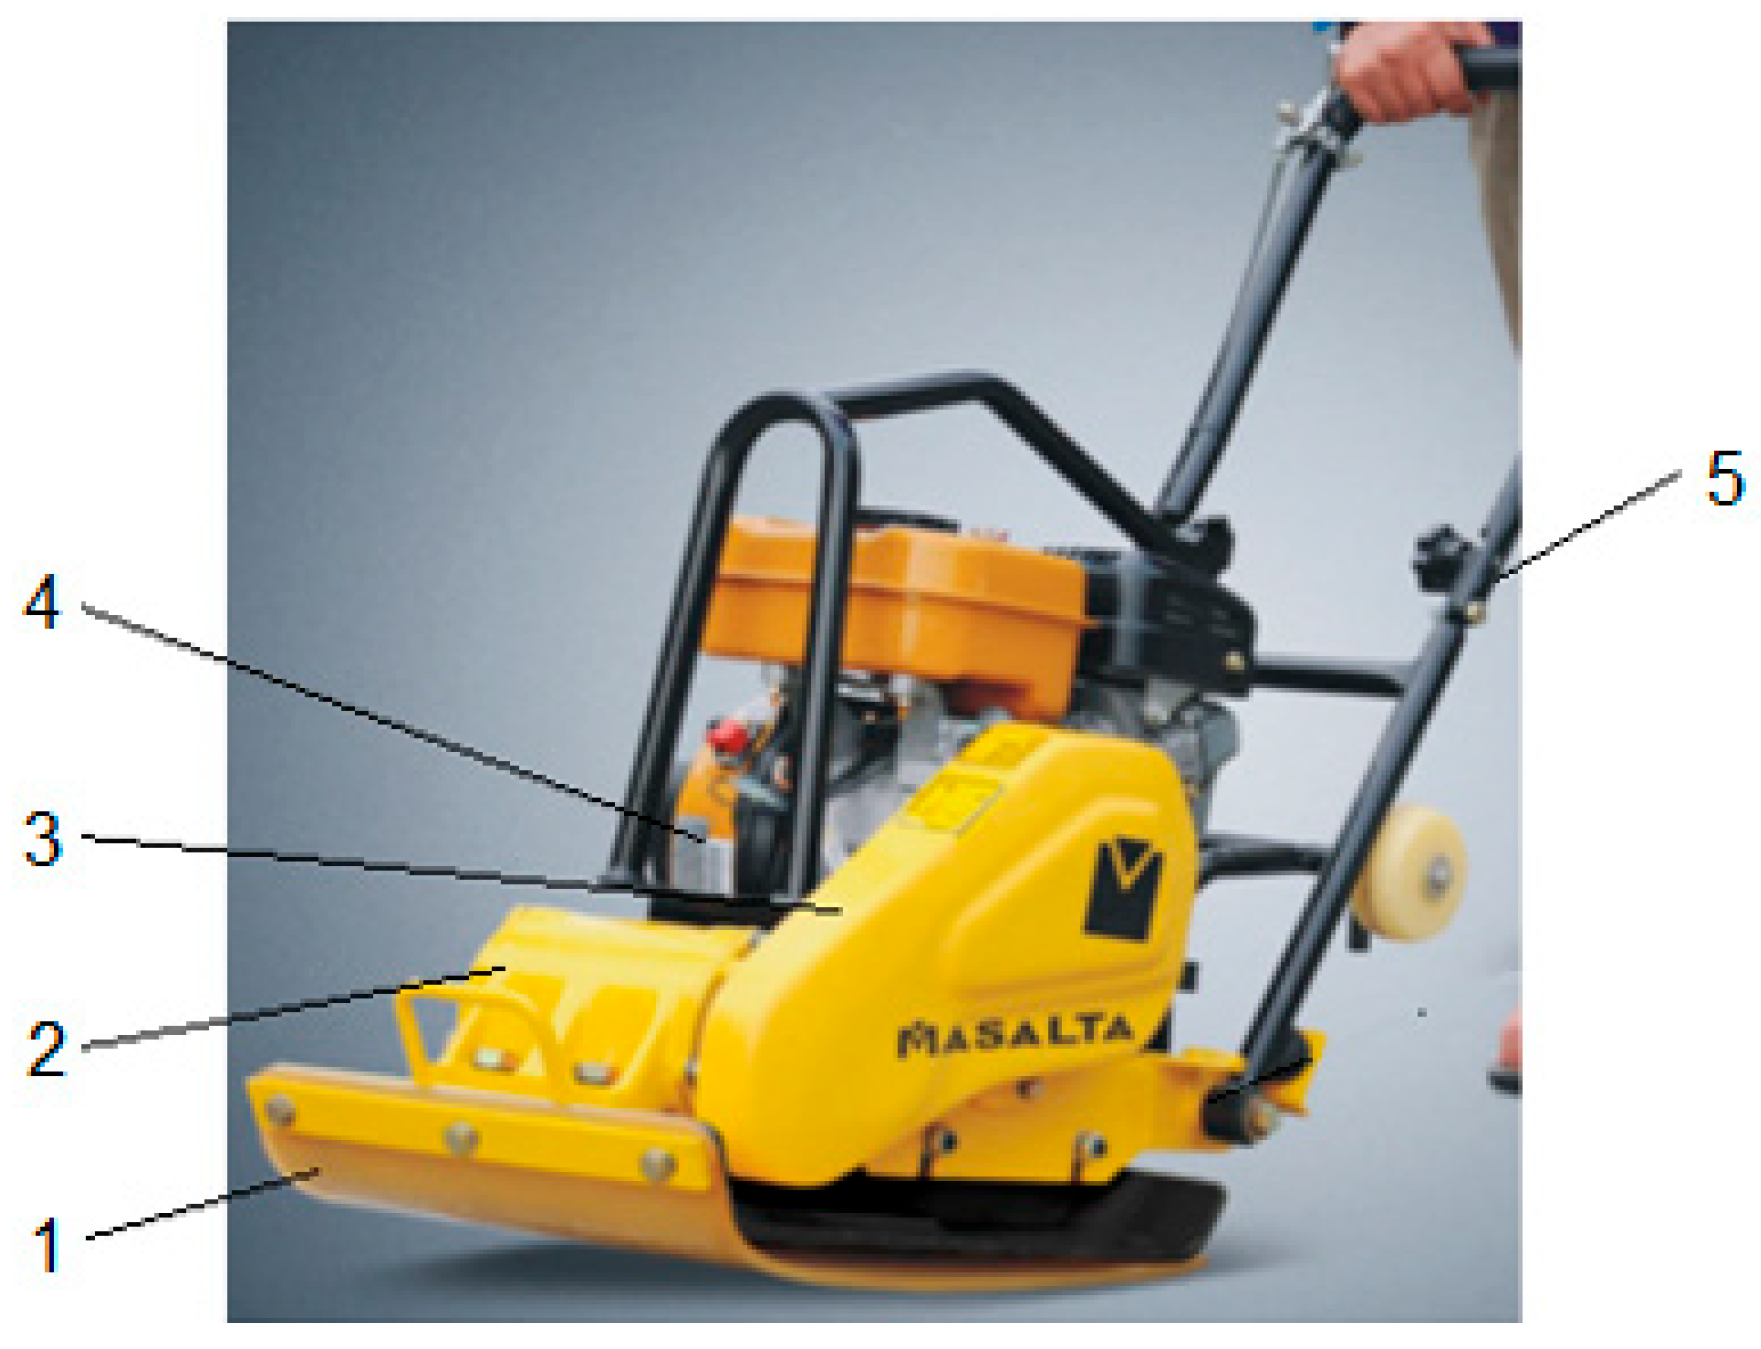
The paper develops a study focused on the Masalta MS 60-2 vibratory plate compactor (Masalta Engineering Co., Ltd., Hefei, China) (Figure 4). The technology utilized by this equipment transmits high-frequency vibrations into the soil via a harmonic perturbing force, expressed as F(t) = F0sin(ωt), where F0 is the force amplitude and ω is the excitation pulsation. The force amplitude is variable and depends on ω, expressed as F0 = m0, where m0r represents the static moment of the dynamic imbalance [35].
From a structural point of view, the plate compactor consists of a base plate and a vibration generator (vibrator) driven by a combustion engine through V-belt transmission. The equipment is guided by an operating handle. The technical parameters of the Masaltsa MS 60-2 plate compactor are detailed in Table 1.
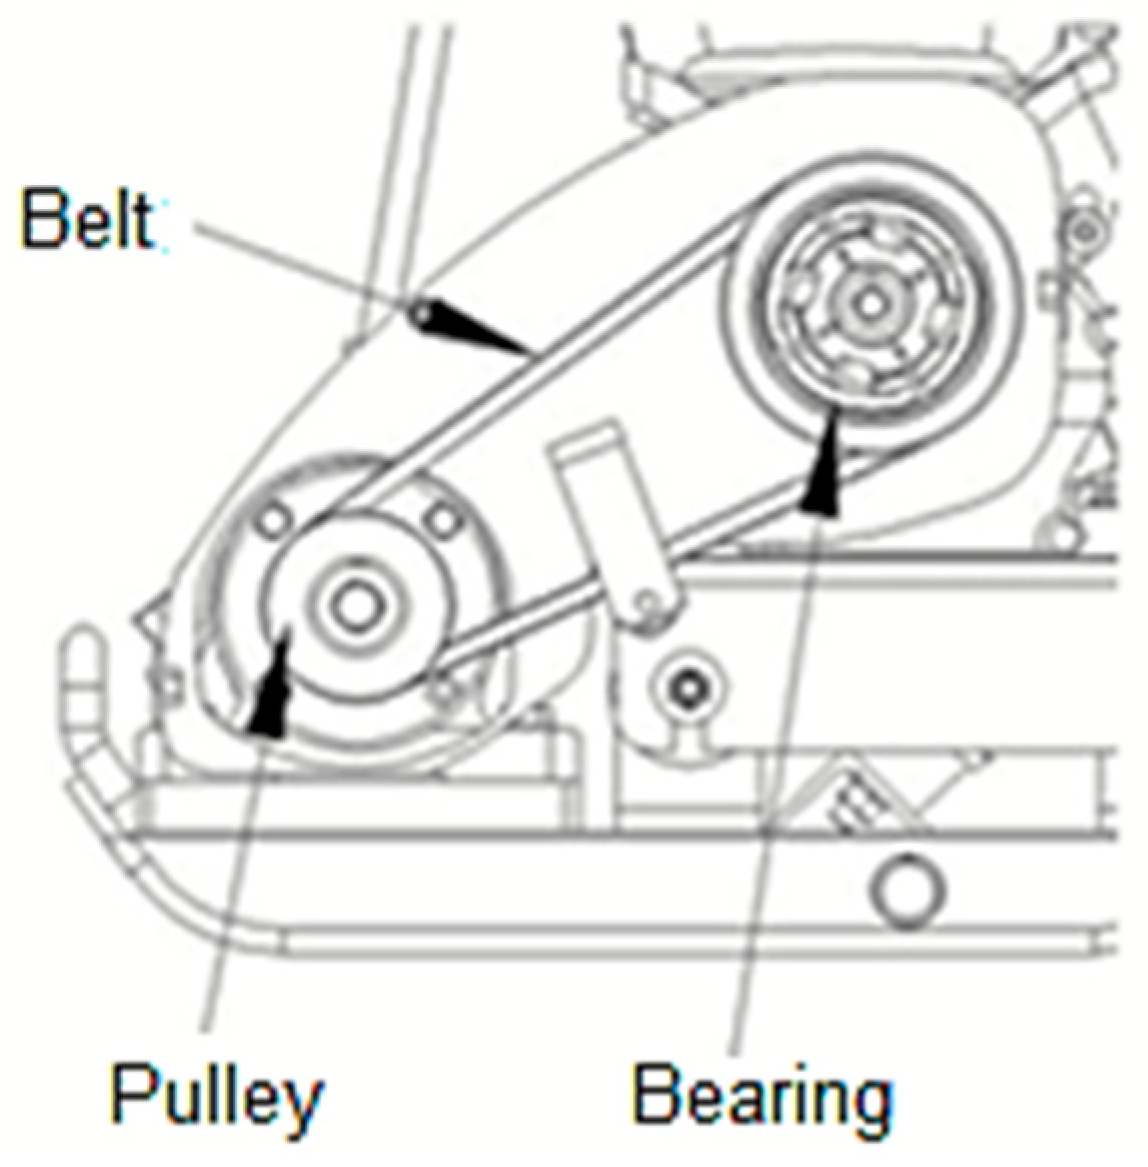
The lower part of the compaction plate consists of a vibrating plate and a vibrator device with a built-in eccentric rotary shaft. Power is transmitted from the centrifugal clutch on the engine’s output shaft to the eccentric shaft via a pulley, which drives an SPA GB/T 11544-2012 [36] model V-belt (Hyrubbers Co., Ltd., Qingdao, China) (Figure 5).
The performance of the vibratory plate compactor is influenced by several interacting factors. These include the engine’s RPM, the eccentric weight’s imbalance, the compactor’s mass, the vibration frequency, the contact conditions between the plate and the soil, and the dynamic response of the soil to the transmitted force. Any change in these parameters alters the overall system dynamics and can lead to additional, unpredictable vibrations—such as increased vibration amplitude or changes in spectrum frequencies. These effects are particularly pronounced, especially near the resonant operating state or during bouncing (non-continuous plate–soil contact), impacting both compaction efficiency and stability.

2.2. Laboratory Test Stand

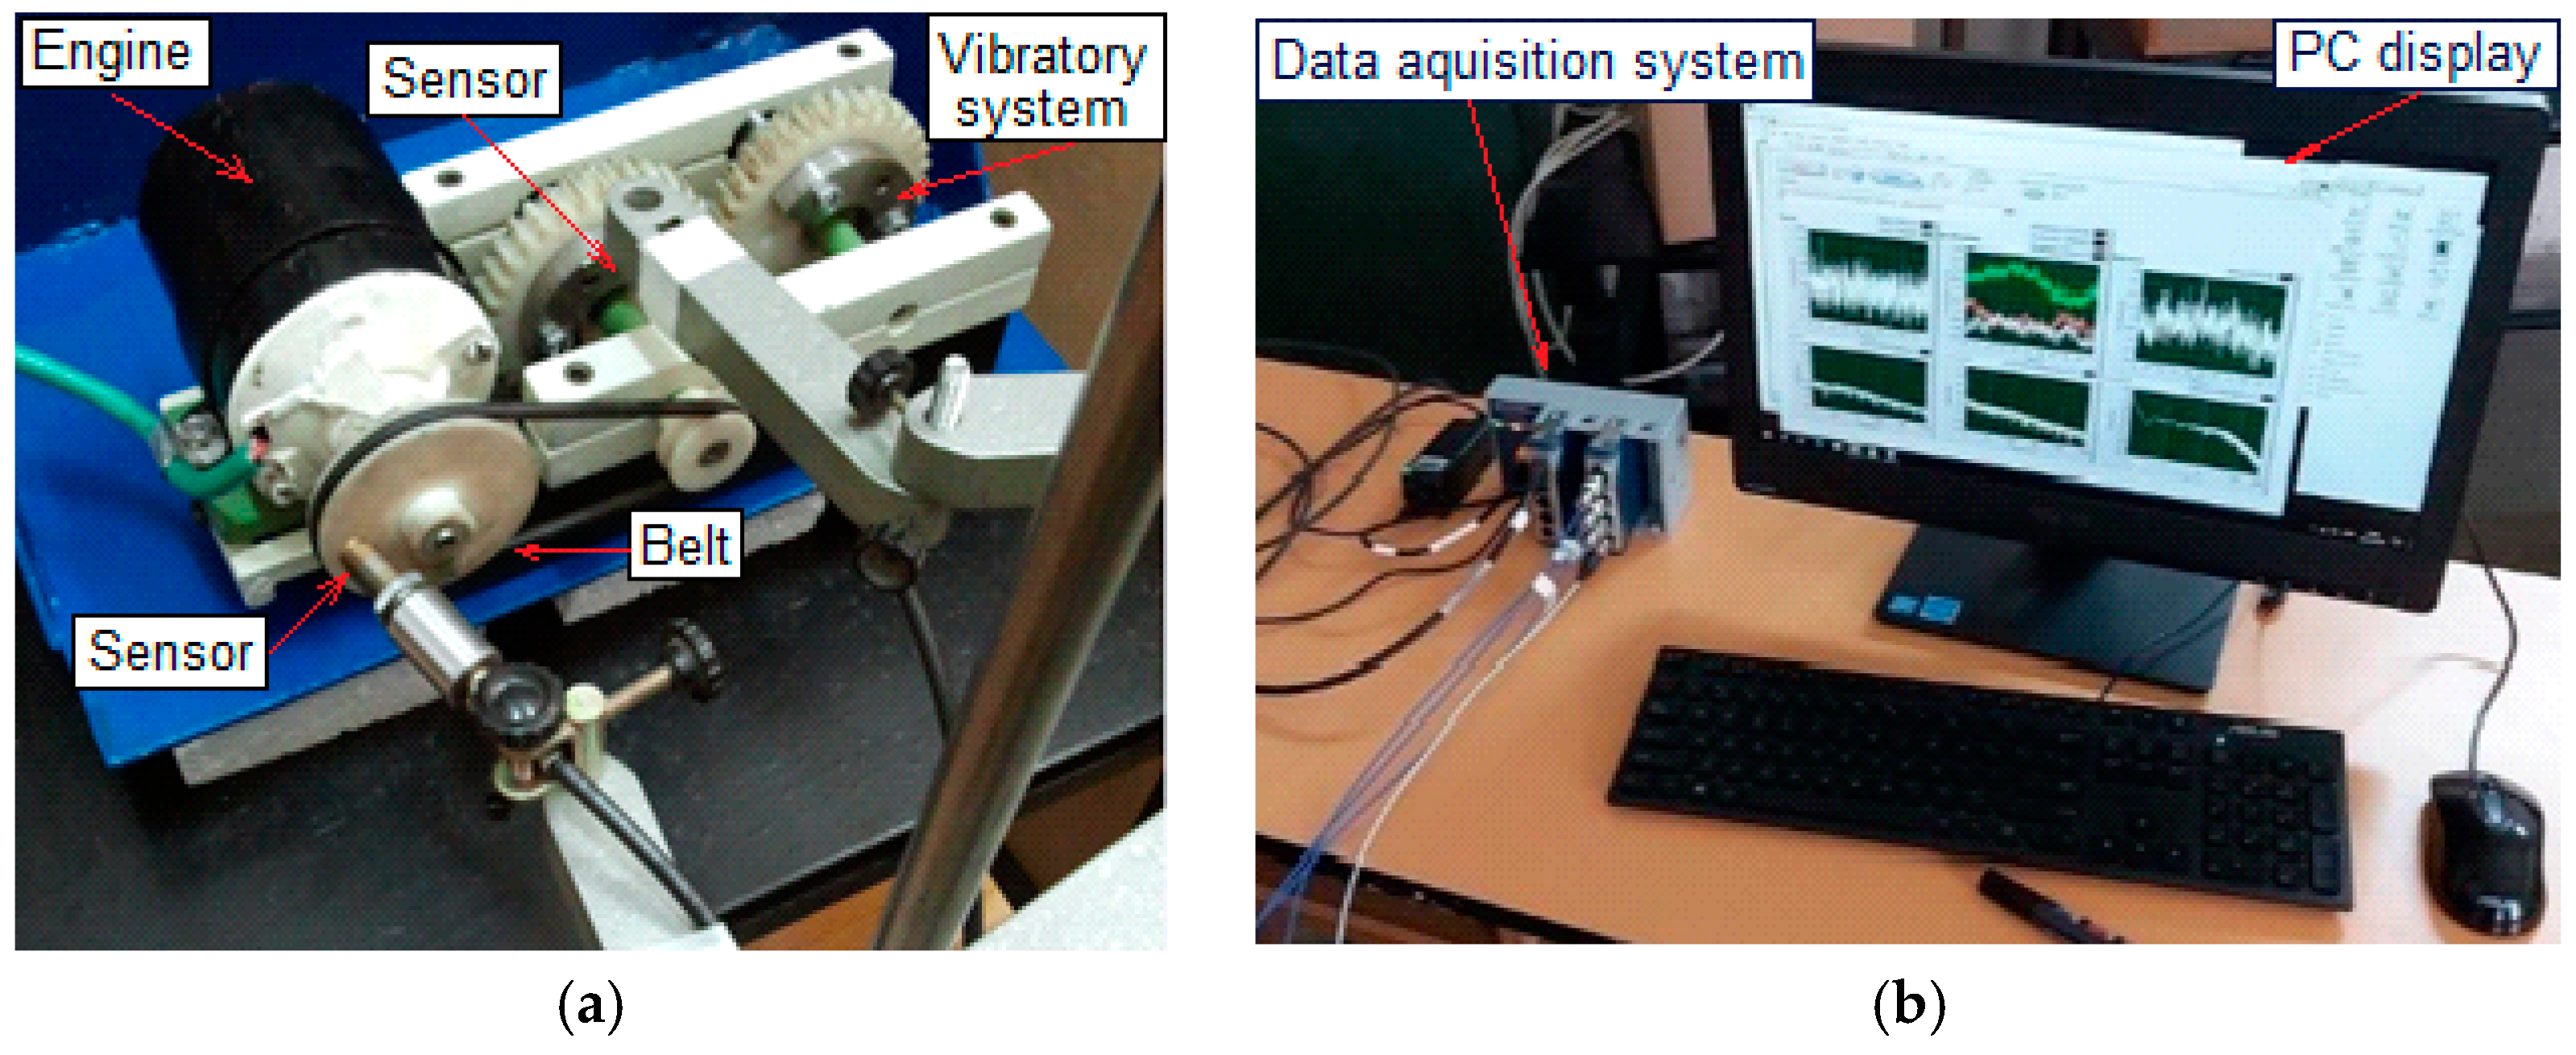
The experimental setup used for the laboratory tests represents a transmission system similar to that of a plate compaction, which includes an electric motor, a vibratory device, and a belt-driven mechanism (Figure 6a). The system’s dynamics were investigated using sensors such as PCB Piezotronics 352C03 accelerometers (PCB Piezotronics, Inc., Depew, NY, USA) and motor current sensors to capture vibration signals during the operation of the transmission system. The acceleration transducer converts real-time measurements of vibration amplitudes into electrical signals (Figure 6b), which are used to analyze vibrations and assess the condition of the mechanical components in the system. The main parameters of the stand are presented in Table 2.
The stand can be configured to study various operational conditions, with vibration data captured in real time using accelerometers. The working assumptions for the numerical model of the vibration-driven mechanical system include known tensile stress, negligible variation in axial force within the belt, and constant torque at the drive wheel’s axle. These assumptions simplify the system’s behavior, allowing for accurate numerical modeling of the forces and rotational effects acting on the components.

2.3. Experimental Setup and Methods

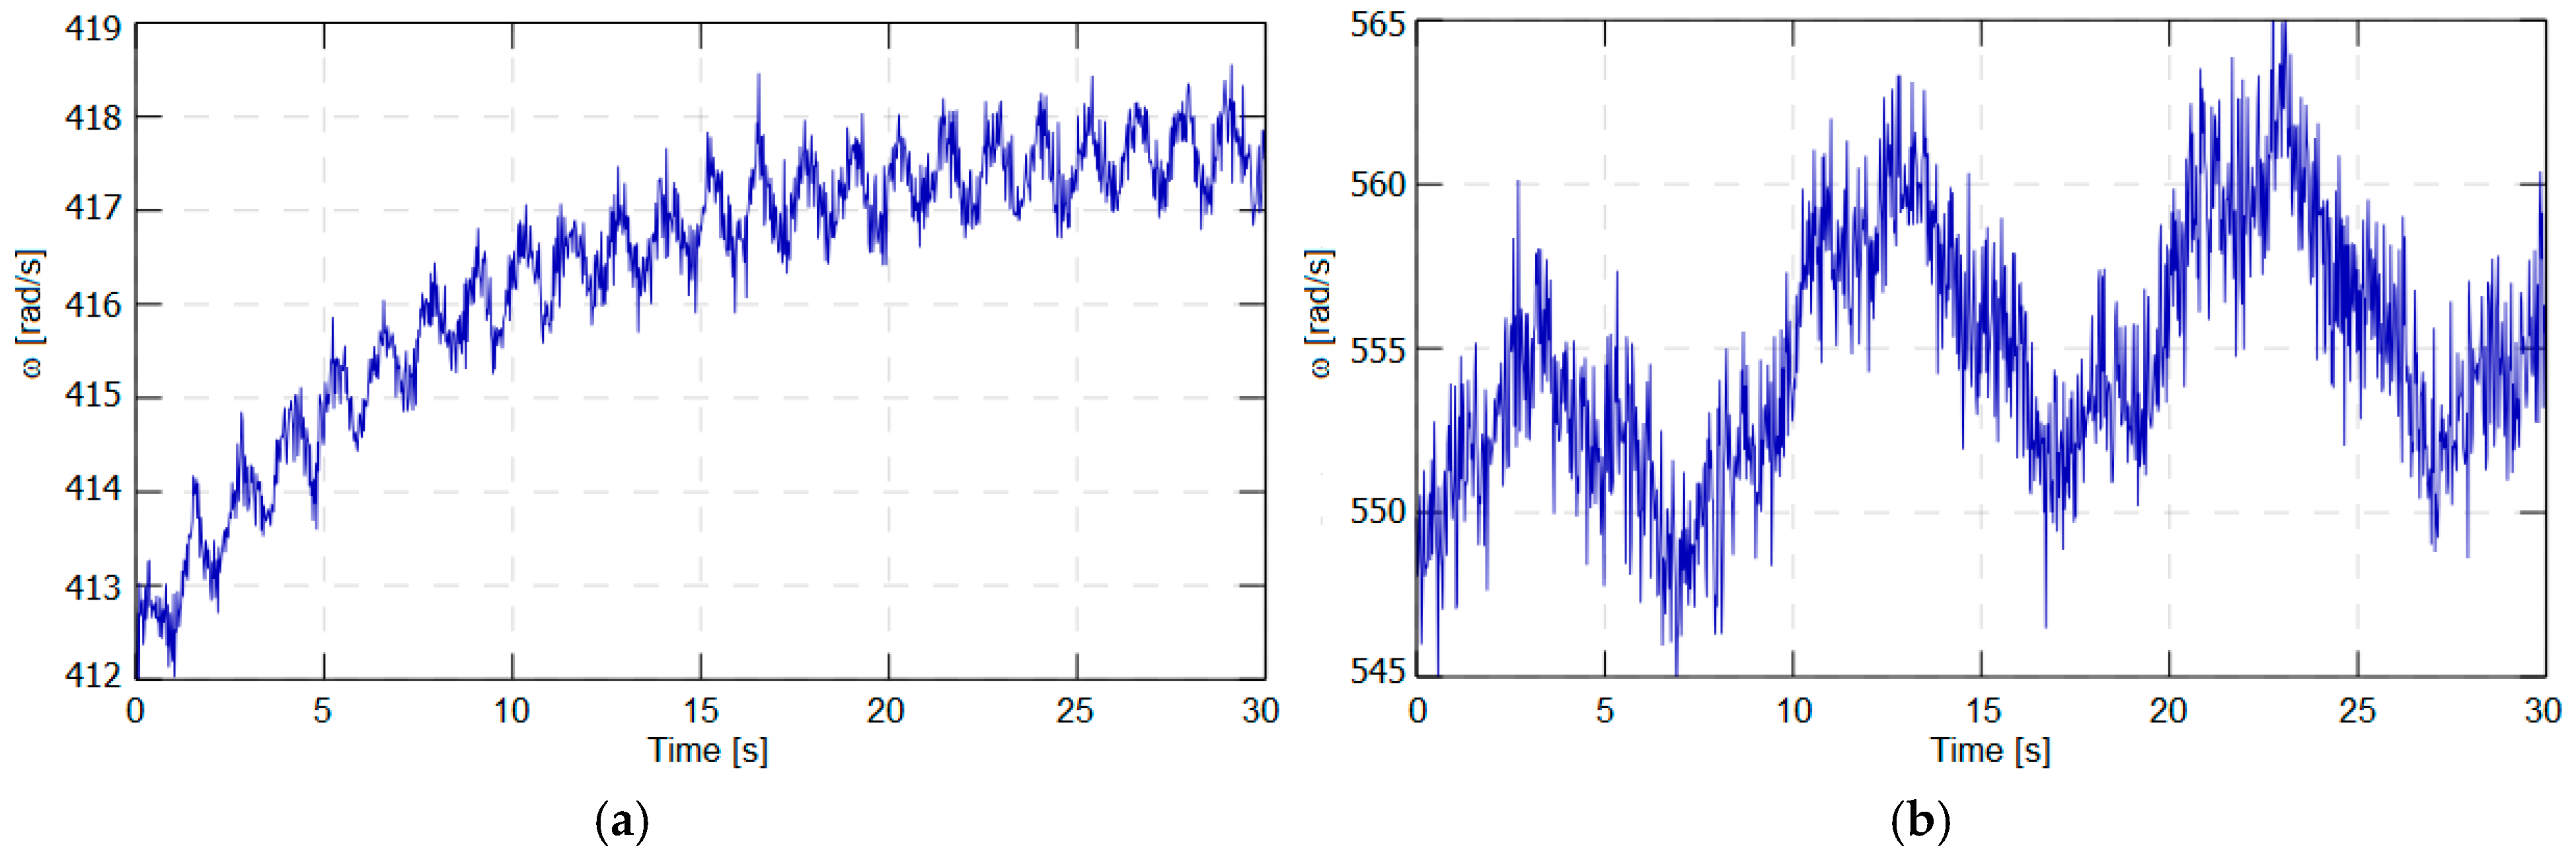
All signals provided by the transducers were synchronously acquired using an NI cDAQ-9174 chassis (National Instruments, Austin, TX, USA), equipped with specialized C-Series modules: an NI-9233 for the accelerometers and an NI-9237 for the strain gauges (see Figure 6b). The signals measured from the transmission system highlight variations in input and output based on the transmission’s speed ratio. Figure 7 illustrates how the angular velocity changed over time for both the motor shaft and the vibratory device. A brief transitory period was ignored until the system reached a stable state to ensure that the measurements were not disturbed.
Further processing and data management were supplied by an application developed in LabVIEW (v2007). Post-processing and analysis were performed using dedicated scripts developed in Matlab software (v2023). The signal processing techniques implemented in this study are illustrated in the block diagrams in Figure 8, which clarify how signals are transformed, analyzed, and manipulated throughout the various processing stages.
In this regard, we investigated the input and output signals from this experimental model to identify the operating state. Using a standard post-acquisition signal processing technique, a short segment of the acquired signals was extracted after the system reached a stable state (steady-state operation), bypassing the initial transient phase. This selective signal segmentation eliminates unwanted components or start-up disturbances, ensuring more reliable data for analysis and decision-making.

3. Simulation Results of the Dynamic Behavior of Compaction Equipment Under Various Operational Conditions

3.1. Dynamic Simulation of Vibratory Plate Compactor

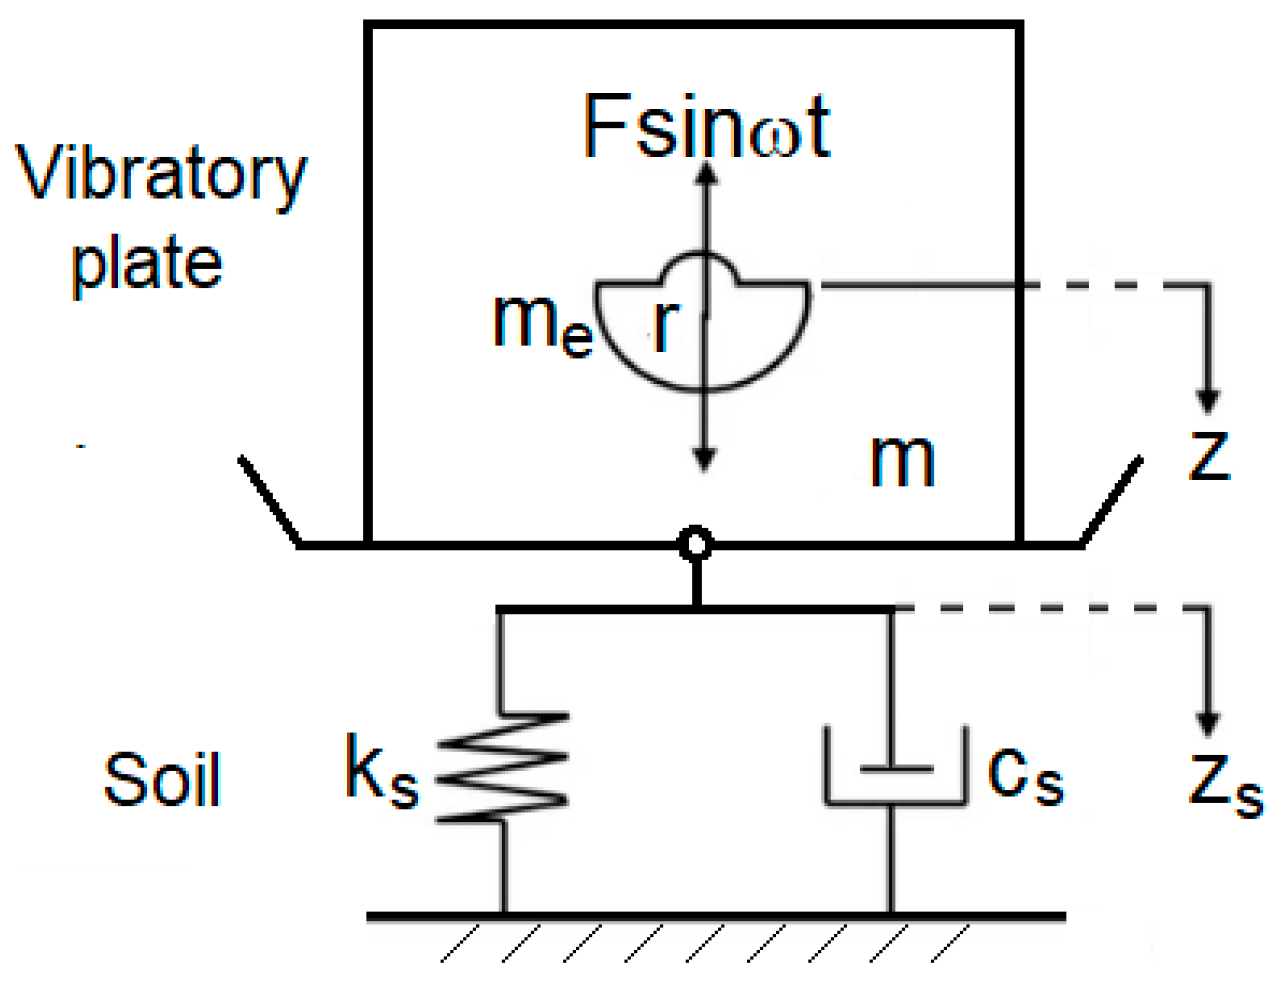
The plate compactor–soil system can be modeled as a forced oscillator with one degree of freedom (Figure 9), where the plate is considered a rigid body and the elasticity is derived from the modulus of the subgrade reaction (k).
The governing differential equation for the vertical displacement of the vibratory plate is as follows:
m z ¨ s ( t ) + c s z ˙ s ( t ) + k s z s ( t ) = m e r ω 2 sin ω t ,
where m—plate mass; me—mass of the eccentric weights; ks—soil stiffness; and cs—soil damping coefficient. The contact force F s transmitted into the soil is expressed as F s = k s z s + c s z ˙ s . This is applicable only if the condition x1 > 0 is met; if x1 < 0, contact force Fs becomes zero. The following data were used to establish the case scenario for the subsequent analyses: m = 62 kg; me = 2.7 kg; f = 93.3 Hz; and F = 10,500 N.
The most widely used relationship for converting Young’s modulus (Es) into the modulus of the subgrade reaction (k) for a plate of specific dimensions is derived from elasticity theory:
k = E s B 1 ν 2
where
ν —Poisson’s ratio of the soil (approximatively 0.3 for rigid/compacted soils);
B—characteristic dimension of the plate (width or diameter). In the case of the plate (with 500 × 360 mm), the average dimensions are approximately 0.4 m.
Determining the geotechnical data of the soil (e.g., whether it is soft, medium, or hard) is a very important aspect of the vibratory compaction process. This information is essential for maximizing compaction efficiency, preventing soil over-compaction, and assuring equipment safety. In this context, these soil parameters are summarized in Table 3.
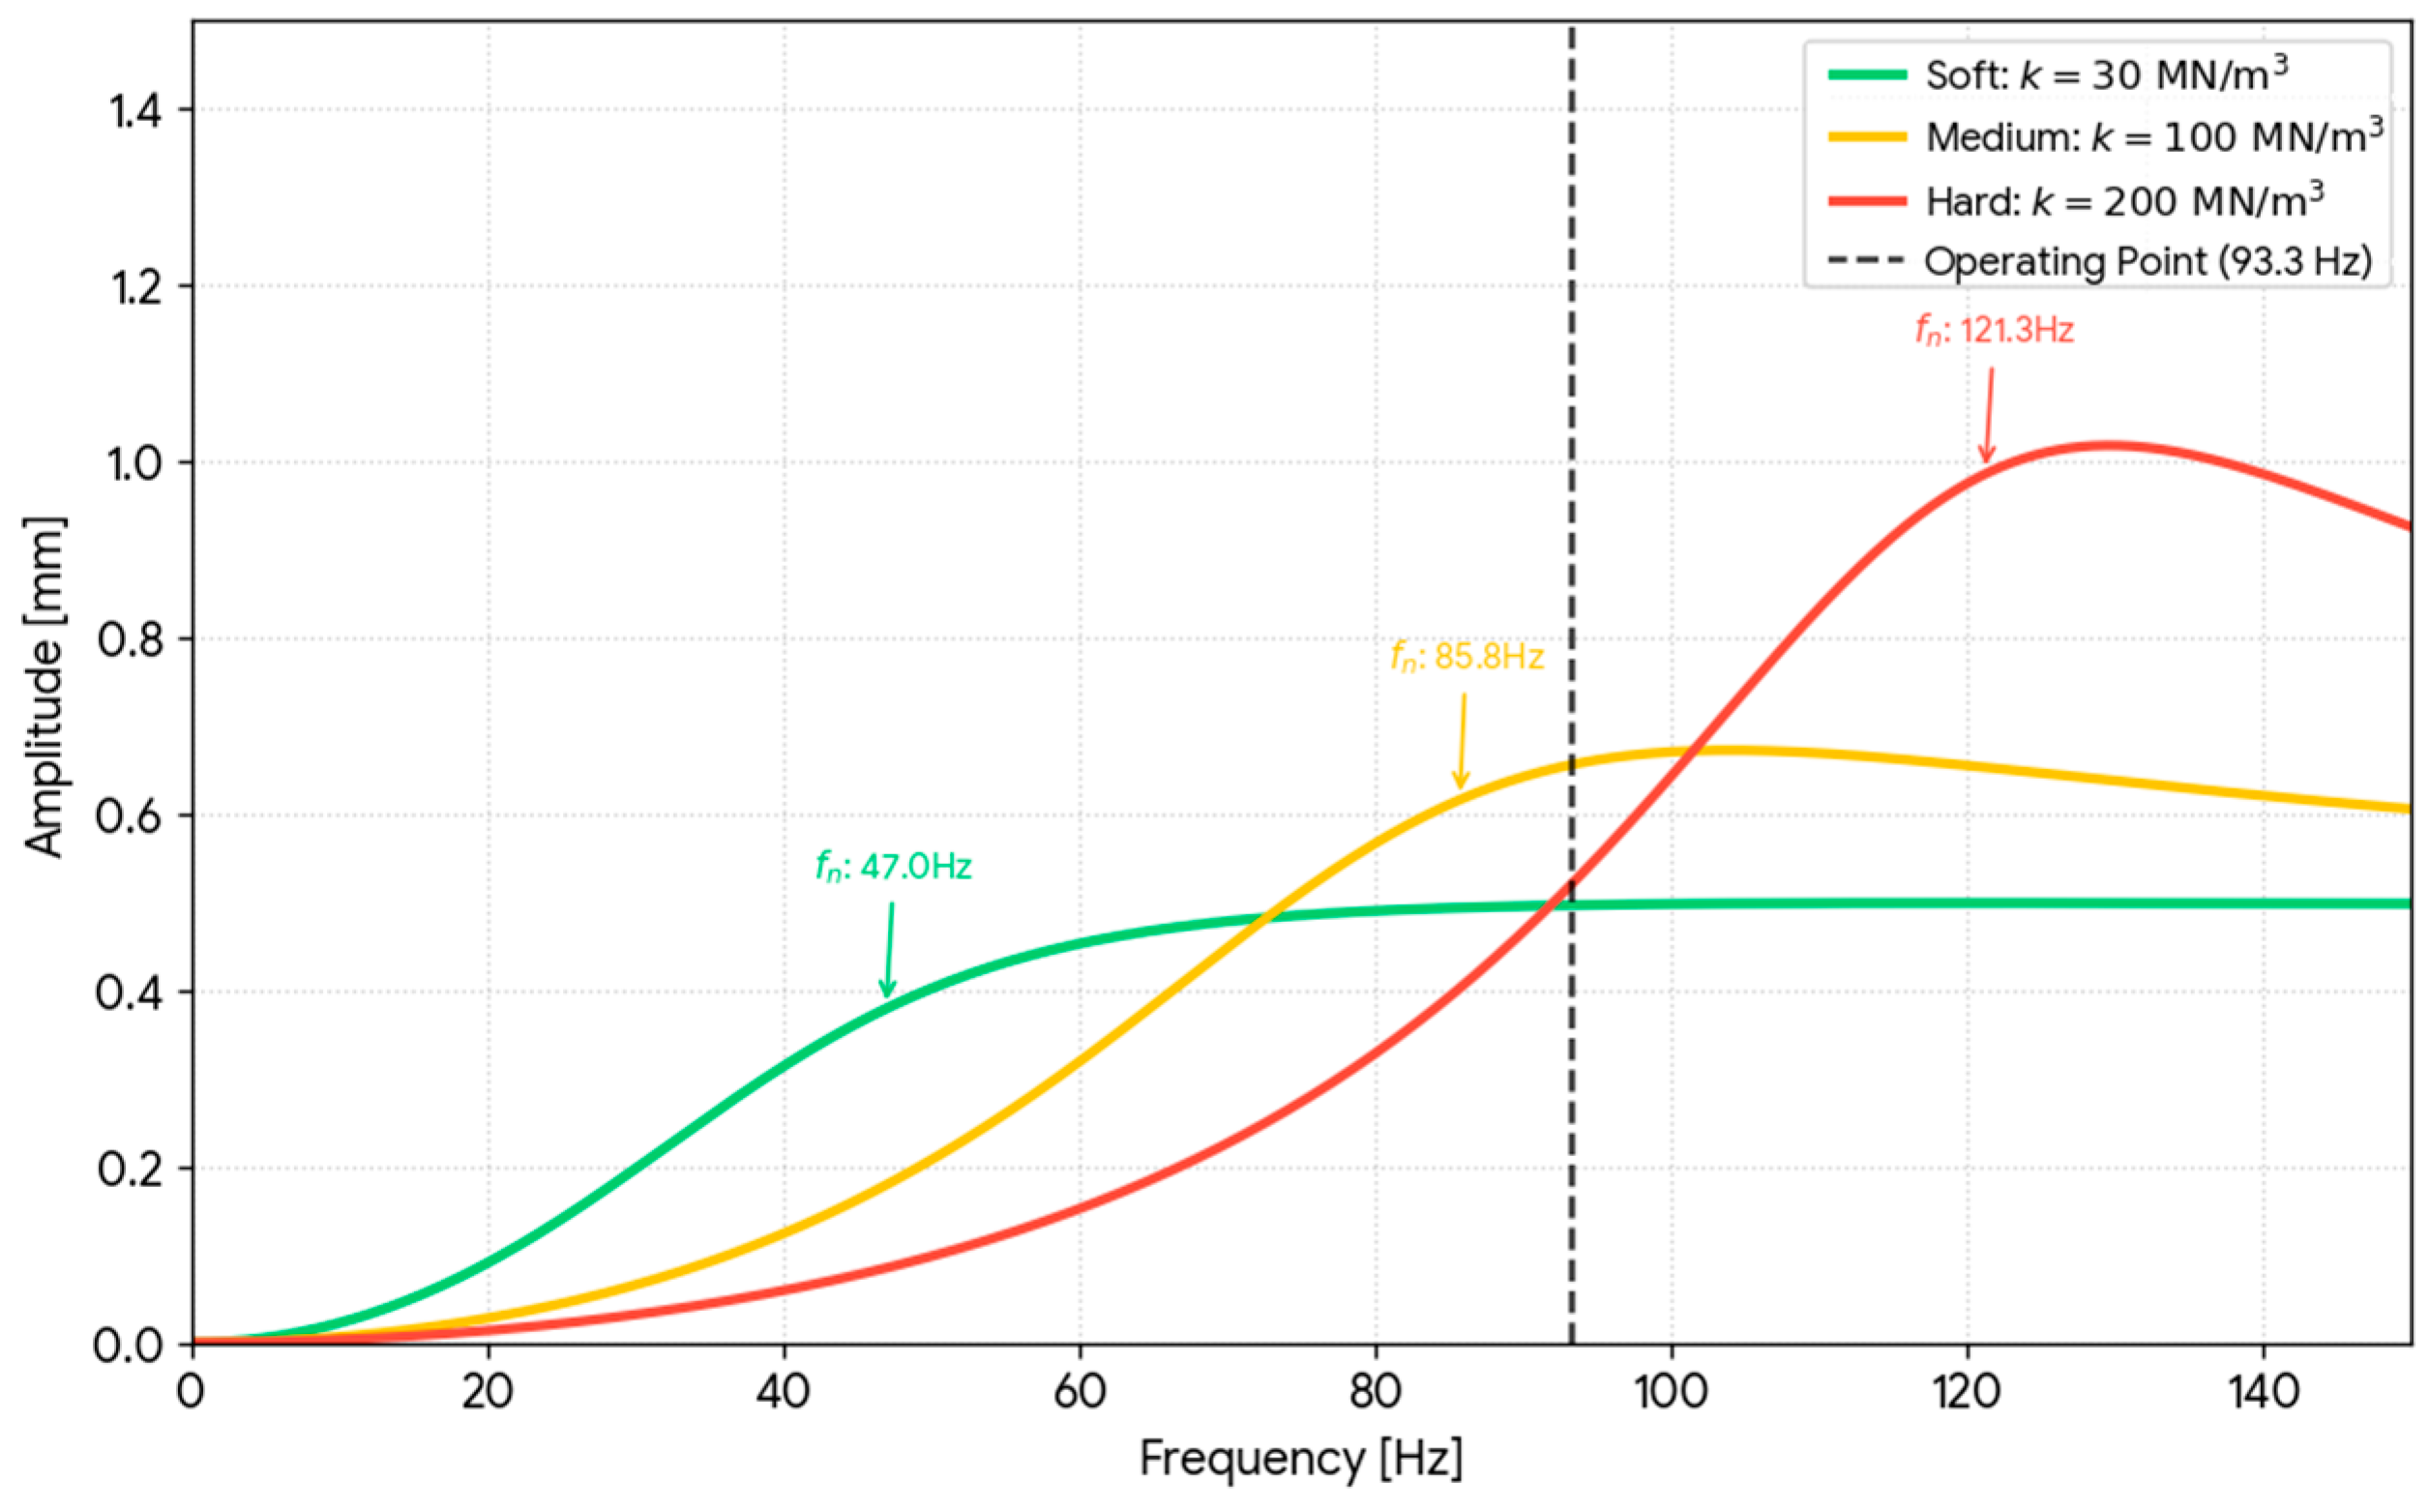
The simulation results demonstrate that the soil–vibratory plate system operates differently according to soil category, as the interaction between the compaction machine and the soil varies significantly with soil stiffness. The relationship between the soil categories and the simulation results is detailed in Table 4, focusing on the main parameters that characterize the dynamics of the equipment–soil system.
The results confirm that the soil–vibrating plate system changes its dynamic equilibrium state as ground stiffness increases (Figure 10). On soft soil, the system operates in pre-resonant state, where energy is dissipated predominantly through plastic deformations, without reaching maximum transfer efficiency. On medium soil, the system enters the resonance zone, marking the optimal point for densification and energy transfer. Finally, on hard soil, the system transitions into post-resonance—a phase in which energy is reflected towards the machine, risking the decompaction of the surface layer.
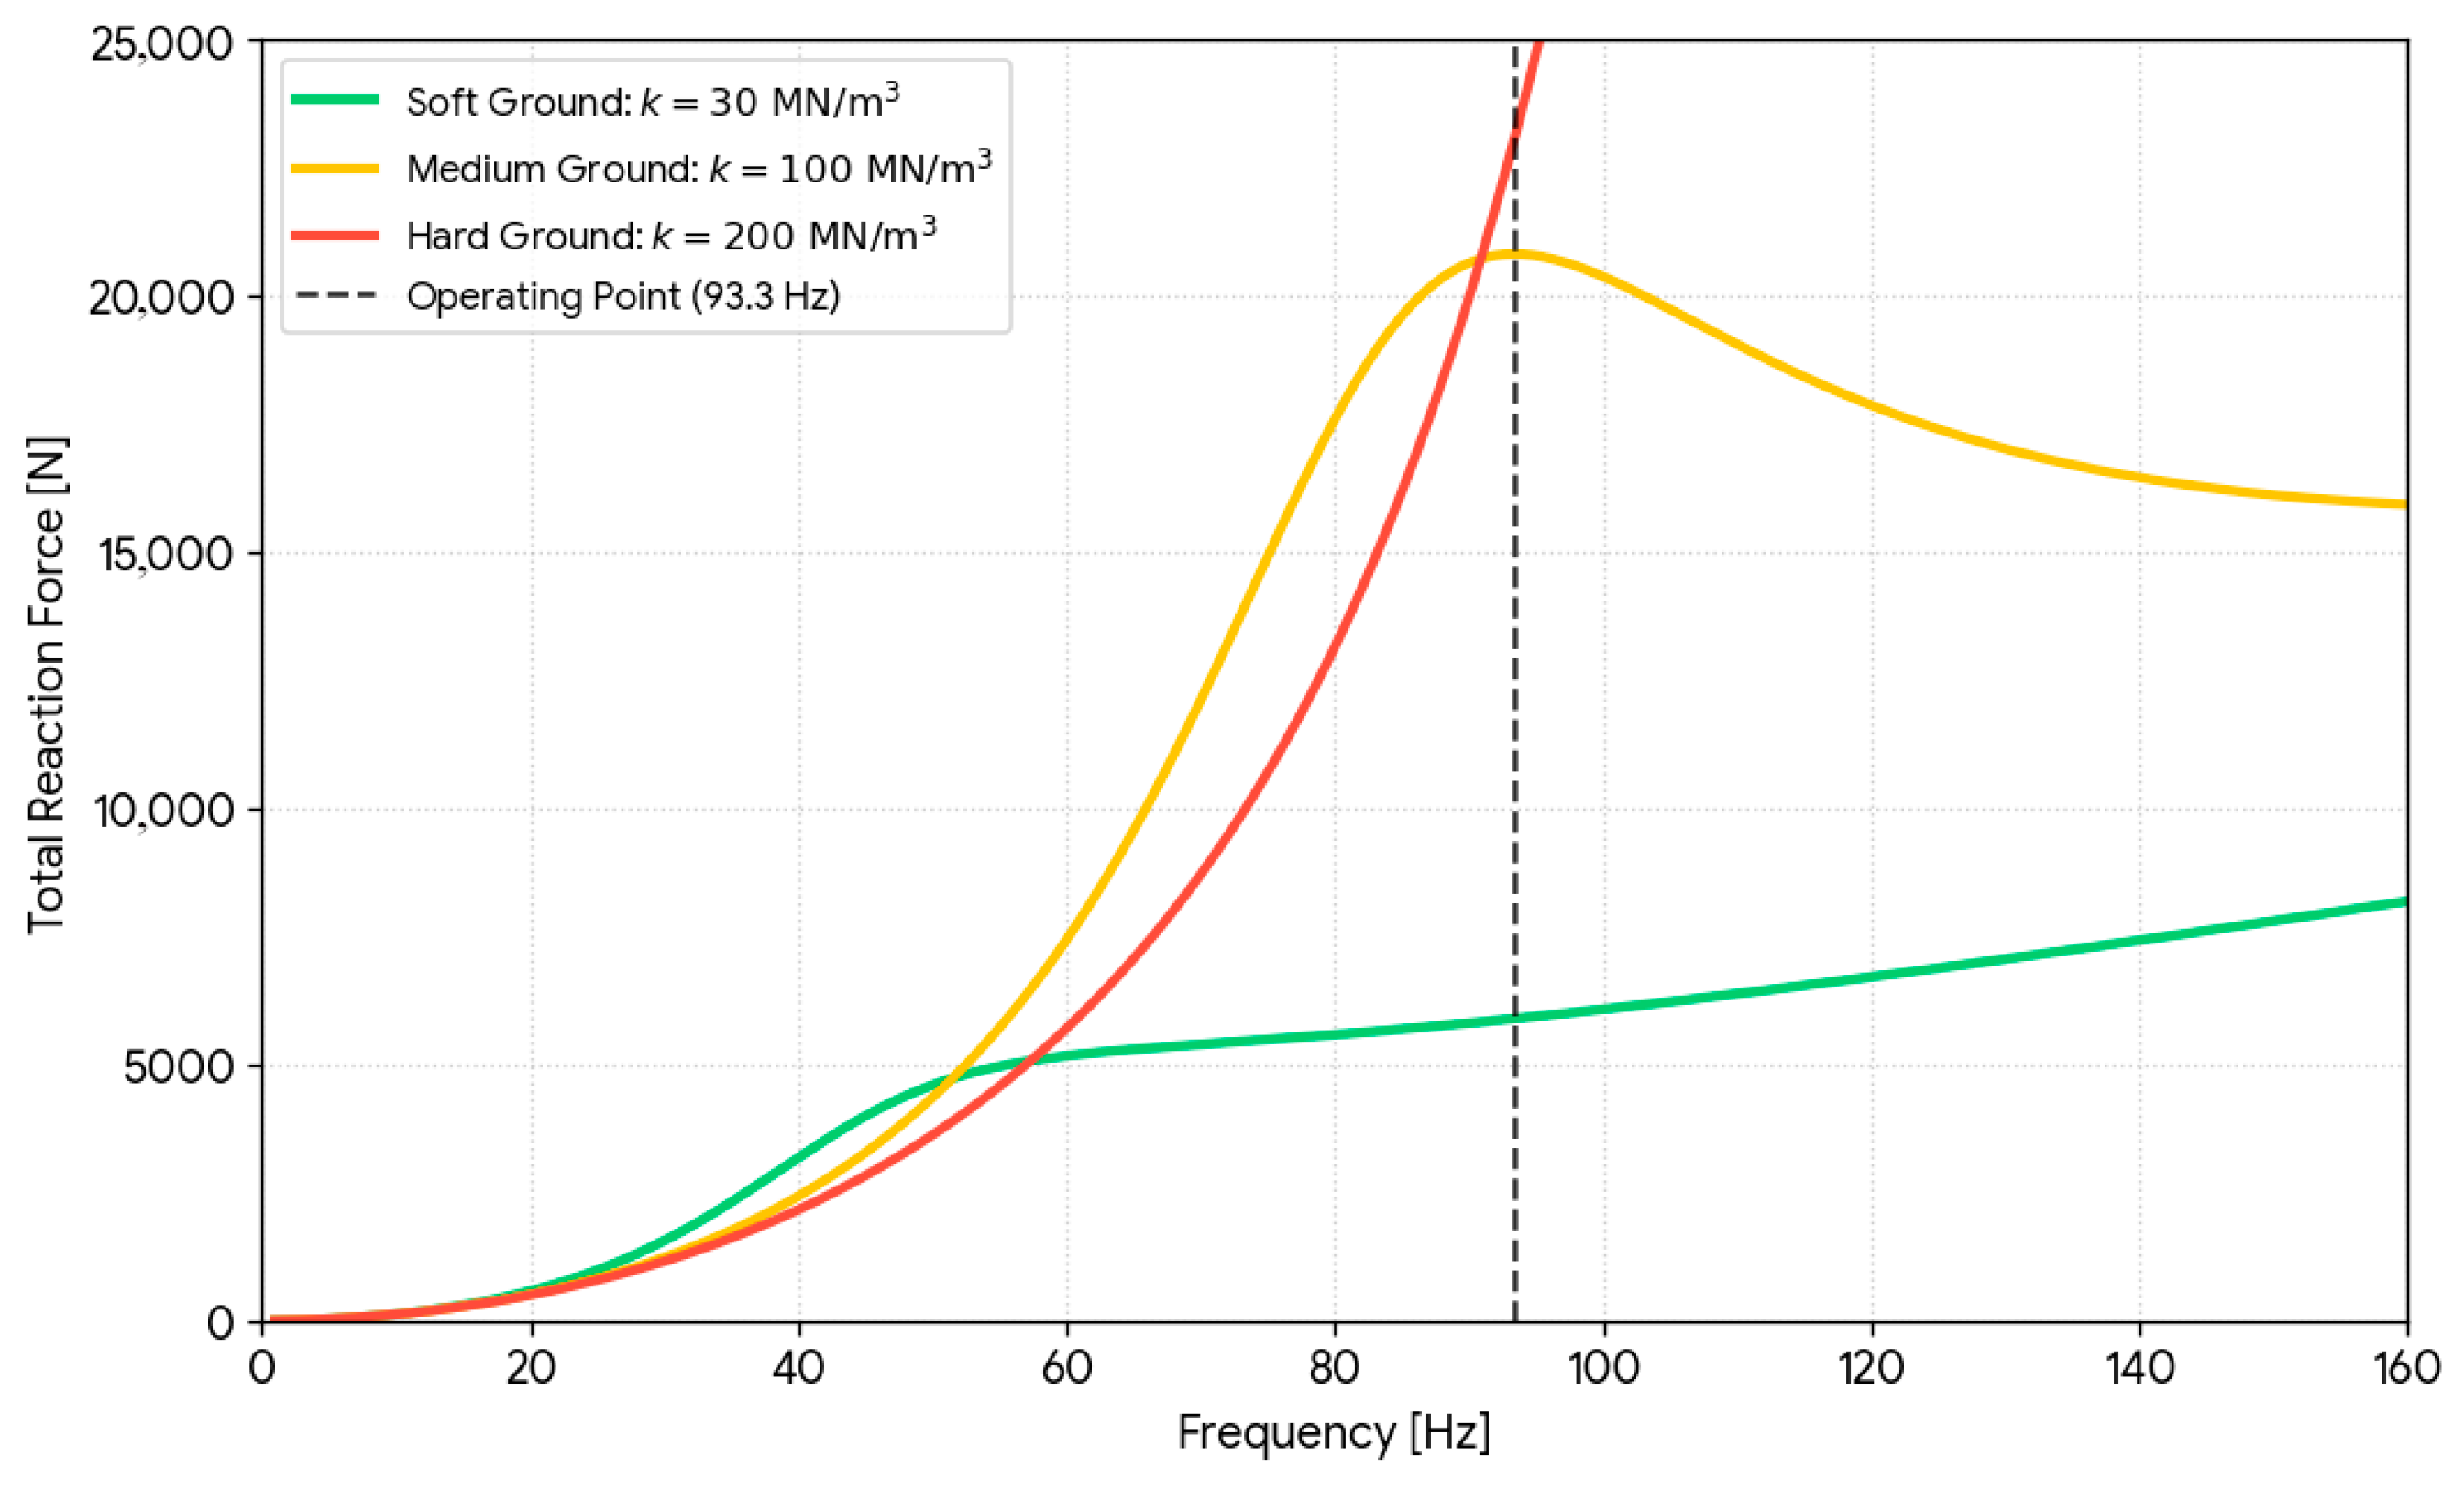
The variation in amplitude as a function of frequency highlights that the plate compactor reaches maximum efficiency on medium ground (yellow), where the operating frequency (93.3 Hz) is close to resonance (85.8 Hz) with higher resonance peak ( 0.7 mm). On soft ground (green), the resonance peak is relatively low (≈0.5 mm) due to high ground damping; consequently, at an operating frequency of 93.3 Hz, the plate remains stable but provides insufficient compaction energy. On hard ground (red), the resonance peak is the highest because the rigid ground reflects energy with minimal damping. Thus, at operating point (93.3 Hz), the amplitude is lower (≈0.55 mm), but the system is under extreme mechanical stress. Therefore, a graph representing the amplitude of the ground response force (Fs) as a function of the working frequency allows for the visualization of the three regimes (pre-resonance, resonance, and post-resonance) and highlights how peak efficiency moves and changes depending on ground stiffness (Figure 11).
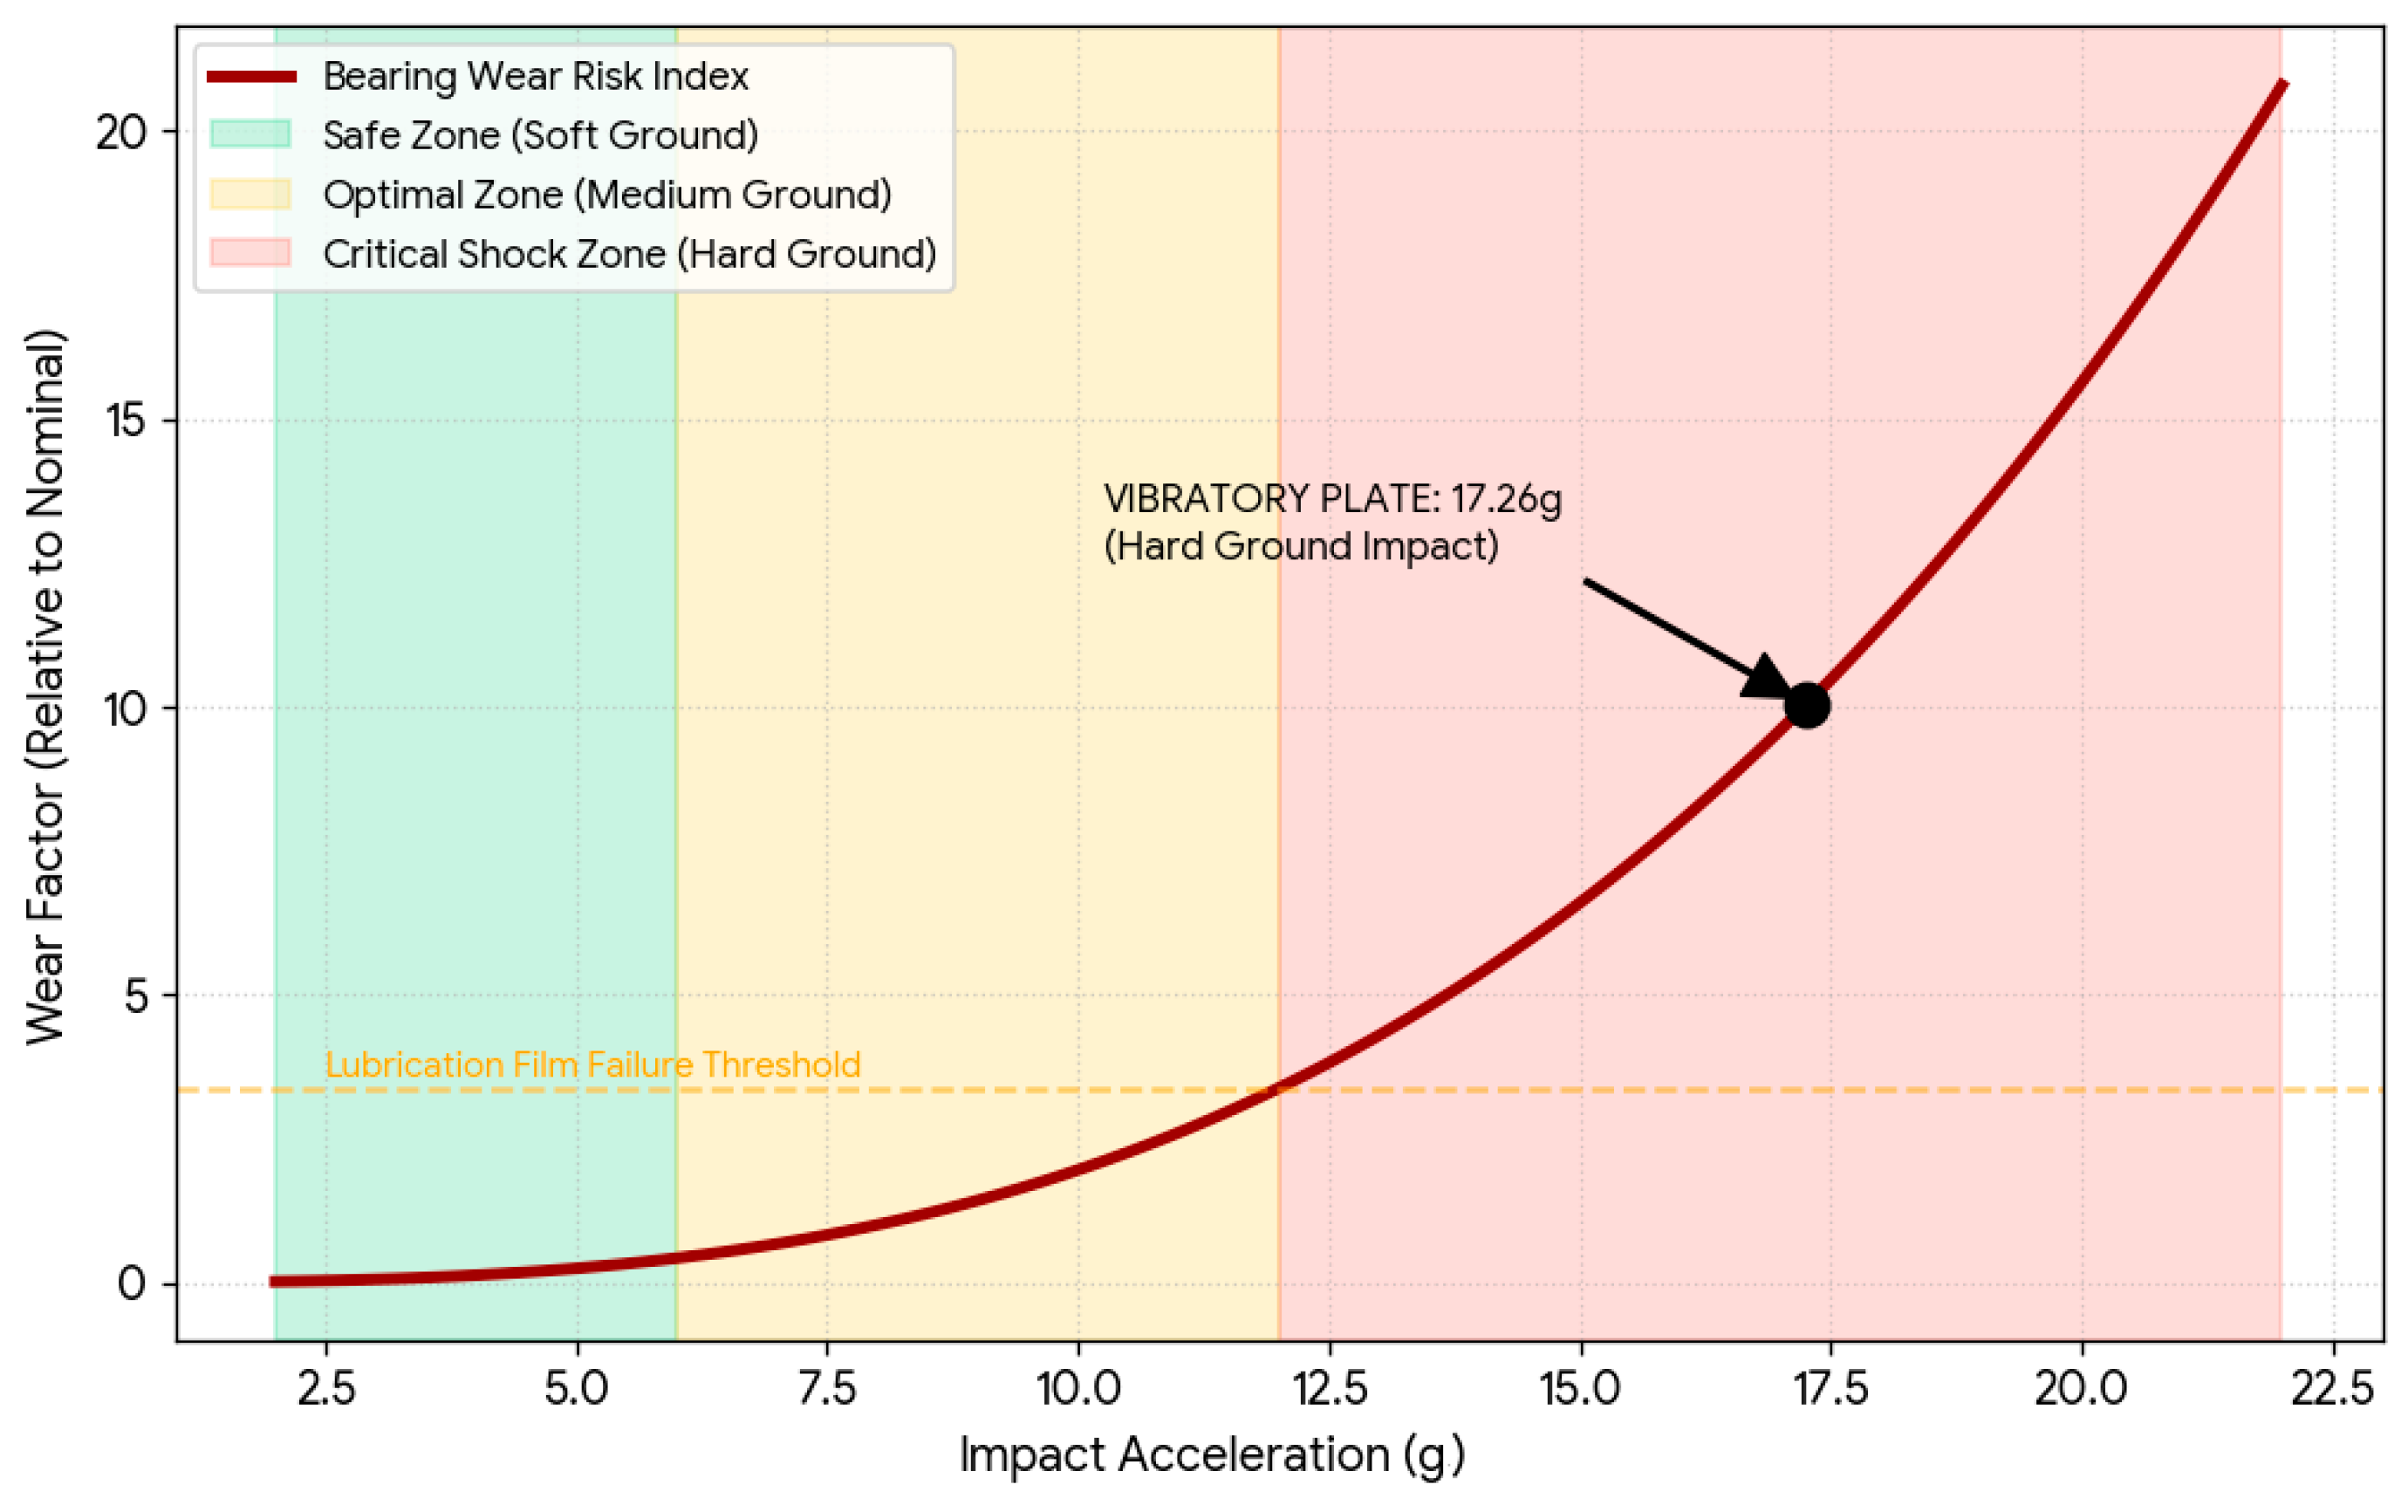
Thus, the vibratory plate is recommended for operation on medium ground, where resonance amplifies the soil reaction force to 200% of the nominal input. However, when transitioning to hard ground, the soil reaction becomes a destructive percussive force. To prevent mechanical failure, the operator should stop compaction once the ground reaches high stiffness, as the energy is no longer densifying the soil but instead being reflected into the machine’s internal components. On rigid ground, due to low internal damping and the lack of soil deformation, vibration transmitted by the plate compactor transforms into percussion (exhibiting a “jumping” motion). In this scenario, the impact forces experienced by the equipment’s components (e.g., the bearings) critically exceed their nominal values, which can lead to structural damage. The bearings in a vibratory plate are designed to withstand radial loads, but they are highly sensitive to the impulsive force generated during operation in the post-resonance regime. The graph in Figure 12 correlates the soil category with the impact acceleration and the resulting risk of bearing failure. This extreme load—at a centrifugal force of 10,500 N, where peak impact on rigid ground generates accelerations of 17.26 g—effectively multiplies the stress on the exciter bearings. This degradation follows a power law relative to the impact force (typical for ball bearings), significantly reducing bearing life compared to standard operation on softer materials.
In the critical shock and degradation regime (>12 g), the wear factor increases by a magnitude of 10× compared to the safe zone. This accelerated degradation is driven by three primary mechanical failures: surface micro-pitting (where high-frequency shockwaves cause repetitive “blasting” of the bearing raceways, leading to material spalling), thermal spikes (intense frictional energy causing rapid temperature increases that significantly degrade the viscosity and lubricating properties of the grease or oil), and eccentric shaft deflection. In the latter case, the extreme magnitude of the impact forces induces microscopic bending of the shaft, resulting in misaligned, uneven loads that jeopardize the integrity of the bearing rollers. This aspect will be analyzed in the next phase of the study.

3.2. Dynamic Simulation of the Belt Operation

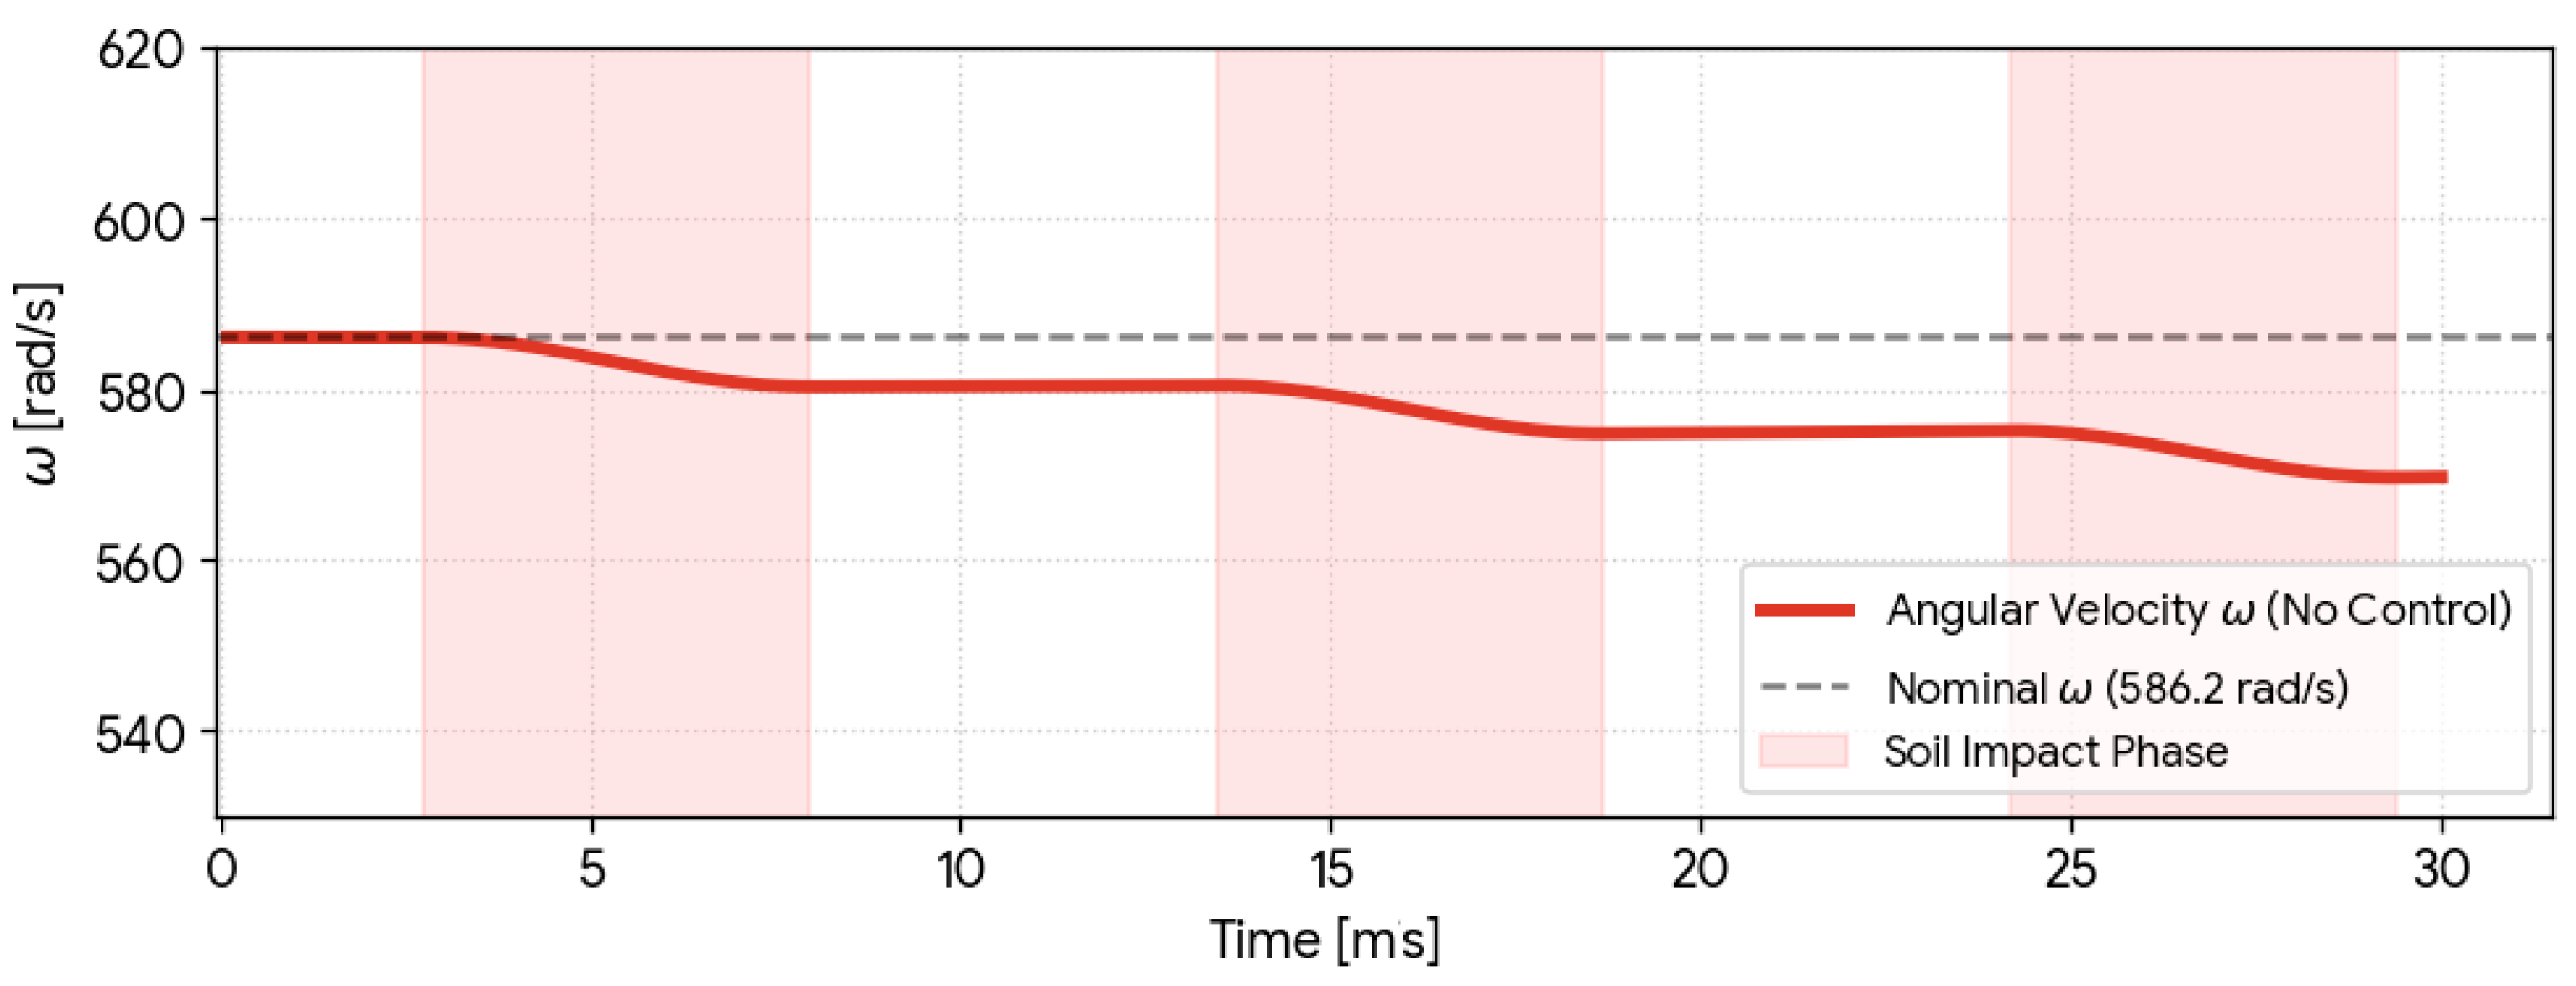
For the modeling, simulation, analysis, and control of the dynamic behavior of engineering systems, SimMechanics blocks can be used to create a physical model of the interacting subsystems, which is then linked to the Simulink/Matlab (v2023) environment. For example, with a −3% variation in operating frequency (586.2 rad/s), on hard soil, we demonstrate that the system enters a chaotic state. In this state, high-frequency impact shocks (17.26 g) induce transient torques that exceed the damping capacity of the drive system. This results in an uncontrolled evolution of the angular velocity (see Figure 13), characterized by cyclic fluctuations and belt slippage, which further accelerates bearing fatigue and reduces the efficiency of energy transfer to the ground.
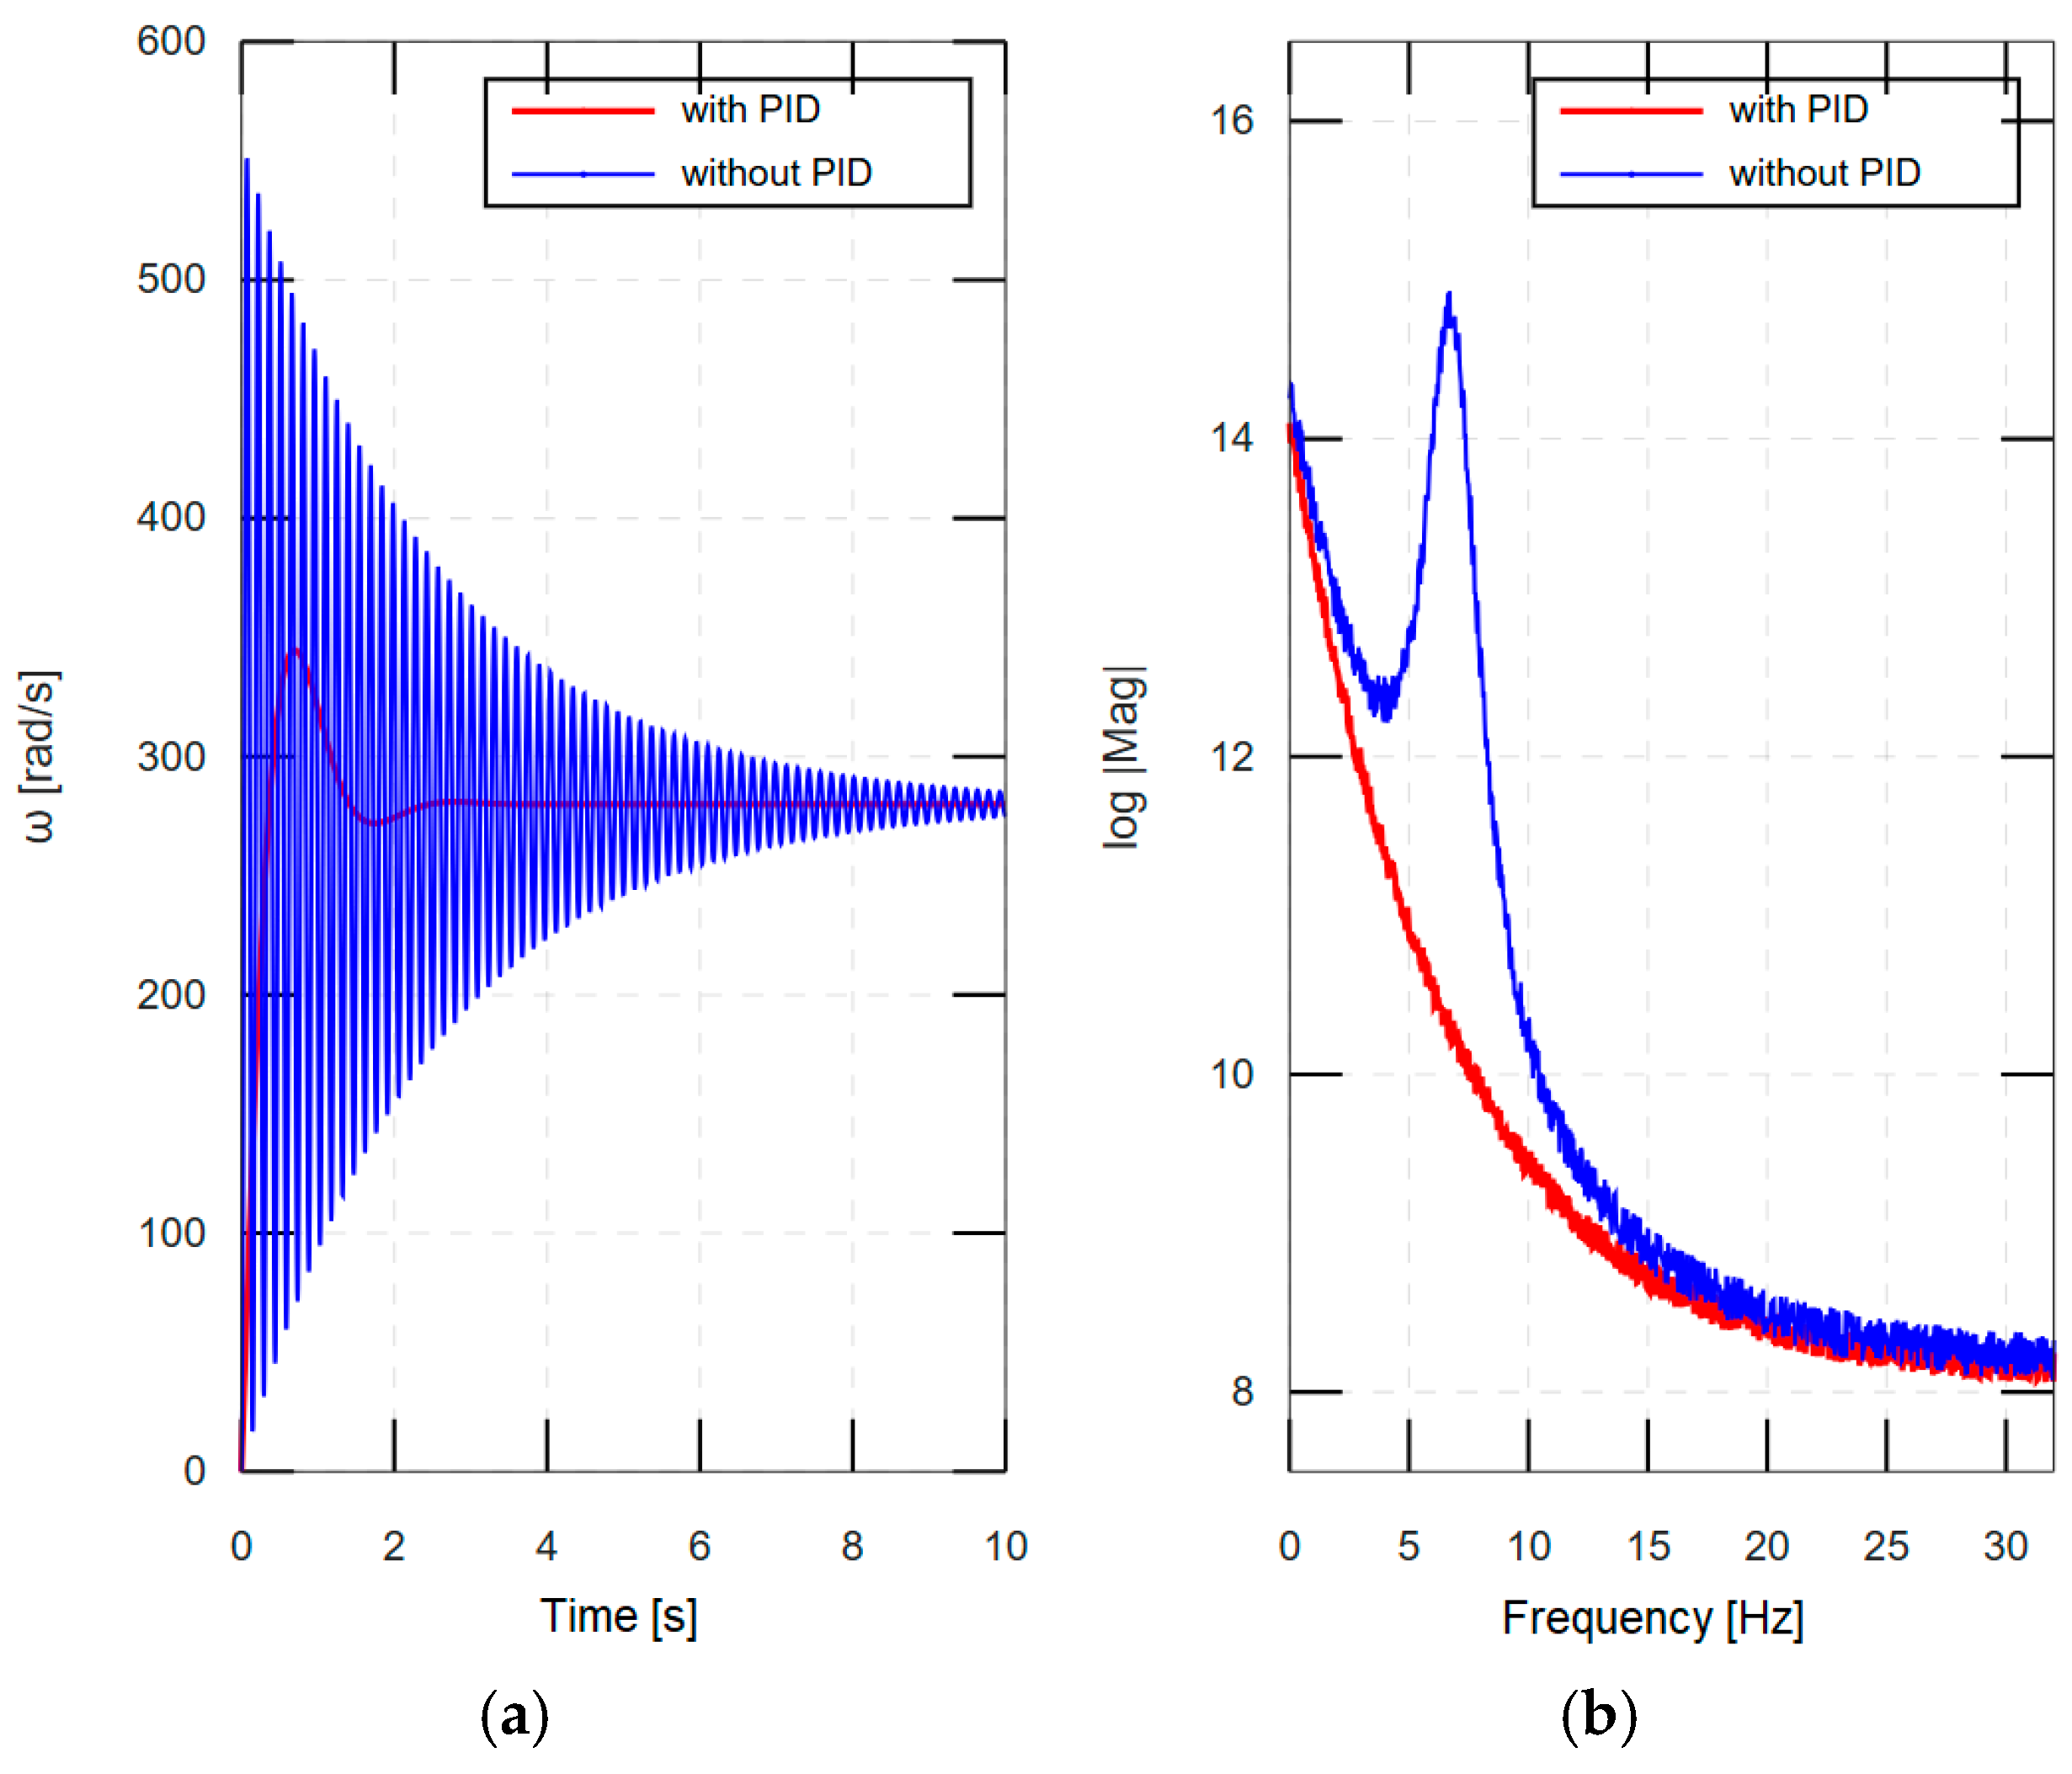
Due to the observed variations in angular velocity (experimentally determined), implementing a controller is recommended to maintain the speed closer to the reference value, thereby preventing sharp decelerations. A PID controller, for instance, forces the motor to accelerate as soon as the plate loses contact with the ground; however, the system’s inertia prevents an instantaneous recovery. Therefore, to improve the transient response and minimize unwanted vibration disturbances, we simulated the system’s operation in two scenarios: with and without a PID controller to ensure the constancy of the output parameters. This approach allows the desired state to be reached faster with fewer oscillations (reduced settling time), maintaining the belt speed at a constant value even in the presence of external disturbances. Thus, the PID controller detects these changes and automatically adjusts the motor power to compensate, maintaining the speed at a constant value [37,38,39].
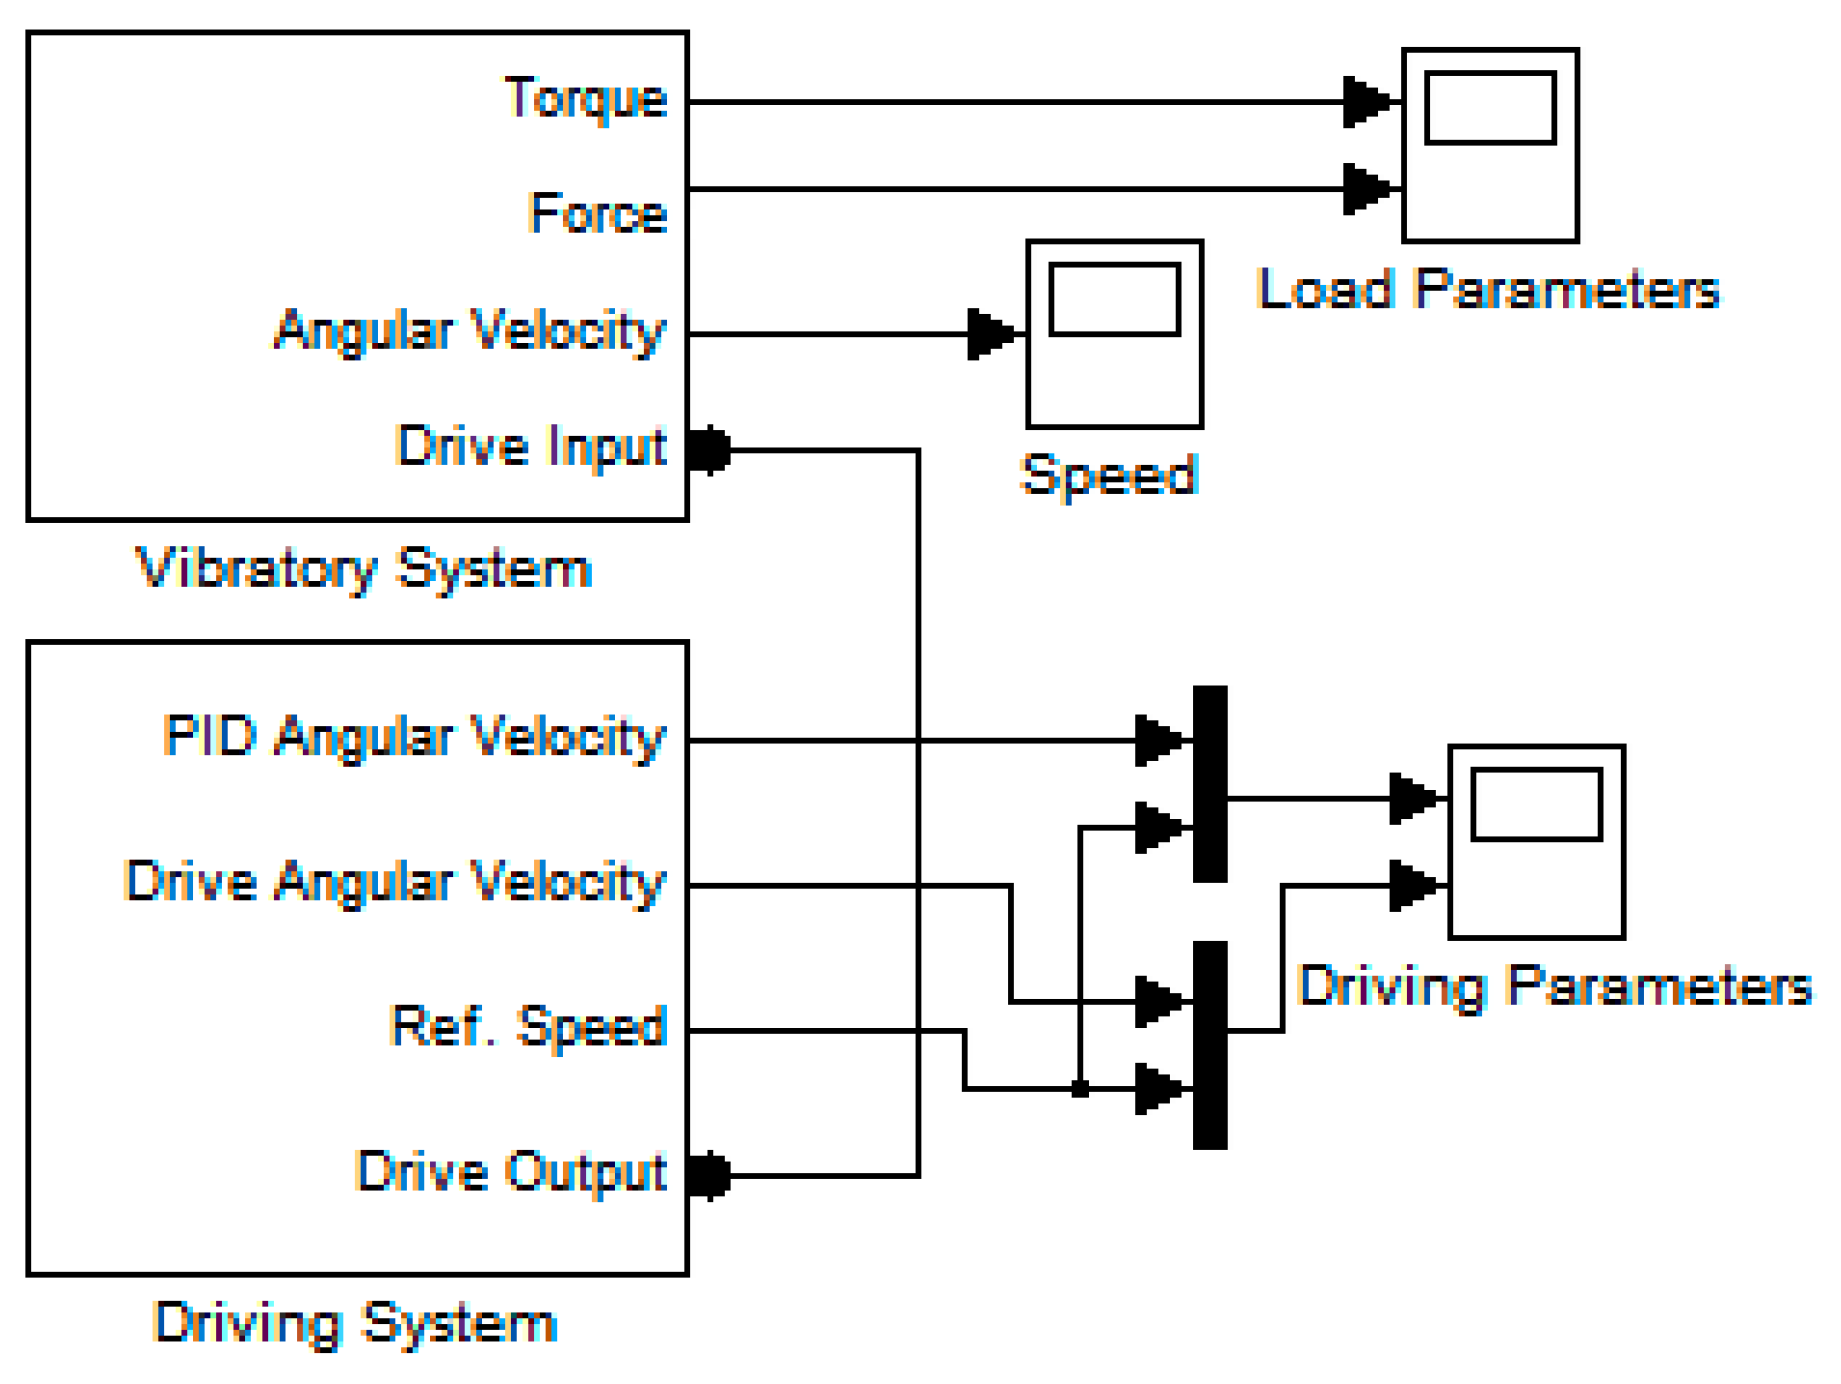
In practice, the simulation model comprises the main interacting subsystems—specifically, the driving system and the vibration-generating system (a vibrator with two eccentric masses)—as illustrated in Figure 14.
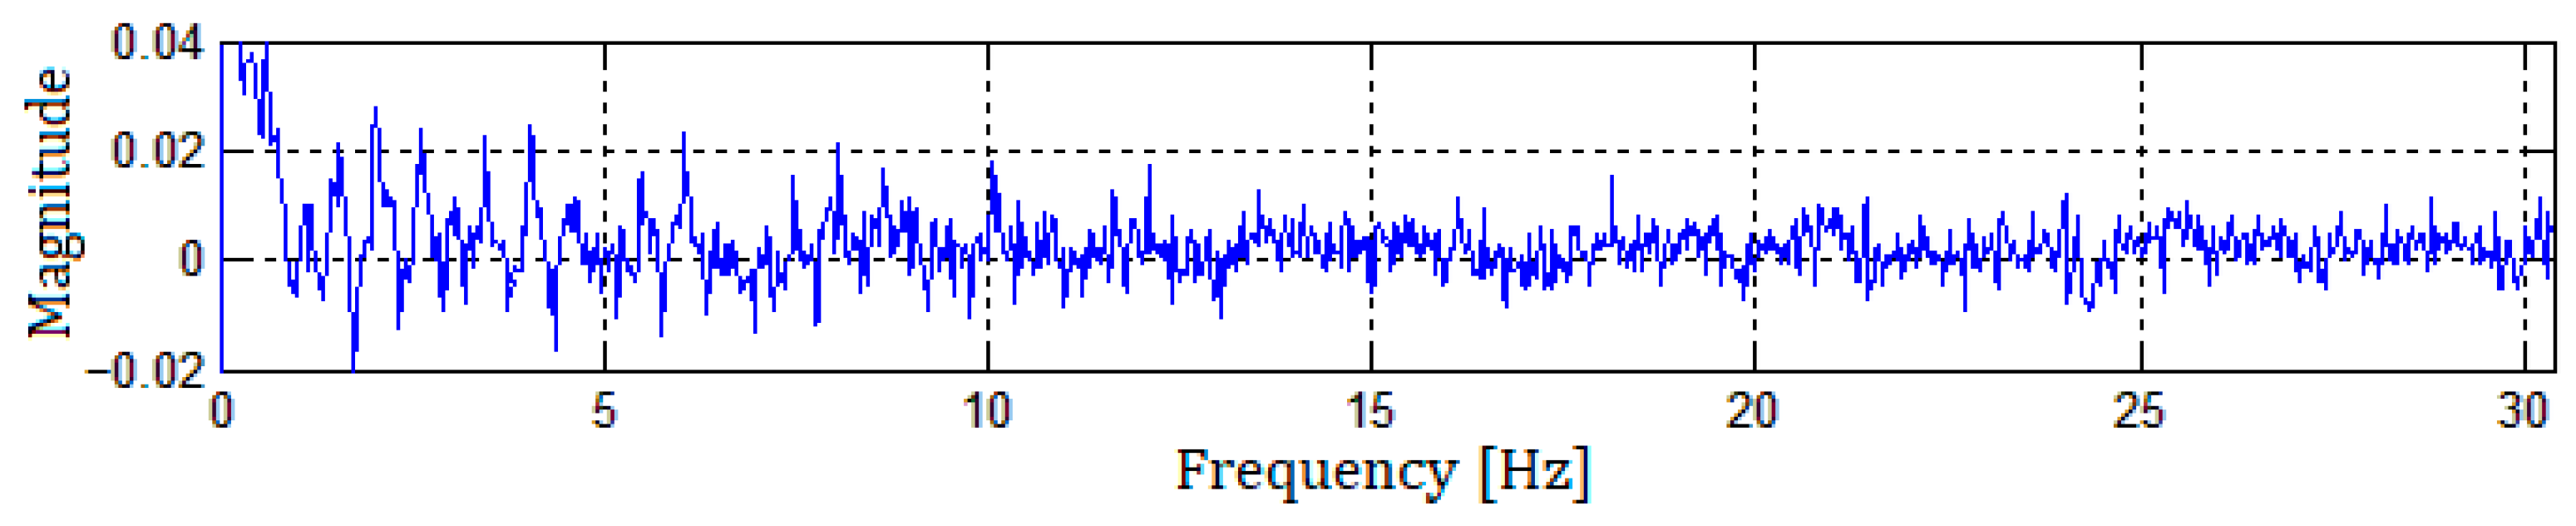
The simulation results for the belt transmission dynamics are presented in Figure 15, illustrating the controller’s effect on the drive shaft’s angular velocity under loaded operation conditions. For instance, the controller maintains consistent performance—potentially preventing a 50% reduction in angular velocity and stabilizing frequency spectra below 30 Hz—ensuring uniform efficiency across different terrain types. Regarding the tuning of the PID controller, the parameters were determined using a hybrid approach. Initial values were estimated using the Ziegler–Nichols closed-loop method to identify the system’s stability boundaries. Subsequently, the PID Tuner toolbox in MATLAB was employed to fine-tune the coefficients (Kp, Ki, Kd) for the specific operational constraints of the 64.7 kg plate compactor (e.g., settling time ts < 2 s and resonance suppression optimized at 7 Hz). As demonstrated by the frequency response analysis, the PID controller effectively suppressed the resonance peak, ensuring stable bearing operation by eliminating cyclic impact loads. The diagrams reveal how the controller stabilizes the analyzed signal (the angular velocity of the belt drive wheel shaft) and how the working tool’s dynamics influence both the transmission’s stability regime and the spectral composition of the system’s motion.
In order to analyze with greater accuracy the perturbing factors that influence the operating regime of the vibratory plate compaction, we utilized Cepstrum analysis. This method transforms the frequency spectrum of a signal into the quefrency, allowing for a clear separation of excitation sources (e.g., engine rotation) from the structural response of the mechanical system (e.g., impact of the vibratory plate with rigid soil). In this case, Cepstrum analysis highlights the harmonics series generated by the 17.26 g impact, allowing for a clear observation of how this impact intensity affects the engine’s rotational speed periodicity. The angular velocity ratio varies when the plate operates on hard terrain; any peak in the Cepstrum diagram indicates a nonlinearity caused by loss of belt adhesion (where a 3% transmission slip was modeled), intermittent loss of ground contact (plate jumping), or elastic torsion within the transmission system under the extreme loading. These factors, depending on the mechanical system’s characteristics and operational speeds, generate distinct frequencies that appear as peak in the vibration output. Consequently, the presence of multiple peaks in the Cepstrum magnitude (Figure 16) indicates a poly-harmonic evolution of the original signal. These peaks correspond to the periodicity of the spectral components (harmonics and sideband) within the frequency domain.
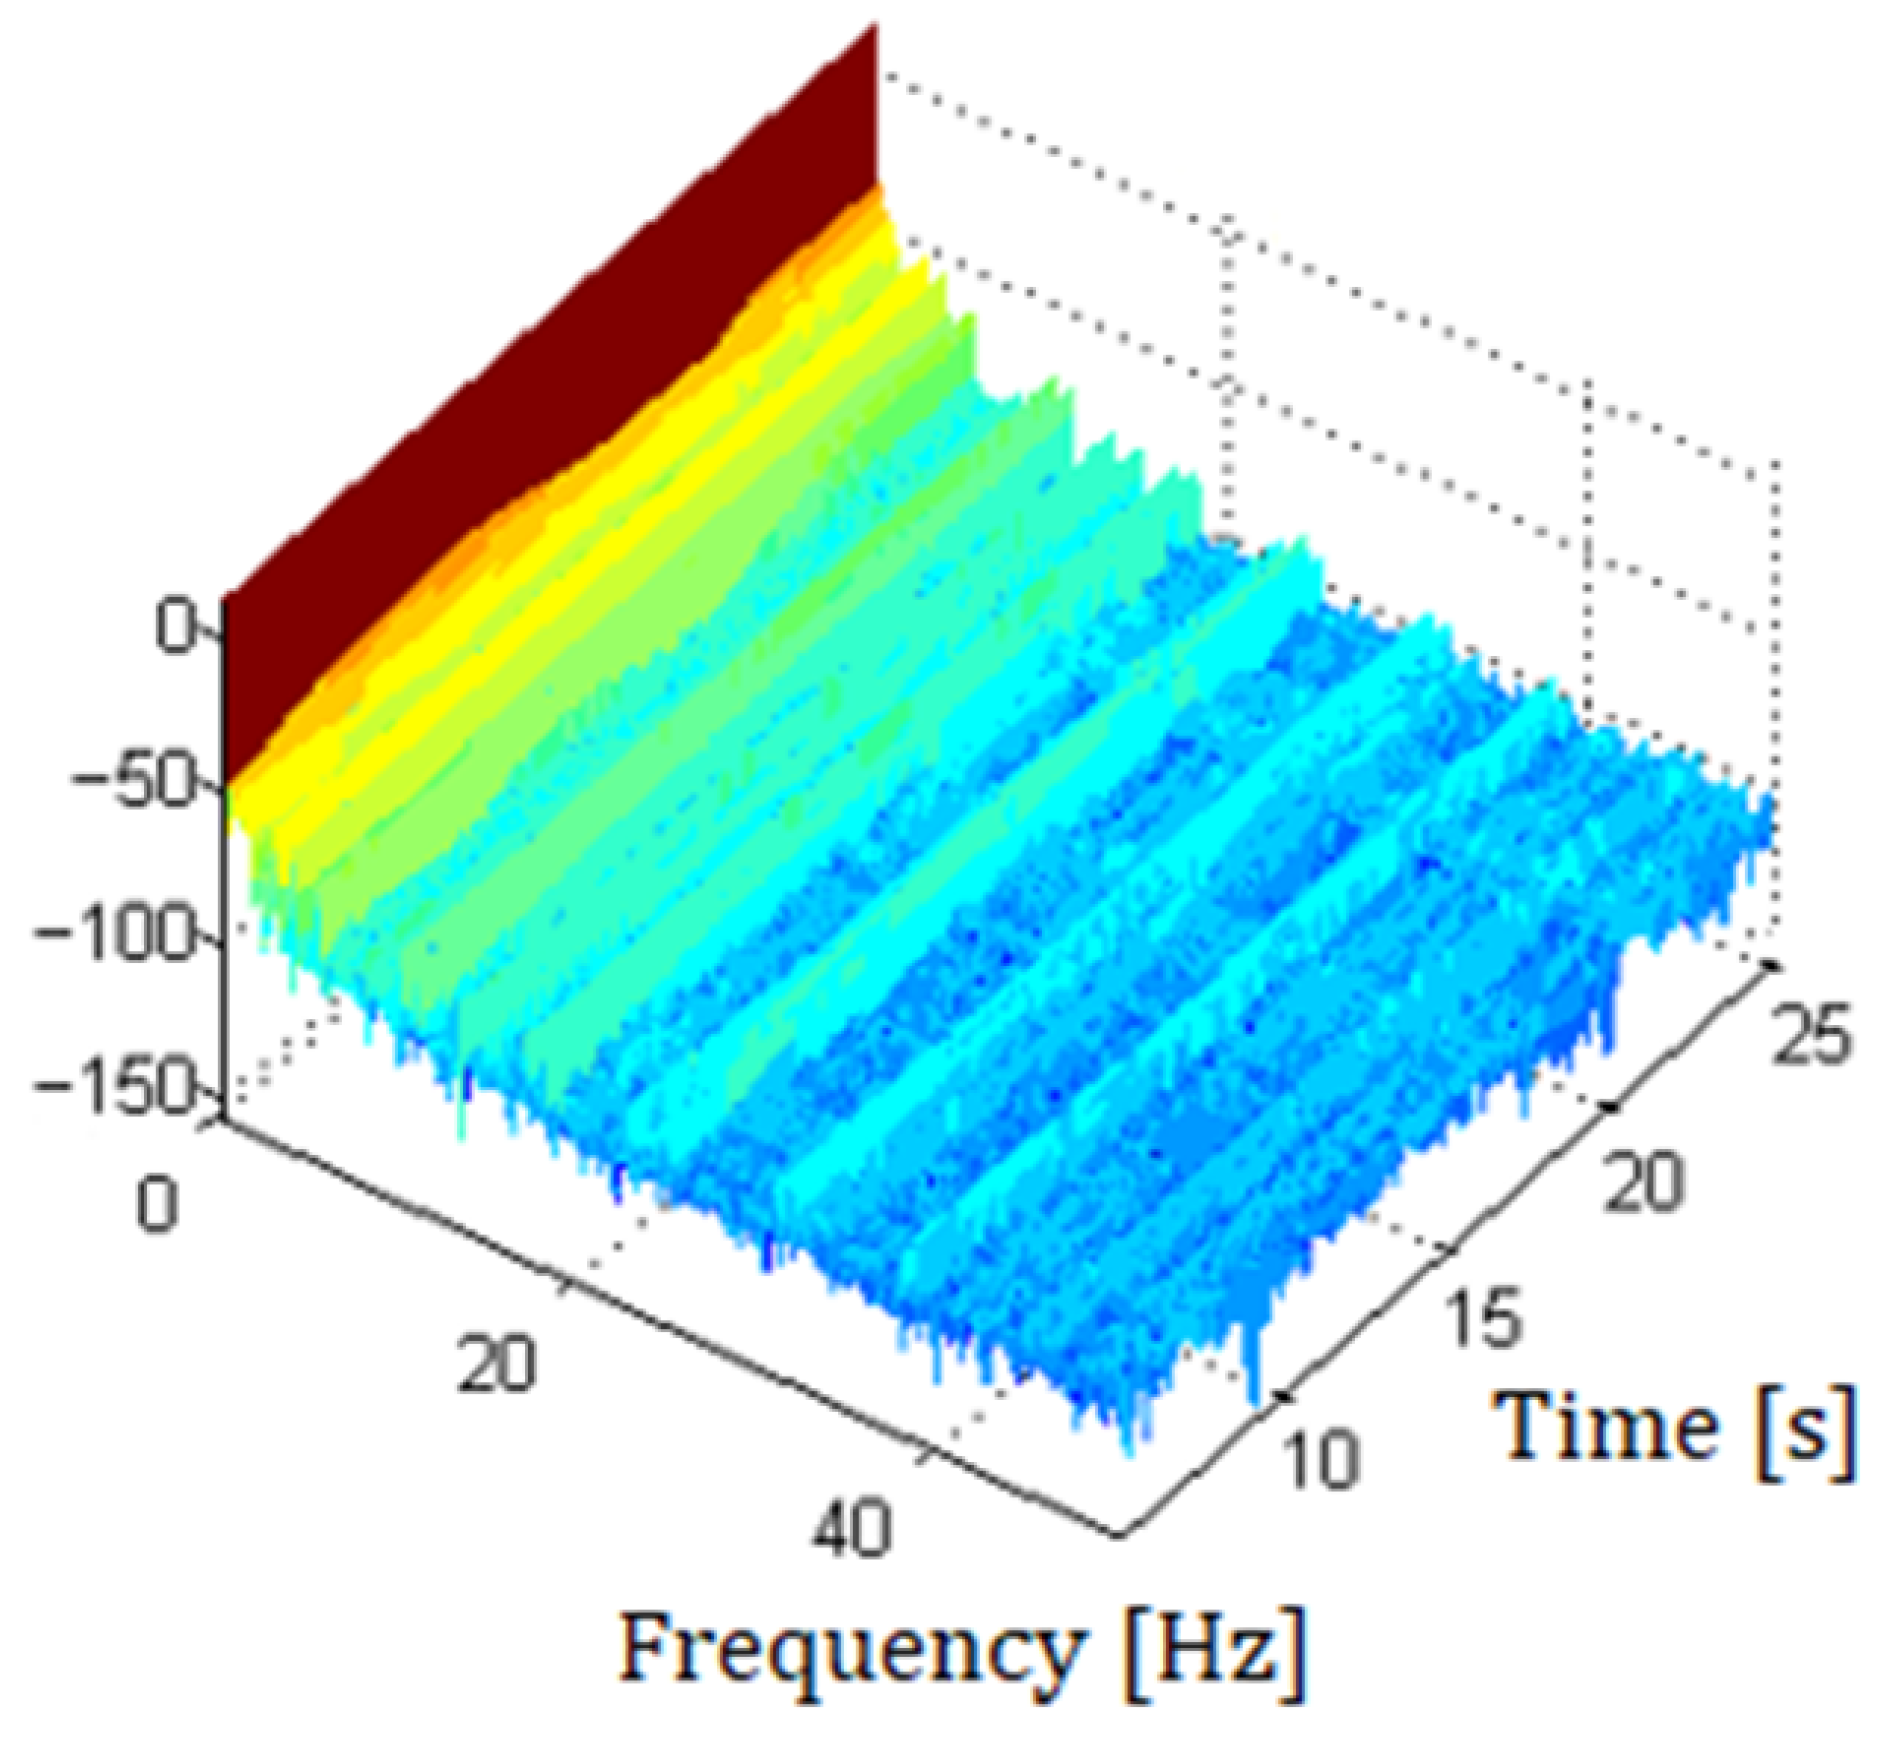
The short-time Fourier transform (STFT) applied to the angular velocities measured is used to analyze how the frequency content of a nonstationary signal changes over operation time. Thus, the spectrogram corresponding to the ratio between the two angular velocities is presented in Figure 17 and shows aspects regarding transmission efficiency. The plot illustrates a time-constant signal where the maximum energy at low frequencies is marked in red (0 dB to −50 dB), gradually decreasing through yellow and green to the minimum noise floor represented in blue (−150 dB) across the rest of the spectrum. The perfectly straight red line over the 25 s period indicates constant slippage. In the context of a vibratory plate, a slip rate of 2–5% is typically considered optimal and necessary to protect the motor from the vibrator’s mechanical shocks. The lack of color bleeding around the peak or additional harmonics suggests that the belt does not exhibit chaotic vibration or “stick-slip” behavior, which would otherwise indicate a loose or worn belt. Since the noise floor (blue area) is extremely low, the transmission is highly efficient, with minimal energy loss through parasitic vibrations that might suggest pulley misalignment.
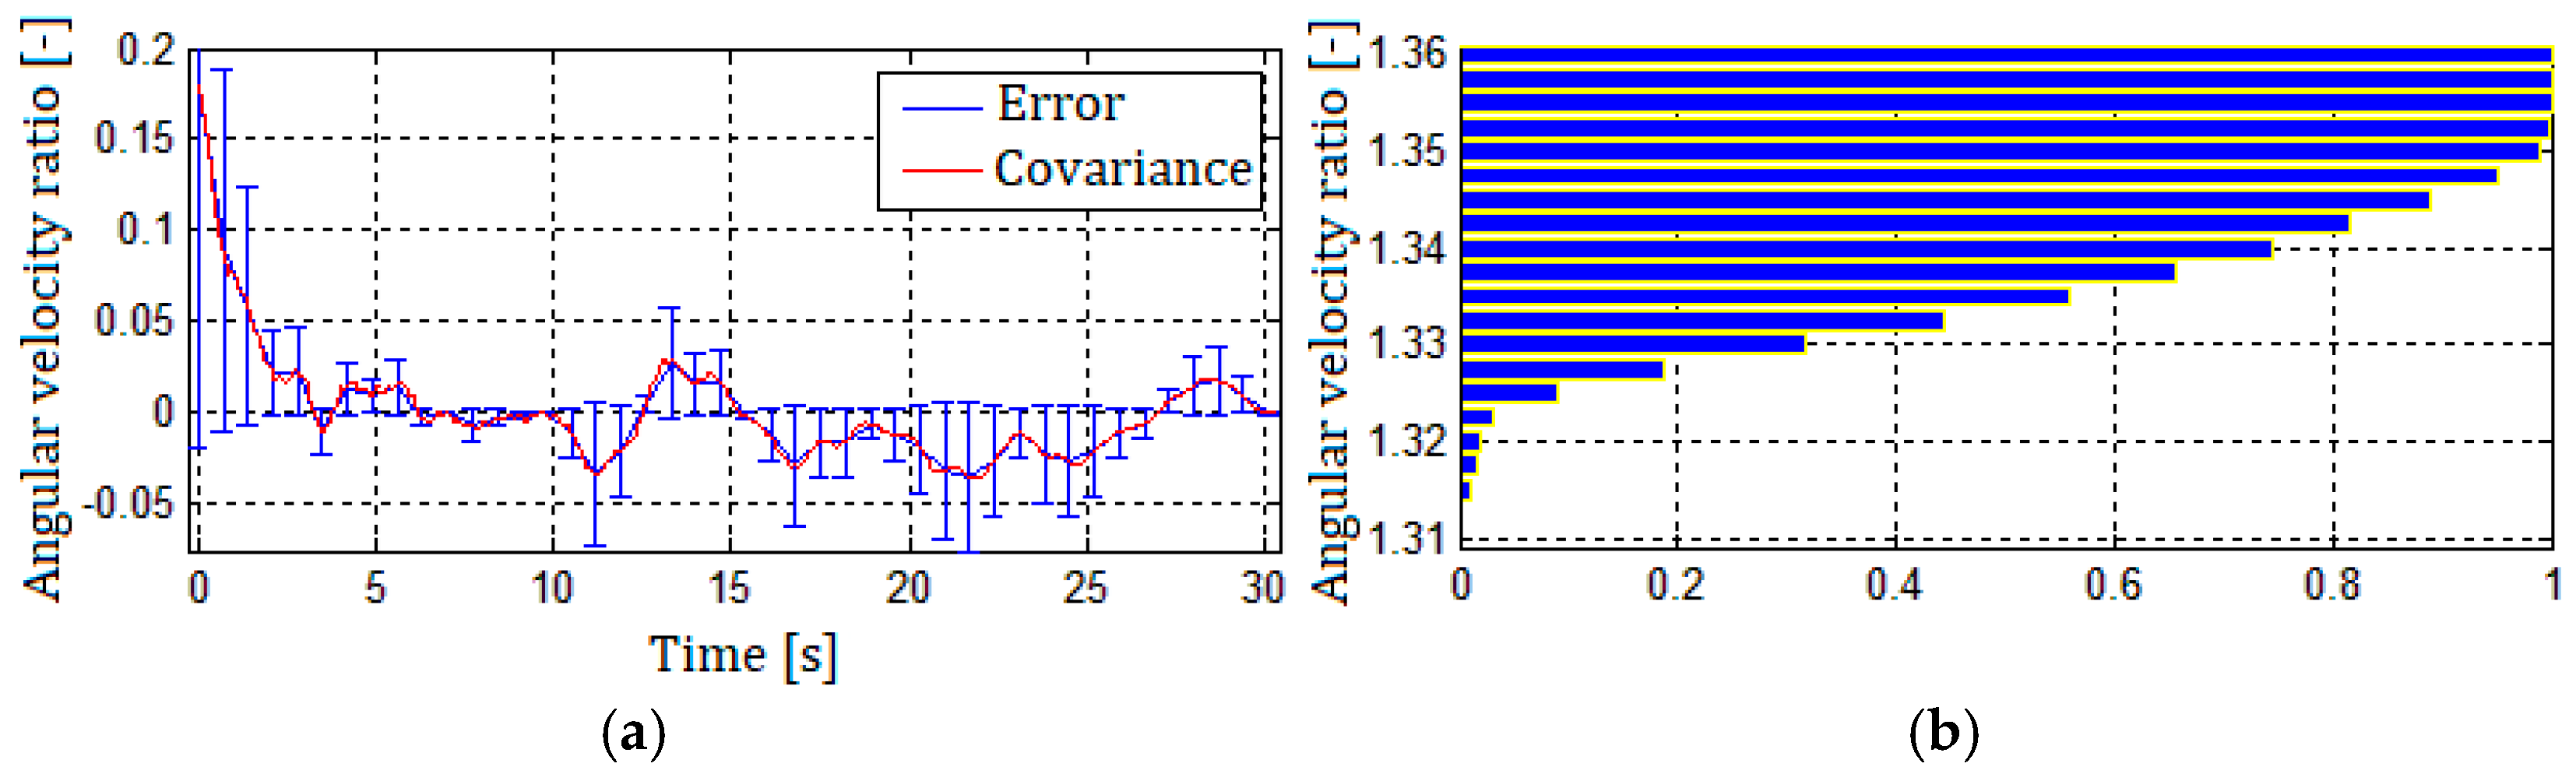
In addition, the stochastic analysis was performed only for the signal corresponding to the ratio of the two angular velocities (at the electric motor shaft and at the vibrator shaft), and the results obtained are presented in Figure 18.

3.3. Simulation of the Influence of Bearing Wear

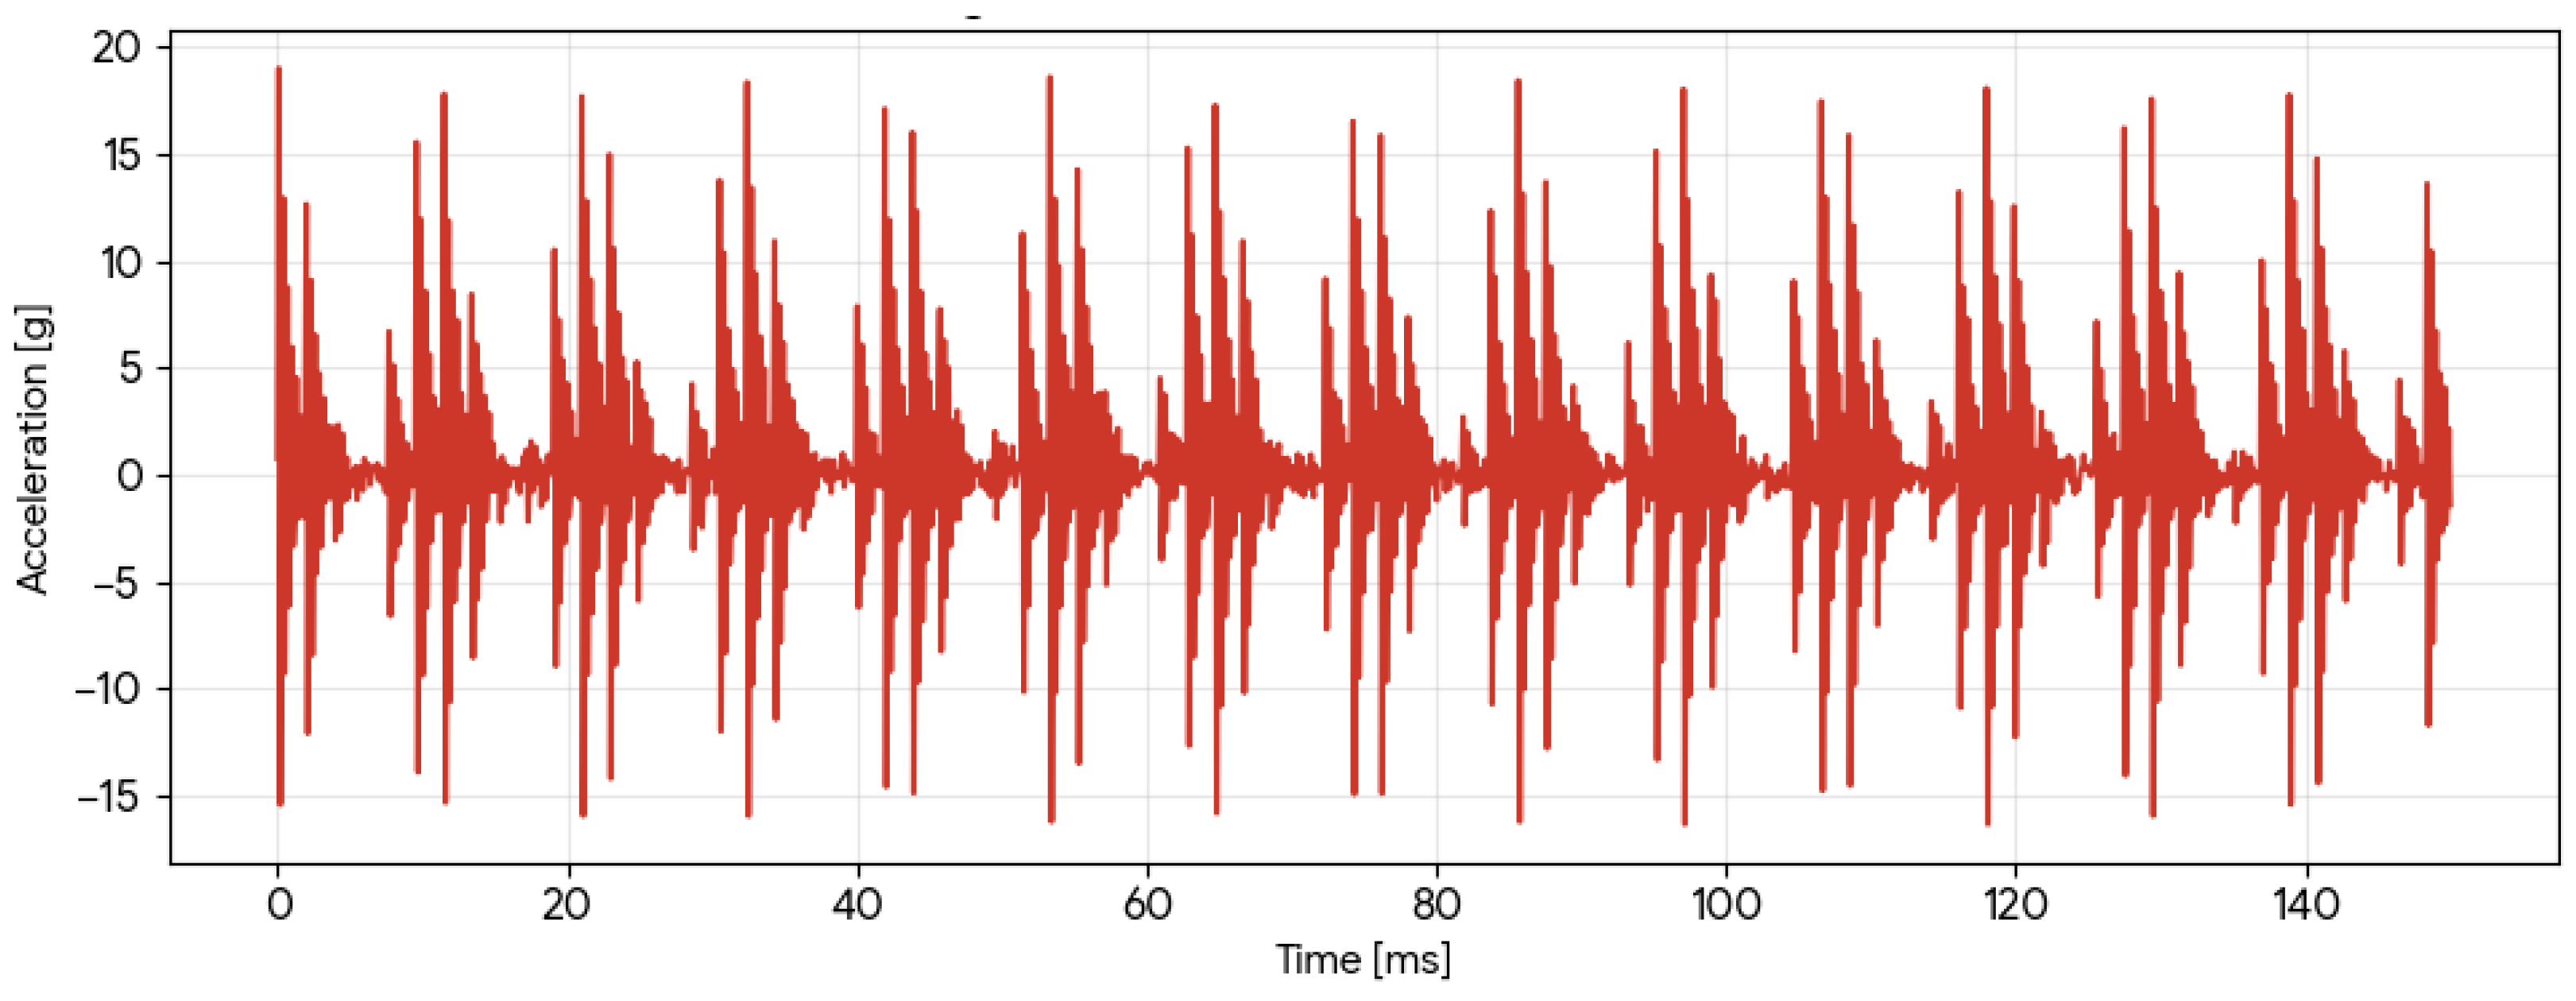
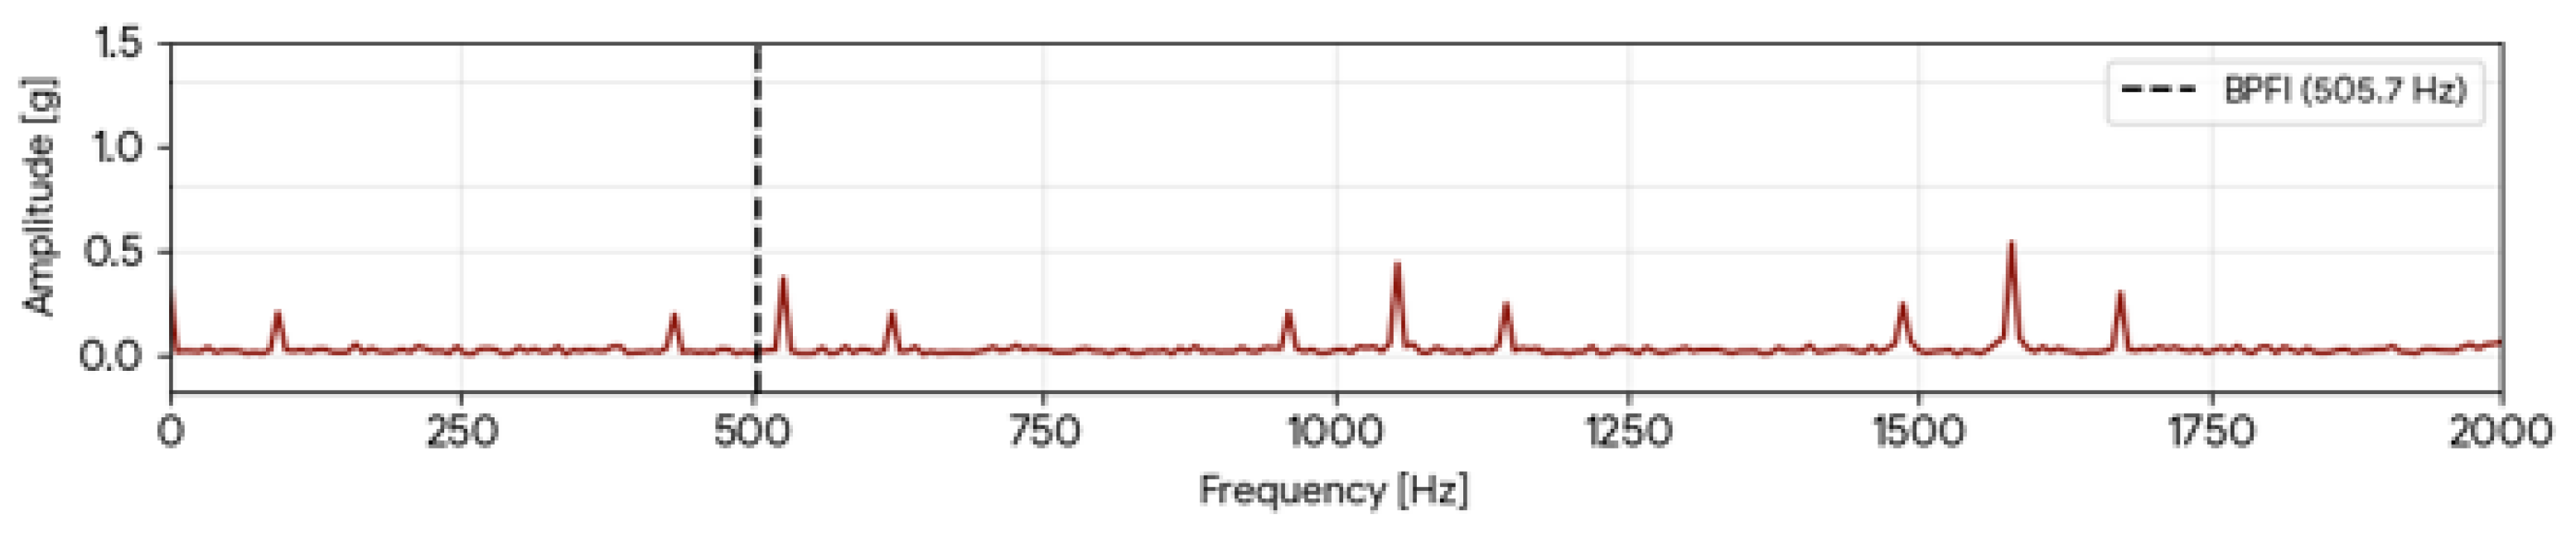
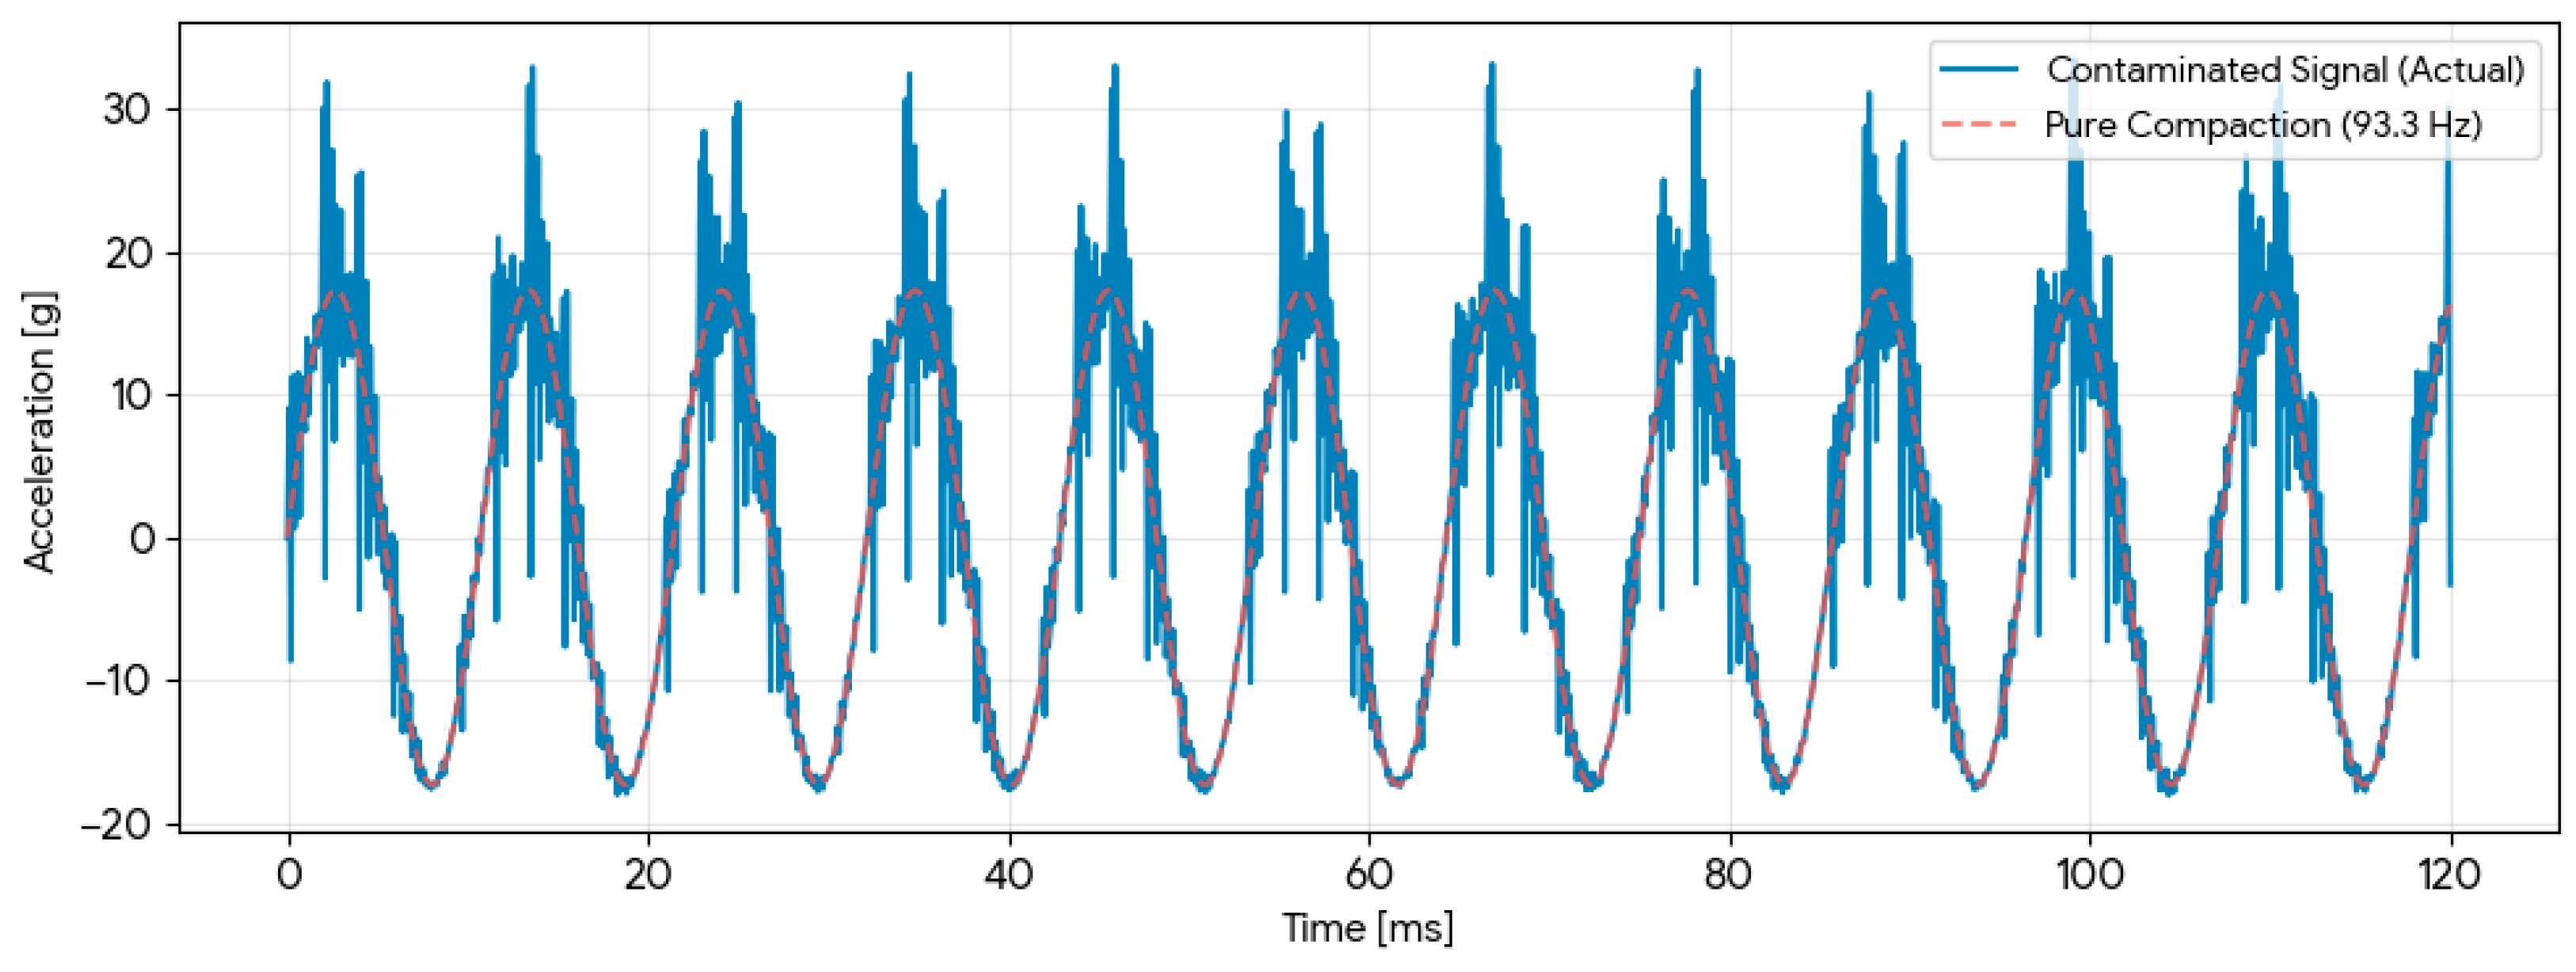
Vibration analysis is the most accurate method for bearing wear prediction. This technique isolates the high frequencies generated by micro-impacts between the balls and the raceways, utilizing an accelerometer to detect specific failure frequencies, such as BPFI and BPFO. A common approach to modeling bearing faults in mechanical systems involves the use of acceleration signals for diagnostic purposes. In this study, the Matlab Predictive Maintenance Toolbox was utilized to generate input signals and process the resulting responses. The model assumes a fault located on the inner race of one bearing, while radial load effects are neglected in the analysis of the system’s dynamic behavior. Regarding periodicity, it is assumed that the impact occurs once per rotation of the inner ring, creating a repeatable pattern. Consequently, the bearing fault (type 6206) is simulated using a periodic pulse train with the following parameters: BPFI frequency of 505.7 Hz and a pulse duration of 1.97 ms (Figure 19). The resulting frequency domain acceleration spectrum for the worm bearing is presented in Figure 20.
When a vibratory plate compactor operates on rigid soil and a bearing defect is present, the resulting acceleration signals become complex, nonstationary, and heavily masked by background noise. The simulation results for this scenario are presented in Figure 21.
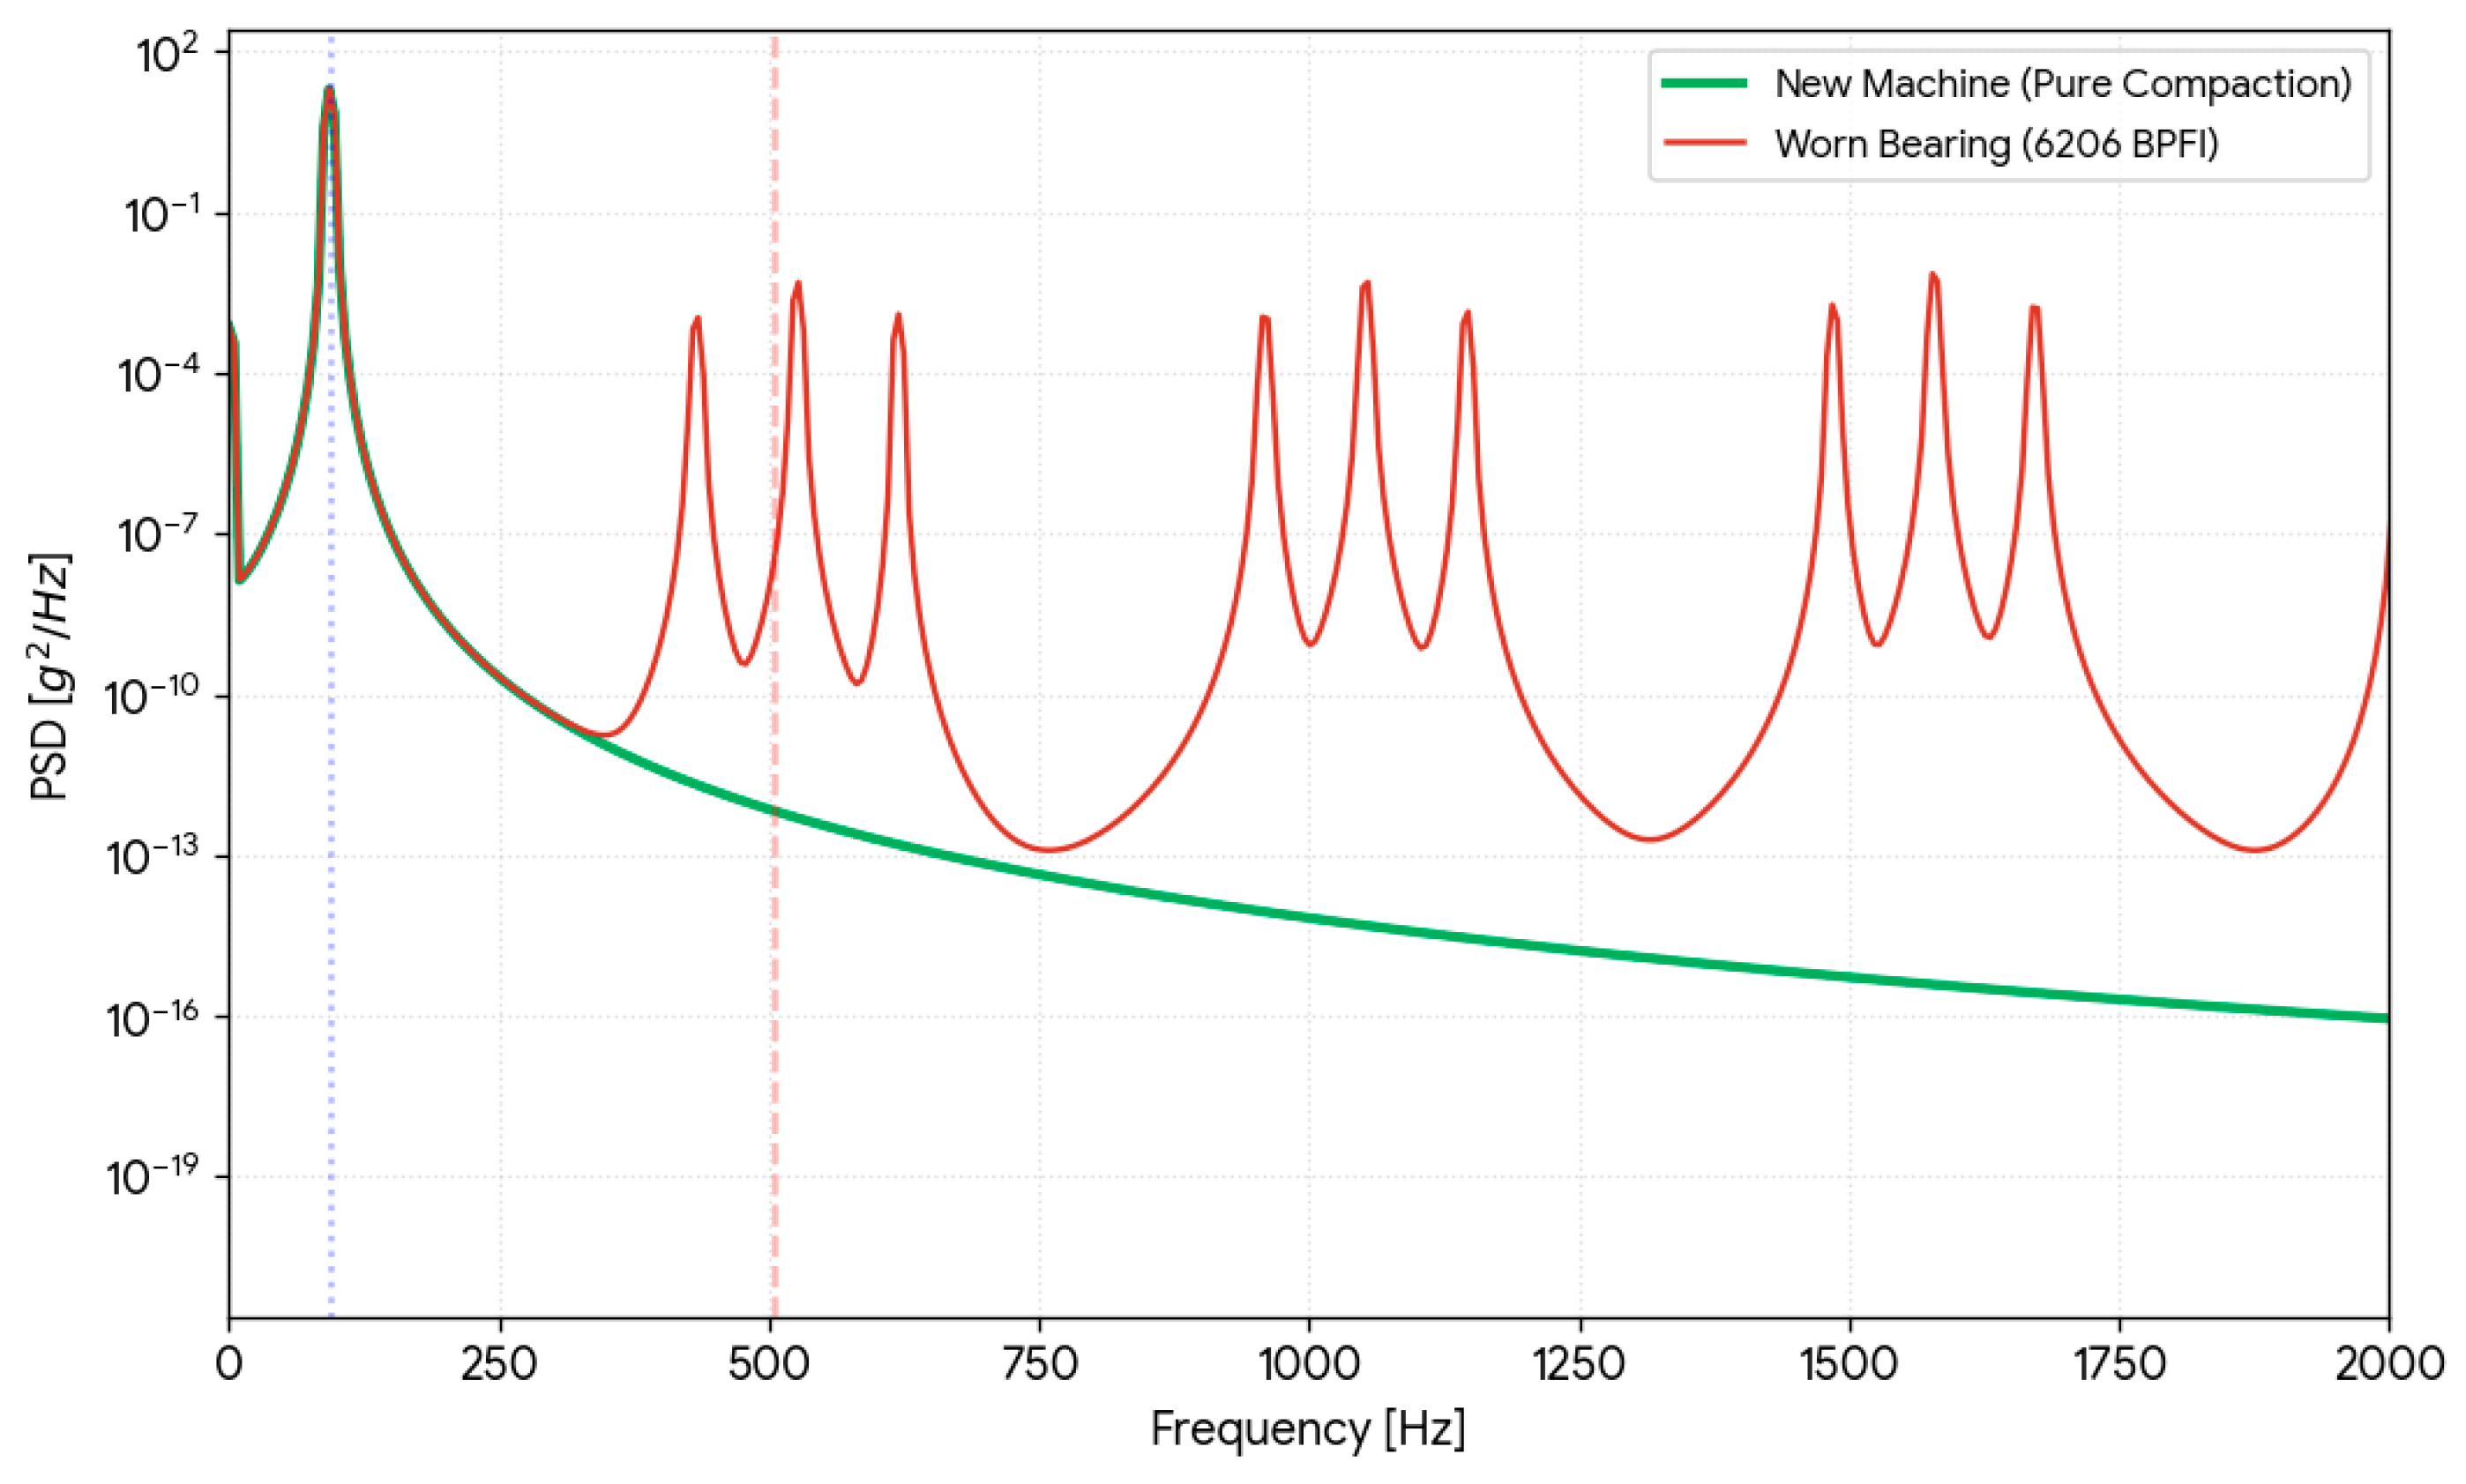
A comparation between acceleration power spectral density (PSD) signals for a bearing with and without wear shows that a worn bearing exhibits higher power at higher frequencies and potentially new, distinct peaks related to specific fault frequencies. Plotting this on a logarithmic scale (Figure 22) makes these differences clearer by expanding the range of low power values, revealing subtle changes and the broadband increase in higher-frequency noise characteristic of bearing degradation. For a healthy bearing, a relatively smooth curve is observed with power concentrated at lower frequencies, representing normal operating vibrations. In contrast, a worn bearing exhibits a noticeable increase in the overall power spectral density, particularly at higher frequencies. Thus, PSD analysis of the acceleration signal highlights that the bearing defect is not merely noise but a fundamental change in the energy distribution of the vibratory plate.
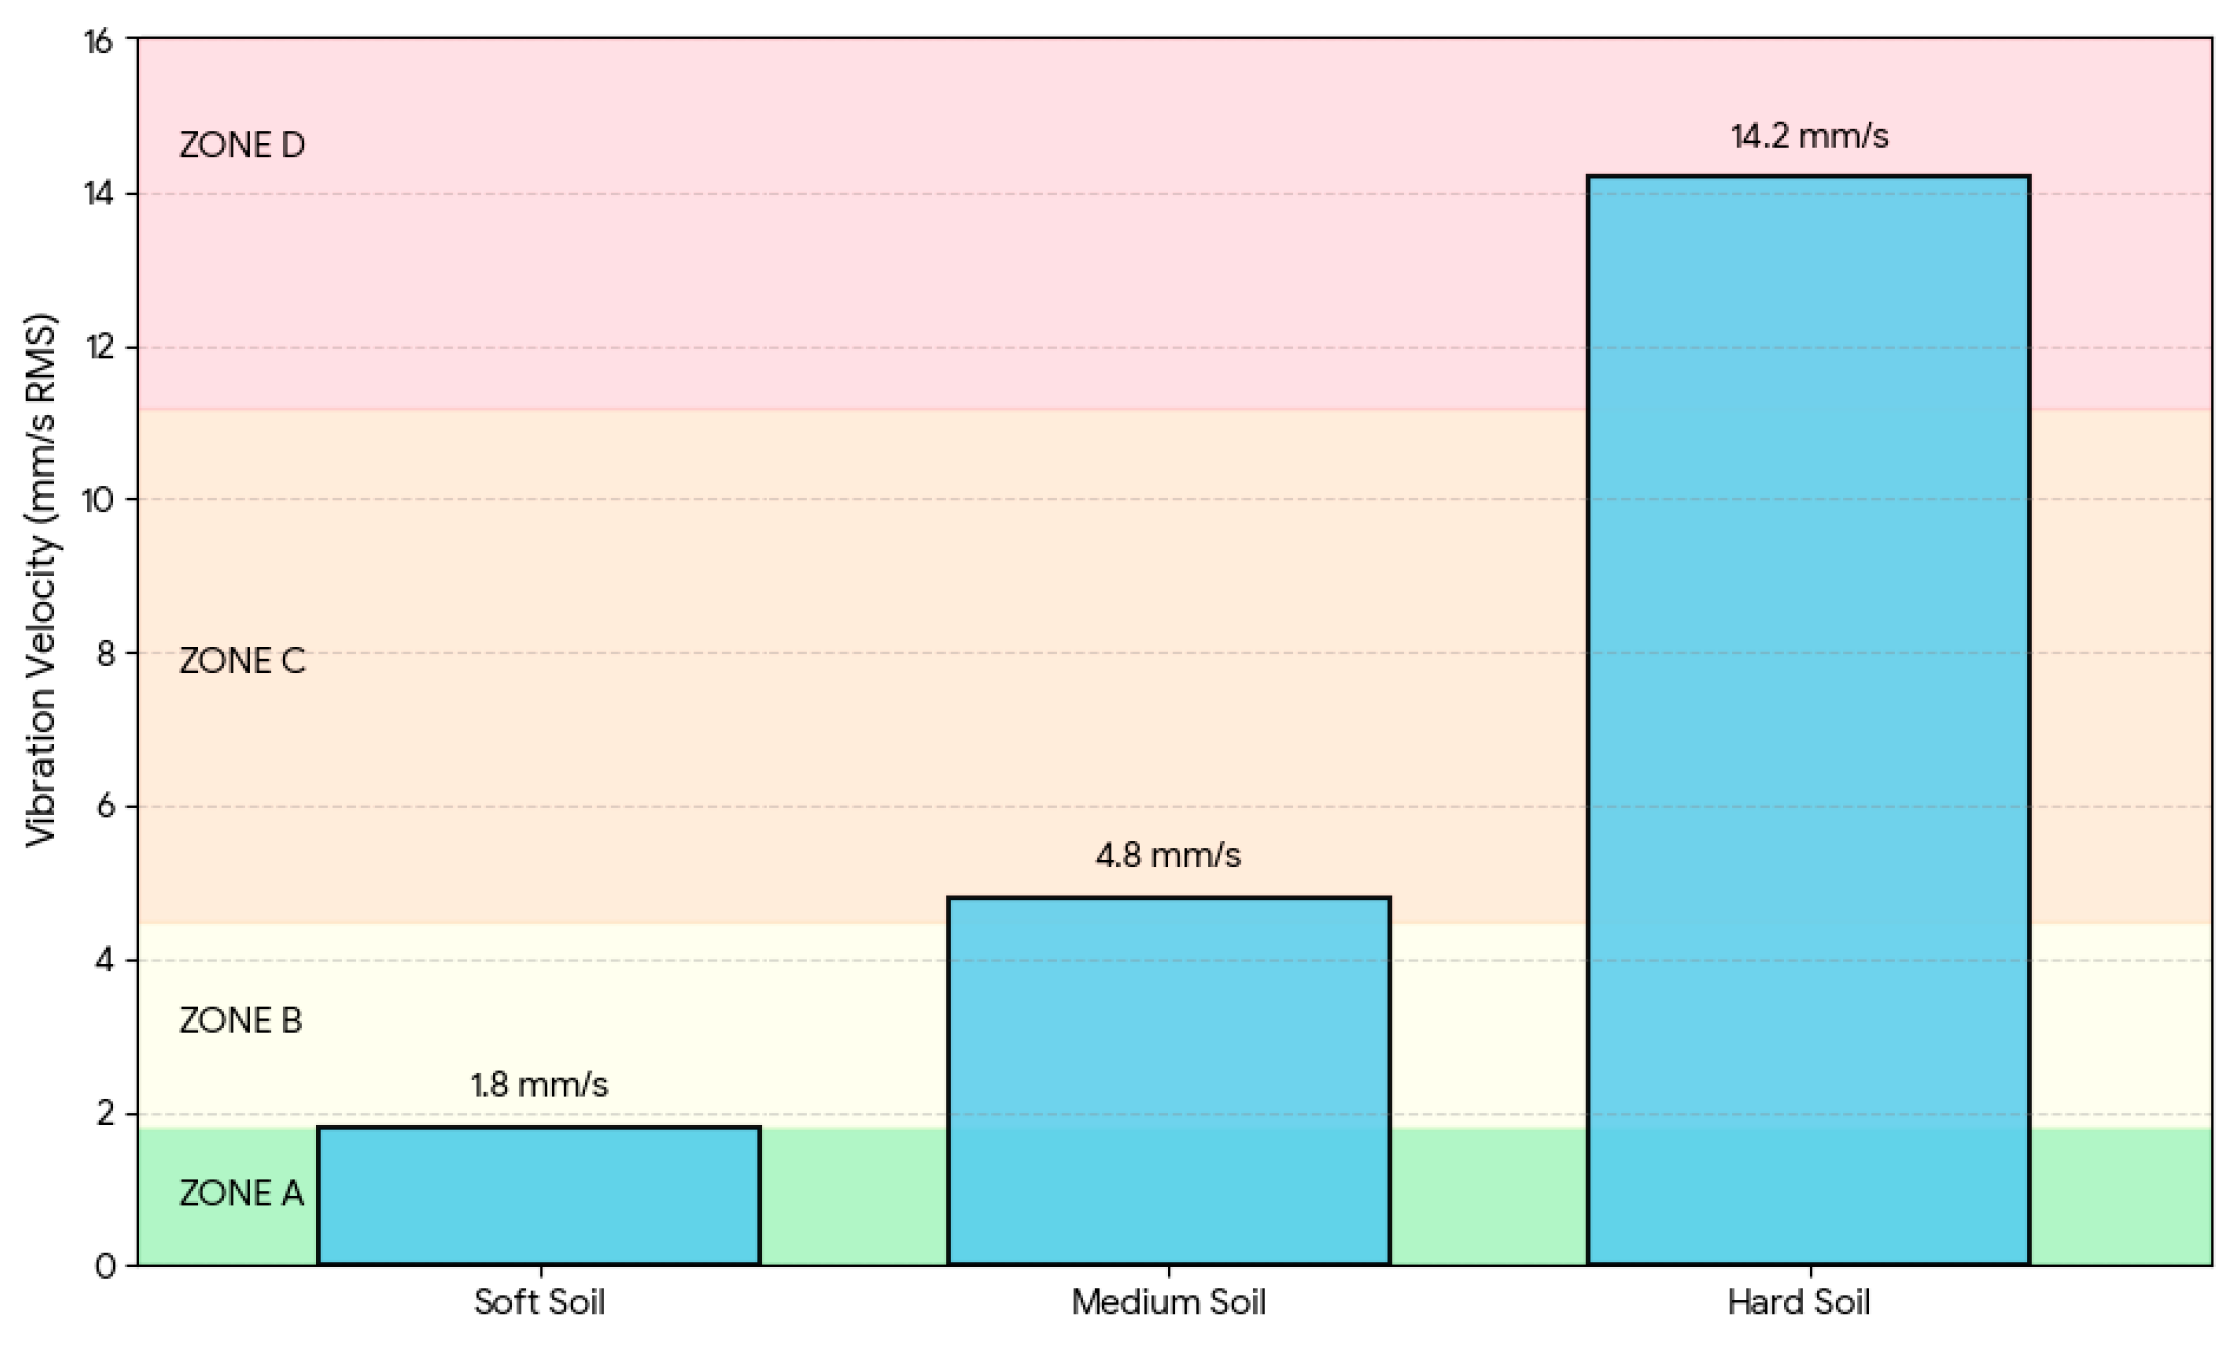
For monitoring the technical condition of bearings, severity thresholds for vibration velocity (RMS) are regulated by ISO 20816-3 [40], independent of external conditions. This zonal classification provides an essential normative framework for predictive maintenance, establishing an objective criterion to evaluate the structural integrity and operational reliability of rotating elements based on vibration severity. The results for the case study are presented in Figure 23. It is observed that when the plate operates on hard ground, the vibration level reaches 14.2 mm/s RMS. This value falls within zone D (RMS > 11.2 mm/s), indicating a critical operating state that exceeds the maximum permissible threshold defined by the standard. Conversely, operating the plate on soft ground is the most efficient approach for ensuring that the compaction process remains efficient while maximizing the operational life span of the equipment.
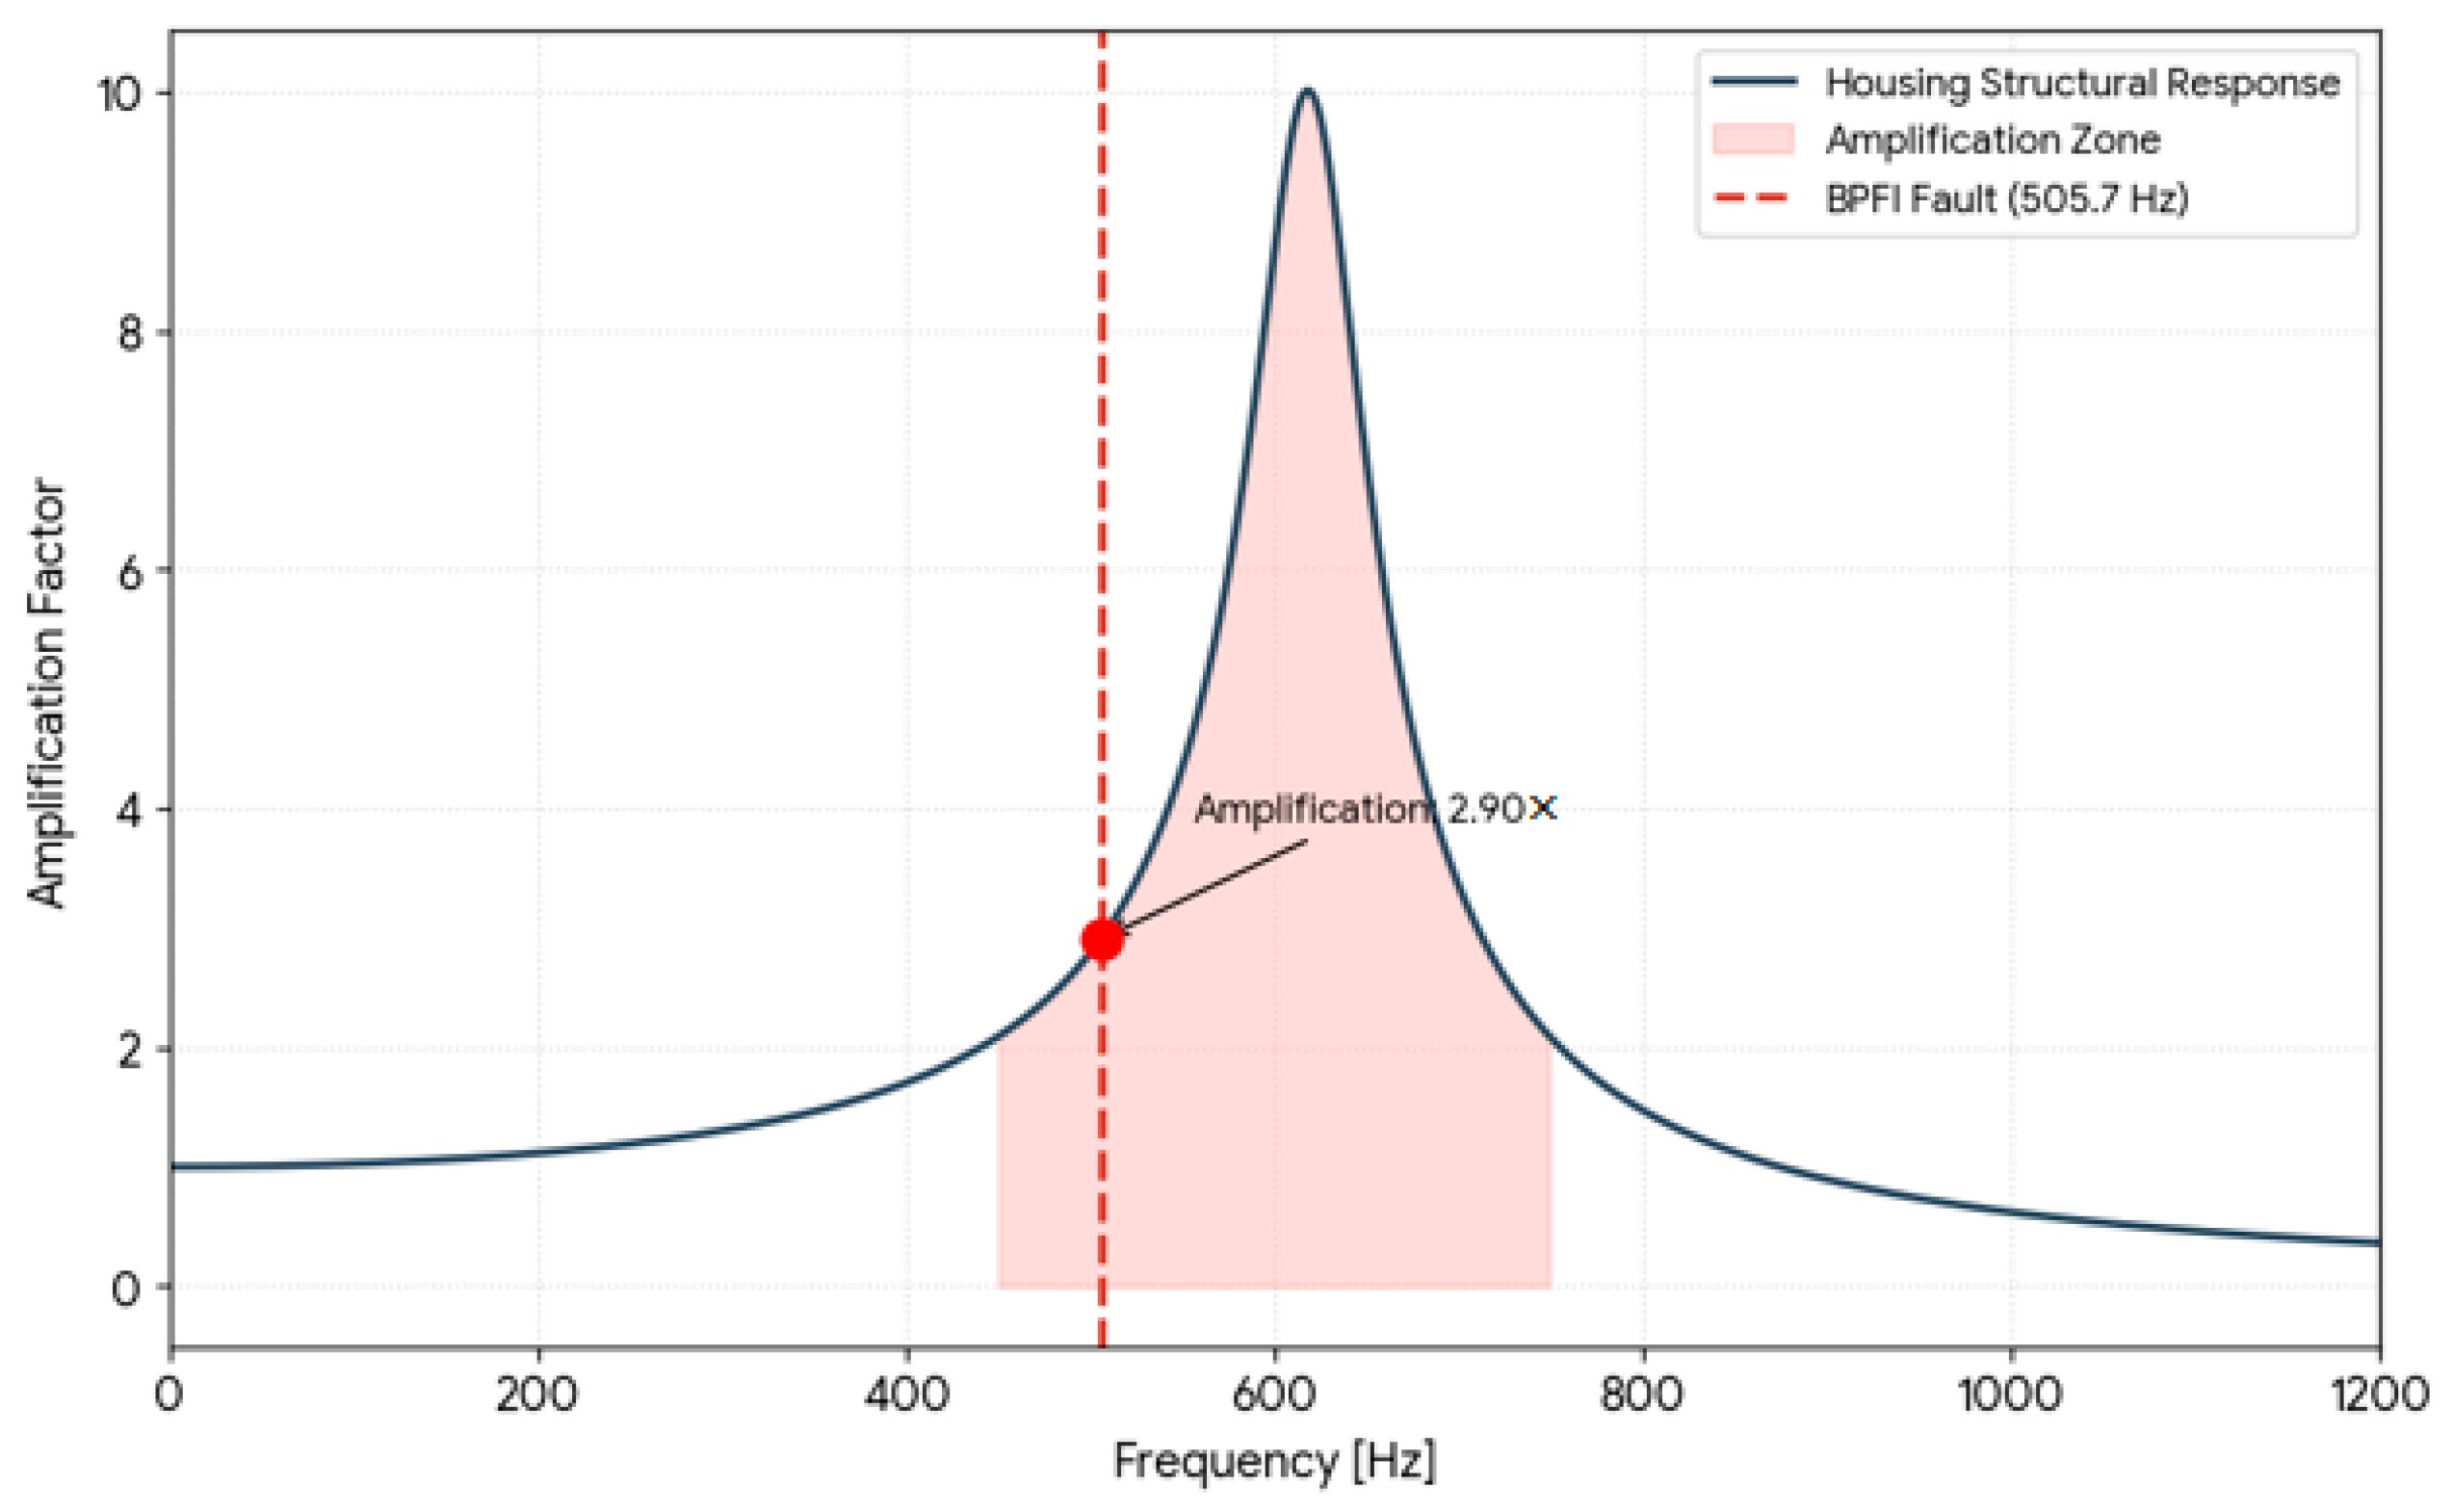
In most vibratory plates of this type, designers set the natural frequency of the housing and the mounting system (relative to the rigid motor-support assembly, excluding the isolation provided by the rubber mounts) at 60 Hz. This ensures a sufficient safety margin relative to both the nominal operating speed and the engine’s idling speed (approximately 25–30 Hz). The graph in Figure 24 illustrates how the resonant peak of the housing can amplify the energy of the bearing defect, transforming a micro-scale impulse into destructive macro-level vibration.
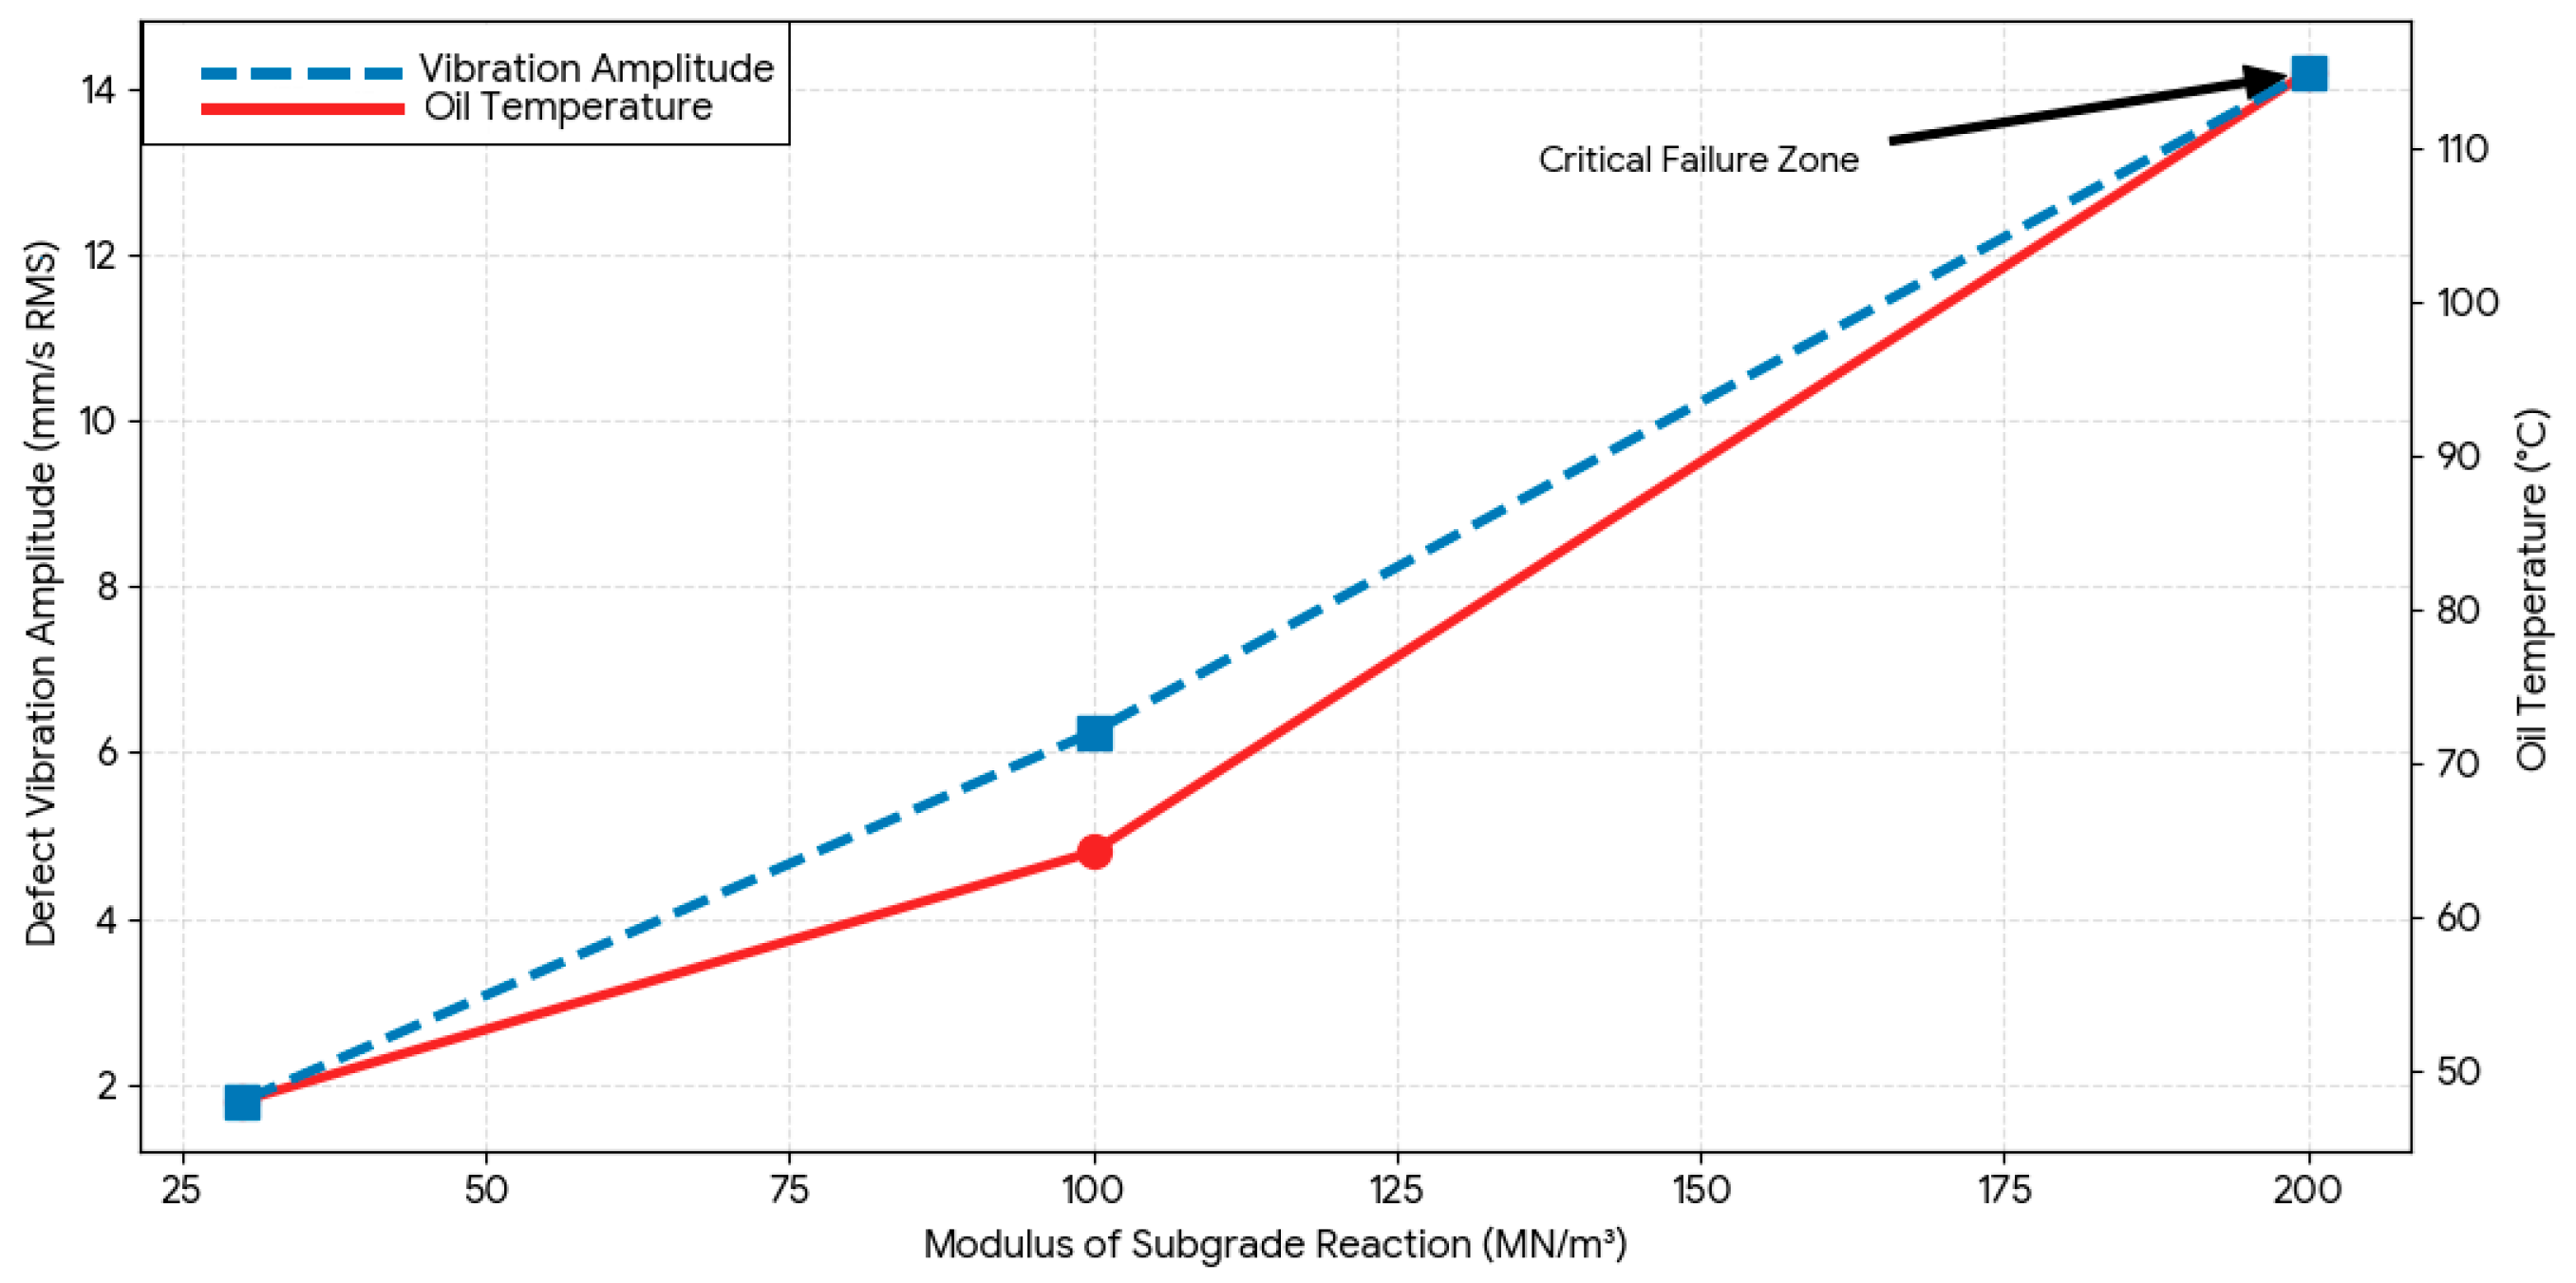
Structural amplification is likely to occur as the BPFI frequency (505.7 Hz) aligns with the resonant frequency of the vibrator housing. This can amplify vibration by a factor of 2.5–3.0, accompanied by significant acoustics emissions (a loud rumble). When operating the plate on a rigid ground—where external damping is negligible—this structural amplification acts as a stress multiplier (inducing 30 g shocks) causing material fatigue and increasing the risk of crack propagation. Consequently, this excessive vibrational energy is concentrated in stress concentration zones, such as the bolt threads and housing section transition. Excessive vibrations often manifest as increased friction within the bearings, directly contributing to a rise in oil temperature. This thermal peak serves as secondary confirmation of mechanical damage and can lead to a loss of lubricant viscosity, which further accelerates wear. Operating of vibratory plate on soil with a modulus of 200 MN/m3 (Zone D) reduces the bearing life from several hundred hours to less than a single operation shift; under these conditions, the bearing will inevitably fail due to thermal seizure or extensive spalling (Figure 25).
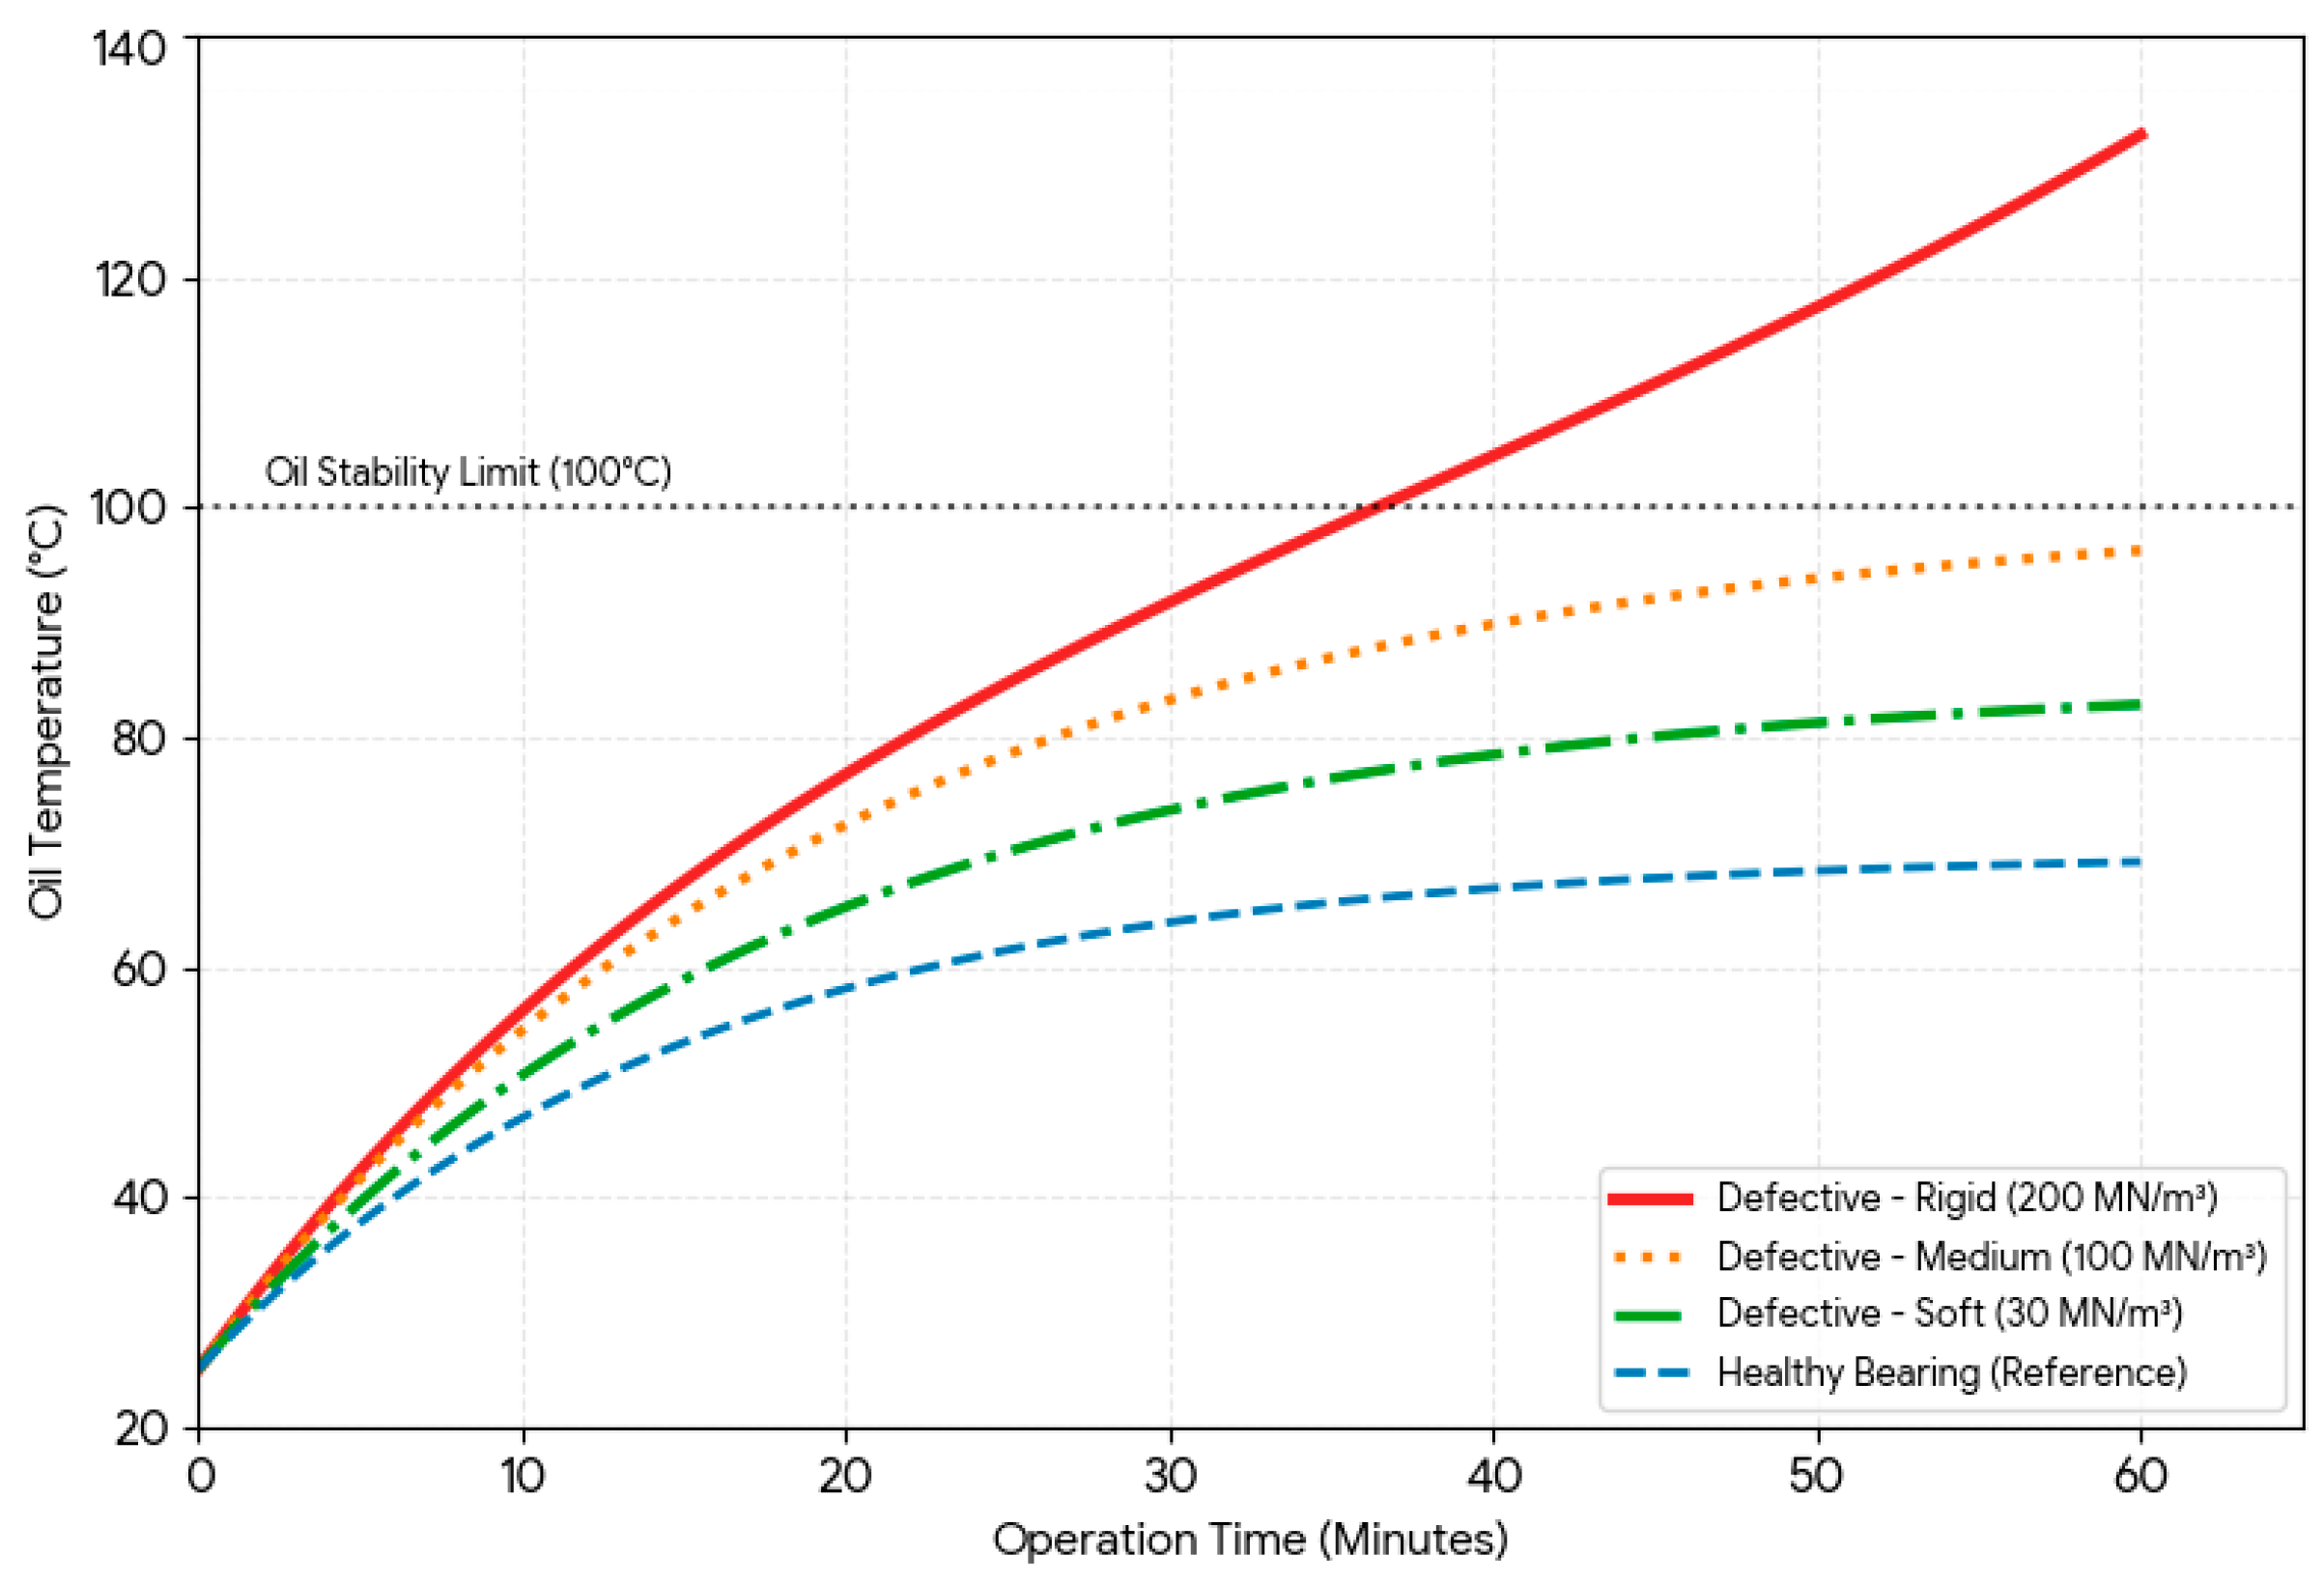
As the ground reaction modulus increases from 25 to 200 MN/m3, the vibration amplitude (dashed blue line) increases from a negligible level (~2 mm/s) to the critical value of 14.2 mm/s RMS. As a consequence, the oil temperature (solid red line) increases proportionally, from approximatively 50 °C to over 115 °C. Reaching this threshold is critical because, at this temperature—which far exceeds the alarm limits of 100 °C—most lubricants undergo a significant loss in viscosity. This leads to metal-on-metal contact within bearings, resulting in their rapid destruction. The graph in Figure 26 simulates the exponential rise in housing temperature until thermal equilibrium is reached; it demonstrates how a bearing defect pushes the system beyond the safety threshold. The blue line represents the normal operating state of the vibratory plate on medium terrain. If the bearing is undamaged, the temperature remains in the 65–75 °C range regardless of the soil category; this is because the lubrication film remains intact, preventing metal-on-metal friction at the excitation frequency of 505.7 Hz.
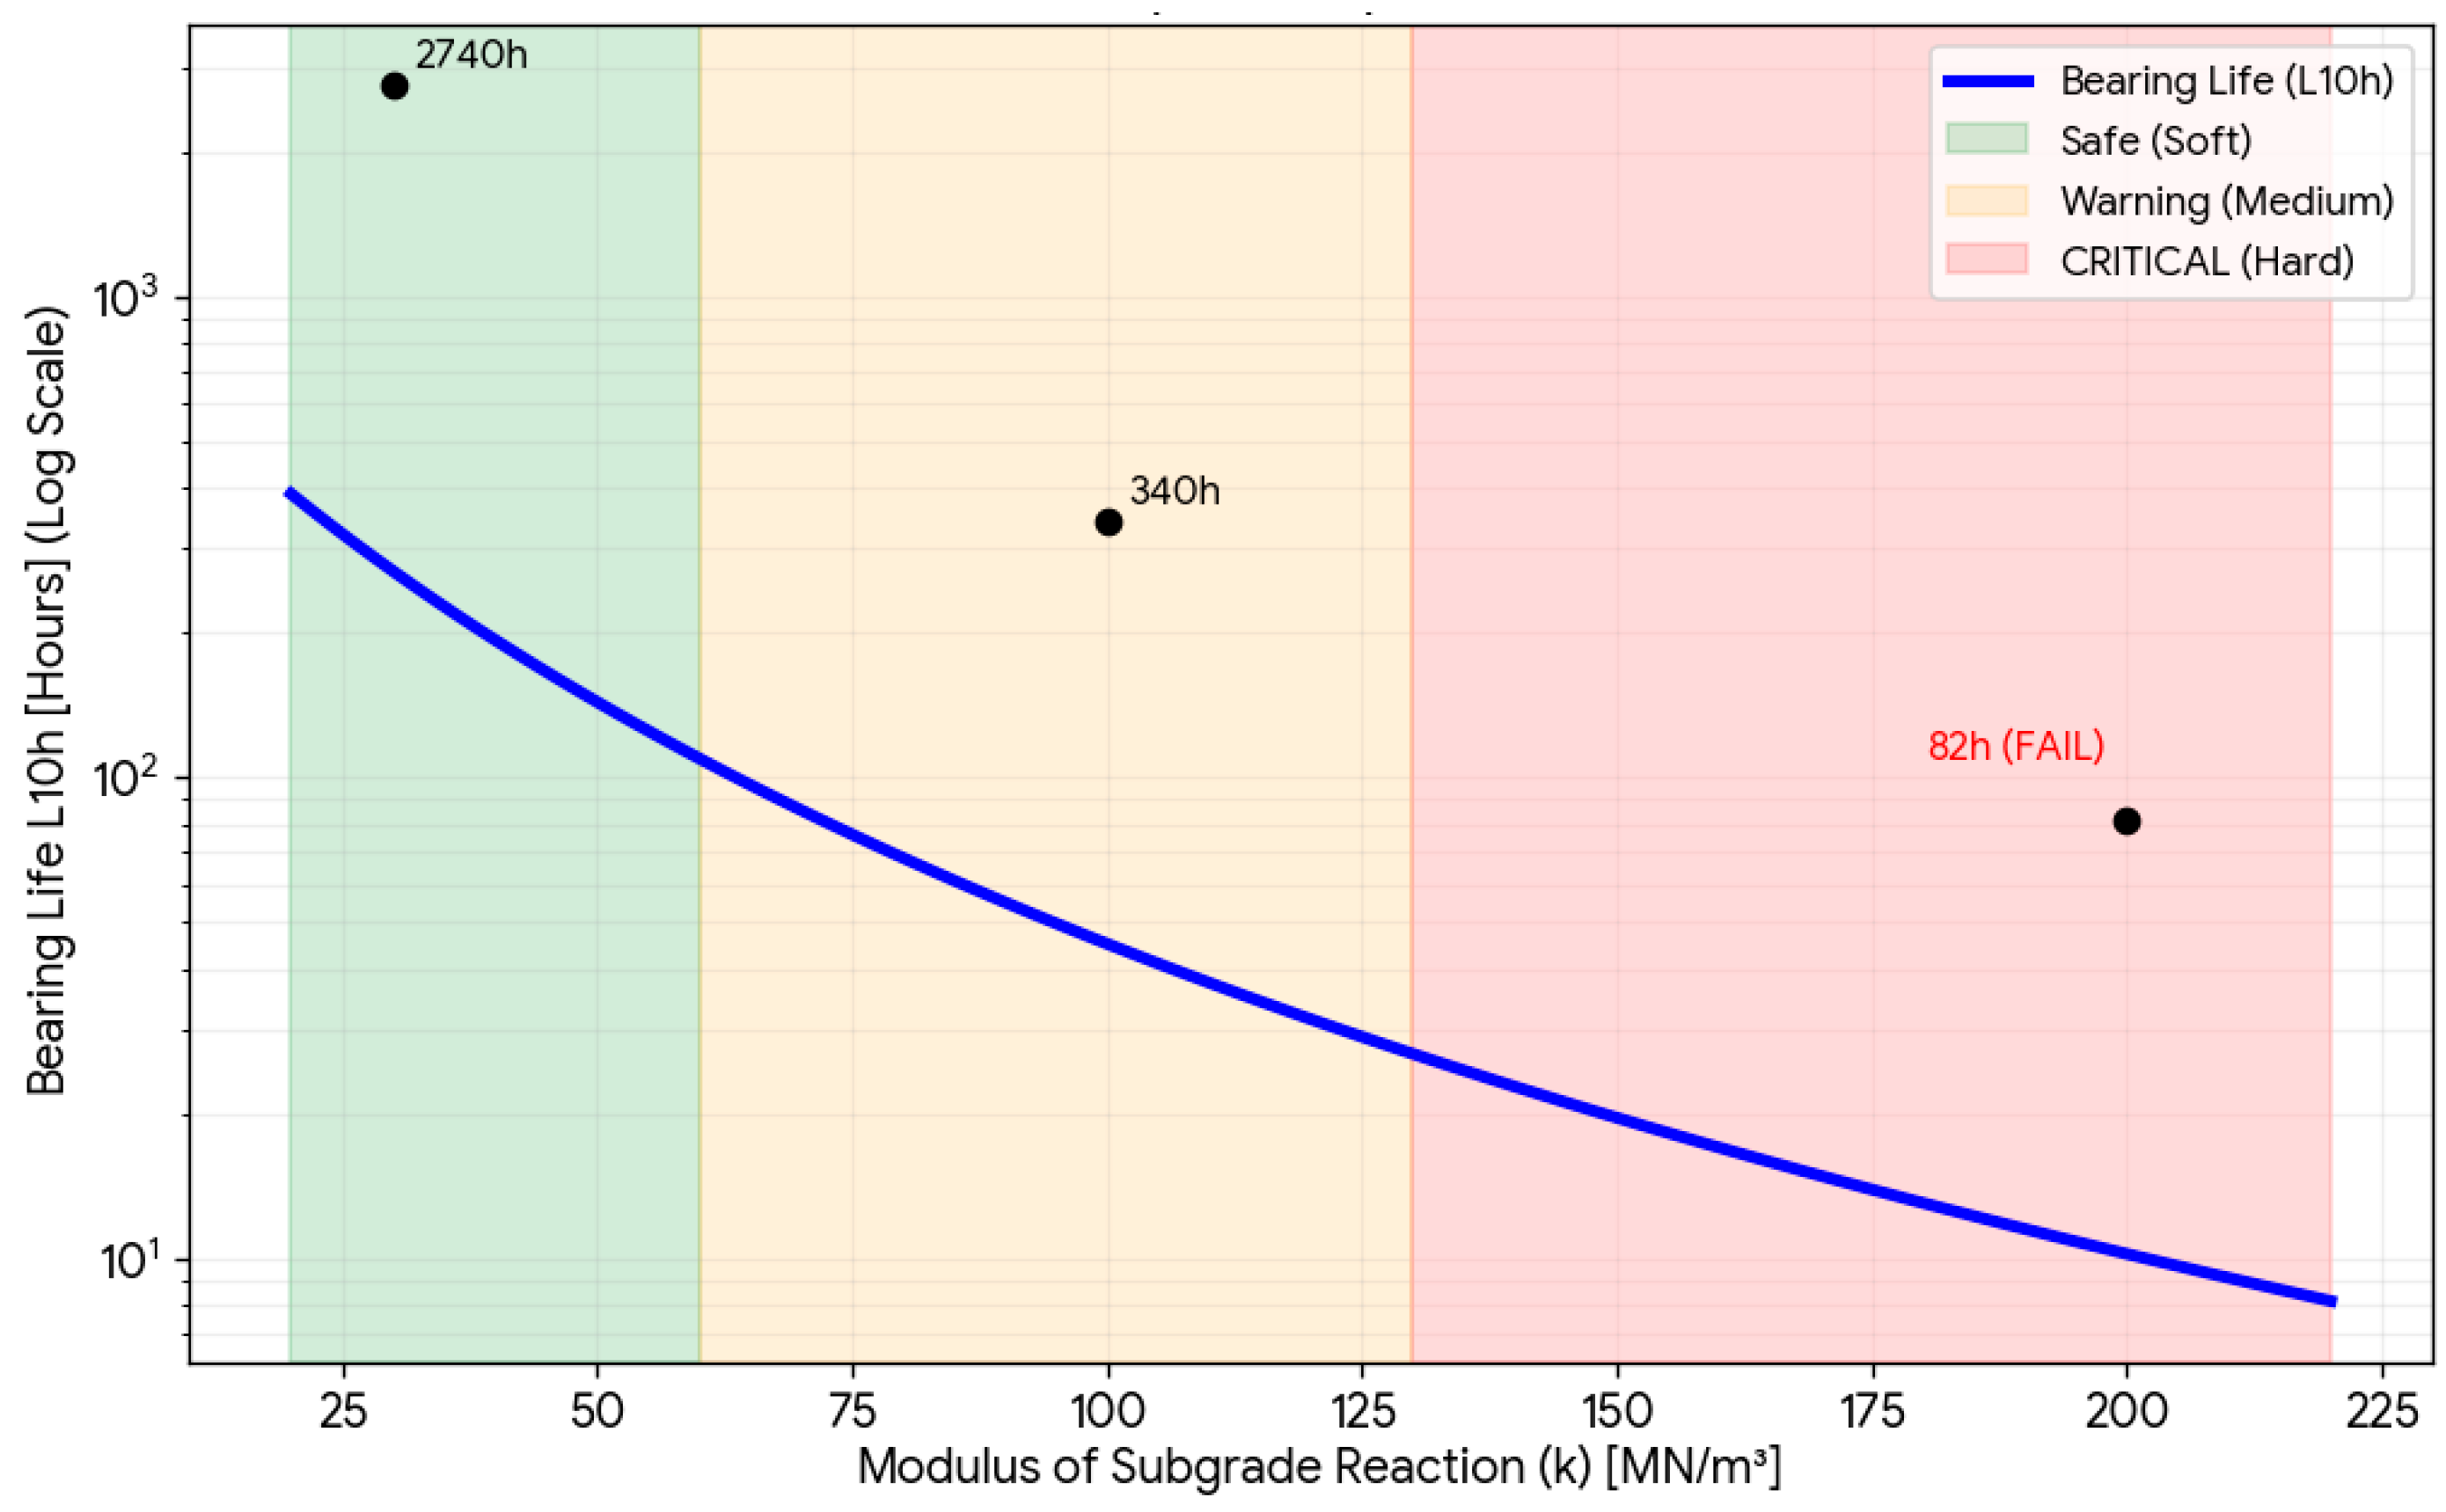
The nominal bearing life (L10h) for an SKF 6202-type bearing is calculated using the standard formula relating bearing load capacity to the applied load (as function of soil types) as follows:
L 10 h = C P p · 10 6 ,
where C is dynamic load rating (C = 20.3 kN); P is the applied load on the bearing, in N; and p is the exponent depending on the bearing type (p = 3 for ball bearings). The inclusion of an impact factor is mandatory when calculating the service life of a bearing within a vibratory plate compactor. In this case, the shock forces obtained through dynamic simulations already incorporate shock accelerations; therefore, these impact forces are considered to represent the actual “peak” load. For this reason, a distinct impact factor was not applied, as it is already embedded in the C force value. Table 5 outlines the results obtained regarding the operating conditions.
The representation in Figure 27 correlates the nominal service life (L10h) of the bearing with ground stiffness, highlighting the substantial decrease in reliability as soil rigidity increases. Under these conditions, excessive impact forces significantly accelerate fatigue failure, severely reducing the bearing’s calculated operational life.
It is observed that on hard terrain, the estimated bearing life is reduced by over 90% compared to standard operation; this is primarily due to the exponential relationship between load and fatigue life.

4. Discussion

4.1. Structural Defect Analysis: Drive Belt Slippage

In Figure 7, the instability of the acquired signals (rotational velocities) suggests the presence of residual vibrations or imperfections in the transmission system (possibly slight belt slippage). Next, the interaction with the hard ground transforms the compactor plate from a working element into a source of parasitic vibrations since the ground does not absorb energy (due to the lack of plastic deformation) and the reaction force is transmitted back through the casing directly to the drive system. Figure 13 shows a critical instability, where without PID, the angular velocity drops from 586 rad/s to below 480 rad/s during the plate’s impact with the hard. This leads to a speed loss of over 18% in just a few milliseconds. This occurs because variable resistance creates instantaneous load peaks that force the engine and transmission out of their operating range. Thus, a decrease in centrifugal force is also evident; at the moment of impact, the actual compaction force drops from 10,500 N to approximately 7000 N. Consequently, the compactor plate loses efficiency precisely when it is most needed—during soil impact. Furthermore, these sudden speed variations caused by the transmission belt slippage induce significantly high shear forces in the 6206 bearing, thereby accelerating raceway deterioration.
On the other hand, analyzing the waveform and frequency spectrum of the acquired or simulated signals provides information about both the intensity of the vibration regime and the disturbing sources. Thus, higher peaks in the Cepstrum signal (Figure 16) are indicative of stronger spectral peaks in the original signal, while the overall distribution of these peaks reveals the number and frequency of the harmonics present. Furthermore, the spectrograms in Figure 17 highlight that smoothly operating electric motors exhibit minimal vibrations, generating mainly low-amplitude, low-frequency noise from electromagnetic forces and air movement transmitted through the motor’s housing. However, the vibrator’s noisy operation features high-amplitude mechanical vibrations—including component resonance and air noise—which create loud, low-frequency vibrations. These are strongly transmitted to the surrounding environment and can interfere with the function of connected equipment, such as the transmission path. Numerous irregularities in the spectrogram’s 0–20 Hz frequency range throughout the signal’s duration indicate significant low-frequency noise or transient phenomena in the ratio of the two angular velocities. This suggests instability, sudden changes, or unpredictable behavior within that band. While these effects stem from mechanical vibrations, it is possible that another nonstationary source introduced energy at these low frequencies over time.
To visualize how the ratio of two angular velocities varies over a specific time, histograms are used with the bars representing the frequency of different ratio values within a given range (in this case, over 30 s). This histogram shows the spread, or distribution, of these ratio values to provide a better understanding of their typical behavior and variability during the observed period. In addition, the normalized cumulative histogram (Figure 18) represents the probability distribution of the ratio values, where the y-axis represents the cumulative probability of values less than or equal to the corresponding x-axis values and the y-axis values sum to 1.0, representing 100% of the data. The results indicate that small transmission ratio values have a minor impact on the system’s dynamic behavior, as interpreted from the normalized cumulative histogram. Normalization enhances the clarity of these histograms; their cumulative nature demonstrates that values in early bins (representing small transmission ratios) contribute little to the overall behavior, whereas the later bins show a more significant accumulation of data points. As is well known, covariance reflects the general trend of a linear relationship between variables. In this study, we assess the deviation from the average velocity ratio value by calculating an error covariance for the estimated ratio. This measure illustrates how errors in the individual components contribute to the overall uncertainty on the ratio’s mean, both quantitatively (in magnitude) and qualitatively (in sign). A comparative analysis of the signal and its Cepstrum reveals that the first five seconds correspond to the transient operating regime of the tested system. The combination of the raw signal, Cepstrum, and spectral analysis provides a comprehensive understanding of the system’s performance and potential faults. Spectral analysis helps pinpoint the specific frequencies and characteristics associated with these faults, enabling targeted troubleshooting and maintenance.

4.2. Mechanical Defect Evaluation: Bearing Degradation

The bearing signal presents a few prominent peaks at specific frequencies, corresponding to the rotational speed and its harmonics (Figure 20). The power spectral density (PSD) of the acceleration signals changes significantly when a bearing experiences wear. Specific indicators of wear include the appearance of high-frequency harmonics and distinct frequency peaks, which alter the overall shape and amplitude of the PSD. The PSD of the worm-bearing signal shows a more irregular, higher-magnitude curve with new frequency components; existing peaks are broadened or shifted due to the altered vibration characteristics caused by wear. Consequently, the PSD of a bearing with wear is expected to have a higher magnitude and a broader distribution across frequencies compared to the baseline signal (Figure 22). This occurs because wear introduces additional vibration components across various frequencies. A defective bearing can cause the vibration spectrum to show energy spikes in the high-frequency range (>200 Hz), as impacts from the fault excite structural resonances. This energy concentration is distributed across a wider range of frequencies, leading to higher overall noise and vibration levels compared to those of a healthy bearing.
Therefore, the persistence of this phenomenon indicates a risk of material fatigue in the transmission belt, as well as possible overheating of transmission components or oil. Excessive vibrations during the plate’s operation transform mechanical energy into thermal energy, predominantly through viscous friction and the imposition of dynamic loads on the bearings. Therefore, a high RMS level indicates rapid oscillations of the components within the oil film. These generate internal heat, leading to a 15–30% increase in temperature at the bearing contact area (Figure 25 and Figure 26) and a rapid transfer of heat to the oil bath. Once the temperature exceeds the optimal threshold (approximatively 100 °C), degradation is no longer linear but becomes exponential; consequently, a system designed to function for years could fail within a few weeks or even tens of hours (Figure 27).

5. Conclusions

The paper details the use of vibration signal exploration methods to pinpoint the sources of operational disturbances in actively vibrating machinery. An advanced vibration analysis indicates the operating condition of mechanical transmission embedded in a vibrating plate compactor while working on different types of soil, providing a precise diagnosis that transforms reactive maintenance into predictive maintenance.
This paper is distinguished by its focus on “real-world” operating conditions, moving away from idealized theoretical models. A summary of the differences, the gaps filled, and the innovative elements is presented below. While most studies isolate variables—either by analyzing a single defect or modeling plate–soil interaction using machines in perfect condition—this paper analyzes the synergy of multiple defects. Specifically, it examines the simultaneous impact of a transmission defect (belt slippage) and a structural one (bearing failure). This addresses a significant gap in the field, as construction site defects rarely occur in isolation. Furthermore, while many existing models treat soil as a material with constant characteristics, this study accounts for its variability by considering three distinct soil types (soft, medium, or hard). This approach highlights how soil stiffness amplifies the vibration signatures of mechanical defects. The literature is often limited to frequency domain analysis using the FFT technique. In contrast, this paper employs a triangulation of analytical methods:
STFT to identify specific fault frequencies for the nonstationary signals represented by the belt angular velocity variations.
PSD to quantify the energy of random vibrations caused by bearing wear.
Stochastic analysis to manage the uncertainty and nonlinear behavior of the machine–soil interaction and belt slippage.
Collectively, these methods provide precise information regarding machine health with practical value for predictive maintenance. This research constitutes a useful foundation for developing a diagnostic guide for plate compactors during operation, enabling a clear distinction between vibration changes caused by soil compaction (a normal phenomenon) and those caused by imminent failure (a critical phenomenon).
Precise frequency control is essential to prevent structural overloading, as a ±3% variation in the operating frequency results in a ±6% change in impact energy. In the case of the compaction plate, keeping the angular velocity ripple below 2% is vital because large fluctuations create torsional stress on the drive system shaft and accelerate bearing fatigue. Controlling engine speed under variable load—as a result of the continuous change in ground stiffness (when moving from soft to hard ground)—is imperative by implementing a PID system which corrects the decrease in speed and returns the engine to its nominal reference value. In addition, the repetitive impacts of bearing wear create vibrations at specific characteristic frequencies within a higher range—such as 300–600 Hz in this case. These vibrations are symptoms of a developing fault that condition monitoring systems can detect for predictive maintenance. However, because these frequencies have a much lower amplitude than the primary operating vibrations, they do not immediately interfere with the machine’s main function. Also, the results indicate that the vibratory plate compactor achieves maximum compaction efficiency in medium soil by operating in a system resonance state. Maintaining frequency synchronization with the natural frequency of the soil structure system mitigates nonlinear chaotic oscillations and intermittent plate–soil decoupling—phenomena associated with hard soil that induce severe structural fatigue and mechanical failure. It was highlighted that high RMS levels trigger internal heating within the oil film, causing bearing contact temperatures to rise by 15–30%. Consequently, component degradation shifts from linear to exponential once temperatures exceed the 100 °C threshold, reducing years of expected service life to mere hours.
The proposed approach enables the extraction of characteristic frequency components from a vibratory machine, offering an effective methodology for initiating component failure analysis. The originality of these findings lies in two aspects: the application of a single-stage time–frequency analysis supplemented by a multiple evaluation process based on progressively refined results, with the role of identifying the state of operation of the technological equipment. Future research will develop in two directions:
(a)
Expanding the area of vibratory mechanical equipment evaluation to further validate their capabilities.
(b)
Enhancing data processing performance, specifically in analyzing and translating results into feasible practical conclusions.


Funding

This research received no external funding.

Institutional Review Board Statement

Not applicable.

Informed Consent Statement

Not applicable.

Data Availability Statement

Data are contained within the article.

Acknowledgments

We would like to extend our heartfelt thanks to our colleagues from the research center MECMET UGAL from Romania for their invaluable collaboration and support, providing us with the necessary equipment, materials, and their expertise.

Conflicts of Interest

The author declares no conflicts of interest.

References

  1. Chen, L.; Qiao, L.; Li, Q. Study on dynamic compaction characteristics of gravelly soils with crushing effect. Soil Dyn. Earthq. Eng. 2019, 120, 158–169. [Google Scholar] [CrossRef] [Scilit]
  2. Tiboni, M.; Remino, C.; Bussola, R.; Amici, C. A review on vibration-based condition monitoring of rotating machinery. Appl. Sci. 2022, 12, 972. [Google Scholar] [CrossRef] [Scilit]
  3. Buraga, A.; Debeleac, C. Experimental Investigations and Numerical Simulations of Vibratory Compaction of Weakly Cohesive Soils. Rom. J. Acoust. Vib. 2022, 19, 143–148. [Google Scholar]
  4. Bouchikhi, E.H.; Choqueuse, V.; Benbouzid, M.E.H.; Charpentier, J.F.; Barakat, G. A comparative study of time-frequency representations for fault detection in wind turbine. In Proceedings of the IECON 2011–37th Annual Conference of the IEEE Industrial Electronics Society, Melbourne, VIC, Australia, 7–10 November 2011; pp. 3584–3589. [Google Scholar]
  5. Raad, H.A.; Mohsen, K.A. Diagnostic of pulley-belt system faults using vibration analysis technique. J. Univ. Babylon Eng. Sci. 2018, 26, 167–180. [Google Scholar]
  6. Dąbek, P.; Wroblewski, A.; Wodecki, J.; Bortnowski, P.; Ozdoba, M.; Król, R.; Zimroz, R. Application of the methods of monitoring and detecting the belt mistracking in laboratory conditions. Appl. Sci. 2023, 13, 2111. [Google Scholar] [CrossRef] [Scilit]
  7. Converse, F. Soil compaction by vibration. Eng. Sci. 1952, 15, 12–14. [Google Scholar]
  8. Morariu-Gligor, R.M.; Crişan, A.V.; Şerdean, F.M. Optimal design of an one-way plate compactor. Acta Tech. Napoc.-Ser. Appl. Math. Mech. Eng. 2017, 60, 557–564. [Google Scholar]
  9. Debeleac, C.N.; Buraga, A.; Nastac, S.M. Experimental and numerical study in dynamic compaction of weakly-cohesive soils. Appl. Sci. 2024, 14, 10129. [Google Scholar] [CrossRef] [Scilit]
  10. Abrate, S. Vibrations of belts and belt drives. Mech. Mach. Theory 1992, 27, 645–659. [Google Scholar] [CrossRef] [Scilit]
  11. Čepon, G.; Boltežar, M. Dynamics of a belt-drive system using a linear complementarity problem for the belt–pulley contact description. J. Sound Vib. 2009, 319, 1019–1035. [Google Scholar] [CrossRef] [Scilit]
  12. Mascenik, J.; Coranic, T. The influence of changing belt loading conditions on the operational condition of the belt transmission. Actuators 2024, 13, 506. [Google Scholar] [CrossRef] [Scilit]
  13. Zhu, H.; Zhu, W.D.; Fan, W. Dynamic modeling, simulation and experiment of power transmission belt drives: A systematic review. J. Sound Vib. 2021, 491, 115759. [Google Scholar] [CrossRef] [Scilit]
  14. Hou, Z.; Zu, J.W. Non-linear free oscillations of moving viscoelastic belts. Mech. Mach. Theory 2002, 37, 925–940. [Google Scholar] [CrossRef] [Scilit]
  15. Ghayesh, M.H.; Moradian, N. Nonlinear dynamic response of axially moving, stretched viscoelastic strings. Arch. Appl. Mech. 2011, 81, 781–799. [Google Scholar] [CrossRef] [Scilit]
  16. Parker, R.G.; Lin, Y. Parametric instability of axially moving media subjected to multifrequency tension and speed fluctuations. ASME J. Appl. Mech. 2001, 68, 49–57. [Google Scholar] [CrossRef] [Scilit]
  17. Pellicano, F.; Fregolent, A.; Bertuzzi, A.; Vestroni, F. Primary and parametric non-linear resonances of a power transmission belt: Experimental and theoretical analysis. J. Sound Vib. 2001, 244, 669–684. [Google Scholar] [CrossRef] [Scilit]
  18. Mote, C.D.; Wu, W.Z. Vibration coupling in continous belt and band systems. J. Sound Vib. 1985, 102, 1–9. [Google Scholar] [CrossRef] [Scilit]
  19. Bortnowski, P.; Gładysiewicz, L.; Król, R.; Ozdoba, M. Models of transverse vibration in conveyor belt—Investigation and analysis. Energies 2021, 14, 4153. [Google Scholar] [CrossRef] [Scilit]
  20. Shi, Y.; Zhao, T.; Ning, K.; Tang, W. Simulation analysis and experimental study on high frequency friction noise of vehicle V-ribbed belts. Meas. Control 2020, 53, 2063–2069. [Google Scholar] [CrossRef] [Scilit]
  21. Kot, A.; Łatas, W. Experimental and theoretical investigation of CVT rubber belt vibrations. Open Eng. 2021, 11, 1196–1206. [Google Scholar] [CrossRef] [Scilit]
  22. Shangguan, W.B.; Feng, X.; Lin, H.; Yang, J. A calculation method for natural frequencies and transverse vibration of a belt span in accessory drive systems. Proc. Inst. Mech. Eng. Part C J. Mech. Eng. Sci. 2013, 227, 2268–2279. [Google Scholar] [CrossRef] [Scilit]
  23. Kong, L.; Parker, R.G. Steady state mechanics of belt-pulley systems. ASME J. Appl. Mech. 2005, 72, 25–34. [Google Scholar] [CrossRef] [Scilit]
  24. Choudhury, A.; Tandon, N. Vibration Response of Rolling Element Bearings in a Rotor Bearing System to a Local Defect Under Radial Load. ASME J. Tribol. 2006, 128, 252–261. [Google Scholar] [CrossRef] [Scilit]
  25. Akram, M.A.; Khushnood, S.; Tariq, S.L.; Ali, H.M.; Nizam, L.A. Vibration Based Gear Fault Diagnosis under Empirical Mode Decomposition and Power Spectrum Density Analysis. Adv. Sci. Technol. Res. J. 2019, 13, 192–200. [Google Scholar] [CrossRef] [Scilit]
  26. Magadán, L.; Ruiz-Cárcel, C.; Granda, J.C.; Suárez, F.J.; Starr, A. Explainable and interpretable bearing fault classification and diagnosis under limited data. Adv. Eng. Inform. 2024, 62, 102909. [Google Scholar] [CrossRef] [Scilit]
  27. Santer, P.; Reinhard, J.; Schindler, A.; Graichen, K. Detection of localized bearing faults in PMSMs by means of envelope analysis and wavelet packet transform using motor speed and current signals. Mechatronics 2025, 106, 103294. [Google Scholar] [CrossRef] [Scilit]
  28. Randall, R.B. A history of cepstrum analysis and its application to mechanical problems. Mech. Syst. Signal Process. 2017, 97, 3–19. [Google Scholar] [CrossRef] [Scilit]
  29. Lu, R.; Antoni, J.; Randall, R.B.; Borghesani, P.; Smith, W.A.; Peng, Z. Cepstral operational modal analysis for multiple-input systems based on the real cyclic cepstrum. Mech. Syst. Signal Process. 2024, 218, 111578. [Google Scholar] [CrossRef] [Scilit]
  30. Sulaiman, A.B.R.; Abed, S.T. Matlab-Based design and implementation of time-frequency analyzer. Al-Rafidain Eng. 2007, 15, 60–72. [Google Scholar]
  31. Randall, R.B. A survey of the application of the cepstrum to structural modal analysis. Mech. Syst. Signal Process. 2019, 118, 1–42. [Google Scholar] [CrossRef] [Scilit]
  32. Bull, D.R.; Zhang, F. Chapter 3—Signal processing and information theory fundamentals. In Intelligent Image and Video Compression, 2nd ed; Bull, R.D., Zhang, F., Eds.; Academic Press: London, UK, 2021; pp. 59–105. [Google Scholar]
  33. Frankovský, P.; Hroncová, D.; Delyová, I.; Virgala, I. Modeling of dynamic systems in simulation environment MATLAB/Simulink—SimMechanics. Am. J. Mech. Eng. 2013, 1, 282–288. [Google Scholar]
  34. Leghmizi, S.; Boumediene, L. Modeling and control of mechanical systems in Simulink of Matlab. In Applications of MATLAB in Science and Engineering; IntechOpen: London, UK, 2011. [Google Scholar]
  35. Bratu, P.; Drăgan, N.; Dobrescu, C. Dynamic Performances of Technological Vibrating Machines. Symmetry 2022, 14, 539. [Google Scholar] [CrossRef] [Scilit]
  36. GB/T 11544-2012; Belt Drives—Classical and Narrow V-Belts—Dimensions (System Based on Datum Width). Pulleys and Belts: Beijing, China, 2012.
  37. Hamill, T. Interpretation of rank histograms for verifying ensemble forecasts. Mon. Weather Rev. 2000, 129, 550–560. [Google Scholar] [CrossRef] [Scilit]
  38. Kátai, L.; Szendrő, P.; Gárdonyi, P. The power transmission stability and efficiency of V-belts. Prog. Agric. Eng. Sci. 2016, 12, 25–49. [Google Scholar] [CrossRef] [Scilit]
  39. Debeleac, C.; Simionescu, C.; Năstac, S. Functional assessments of dynamics of the vibratory-driven equipments with belt transmissions. Appl. Mech. Mater. 2014, 657, 460–464. [Google Scholar] [CrossRef] [Scilit]

  40. ISO 20816-3:2022; Mechanical Vibration—Measurement and Evaluation of Machine Vibration—Part 3: Industrial Machines with a Power Rating Above 15 kW and Operating Speeds Between 120 r/min and 30 000 r/min. International Organization for Standardization (ISO): Geneva, Switzerland, 2022.
Figure 1. Effect of vibrator frequency on the vertical displacement of the plate compactor [7]: (a) vibration amplitude as a function of frequency; (b) normalized vibration amplitude and centrifugal force.
Applsci 16 04517 g001
Figure 2. Schematic diagram of a two-pulley belt transmission.
Applsci 16 04517 g002
Figure 3. Signal processing workflow for mechanical fault diagnosis.
Applsci 16 04517 g003
Figure 4. Vibratory plate compactor—Masalta MS 60-2: 1. Base plate; 2. vibratory device; 3. engine; 4. transmission device; 5. handle.
Applsci 16 04517 g004
Figure 5. The transmission system elements of the vibratory plate compactor.
Applsci 16 04517 g005
Figure 6. The experimental setup: (a) laboratory stand for studying the dynamics of a vibrating mechanical system with belt transmission; (b) overall view of the data acquisition system and computer with data management application.
Applsci 16 04517 g006
Figure 7. Timed evolution and spectral composition of the experimental acquired angular velocity signals at the motor shaft (a) and the vibrator input (b).
Applsci 16 04517 g007
Figure 8. Block diagram of the signal processing techniques.
Applsci 16 04517 g008
Figure 9. Dynamic model for the study of plate compactor–soil interaction.
Applsci 16 04517 g009
Figure 10. Vibration amplitude response relative to natural frequency variation.
Applsci 16 04517 g010
Figure 11. Soil reaction force (Fs) vs. frequency to different ground categories.
Applsci 16 04517 g011
Figure 12. Risk of bearing degradation versus impact acceleration.
Applsci 16 04517 g012
Figure 13. Uncontrolled angular velocity evolution during plate compactor operation on hard soil.
Applsci 16 04517 g013
Figure 14. Matlab/SimMechanics workflow of the belt-driven vibratory equipment model.
Applsci 16 04517 g014
Figure 15. Simulation results of the belt drive: (a) angular velocity vs. time; (b) frequency spectrum.
Applsci 16 04517 g015
Figure 16. Cepstrum analysis of the angular velocity ratio derived from experimental data.
Applsci 16 04517 g016
Figure 17. STFT diagram of the ratio between the two signals.
Applsci 16 04517 g017
Figure 18. Stochastic distribution of the angular velocity ratio: (a) signal error and covariance; (b) normalized cumulative histogram.
Applsci 16 04517 g018
Figure 19. Time domain acceleration signal of the 6206 bearing under fault conditions.

Applsci 16 04517 g019
Figure 20. Acceleration frequency spectrum of a 6206 bearing under fault conditions.

Applsci 16 04517 g020
Figure 21. Acceleration of the vibratory plate operating on rigid soil under bearing fault conditions.
Applsci 16 04517 g021
Figure 22. Comparative PSD of acceleration signals for the two operating regimes: new vibratory plate versus worn bearing (logarithmic scale).
Applsci 16 04517 g022
Figure 23. RMS vibration level across different soil types mapped to ISO 20816 severity zones.
Applsci 16 04517 g023
Figure 24. Structural resonance of the vibratory plate: housing response to bearing fault.
Applsci 16 04517 g024
Figure 25. Correlation between soil characteristics, vibration intensity, and thermal loading stress.
Applsci 16 04517 g025
Figure 26. The influence between soil type, bearing wear, and oil temperature.
Applsci 16 04517 g026
Figure 27. Bearing life (L10h) expectancy in function by soil category.
Applsci 16 04517 g027
Table 1. Technical specifications for the MS 60-2 forward plate compactor.
NoParameterValueU.M.
1Engine power3.6kW
2Mass62kg
3Centrifugal force10.5kN
4Frequency93.3Hz
5Rotational speed5600rpm
6Travel speed40cm/s
7Efficiency450m2/h
8Plate size L × W50 × 36cm
9Dimension108 × 40 × 80cm
Table 2. Operational parameters of the stand.
NoParameterValueU.M.
1Torque at the drive wheel axle (M)4Nm
2Angular velocity of the driving wheel (ω1)70 rad/s
3Permissible longitudinal tension in the belt (EA)100kN
4Belt pretensioning (F0)100N
5Drive wheel radius (R1)0.15m
6Driven wheel radius (R2)0.05m
7Belt length (L)0.6m
8Belt stiffness (k)7 × 10⁶N/m2
9Ball diameter (Bd) 9.525mm
10Pitch diameter (Pd)46.5mm
11Number of balls (n)9-
12Contact angle (β)20degree
Table 3. Geotechnical data for soil identification.
Terrain CategoryModulus of Subgrade
Reaction, k [MN/m3]
Soil Rigidity,
ks [MN/m]
Soil
Damping,
c s [MNs/m]
Young’s Modulus,
Es [MPa]
Soft (loose sand or soft clay)305.40.01511–15
Medium (compacted ballast, dense sand)100180.01336–45
Hard (base course, weathered rock)200360.01072–90
Table 4. Dynamic characteristics of the three soil types.
ParameterSoft Soil Medium SoilHard Soil
Modulus of subgrade reaction (k)30 MN/m3100 MN/m3200 MN/m3
Soil rigidity (ks)5.4 MN/m18 MN/m36 MN/m
Natural frequency (fn)47 Hz85.8 Hz121.3 Hz
Frequency ratio (f/fn) 1.981.080.77
Vibration acceleration ( z ¨ s )2 g8 g17.26 g
Table 5. Comparative lifecycle estimation (L10h) of bearing for plate operating on different soils.
Terrain CategoryAverage Equivalent Load (P) L10h Operational Status
Soft soil4.5 kN2740 hNormal life
Medium soil9.0 kN340 hAccelerated wear
Hard soil14.5 kN82 hCritical failure risk
Disclaimer/Publisher’s Note: The statements, opinions and data contained in all publications are solely those of the individual author(s) and contributor(s) and not of MDPI and/or the editor(s). MDPI and/or the editor(s) disclaim responsibility for any injury to people or property resulting from any ideas, methods, instructions or products referred to in the content.